

Crypto World
The $1,668 line for 2026
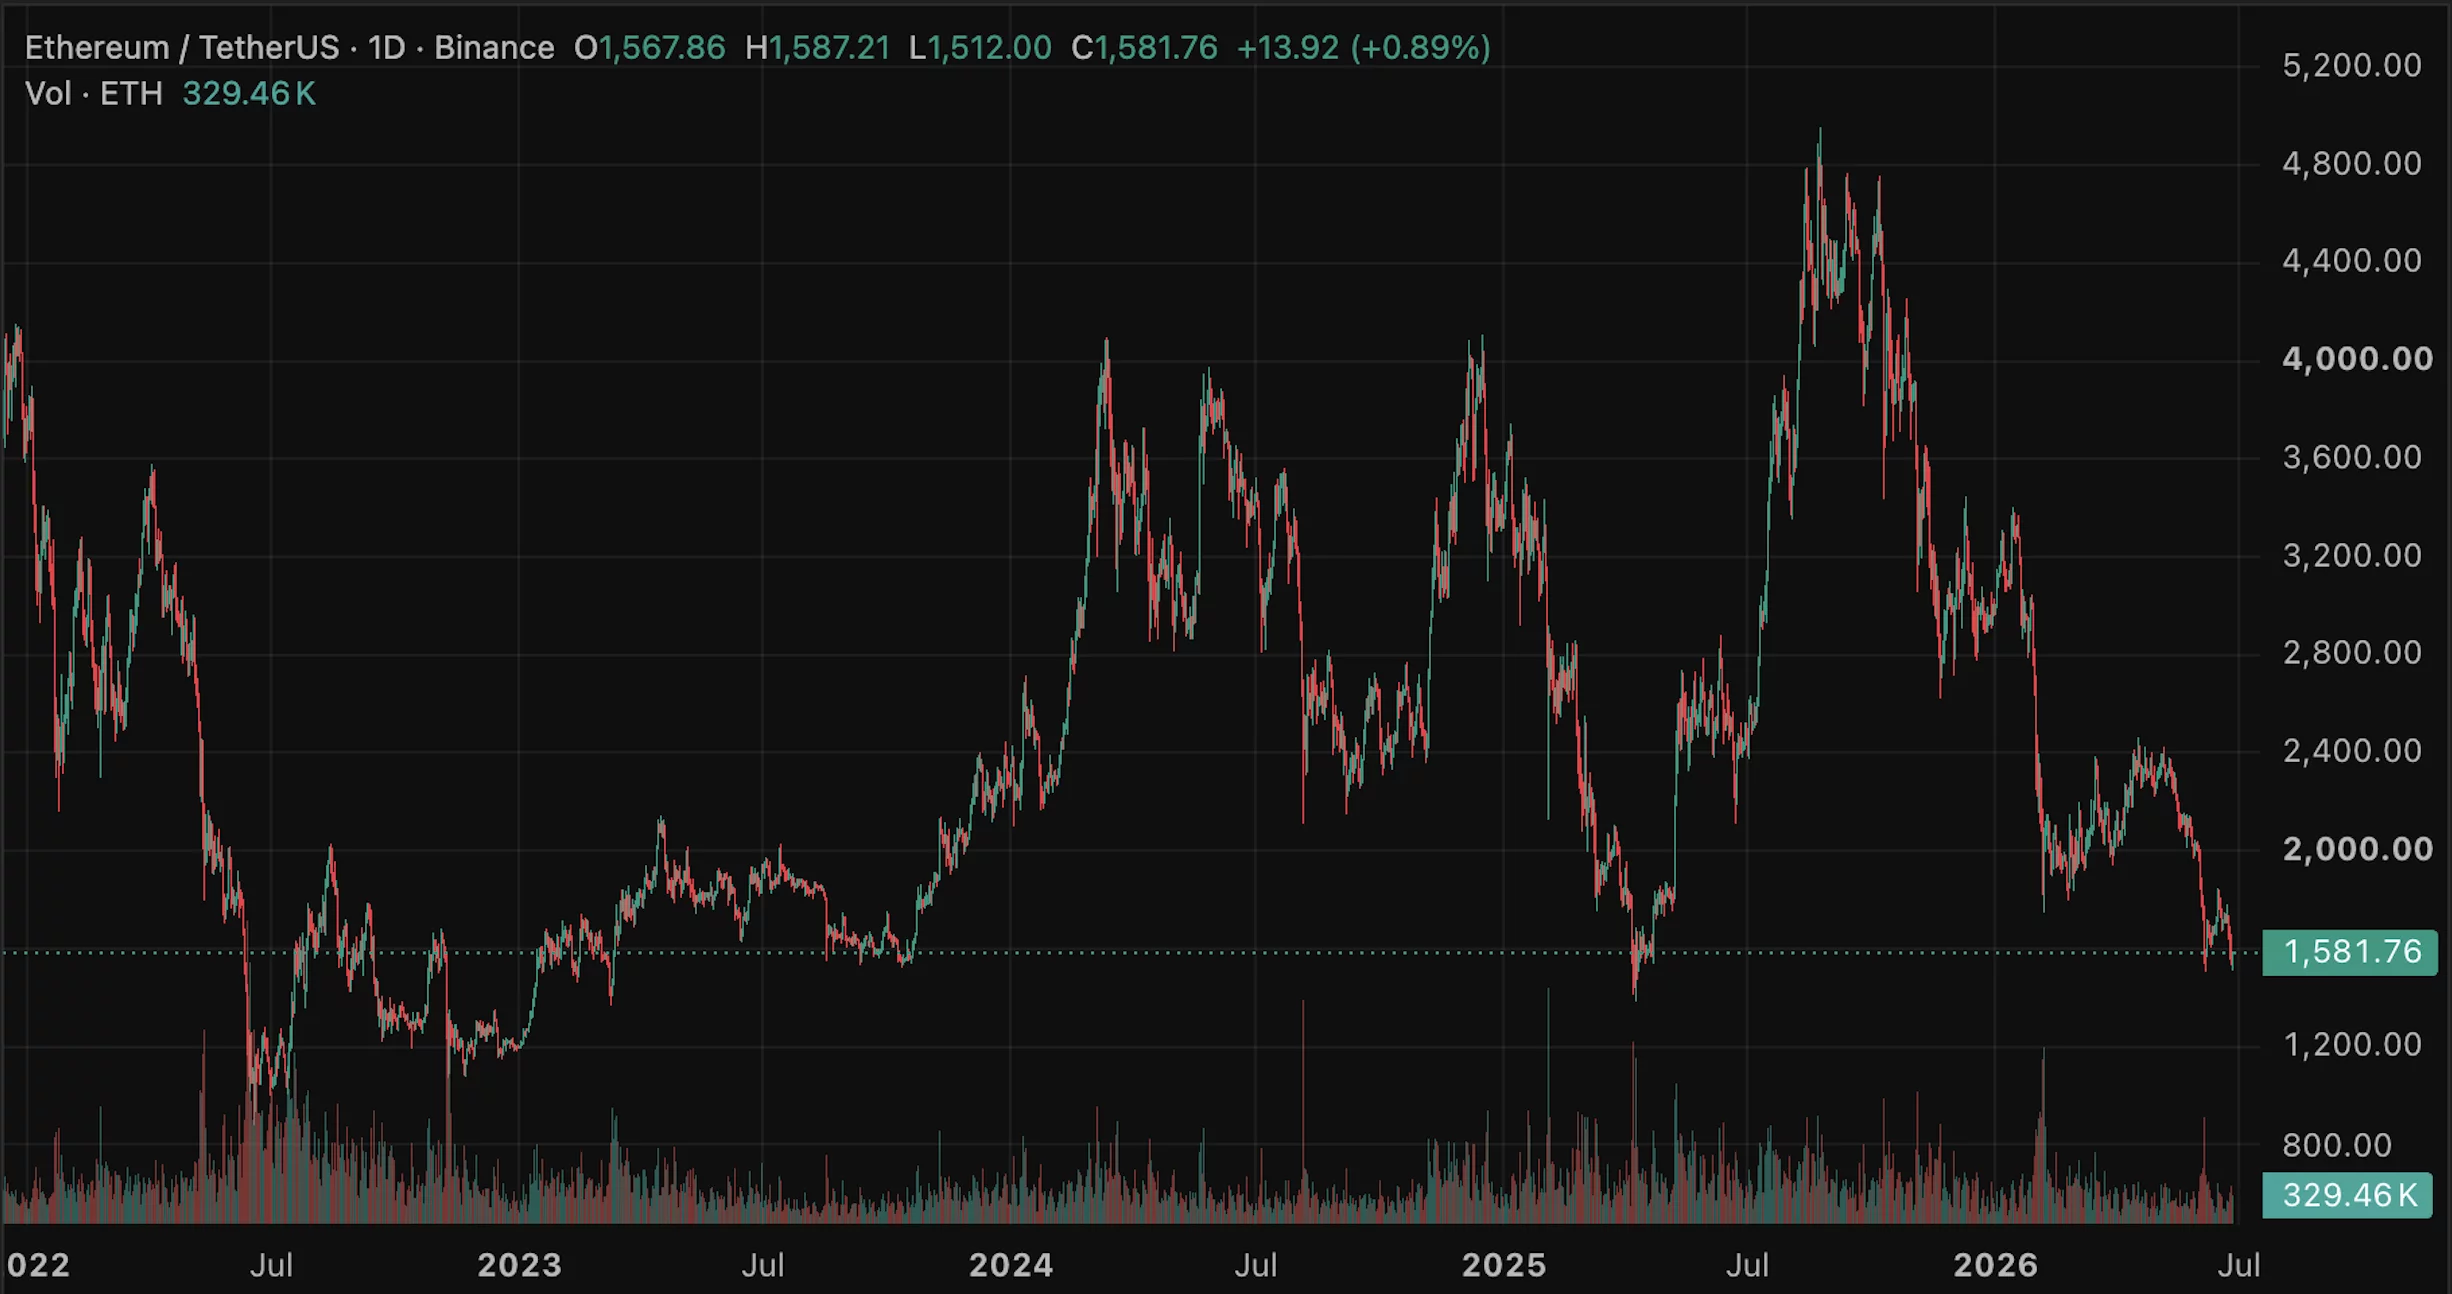
Ethereum trades around its 200-day moving average near $1,668, the line that has separated its bull markets from its bear markets for years. Above it lies a path back toward $3,000. Below it lies an accumulation zone, the charts put as low as $600. The strangest part is that Ethereum’s fundamentals have never been stronger.
Summary
- Ethereum trades around $1,650, hovering at its 200-day moving average near $1,668, a level that has historically divided its bull markets from its bear markets.
- The price is roughly 55-65% below its $4,953 August 2025 all-time high, in a year-long downtrend, even as Ethereum’s fundamentals reach record highs.
- About 35.8 million ETH, near 30% of supply, is staked, spot ETFs have drawn around $11.6 billion in cumulative inflows, and corporate treasuries hold over 6.2 million ETH, yet none of it has lifted the price.
- The $1,668 line is the pivot: holding above it keeps a recovery toward $2,300 to $3,000 alive, while losing the $1,580 to $1,600 floor opens a path toward a deep $1,039 to $603 accumulation zone.
- The catalyst that could flip the line is the Glamsterdam upgrade and a reversal in ETF and treasury flows, but until the macro tide turns, the strongest fundamentals in Ethereum’s history have not been enough.
Ethereum is trading around $1,650, which places it almost exactly on the one line that, more than any other, has historically decided whether it is in a bull market or a bear market: its 200-day moving average, currently near $1,668.
For years, this long-term trend line has acted as the dividing line for Ethereum, with sustained periods above it coinciding with recoveries and rallies, and breaks below it preceding extended downtrends.
Right now, Ethereum sits on the knife’s edge of that line, and the direction it breaks will go a long way toward determining its path through the rest of 2026. What makes the moment genuinely strange, and what separates this prediction from a simple chart reading, is the backdrop against which the line is being tested.
Ethereum’s price is down roughly 55-65% from its all-time high near $4,950 set in August 2025, and it has spent the better part of a year grinding lower, yet by almost every fundamental measure, the network has never been in better shape.
More ether is staked than ever, more institutional money has flowed into Ethereum products than ever, and corporate treasuries are accumulating it at a scale that did not exist a year ago. The result is one of the sharpest contrasts in the market: the strongest fundamentals in Ethereum’s history paired with some of its weakest price action since 2022.
This piece is organized around that contrast and around the line that sits at its center. The reason to build an Ethereum prediction this way, rather than as a list of targets, is that Ethereum’s situation is fundamentally a question about whether fundamentals will eventually matter, and the 200-day moving average is where that question gets answered in real time.
If Ethereum holds the line and reclaims the levels above it, the case that its record fundamentals will reassert themselves gains force, and a path back toward $3,000 opens. If it loses the floor beneath the line, the chart points toward a deep accumulation zone far below, and the fundamentals will have failed, for now, to matter.
What follows traces how Ethereum reached this point, why the $1,668 line carries so much weight, the genuinely record-setting fundamentals on one side of the ledger, the bearish forces that have overwhelmed them on the other, the catalysts that could tip the balance, and concrete bull, base, and bear scenarios tied to the line itself.
One line, two futures
Begin with why a single moving average deserves to anchor an entire prediction, because for Ethereum, the 200-day moving average has earned its significance. A moving average is simply the average price over a trailing period, in this case 200 days, and it smooths out short-term noise to reveal the underlying trend.
For Ethereum, the 200-day line has historically functioned as the boundary between bull and bear regimes: when the price trades and holds above it, Ethereum has tended to be in recovery or rally mode, and when it breaks decisively below it, extended downtrends have usually followed. That history is why traders treat this level with such respect, and why Ethereum, sitting right on it, near $1,668, is such a charged situation. The price is balanced precisely at the line that separates its two possible futures.
The levels around the line sharpen the stakes. Immediately below the current price, the $1,600-$1,650 area has held as the floor for 2026, the zone buyers have repeatedly defended, and a brief dip toward $1,580 during the June selloff was bought back. Above, the first resistance sits in the $1,700-$1,800 range, with a more significant barrier near $2,000 and the major structural hurdle at $3,000, where Ethereum would reclaim its long-term trend.
The asymmetry that worries bears is what lies beneath the floor. Technical analysts who map the downside warn that a decisive break below the $1,580 area and the broader monthly support could open a much deeper decline toward an accumulation zone they place between roughly $1,600, a drop of another 30-60% from current levels.

So the line is not merely a number; it is the hinge between a recovery path toward $3,000 and an abyss toward $600, which is what makes holding or losing it the central question for Ethereum in 2026.
How ETH got here
To understand why Ethereum is testing this line at all, you have to trace the decline from its peak, because the fall has been long and grinding rather than a single crash. Ethereum reached its all-time high near $4,950 in August 2025, lifted by enthusiasm around its newly launched exchange-traded funds and growing staking participation.
From that peak, the descent was relentless, with Ethereum closing out a long streak of red months, its worst such run in years, and sliding through the second half of 2025 and into 2026.
By early 2026, it had fallen below $3,000, and the weakness continued through the spring, with the price working steadily lower in a descending channel of lower highs and lower lows that defined the year.
The June selloff that brought Ethereum to its current levels near $1,600 was the latest leg of this extended downtrend, not a sudden break from an otherwise healthy trend.
The causes were a convergence of pressures rather than any single shock. Broader risk-off sentiment across crypto, driven by macroeconomic uncertainty and concerns about the path of interest rates, weighed on Ethereum as a high-risk asset. Persistent outflows from spot Ethereum exchange-traded funds removed a key source of demand and, during the worst stretches, became active selling pressure.
Selling attributed to Ethereum’s own co-founder added to the bearish narrative. And Ethereum’s tendency to amplify Bitcoin’s moves meant that as Bitcoin slid toward $60,000, Ethereum fell harder, because it typically rises faster in bull conditions and declines more sharply in risk-off periods.
The cumulative effect was a year-long erosion that has left Ethereum testing the line that separates recovery from a deeper bear market, with the price having given back the majority of its gains from the prior cycle. That is the chart context. The fundamental context, remarkably, points the other way.
Why $1,668 matters so much
It is worth dwelling on the significance of the line itself, because the entire technical case for Ethereum hinges on it, and the reasoning is not arbitrary. The 200-day moving average works as a regime indicator precisely because it filters out short-term volatility and captures the medium-to-long-term trend, which is why both technical traders and the algorithms that drive a large share of market activity pay close attention to it.
For Ethereum specifically, the historical record shows that this line has repeatedly marked the transition between bull and bear phases, so a sustained position above it tends to attract trend-following buyers and signal strength, while a decisive break below it tends to trigger trend-following selling and signal weakness. The line becomes partly self-fulfilling because so many participants treat it as meaningful that their collective behavior reinforces its importance.
Right now, the line is doing something subtle and worrying beneath the surface: even as the price hovers around it, the 200-day average itself has begun to slope downward, which technicians read as a sign of underlying long-term weakness instead of strength. A price clinging to a falling long-term average is in a more precarious position than one riding a rising average, because the trend line that is supposed to provide support is itself drifting lower.
This is why the current test is so consequential. If Ethereum can hold above the line, stabilize, and push back through the resistance levels above it, the long-term average can flatten and turn up, flipping the regime back toward recovery. If it loses the line and the floor beneath it, the falling average becomes overhead resistance, and the path of least resistance points toward the deep accumulation zone the bears identify.
The $1,668 line, in other words, is not just where the price happens to be; it is the level at which Ethereum’s medium-term fate is being decided.
The strongest fundamentals in Ethereum’s history
Here is the contrast that makes Ethereum’s situation so unusual, and it deserves to be laid out fully, because on fundamentals, the network is arguably in the best shape it has ever been.
Start with staking, the mechanism by which holders lock up ether to help secure the network and earn a yield. As of early 2026, roughly 35.8 million ether, close to 30% of the entire circulating supply, is staked, secured by around one point one million validators, with a staking yield in the range of 2.8-3.5% annually.
That staked proportion has nearly tripled since early 2023, when about 11% of supply was staked, reflecting steadily growing confidence and the popularity of liquid staking and restaking. A large and rising share of supply locked in staking reduces the ether available to sell on the open market, a structurally supportive dynamic.
The institutional picture is equally striking. Spot Ethereum exchange-traded funds have attracted roughly 11.6 billion dollars in cumulative net inflows since launching, with the largest single product holding well over $6 billion in assets, giving traditional investors regulated access to ether and, through the staking yield increasingly available, a competitive income component.
Beyond the funds, corporate treasuries have embraced ether as a reserve asset at a scale that did not exist a year earlier, collectively holding over 6.2 million ether, up from under 1 million in mid-2025, led by a treasury company that alone holds several million ether, a meaningful slice of the total supply.
Layered on top is an accelerating upgrade cadence, with major protocol improvements deployed in 2025 and a twice-yearly schedule of further upgrades designed to scale the network.
By every one of these measures, more staked, more institutional capital, more corporate adoption, more frequent upgrades, Ethereum’s fundamentals are at or near record strength. And none of it has stopped the price from falling, which is the puzzle the rest of the prediction has to confront.
The bear case: why the fundamentals have not mattered
The hard truth for Ethereum bulls is that strong fundamentals have, so far, been no match for the forces pushing the price down, and understanding why is essential to any honest prediction.
The first and most powerful force is the macro environment and Ethereum’s nature as a high-beta risk asset. Ethereum tends to amplify the broader market’s moves, so in a period of risk aversion, tightening financial conditions, and a sliding Bitcoin, Ethereum falls harder regardless of how strong its network fundamentals are, because the selling is driven by macro flows that do not care about staking ratios or upgrade schedules. When capital is fleeing risk, the quality of Ethereum’s fundamentals offers little protection.
The second force is the reversal of the very institutional demand that forms part of the bull case. The exchange-traded funds that brought billions into Ethereum have, during the downturn, seen persistent outflows, turning a source of demand into a source of selling and showing that institutional money can flee as readily as it arrived.
The third is a structural tension within Ethereum’s own design: the growth of layer-two networks, which handle transactions more cheaply by settling on Ethereum, expands the ecosystem’s usage but also reduces the fee pressure on the main chain, complicating the link between network activity and ether’s value.
The fourth is competition from other blockchains vying for the same developers, users, and capital, which caps the premium the market is willing to pay.
And the fifth is simply sentiment and narrative: with the price in a year-long downtrend and a co-founder seen selling, the story around Ethereum has soured, and narrative drives crypto prices more than fundamentals over any given stretch.
The bears’ summary is blunt: the ether trade may be structurally broken, with the token failing to capture the value its thriving network creates, and until the macro tide turns, the record fundamentals are a reason to watch instead of a reason the price must rise.
The catalysts that could flip the line
For the fundamentals to start mattering, something has to change the flow of money and the narrative, and several potential catalysts could do exactly that, which is where the bull case regains its footing.
The most specific is the network’s continued upgrade path. A major scaling upgrade expected in the first half of 2026, followed by another in the second half, is designed to deliver measurable improvements to the main chain, and a successful, well-received upgrade could refresh the narrative around Ethereum, reminding the market of the network’s technical leadership and giving institutional and retail buyers a concrete reason to re-engage.
Upgrades have historically been catalysts for Ethereum when they land well, and the twice-yearly cadence means there are regular opportunities for a positive surprise.
The second catalyst is a reversal in the institutional flows. The exchange-traded fund outflows have been a primary drag, so a durable shift back to sustained inflows, perhaps helped by the staking yield making the funds more competitive against fixed-income products, would remove that selling pressure and could turn the funds back into the demand engine the bull case envisions.
The continued accumulation by corporate treasuries is a related signal; if treasuries keep buying through the weakness and the whale wallets that have been adding to positions during the dip prove to be the leading edge of renewed institutional conviction, the resulting supply squeeze, with so much ether staked and locked, could lift the price sharply once demand returns.
The third catalyst is macro: a shift toward easier monetary policy or a broader return of risk appetite would lift high-beta assets like Ethereum, and given how much it has fallen, the rebound could be substantial. The honest framing is that Ethereum has loaded the spring, with record fundamentals and locked supply, and the catalysts above are what could release it, but each depends on forces, especially the macro backdrop, that are not yet in place.
The bull, base, and bear cases for 2026
Tying the scenarios to the line and the catalysts makes them concrete. These are conditional ranges, not predictions, and each hinges on whether Ethereum holds its pivotal level and whether the catalysts arrive.
- Bull case: Ethereum holds the $1,668 line, a well-received scaling upgrade refreshes the narrative, exchange-traded fund flows reverse back to sustained inflows, and a friendlier macro backdrop returns risk appetite. The locked supply from record staking amplifies the move as demand returns, and Ethereum recovers through resistance toward the $2,300-$3,000 zone, with the most bullish institutional targets pointing well above that over a longer horizon as the fundamentals finally reassert themselves
- Base case: Ethereum chops around the line for an extended period, holding the $1,580-$1,700 range as treasury accumulation offsets continued fund outflows, with the strong fundamentals preventing a collapse but the weak macro preventing a breakout. In this scenario, Ethereum grinds sideways near current levels, waiting for a catalyst, with direction deferred to the second half of the year.
- Bear case: Ethereum loses the $1,668 line and the $1,580 floor decisively, fund outflows continue, Bitcoin drags the market lower, and the falling long-term average becomes overhead resistance. The chart’s deep accumulation zone comes into play, and Ethereum declines toward the $1,000-$1,600 region the bears identify, with the record fundamentals failing, for this cycle, to matter against the macro tide.
What to watch
For anyone tracking whether Ethereum’s fundamentals will finally translate into price, the analysis points to a focused watchlist, and the first item is the line itself. Whether Ethereum holds the $1,668 200-day moving average and the $1,580 floor beneath it, or loses them decisively, is the single clearest signal of which scenario is unfolding, because that level marks the boundary between the recovery path and the deep-accumulation path.
A sustained reclaim of the resistance above the line would be powerfully bullish; a decisive break of the floor would be powerfully bearish. Everything else feeds into that binary.
The second item is the flow data. The exchange-traded fund outflows have been the primary drag, so a durable reversal to net inflows would be among the strongest possible signals that institutional demand is returning, while continued outflows would confirm the bearish reading. The behavior of corporate treasuries and large accumulating wallets matters alongside the funds; sustained buying through weakness supports the bull case, and any sign of treasuries slowing or selling would be a serious warning given how much of the supply-squeeze thesis rests on them.
The third item is the upgrade path and its reception, since a well-received scaling upgrade is the most concrete near-term catalyst that could refresh the narrative. And the fourth, as always, is the macro environment, because Ethereum’s high-beta nature means a shift in monetary policy or risk appetite would move it more than almost any network development.
The honest synthesis is that Ethereum is a coiled spring of record fundamentals and locked supply held down by a hostile macro tape, and the 200-day line is where the contest between the two is being decided.
Watch the line, watch the flows, and resist the temptation to assume that strong fundamentals must win quickly, because Ethereum’s entire recent history is a reminder that they have not.
Frequently Asked Questions
Why is the $1,668 level so important for Ethereum?
Because it is Ethereum’s 200-day moving average, a long-term trend line that has historically divided its bull markets from its bear markets. When Ethereum trades and holds above it, the network has tended to be in recovery or rally mode; when it breaks decisively below, extended downtrends have usually followed. Many traders and automated strategies treat the line as a regime indicator, which makes it partly self-fulfilling. With Ethereum sitting right on the line, the direction it breaks will signal whether a recovery toward $3,000 or a deeper decline toward the chart’s accumulation zone is more likely.
Why is Ethereum’s price falling when its fundamentals are so strong?
Because macro forces and Ethereum’s nature as a high-risk asset have overwhelmed the fundamentals. Ethereum amplifies the broader market’s moves, so in a period of risk aversion, tightening conditions, and a sliding Bitcoin, it falls hard regardless of staking ratios or upgrades. The exchange-traded funds that had bought billions in inflows have seen persistent outflows, turning demand into selling. Layer-two growth complicates the link between network usage and ether’s value, competition caps the premium, and a soured narrative drives sentiment. Over any given stretch, flows and narrative move crypto prices more than fundamentals, which is why record fundamentals have not lifted the price.
How strong are Ethereum’s fundamentals right now?
By most measures, the strongest in its history. Roughly thirty-five point eight million ether, near 30% of the supply, is staked, nearly triple the proportion of early 2023, which locks up supply. Spot exchange-traded funds have drawn around $11.6 billion in cumulative inflows, with the largest product holding over $6 billion. Corporate treasuries hold over 6.2 million ether, up from under 1 million in mid-2025. And the network is on an accelerating upgrade schedule. The contrast between these record fundamentals and the weak price is precisely what makes Ethereum’s current situation so unusual.
How low could Ethereum go?
If it loses the $1,668 line and the $1,580 floor decisively, technical analysts who map the downside identify a deep accumulation zone between roughly $1,600, which would be another 30-60% below current levels. This is the bear scenario, not a forecast, and it depends on continued fund outflows, a falling long-term average turning into resistance, and Bitcoin dragging the market lower. The bull scenario, in which Ethereum holds the line and recovers toward $3,000, is equally coherent. Which path unfolds depends on the line, the flows, the upgrades, and the macro environment.
What could turn Ethereum’s price around?
Several catalysts could flip the trend. A well-received scaling upgrade could refresh the narrative and give buyers a concrete reason to re-engage. A durable reversal of exchange-traded fund outflows back to sustained inflows would remove the primary drag and restore demand. Continued accumulation by corporate treasuries and large wallets, combined with the locked supply from record staking, could create a supply squeeze that lifts the price sharply once demand returns. And a shift toward easier monetary policy or renewed risk appetite would lift high-beta Ethereum substantially. Each depends on forces, especially the macro backdrop, that are not yet fully in place.
Is the “ETH trade” broken?
That is the bears’ core argument: that Ether, the token, is failing to capture the value its thriving network creates, because layer-two growth reduces main-chain fee pressure, institutional flows have reversed, and the price has fallen for a year despite record fundamentals. The bull rebuttal is that the fundamentals have built a coiled spring of locked supply and structural demand that will release once the macro tide turns and a catalyst arrives, and that the current weakness is macro-driven instead of a permanent break. The honest position is that the question is unresolved, and the 200-day line is where the market is deciding it.
This article is information, not investment advice. The scenarios described are conditional ranges that depend on unresolved questions, not predictions, and Ethereum is highly volatile. Prices, flows, staking figures, and fundamentals reflect reporting available as of June 26, 2026, and can change quickly. Nothing here is a recommendation to buy or sell. Verify current data from primary sources and consider your own circumstances before making any decision


TLDR:
- Aave V4 will enable onchain securities lending for tokenized stocks, removing broker intermediaries entirely.
- The global securities lending market holds $4.6 trillion in loans and generates $35 billion annually.
- Brokers currently retain 50–85% of borrow fees, leaving asset holders with only a minimal revenue share.
- Aave founder Stani Kulechov confirmed the protocol is expanding its TAM beyond crypto to all asset classes.
Aave is positioning itself to capture a share of the global securities lending market through its upcoming V4 upgrade.
The protocol plans to bring tokenized stocks onchain, enabling users to earn borrowing fees without brokers taking the majority of revenue.
Aave executive Luigi D’Onorio DeMeo outlined the move on X, noting a market with roughly $4.6 trillion in securities on loan annually. The protocol aims to remove intermediaries and offer full borrowing rates directly to users.
Aave V4 Opens the Door to Tokenized Equity Lending
Prime brokers and retail platforms currently dominate the securities lending business. Firms like Robinhood and Schwab lend out client-held stocks to earn revenue.
DeMeo laid out the imbalance clearly on X, stating that these platforms “typically keep 50–85% of the borrow fees, passing only a small share back to you.” Only a fraction of that revenue flows back to the actual holders of those securities.
Aave V4 is designed to change that arrangement entirely. The upgrade will allow users to supply tokenized stocks directly onchain.
From there, users can earn the full borrow rate without a middleman capturing most of the return. DeMeo described the model as one that offers “real-time transparency, dynamic pricing, no rehypothecation and no middlemen taking the lion’s share.”
The protocol also plans to eliminate rehypothecation, meaning collateral cannot be reused in layered transactions. That removes a major risk factor commonly associated with traditional securities lending operations.
Users retain direct exposure to their assets without hidden leverage from intermediaries. The structure is intended to give holders meaningful control over how their securities generate returns.
Aave founder Stani Kulechov reinforced this direction publicly on X. He wrote that “Aave is expanding its TAM from crypto assets to all assets with securities-backed loans and securities lending.”
The post came in direct response to DeMeo’s outline of the V4 roadmap. Together, both statements confirm the protocol is moving deliberately into traditional financial market territory.
A $35 Billion Annual Revenue Pool Now Within Reach
The global securities lending market generates approximately $35 billion in annual revenue. DeMeo noted that “the securities lending market sees roughly $4.6 trillion in securities on loan globally,” with brokers capturing the majority of that revenue pool.
Asset holders receive only a minor cut of what their securities generate. Aave’s V4 launch is positioned as a direct response to that structural gap.
The go-to-market strategy for tokenized equities will be built around utility within Aave V4. Rather than tokenizing stocks purely for speculative trading, the focus is on enabling productive use through lending.
DeMeo stated that “the GTM for tokenizing equities will be providing utility with Aave V4.” Securities lending is a proven revenue-generating mechanism in traditional finance, and Aave is bringing it onchain from day one.
The protocol’s approach also addresses transparency concerns common in traditional lending markets. Onchain infrastructure allows open verification of which assets are on loan and at what rates.
That level of visibility does not exist in most broker-operated lending programs. Users can track their returns in real time without relying on periodic statements from intermediaries.
Aave’s push into securities lending marks a meaningful shift in how the protocol defines its market. Previously, the focus was on crypto-native collateral and borrowing.
Now the protocol is actively targeting traditional financial markets through tokenized asset infrastructure. The $4.6 trillion securities lending pool represents a target that extends well beyond anything Aave has previously addressed.


For the past two cycles, Bitcoin DeFi has lived more as a promise than a category.
Programmable Bitcoin has remained a vision held by a certain breed of Bitcoin maxi who believes that the world’s largest cryptocurrency can become productive without losing its security or sound money qualities.
Yet the closure of Bitcoin scaling platform Botanix earlier this month has called that vision into question.
If a well-funded, technically ambitious Bitcoin layer-2 with live apps, integrations and competitive yields can’t attract enough usage to survive, does that mean Bitcoiners simply don’t care about decentralized finance?
Bitcoin DeFi remains a niche proposition in 2026, despite years of being touted as the next big thing.
DefiLlama’s dashboard shows just $4.12 billion of total value locked (TVL) across all of the Bitcoin DeFi protocols. That’s a rounding error next to Bitcoin’s $1.2 trillion market cap, and the hundreds of billions held via spot exchange-traded funds, corporate treasuries and custodial accounts.
Andre Dragosch, head of research Europe at Bitwise, told Cointelegraph, “Bitcoin is winning decisively as a monetary asset and as pristine collateral, but the case for Bitcoin as a standalone DeFi execution layer was always structurally weaker than the narrative suggested.”
Botanix closes after four years
When Botanix announced it was winding down after nearly four years of work and a year of mainnet uptime, the team didn’t blame a hack or a regulatory shock; they blamed demand.
Botanix described a chain that “worked” in every technical sense: 25 million transactions, 200,000 wallets, and tens of millions of dollars in bridged funds, yet it never generated the fee volume needed to cover its infrastructure costs.
Users came for the yield, treated BTC as store-of-value collateral, and then largely stuck to passive, buy-and-hold strategies, rather than actively borrowing, trading, or moving funds often enough to generate meaningful fee volume.
Related: Fireblocks to integrate Stacks for institutional-grade Bitcoin DeFi
Like most BTCFi stacks today, Botanix still requires users to bridge their Bitcoin into a tokenized version on a separate Ethereum Virtual Machine (EVM)-based chain before they can access DeFi. That introduces additional bridge and smart contract assumptions that worry many Bitcoiners.
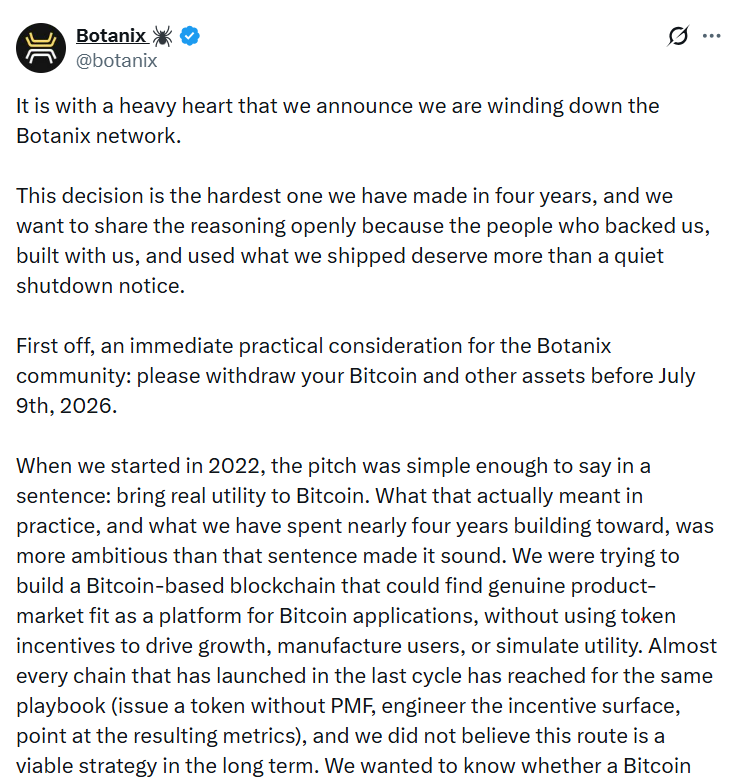
Botanix’s shutdown notice. Source: Botanix
Even so, Botanix co-founder Willem Schroé told Cointelegraph that he wouldn’t have changed the core design. Despite Botanix offering what he described as “the best rates in the industry” and a more Bitcoin-aligned security model than typical wrapped BTC bridges, wrapped BTC on Ethereum still out-competed Botanix.
He attributed that to Ethereum’s “huge infrastructure network and Lindy effect,” as well as a mix of liquidity depth, user experience and regulatory comfort.
What Botanix learned about Bitcoin DeFi
The team concluded that Bitcoin is still viewed as a reserve asset rather than something that has programmable utility.
For most existing use cases like lending, leveraged exposure, or yield, a wrapped BTC position on a large, mature EVM ecosystem such as Ethereum is “genuinely sufficient” for most users. Rather than bridge into a Bitcoin-aligned EVM chain like Botanix, users preferred to stick with wBTC on venues where the liquidity, apps and integrations already exist.
Related: Mercado Bitcoin expands LatAm RWA push with $20M in Rootstock private credit
Botanix also pointed to onchain activity consolidating around venues like Hyperliquid, and major centralized exchanges and retail-facing fintechs that “own the user relationship,” leaving independent infrastructure “rowing upstream” against convenience and branding.
Wilhelm said he hopes Botanix’s wind-down “will definitely be looked at by others,” and framed the process as a professionally managed experiment whose lessons other BTCFi builders should take seriously.
Bitcoiners, DeFi and wrapped BTC
While estimates vary, only a small fraction of Bitcoin’s supply is currently productive in DeFi, and most of that sits in wrapped BTC products on Ethereum and its L2s like Base and Arbitrum, as well as Polygon, Solana and BNB Smart Chain. A smaller percentage is on “Bitcoin L2” chains, with Bitcoin-aligned L2s and sidechains accounting for a modest share of that activity by value.
Tokenized BTC products themselves represent just a sliver of the asset: A May 2026 analysis estimated that roughly $20 billion worth of BTC — less than 2% of the total Bitcoin supply — is circulating on EVM chains in wrapped form.
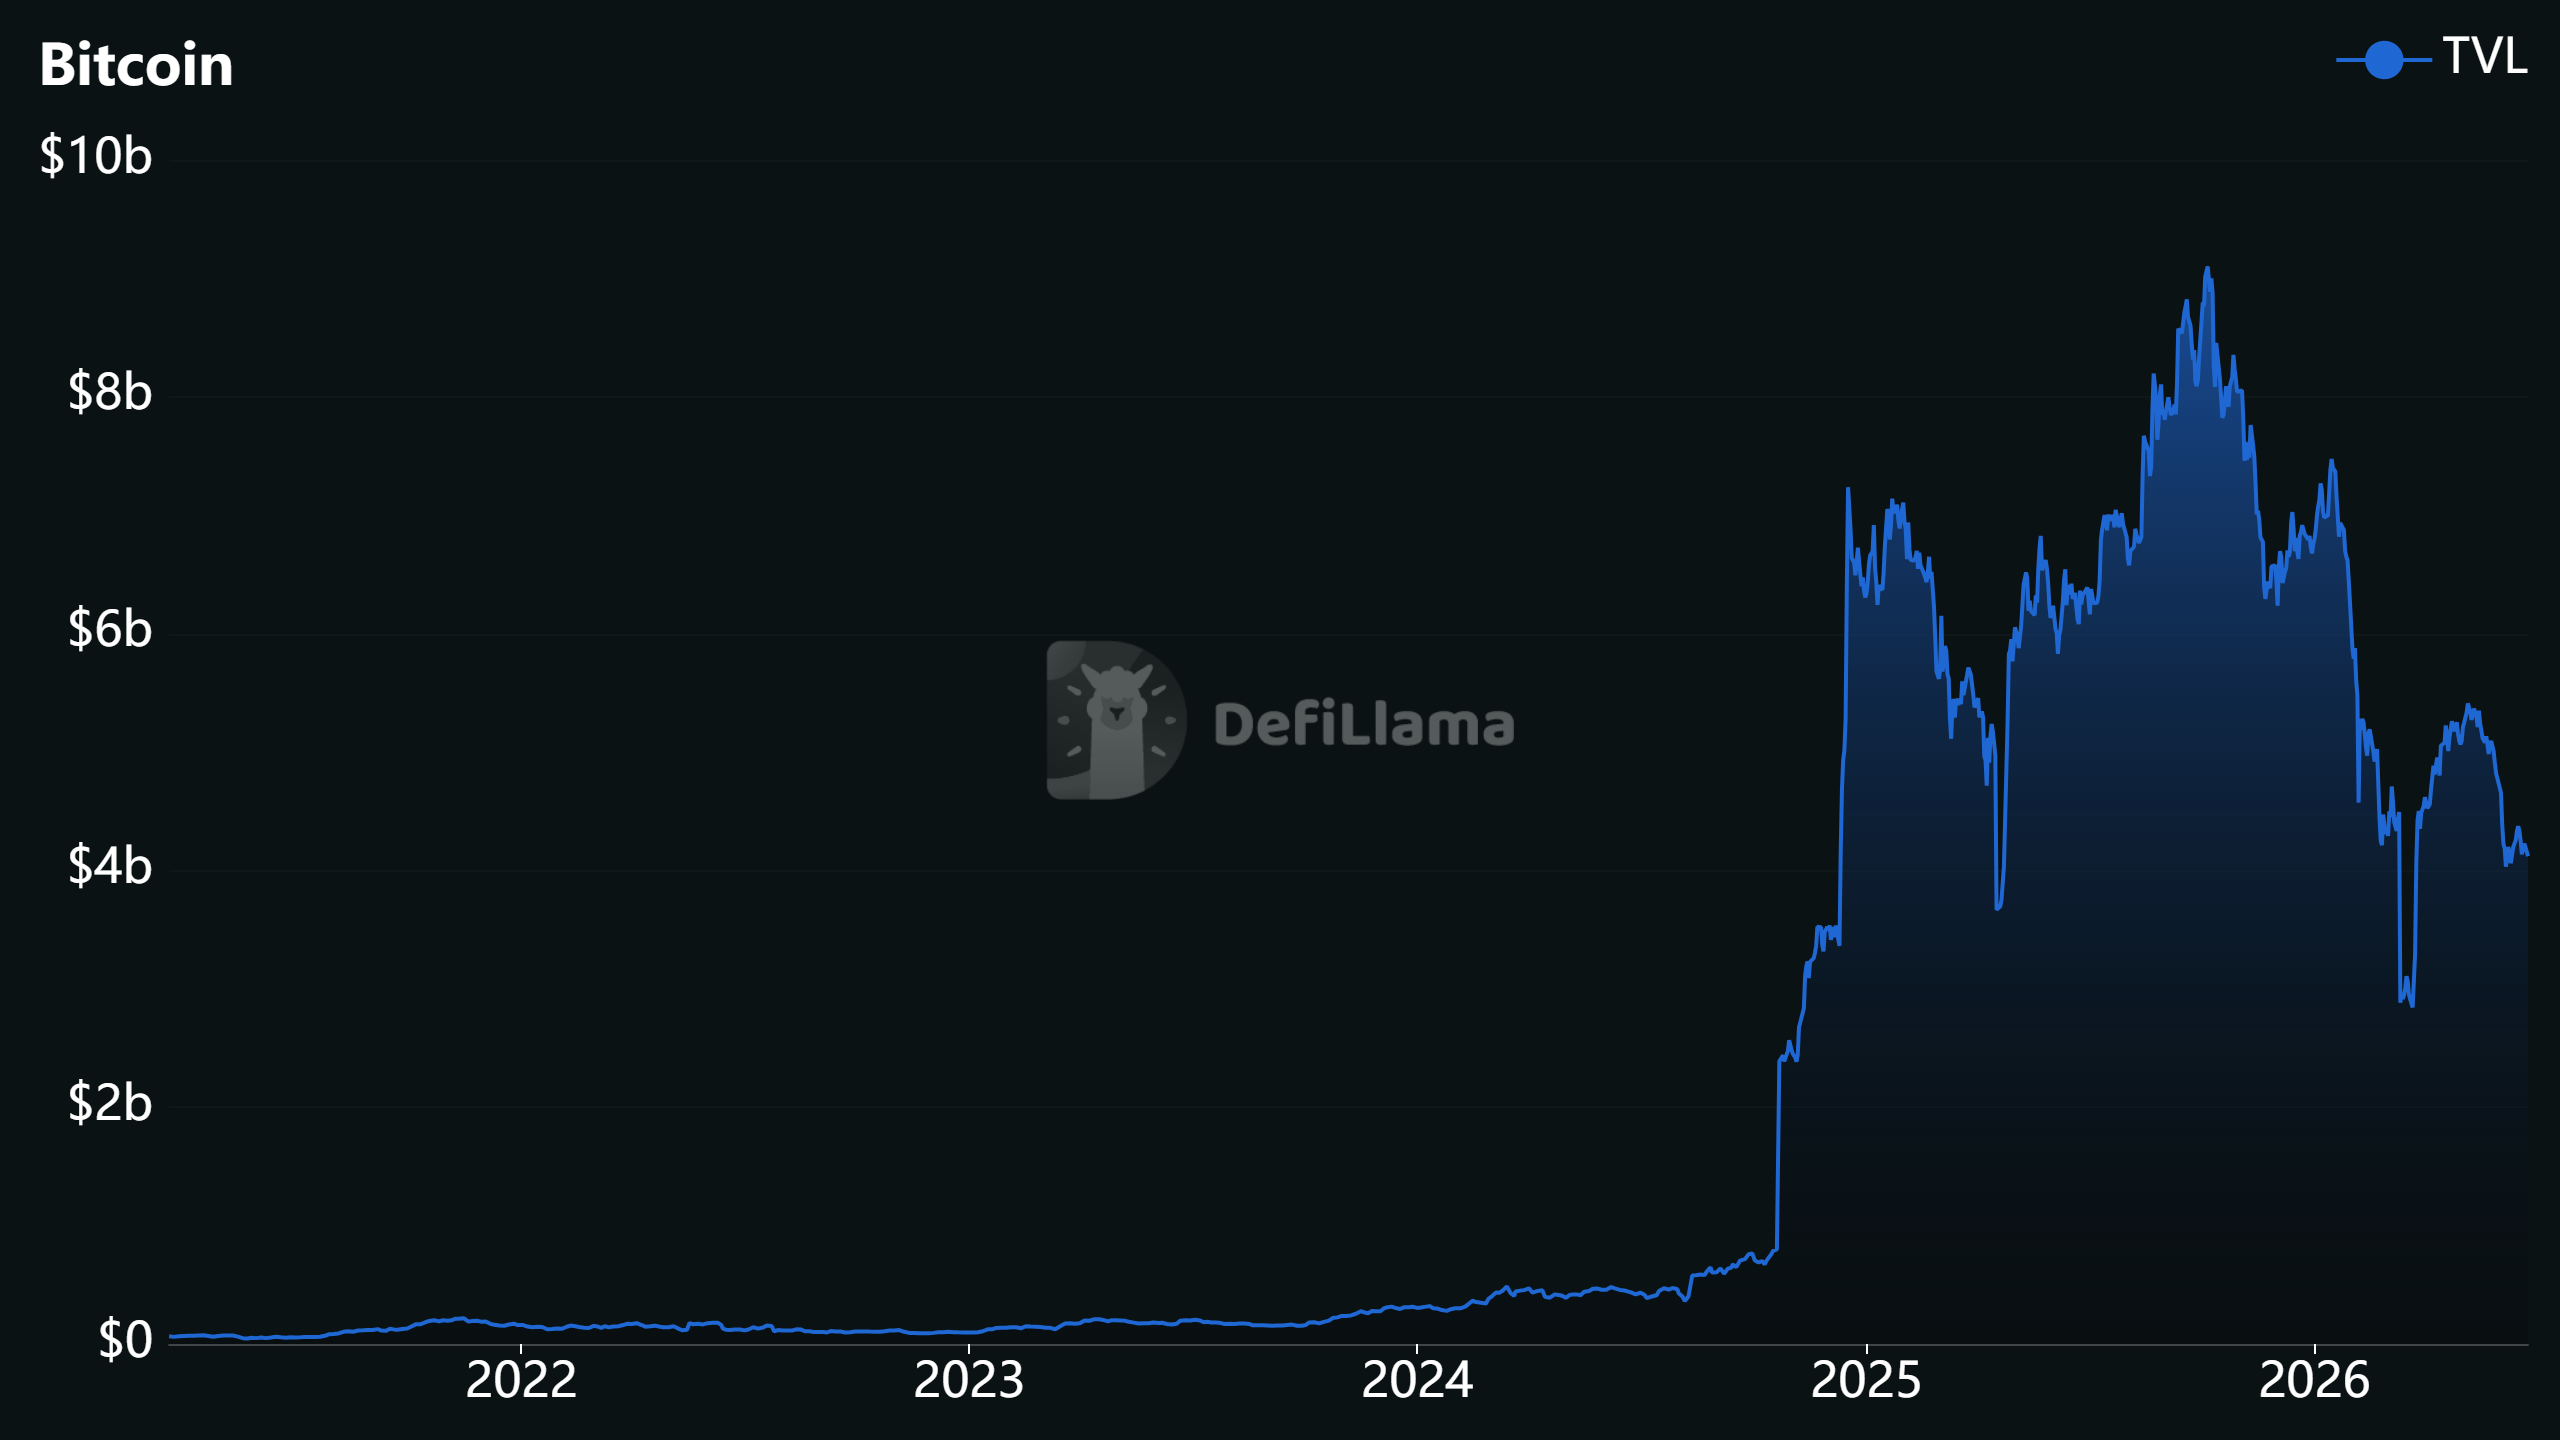
Total Value Locked (TVL) in Bitcoin DeFi. Source: DeFiLlama
An October 2025 GoMining survey of 730 Bitcoin holders found that 77% of respondents had never used a BTCFi platform, and only 3% integrated BTCFi into their overall Bitcoin strategy.
Even allowing for sample bias (these respondents were plugged-in, survey-answering BTC holders), the numbers show that BTCFi platforms that keep users in Bitcoin-aligned stacks remain a niche activity rather than a mass behavior.
Justin d’Anethan, head of research at crypto private markets advisory firm Arctic Digital, told Cointelegraph, “There is more liquidity and better yields on EVM or SVM [Solana Virtual Machine] native solutions than on BTC solutions, period.”
When clients ask about “putting their Bitcoin to work,” the practical routes, he said, are still centralized desks, exchanges lending out BTC at 2% to 4%, basis trade structures “à la Ethena,” or institutional credit pools like Maple.
Related: Bitcoin recovery meets DeFi tensions as Aave rift deepens: Finance Redefined
He said the big obstacle for most Bitcoiners was the risk of bridging to a less secure Bitcoin L2. For “hardcore BTC maxis,” the default remains cold storage, HODLing and riding price appreciation, rather than trying to “eke out 2-3% with counterparty risk.”
Native BTCFi as a structural mismatch
Dragosch said Botanix’s failure suggested that demand for standalone Bitcoin DeFi execution layers was much weaker than their backers expected.
He argued that capital that “genuinely wants yield has migrated to wrapped BTC on mature, liquid venues rather than bridging into bespoke federations.”
In this view, the problem isn’t just that Bitcoiners haven’t “discovered” native DeFi yet; it’s that the architecture and user base are misaligned. Bitcoin’s base layer is slow, conservative and firmly anchored in the store-of-value narrative.
“Bitcoin as reserve collateral is the durable trade,” Dr. Dragosch said, “the next leg of adoption runs through institutions and balance sheets, not necessarily through onchain execution layers.”
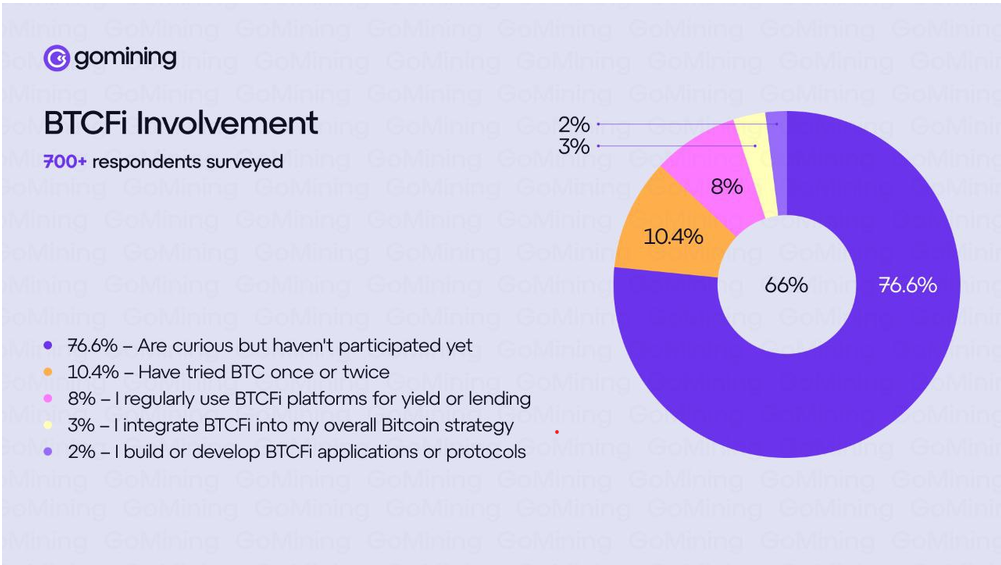
77% of respondents have never used a BTCFi platform. Source: GoMining
Who is still building BTCFi, and for whom?
Diego Gutierrez Zaldivar, chief executive of RootstockLabs, a Bitcoin-secured, EVM-compatible sidechain, doesn’t buy the idea that there’s “no demand” for Bitcoin-backed lending, yield products or broader BTCFi services.
He said the main constraint is trust: putting in place the operational, legal and risk management frameworks that institutions need.
More than 40% of all Bitcoin DeFi activity now runs through Rootstock, he said, including real-world asset settlements and institutional vaults. Over the past year, he said, funds have started asking to deposit hundreds or even thousands of BTC at a time into Rootstock-based products; flows that were almost unheard of two or three years ago.
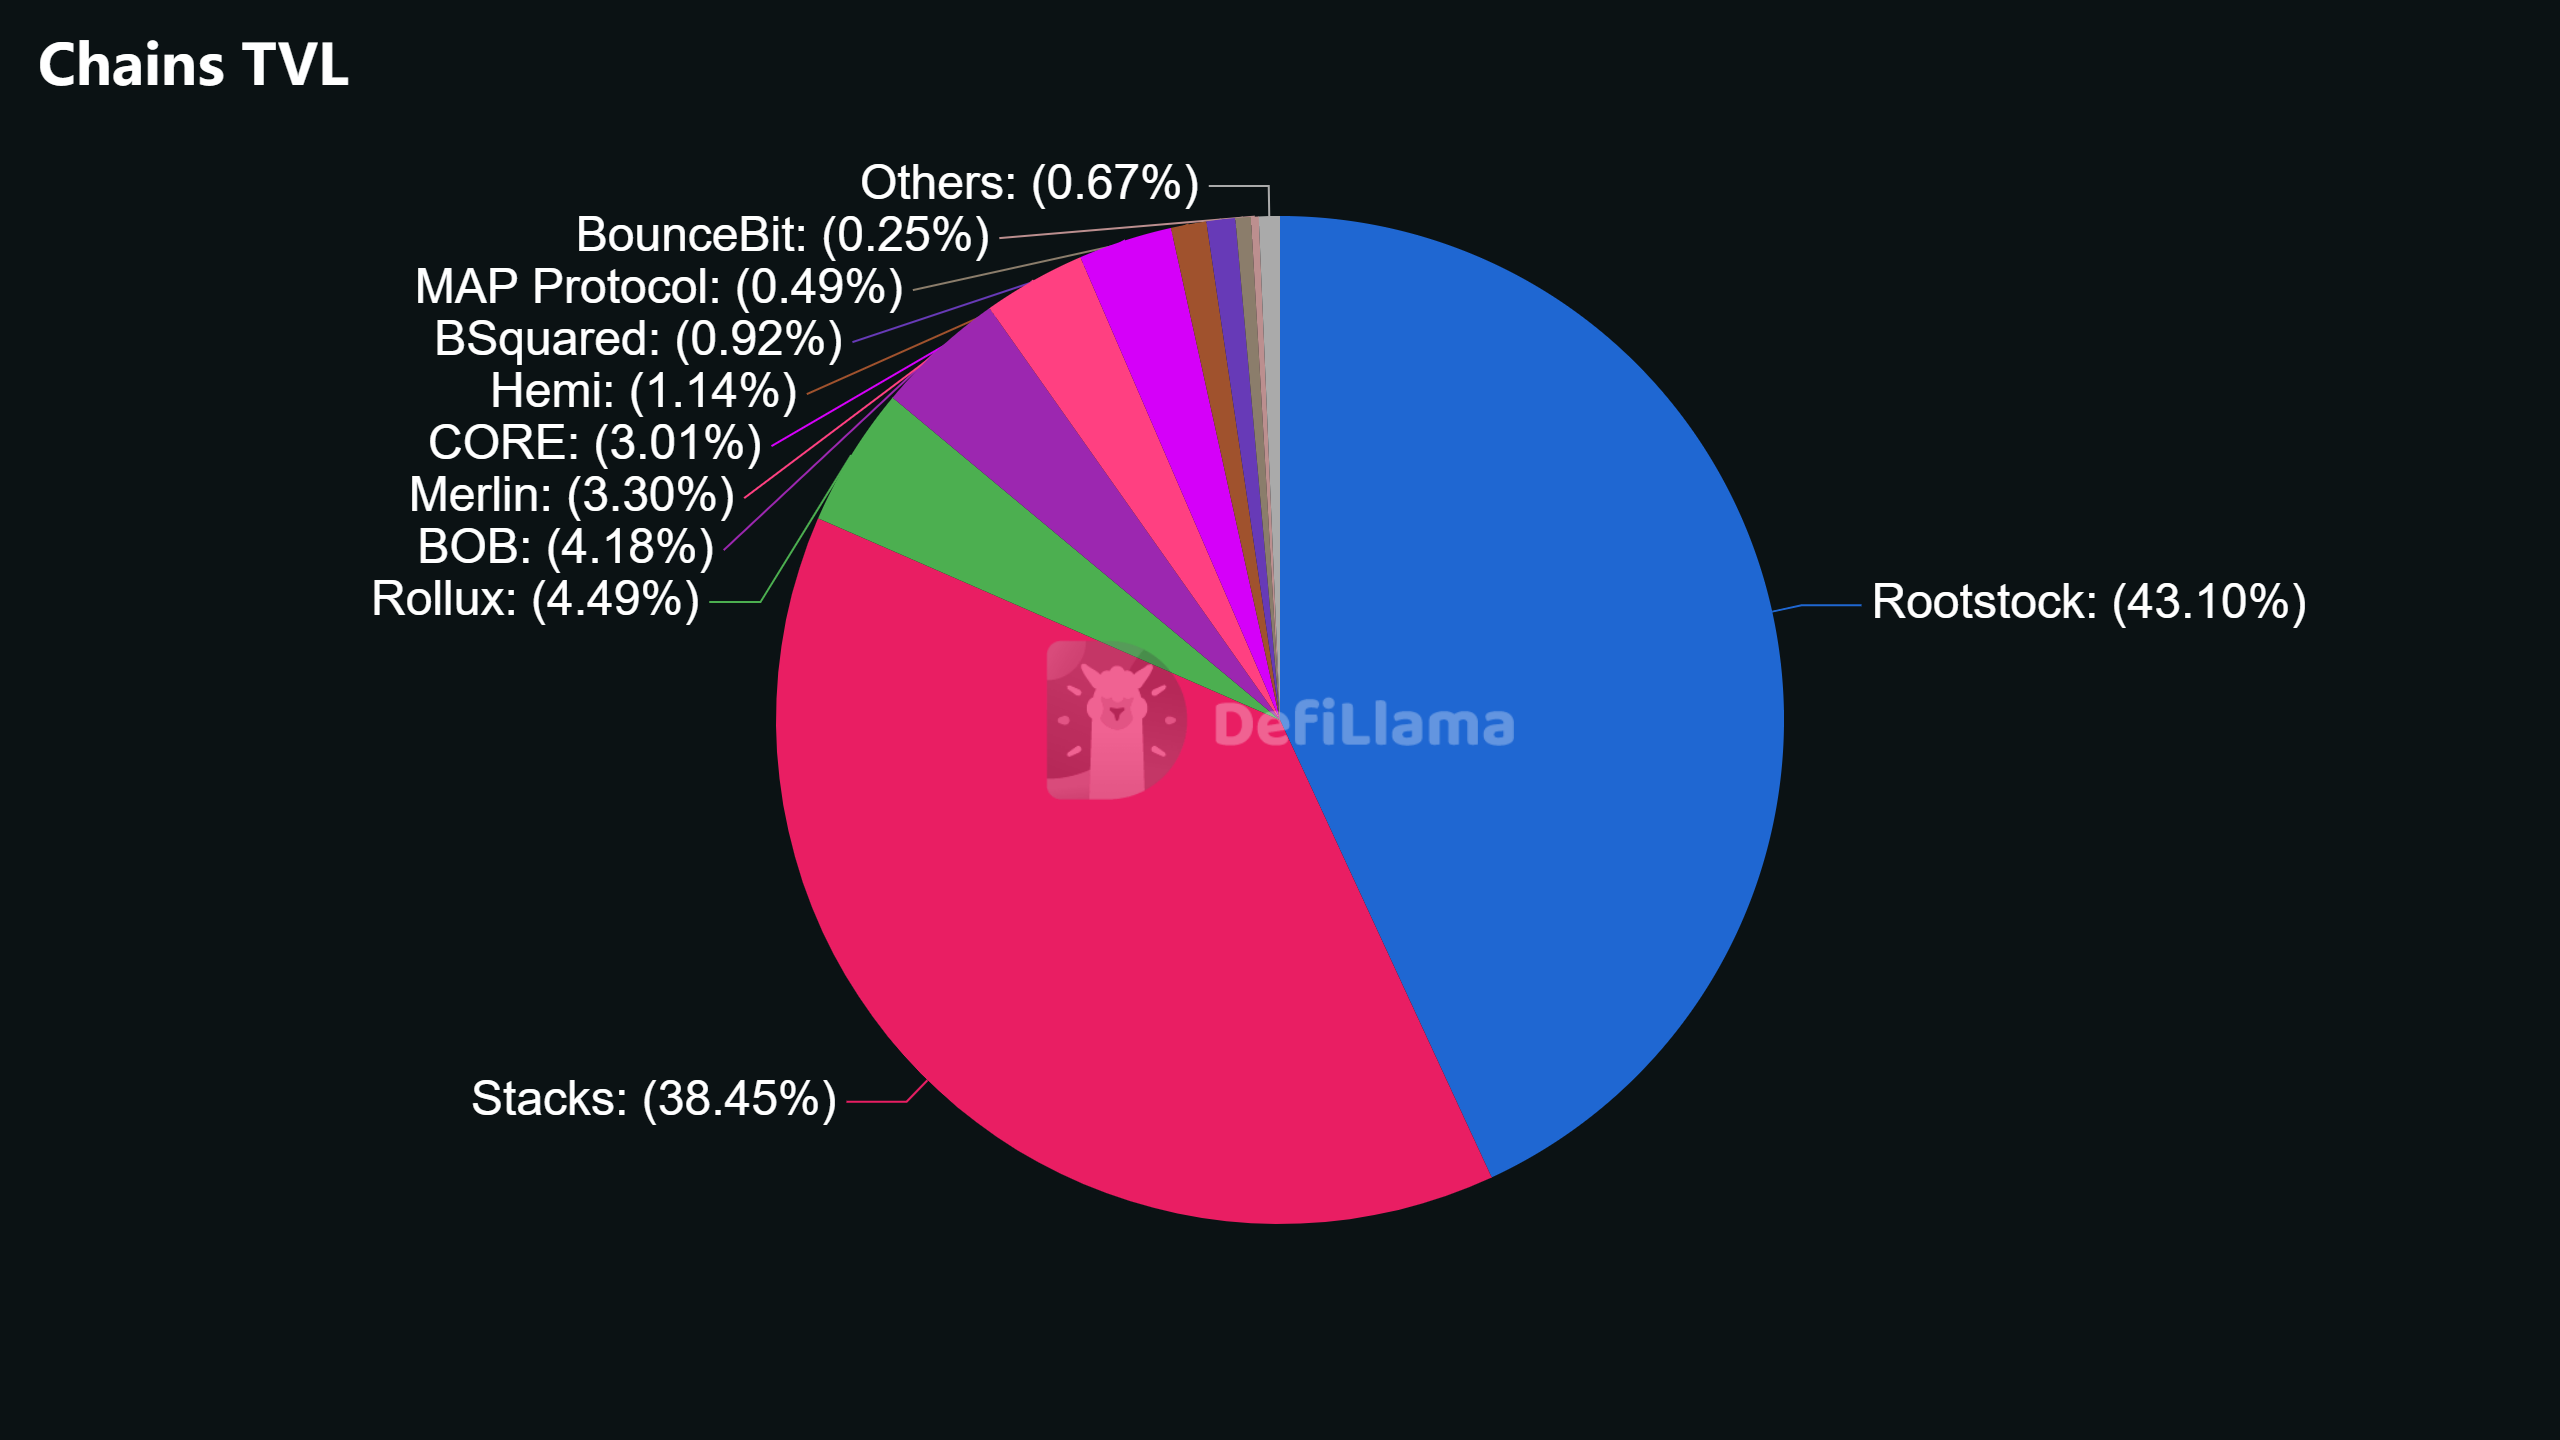
Chains TVL. Source: DeFiLlama
Orkun Mahir Kılıç is co-founder of Chainway Labs, behind Citrea, a Bitcoin-anchored rollup that keeps user assets inside Bitcoin’s security perimeter and proves its state with zero-knowledge proofs. He argued that cloning EVM DeFi primitives onto Bitcoin is a dead end, and said that Botanix’s experience is a verdict on that model, rather than BTCFi itself.
He told Cointelegraph that “more secure” doesn’t change most people’s behavior.
“People don’t price counterparty risk until something breaks,” he said. ”Where it matters” is for institutions and large holders that need trust-minimized transactions with no custodian to fail.
“For everyone else, the reason to be here isn’t the security guarantee in the abstract; it’s the applications that don’t exist elsewhere.”
Magazine: Bitcoin will not hit $1M by 2030, says veteran trader Peter Brandt
TLDR:
- Bitcoin’s apparent demand has stayed negative for 208 consecutive days, dropping to a record low of -273,000 BTC.
- Old Bitcoin supply is re-entering circulation faster than the spot market can absorb the incoming coins.
- BTC price was rejected at both $82,000 and $61,000 resistance levels, extending the pattern of lower highs.
- Analyst Kabuki projects Bitcoin could drop to $53,000 shortly and reach $42,000 by the end of July 2026.
Bitcoin’s apparent demand has remained in negative territory for 208 consecutive days, reaching a new low of -273,000 BTC.
The metric measures real spot market demand by comparing new Bitcoin supply from miner block rewards against existing inventory movement.
Old supply is now entering circulation faster than the market can absorb it. This mismatch between inflows and outflows is creating heavy overhead resistance across Bitcoin’s price structure.
Seven Months of Sustained Distribution Signal Structural Weakness
From November 9, 2025, to May 31, 2026, Bitcoin’s apparent demand hovered quietly between 0 and -150,000 BTC. That range pointed to mild but steady distribution rather than sharp selling.
The market absorbed the pressure without dramatic price moves during that stretch. However, the pattern set the stage for the sharper deterioration that followed.
On-chain analyst Ali Charts flagged the shift in a recent post, noting that apparent demand had dropped to a new low of -273,000 BTC.
The metric has since flatlined around that level, showing no signs of recovery. When apparent demand is persistently negative, it reflects a structural imbalance in supply and demand.
New capital entering the spot market is simply not enough to offset the volume of older coins moving back into circulation.
The metric is considered a reliable gauge of genuine demand because it strips out derivative activity. It focuses entirely on spot-side flows, making it harder to manipulate or misread.
A sustained negative reading over seven months carries more weight than a short-term dip. Traders and analysts watching this data now face a market where selling pressure appears to be the dominant force.
This kind of prolonged distribution cycle has historically preceded extended price corrections. Bitcoin trading at $59,855 at the time of the data release reflects the pressure building on price.
Without a clear reversal in apparent demand, recovery rallies may face sustained resistance. The current on-chain picture supports caution rather than confidence.
Price Rejections at Key Levels Fuel Bearish Projections
Bitcoin’s price action has reinforced the bearish on-chain signals with two clear rejections at technical resistance. Analyst Kabuki, writing on X, pointed out that resistance at $82,000 was rejected before the market dropped sharply. A subsequent attempt at $61,000 was also turned away, continuing the sequence of lower highs.
Kabuki, who claimed to have called the $126,000 top in October 2025 and the $15,000 bottom in November 2022, outlined a bearish price path.
The projection targets $53,000 in the near term, followed by a drop to $42,000 by July. That roadmap follows two prior rejections and aligns with a broader pattern of declining support levels.
Each failed attempt to hold above resistance adds to the case for continued downside. The combination of negative apparent demand and repeated price rejections at key levels creates a compounding bearish setup.
Buyers stepping in at current prices are absorbing supply without successfully defending any meaningful level. That dynamic tends to exhaust demand further rather than restore confidence.
Whether Bitcoin follows the projected path to $42,000 remains to be seen. However, the on-chain data and technical structure both point to a market where sellers are in control.
A meaningful shift would require apparent demand to turn positive and price to break cleanly above near-term resistance. Until that happens, the weight of evidence tilts toward continued pressure on Bitcoin’s price.
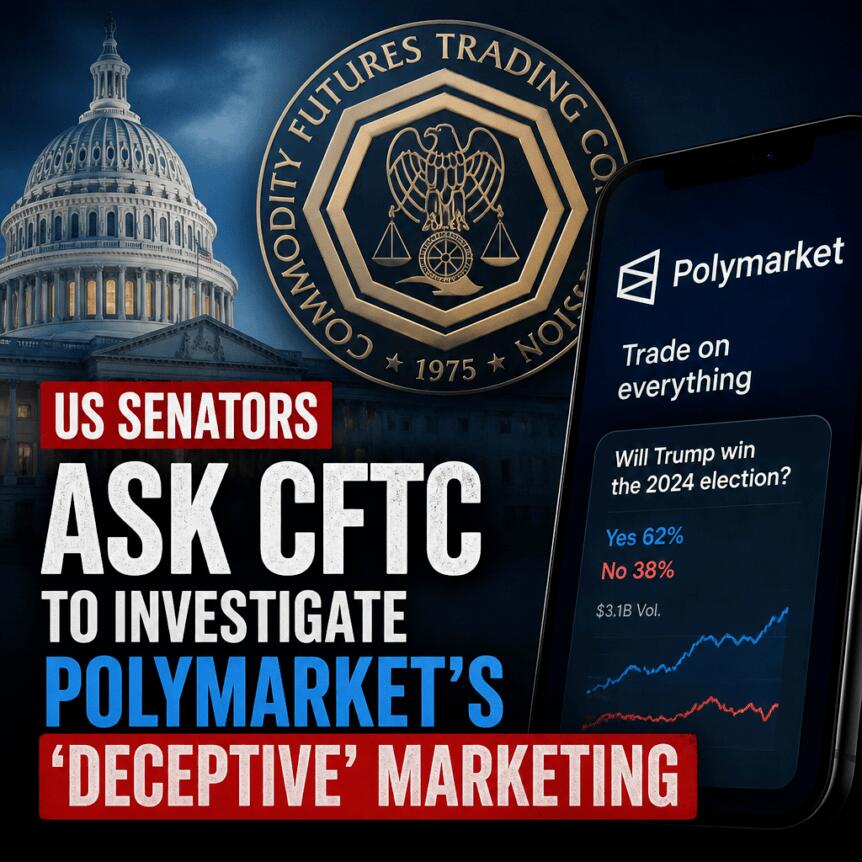
A bipartisan group of U.S. senators has urged the Commodity Futures Trading Commission (CFTC) to investigate Polymarket after a report alleged the prediction market platform paid social media influencers to promote fake bets without clear disclosure. The move raises fresh questions about how regulators should treat event-based prediction products as prediction markets continue to expand their footprint with mainstream audiences.
In a letter sent to CFTC Chair Mike Selig on Thursday, Republican Senator John Curtis and Democratic Senator Adam Schiff said they were concerned Polymarket “used deceptive marketing tactics to promote gambling-style products to US audiences,” according to their press release. The lawmakers called the allegations “deeply troubling” and asked for immediate scrutiny if the claims prove accurate.
Key takeaways
- Senators John Curtis and Adam Schiff have asked the CFTC to investigate Polymarket over allegations of deceptive influencer advertising tied to fake bets.
- The concerns follow a Wall Street Journal report that reviewed more than 1,100 promotional videos and found that 70% included fake bets totaling nearly $2 million.
- Reports also say the CFTC has an ongoing investigation into Polymarket, though the timeline has not been disclosed publicly.
- Polymarket said it is auditing promotional content to ensure compliance with regulatory and disclosure requirements.
- The lawmakers argue the CFTC’s approach may not adequately address the realities of how prediction markets are marketed as gambling-like products.
Senators press for CFTC scrutiny over alleged deceptive promotions
Curtis and Schiff’s letter centers on claims that Polymarket engaged social media creators to film “fake trades” on websites styled to resemble the platform, and that many creators did not disclose they were paid for the promotional work. According to the Wall Street Journal’s June 20 reporting, the publication reviewed more than 1,100 videos and found that 70% showcased fake bets amounting to nearly $2 million.
The senators framed the issue not just as a marketing dispute, but as a regulatory concern tied to consumer protection and the distinction between lawful event-contract trading and gambling-like activity. They said the CFTC has repeatedly asserted authority over prediction markets and event contracts, but argued that current enforcement and oversight appear insufficient given how content creators portray the space.
“If accurate, these allegations are deeply troubling and demand immediate scrutiny from the Commodity Futures Trading Commission,” Curtis and Schiff wrote, according to the letter described in their press release.
Wall Street Journal report and timing of CFTC inquiry claims
The senators’ intervention follows the Wall Street Journal’s report, which described extensive influencer marketing tied to content that allegedly did not reflect genuine bets on Polymarket itself. The Journal’s review suggested a large proportion of promotional videos were not merely illustrative but involved falsified trading scenarios.
Shortly after that reporting, additional coverage indicated the CFTC was already looking into Polymarket. Earlier this week, CNBC reported—citing a person familiar with the inquiry—that the CFTC is conducting an “ongoing and extensive” investigation. CNBC also said the timeline for when the inquiry began was not shared.
Polymarket did not comment on the senators’ letter or on the reported investigation. In a statement provided earlier this week to Cointelegraph, a Polymarket spokesperson said the company was “conducting a comprehensive audit of active promotional content” to ensure it meets its “standards,” as well as applicable regulatory and legal disclosure requirements.
Why the dispute matters: enforcement, disclosure, and the gambling analogy
In their letter, Curtis and Schiff argued that regulators may be missing the practical implications of how prediction markets are presented to U.S. users. They referenced the recurring framing by creators of prediction products as “free money,” and they questioned whether that marketing environment supports treating prediction markets as something fundamentally different from gambling.
The senators warned that if prediction markets are being marketed with consumer behavior in mind similar to gambling-style betting, then the legal and regulatory approach may need closer scrutiny—especially regarding advertising practices and disclosures.
The lawmakers also asserted that they remain concerned the CFTC is neither enforcing the law appropriately nor equipped to act as a federal gambling regulator. They did not claim that all prediction markets should be regulated as gambling, but their argument emphasized that the real-world presentation and consumer messaging could undermine the distinction regulators often rely on.
Questions to CFTC by July 10 and what investors should watch
Beyond asking for scrutiny, Curtis and Schiff requested written responses from CFTC Chair Mike Selig by July 10. Their list of questions included whether the agency is investigating Polymarket, whether the reported advertising practices were legal, and whether the CFTC has adequate resources to police prediction market promotions and related conduct.
The letter also reflects the broader regulatory tension around prediction markets. The CFTC has claimed authority under federal commodities law, in part because platforms register with the agency and operate through structures the commission views as falling under its jurisdiction for commodities-related event contracts.
At the same time, the CFTC’s enforcement actions against state-level challenges show how complex the governance question remains. According to earlier reporting, the regulator has sued nine U.S. states that filed legal action against prediction market operators—alleging the platforms were effectively offering unlicensed sports betting through event contracts.
For traders, users, and companies operating in the prediction market ecosystem, the immediate uncertainty is what the CFTC will determine about promotional practices and disclosure compliance. The next developments to watch are any formal regulatory findings, changes to influencer marketing requirements, and clarifications on how the agency evaluates whether promotional content crosses lines between lawful trading representations and gambling-style inducements.
With both a congressional escalation and reports of an active CFTC inquiry, the key question now is whether the regulator will treat the alleged influencer advertising as a disclosure and consumer-protection issue, a jurisdictional matter, or both—and what that means for how prediction markets market their products going forward.

Popular analyst Ali Martinez mapped out the next significant support levels for Ripple’s cross-border token after the asset marked a new multi-year low yesterday of just over $1.00.
Market observers remain convinced that XRP has reached its most critical level in this cycle, one that could determine the next major leg up (or down).
What’s Next, XRP?
It’s safe to say that the cryptocurrency market has seen better days, which weren’t all that long ago. Ripple’s native asset is no exception. The token challenged $1.60 in mid-May before it plummeted to $1.05 in early June. It then rebounded to $1.30, only to be rejected once again. The latest leg down drove it south to $1.01 (on most exchanges) yesterday.
Ali Martinez weighed in on the asset’s recent performance, which included a bounce to the current $1.04. He noted that the token is testing a “major volume block at $1.06,” a significant cluster in which over 830 million XRP changed hands. This has made it the most important level above $1.00 to watch, but it has given in as of press time.
According to the analyst, this puts the next major such clusters in focus, but they are positioned well below these levels. The first, with 923 million XRP transacted, is at $0.80, while the two larger ones, with 1.16 billion and 1.06 billion XRP transacted, are at $0.62 and $0.51.
This makes the current level (and moment) highly important for XRP, which coincides with CasiTrades’ opinion. As reported yesterday, she explained that the token has approached its final capitulation level with people calling for lower and lower prices. However, she believes the ongoing retracement is “doing exactly what it should,” making it the “perfect market structure.”
Whale Wrecked
The Thursday crash wiped out over 200,000 traders, as the total value of liquidations topped $1.5 billion. One of those was a major bitcoin and XRP whale, who got wrecked hard. Data from Lookonchain shows that almost $48 million in BTC and $28.5 million in XRP in longs were liquidated from a single wallet ending in 0xf79C.
The market crash just wiped out whale 0xf79C’s longs.
His 809.9 $BTC($47.68M) and 27.92M $XRP($28.45M) long positions were fully liquidated, resulting in a $8.42M loss.https://t.co/VDxArX3Y4q pic.twitter.com/VAd7ImvNNb
— Lookonchain (@lookonchain) June 25, 2026
The post What Are XRP’s Most Important Levels After Crash to $1.00? appeared first on CryptoPotato.
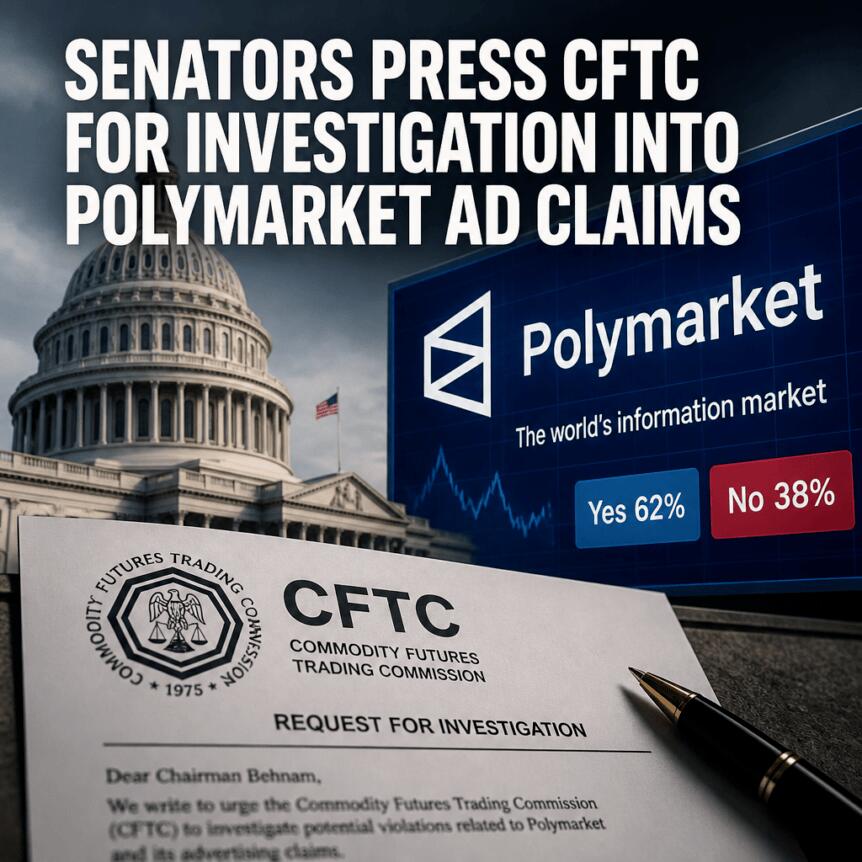
A bipartisan group of US lawmakers has asked the Commodity Futures Trading Commission (CFTC) to examine Polymarket after reports that the prediction market operator paid social media influencers to publish videos depicting fake bets. The request highlights intensifying scrutiny over how prediction platforms market products to US audiences—and whether existing CFTC oversight is sufficient to address deceptive advertising and gambling-style promotion.
In a letter to CFTC Chair Rostin Behnam, Senators John Curtis (Republican) and Adam Schiff (Democrat) said the allegations, if accurate, would point to “deceptive marketing tactics” used to promote gambling-like products. The correspondence follows investigative reporting by The Wall Street Journal and comes as the CFTC’s broader approach to prediction markets remains a subject of legal and policy dispute.
Key takeaways
- US Senators John Curtis and Adam Schiff have asked the CFTC to investigate Polymarket following allegations of deceptive influencer promotion.
- Reports cited by lawmakers describe videos showing fake trades on content styled like Polymarket, with limited or no disclosure that creators were paid.
- The lawmakers questioned whether the CFTC is enforcing existing rules effectively and whether it has the resources to regulate prediction market advertising and conduct.
- The request underscores ongoing tension between federal commodity regulation and state-level efforts to treat prediction markets as gambling or sports betting.
- Institutional compliance teams may face heightened scrutiny of marketing practices, influencer disclosures, and the product characterization used by prediction market platforms.
Senators request CFTC scrutiny over reported influencer promotions
The senators’ letter—sent to the CFTC—centers on concerns that Polymarket allegedly used influencer campaigns to promote its platform using content that did not reflect real trading activity. According to reporting by The Wall Street Journal, Polymarket paid influencers to record videos of “fake bets” on websites resembling the platform, and many creators reportedly did not disclose that they were being compensated by Polymarket.
The Journal said it reviewed more than 1,100 videos and found that roughly 70% depicted fake bets totaling nearly $2 million. The senators framed the conduct, if verified, as both a consumer protection and regulatory enforcement issue—arguing that marketing practices can distort how US audiences perceive the risks and nature of prediction market products.
In response to the earlier reporting, a Polymarket spokesperson told Cointelegraph that the company was “conducting a comprehensive audit” of active promotional content to ensure compliance with its standards and applicable regulatory and legal disclosure requirements.
Regulatory authority and the “gambling-style” framing debate
Beyond the specific allegations, Curtis and Schiff raised broader questions about how prediction markets should be regulated in the US. In their letter, they argued that the CFTC has repeatedly claimed authority over prediction markets and event contracts, yet they described a marketing environment in which content creators often depict prediction products as “free money.”
The senators contended that these representations provide little basis for treating prediction markets differently from gambling-style offerings. They also warned that the contracts are not in the public interest and should not be treated as derivative products with hedging characteristics.
While the senators’ argument is policy-oriented, it is also operational from a compliance perspective: product characterization affects which regulatory frameworks apply, how marketing claims are reviewed, and whether conduct could be evaluated under commodity laws, anti-fraud standards, or state gambling statutes.
The dispute is occurring against a backdrop of increased prediction market use and regulatory attention. US lawmakers have highlighted concerns about the CFTC’s ability to police content and advertising, including how promotional campaigns influence consumer perceptions—particularly when promotions resemble or mimic real trading.
What the CFTC investigation could examine
The letter asks the CFTC to provide written answers by July 10 to several questions, including whether it is investigating Polymarket, whether the reported advertising practices were legal, and whether the commission has sufficient resources to police prediction markets. The senators’ requests reflect an enforcement focus that goes beyond marketplace mechanics—targeting marketing disclosures, promotional content integrity, and the adequacy of regulatory capacity.
Multiple reports have indicated that the CFTC is considering enforcement steps. CNBC, citing a person familiar with the inquiry, reported that the CFTC has an ongoing and extensive investigation into Polymarket, though the timeline for when it began was not disclosed. Polymarket declined to comment on the senators’ letter and on the reported investigation.
In practice, an inquiry of this kind could also involve scrutiny of influencer marketing controls—such as disclosure requirements, the use of simulations or staged content, and whether promotional material could be viewed as misleading. For regulated firms and institutional counterparties, such issues matter because marketing representations can be linked to compliance risk, reputational risk, and potential legal exposure under consumer protection and anti-fraud principles.
Federal vs. state oversight: the broader legal context
The Curtis-Schiff letter arrives amid persistent federal-state regulatory friction over prediction market platforms. The CFTC has argued that it holds authority over prediction markets because platforms are registered with the agency and operate under federal commodities law.
At the same time, the CFTC has pursued litigation tied to state efforts to regulate prediction markets. The regulator has sued nine US states that filed legal action to accuse prediction market platforms of offering unlicensed sports betting through event contracts.
This federal posture remains politically and legally contested. For compliance teams, the key uncertainty is that even when platforms argue they fall within commodity regulation, marketing practices can become a flashpoint—particularly if promotional content is perceived by regulators or litigants as indistinguishable from gambling or sports betting activity.
MiCA is not directly implicated in these US disputes, but the situation offers a broader institutional lesson: cross-border crypto businesses must manage divergent regulatory interpretations across jurisdictions. In the US, characterization battles can flow from product design and contract structure into advertising and promotion, creating compliance obligations that extend well beyond technical listings or trading interfaces.
Closing perspective
As lawmakers press for answers from the CFTC, the immediate focus will likely be on whether promotional campaigns and influencer arrangements complied with disclosure expectations and anti-misleading standards, and what enforcement resources the agency can deploy across a fast-growing prediction market ecosystem. The outcome could shape how regulated platforms structure marketing approvals, manage influencer relationships, and document compliance—while leaving unresolved questions about the line between commodity-regulated contracts and gambling-style promotion.


🎧 Listen to Interview 💻 Watch Video MoneyGram does not need an introduction. The company moves money across roughly 200 countries and territories, some 20,000 corridors, and about 500,000 retail locations, and it has done so for more than 80 years. What has changed is where the plumbing runs…. Read the full story at The Defiant
On-chain analytics firm Glassnode said XRP holders continue to realize more losses than profits, as a key indicator dropped to its lowest level since August 2022. The decline points to intensifying selling pressure as more holders move coins at a loss.
According to the firm’s June 25 update, the 90-day simple moving average of XRP’s Realized Profit-to-Loss Ratio fell to 0.33 from 0.38 on June 9. The metric compares realized profits with realized losses from coins moved on-chain and helps measure the market’s overall profitability.
Realized Profit-to-Loss Ratio Signals Deepening Capitulation
A reading above 1 indicates that realized profits exceed realized losses, while a value below 1 shows that losses dominate. At the current level, the ratio implies that only 33 cents of profit is realized for every one dollar of realized losses.
Glassnode noted that the ratio reached about 50 during XRP’s 2025 market peak, reflecting a period when profit-taking significantly outweighed loss-making sales. The sharp decline since then points to a major shift in market conditions, with more holders exiting their positions at a loss.
Based on these readings, the analytics firm said the market is showing signs of intense capitulation among participants moving coins on-chain. It added that the continued weakness in the ratio suggests capitulation pressure has become more pronounced in recent weeks.
Transaction Fees Decline Alongside Holder Profitability
Separate data shared by the firm on June 9 also showed a steep reduction in activity on the XRP Ledger. The 90-day average of total transaction fees dropped from 5,900 XRP in February 2025 to about 500 XRP, representing a decline of roughly 91.5%.
Together, Glassnode’s charts suggest that weakening network activity has accompanied the deterioration in holder profitability. The realized profit-to-loss ratio climbed sharply during the 2025 rally before falling steadily through late 2025 and into 2026. Total transaction fees followed a similar downward path after the speculative peak.
The weak on-chain readings have prompted mixed interpretations among market participants. Some market participants on X said such low readings could indicate sellers are becoming exhausted. Others pointed to XRP remaining above the $1 level despite the weak profitability data.
The post XRP Selling Pressure Intensifies as Profit-to-Loss Ratio Reaches Multi-Year Low appeared first on CryptoPotato.
Key takeaways:
- SOL’s rebound to $72 shows bullish futures and airdrop hopes, but falling TVL and low DEX volumes point to fragile onchain demand.
- Tokenized stocks spark hype on Solana, yet Pump.fun dependence and Hyperliquid competition threaten sustained SOL momentum.
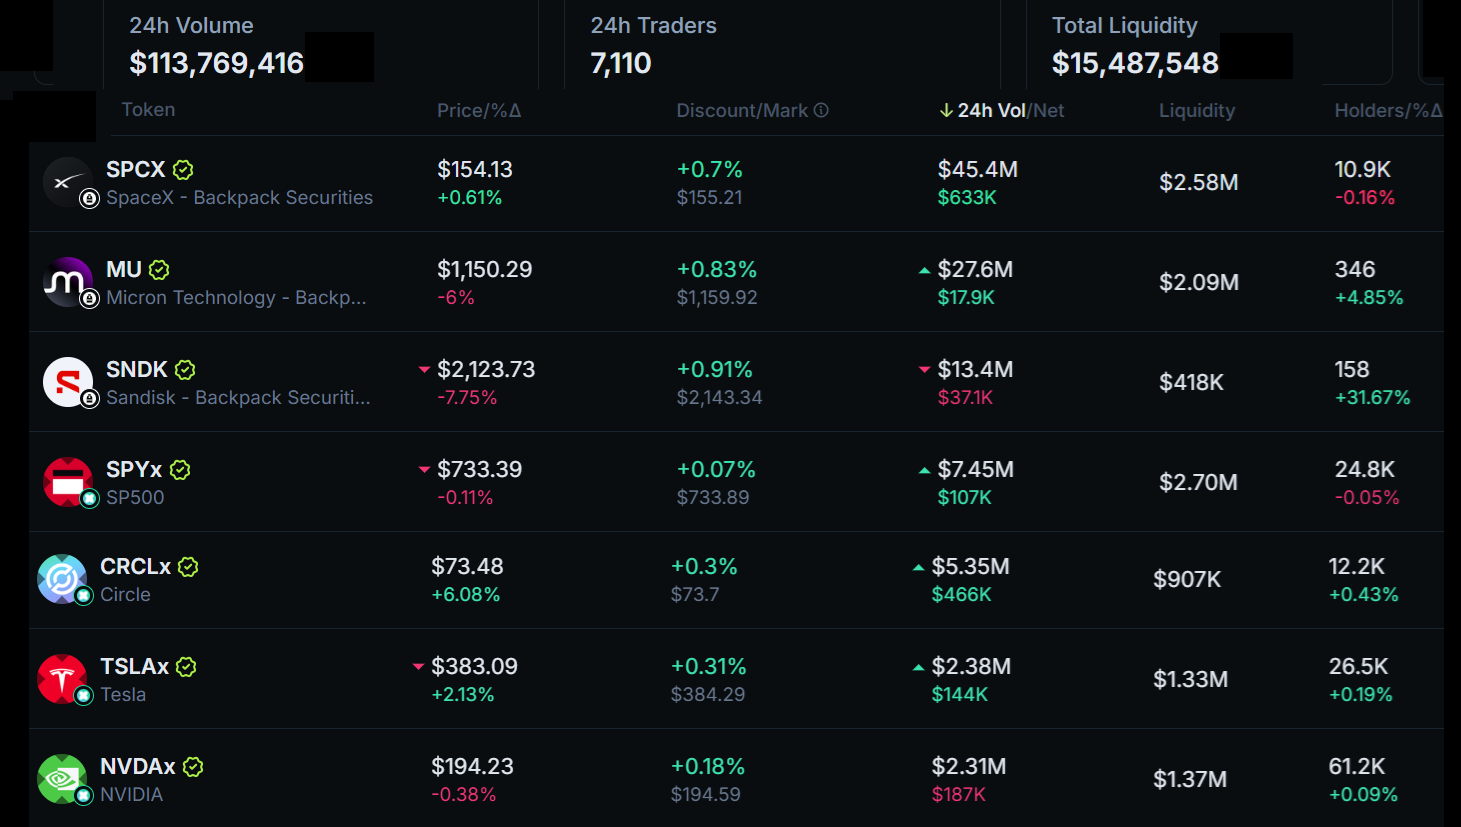
Solana native token SOL jumped to $72 on Friday, distancing itself from the $64 lows the prior day. Part of traders’ optimism stemmed from the stellar growth of tokenized stock trading, fueled by the AI sector. However, increasing competition in decentralized application networks could limit SOL’s short-term upside.

Solana tokenized stocks 24-hour volumes, USD. Source: Jupiter Aggregator
Tokenized stocks on Solana traded over $113 million in 24 hours, according to Jupiter Aggregator data. However, the relatively thin liquidity in the automated market-making pools raised concerns, especially as multiple issuers compete for similar products. Still, some of those tokens launched only recently, which might explain the low number of holders in most cases.
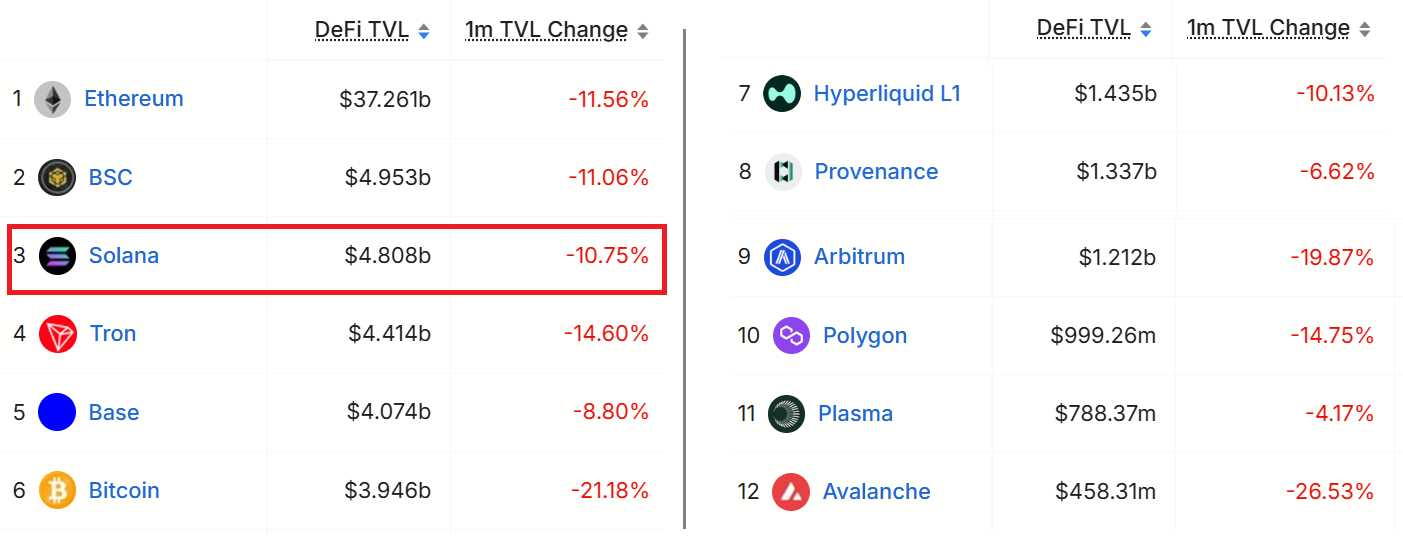
Blockchains ranked by DeFi Total Value Locked (TVL), USD. Source: DefiLlama
The Total Value Locked (TVL) on the Solana network dropped 11% over the past month, while the Ethereum layer-2 Base reduced the gap. Negative highlights on Solana TVL include a 19% decline in Kamino, a 20% trim by Binance Staked SOL, and a 17% decline in Raydium. The tokenization platform xStocks, on the other hand, posted 31% growth in TVL.
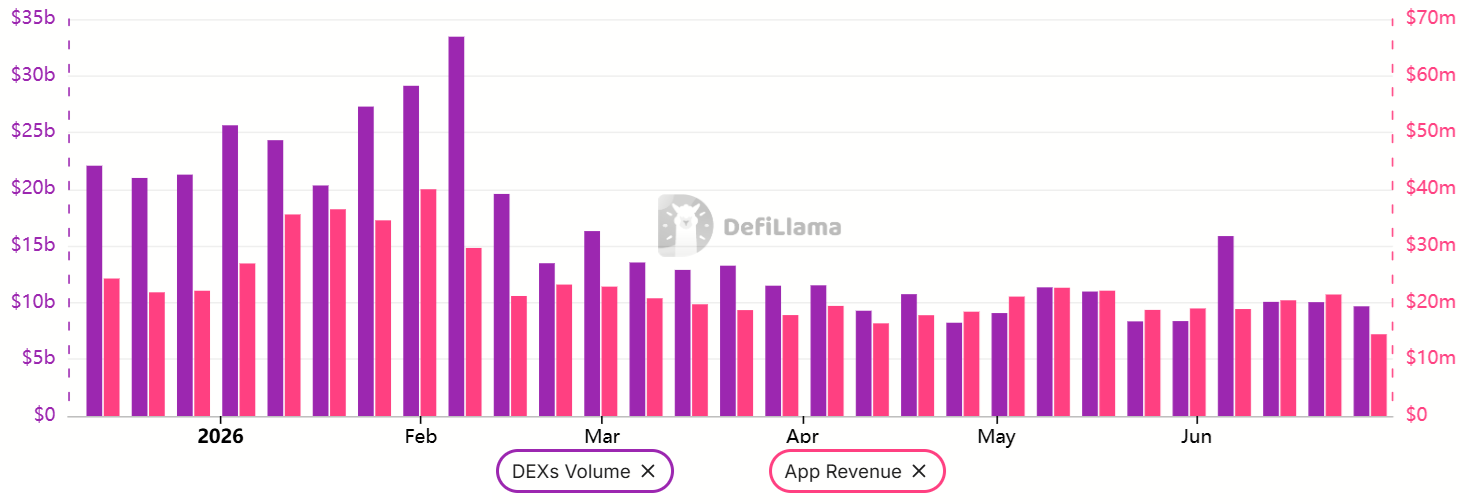
Solana weekly DEX volumes & DApps revenue, USD. Source: DefiLlama
Decentralized exchange (DEX) volumes on Solana fell to $10 billion per week from $30 billion in early February, coinciding with a downtrend in decentralized application (DApp) revenues. Thus, regardless of the successful launch of tokenized tech stocks and equity indexes, demand for SOL on blockchain processing remains subdued.
Solana’s dependence on Pump.fun and increased competition in tokenized launches
More concerningly, 30% of DApp revenue on Solana came from the token launch platform Pump.fun, which depends heavily on memecoin activity. A CoinGecko report revealed that 80% of the 18.7 million tokens launched in less than 48 hours, while 55% of the addresses involved lost up to $1,000 according to Dune data.
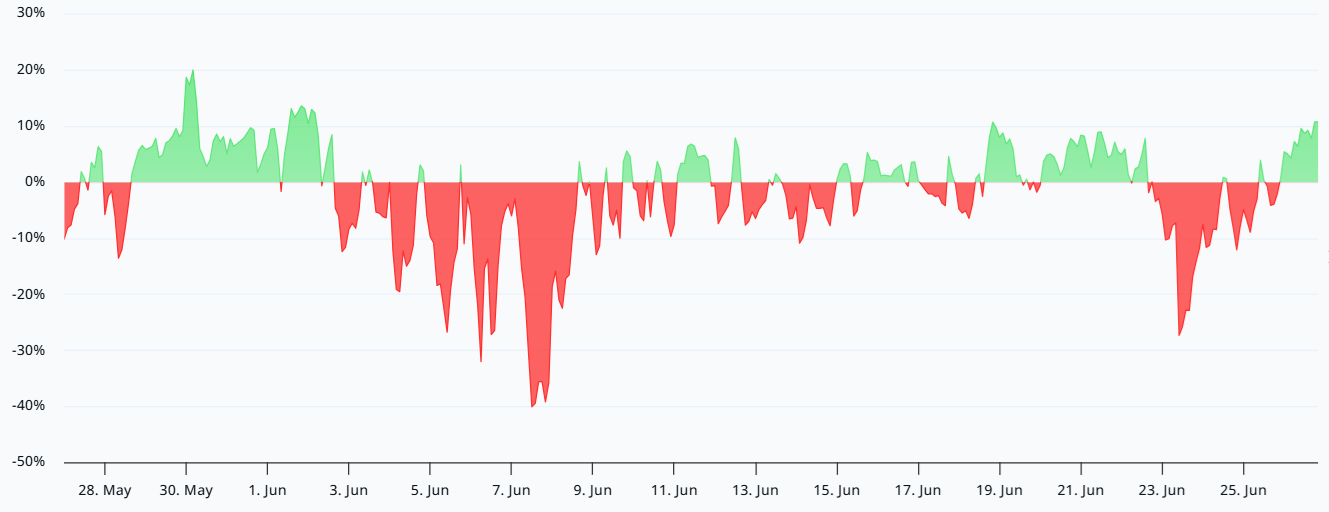
SOL perpetual futures annualized funding rate. Source: Laevitas
Demand for bullish leverage on SOL futures increased on Friday, pushing the funding rate to its highest level in June. The current 10% level is far from displaying excessive confidence, as the 6% to 12% range is typically deemed neutral. Still, the 14% gains since the $64 low on Thursday managed to reverse the bearishness marked by negative funding rates.
Related: Solana grabs 95% of tokenized equity as traders debate if SOL bottom is in
Part of SOL investors’ optimism stems from anticipation of airdrops on the network, although the timing of those tokens’ launch remains uncertain. Highlights include OnRe reinsurance with $200 million in TVL, Bulk perpetual DEX with an aggregate open interest of $325 million, and Loopscale lending platform at $79 million in TVL.
It might be premature to claim that SOL is bound to reclaim the $80 mark, last seen on June 1, given increased competition in tokenized stock trading from Hyperliquid and centralized exchanges on competing blockchains. OKX, for instance, formed a strategic partnership with the NYSE parent company using Ethereum-based systems.
This Friday, we examine Ethereum, Ripple, Cardano, Binance Coin, and Hyperliquid in greater detail.
Ethereum (ETH
This week, Ethereum crashed by 8% as most of the market turned red and key support levels were broken. For ETH, the price has settled at the $1,500 support, which appears to be holding at the time of this post. The current resistance is at $1,800.
The last time this cryptocurrency was at this price level was early 2025. Back then, ETH bounced there, triggering a sustained rally that set a new record price. However, it’s unlikely this will be repeated here.
Looking ahead, Ethereum shows a lot of weakness, and sellers may try to break below $1,500 and turn this level into a key resistance. If successful, then the next major support will be found around $1,000.

Ripple (XRP)
XRP fell by 9% this week and is inches away from losing the support at $1. This is a psychological level that will determine the price action of this cryptocurrency in the weeks and months to come.
If $1 turns into resistance, then the price will likely spend most of the year under this level, with the next key support found at 80 cents. Since sellers have the upper hand, it would take a miracle to stop them at $1.
Looking ahead, XRP is found at a critical junction. Considering the existing downtrend, a price under $1 is very likely as bears continue to dominate. Such a scenario would only prolong the bear market with lower lows.

Cardano (ADA)
This week, ADA closed 12% lower and lost its key support at $0.15. The price failed to hold there, and this level is now acting as a resistance. The last time the price was this low was late 2020.
The recent weakness displayed by Cardano is quite concerning since the downtrend has been accelerating and picking up speed, including in terms of sell volume. Nothing seems able to stop this.
Looking ahead, with buyers gone, the price will be forced to go lower until it finds them, most likely around 10 cents. Best to stay away from ADA until it finally forms a bottom. This appears quite a distance away right now.

Binance Coin (BNB)
Binance Coin remained bearish this week after it lost 2% of its valuation. While that is not significant, the bigger worry is the loss of support at $580, which is now acting as a resistance.
Buyers failed to reclaim that support level, and, being on the defensive, they have likely retreated to the next support at $500. Because of this, the BNB price may slowly grind lower towards that in the weeks to come.
Looking ahead, this cryptocurrency remains in a clear bearish trend with lower highs and lower lows, even if it moved sideways for almost six months in the first part of 2026. Best to be patient on BNB until it finds a bottom as well.

Hype (HYPE)
After a great performance for most of 2026, HYPE appears to struggle now, being unable to make higher highs. The price topped just under $76, and since then, a correction has started with key resistance levels at $76 and $66.
Because of this, the price closed the week 5% lower and also recently tested the support at $60. While that has held to date, it’s likely that the correction will push this cryptocurrency lower, or even to $52, which is the bottom of this ascending channel.
Looking ahead, as long as HYPE can stay above $52, buyers have the advantage. However, any price under $52 would turn the chart bearish and send this into a deeper and sharper correction.

The post Crypto Price Analysis Jun-26: ETH, XRP, ADA, BNB, and HYPE appeared first on CryptoPotato.

Tom Sandoval’s Ex’s Dad Files Counter Restraining Order

When Stripes Meet More Stripes

Group G Finale Carries Must-Win Stakes for Both Sides Friday


-

 Entertainment6 days ago
Renter of Home in Anne Heche Crash Denies Settlement With Son
-
 Sports3 days ago
Two goals and an assist by sheer aura: Cristiano Ronaldo just entered the World Cup chat
-

 Tech5 days ago
Microsoft accidentally kills epic Outlook email threads
-

 Business6 days ago
Soccer-U.S. defends Iran World Cup travel restrictions, says discussions ongoing
-

 Fashion10 hours ago
Weekend Open Thread: Staud – Corporette.com
-

 Politics22 hours ago
The House | Manchesterism won’t survive the painful trade-offs unless it gets citizens on board
-

 Politics7 days ago
Andy Burnham and the meaning of Makerfield
-

 Politics1 day ago
Potential 2028er World Cup attendee leaderboard
-

 Tech1 day ago
A Look At A Gaggle Of Transputer Boards
-

 Business21 hours ago
Asia stock markets slide as tech shares slump
-
Crypto World3 days ago
Bitcoin (BTC) Dips Below $62K, Ethereum (ETH) Plunges 6% Daily: Market Watch
-

 Crypto World3 days ago
Securitize Wraps Roubini's SEC-Registered ETF as Dubai VARA Digital Security
-
 Crypto World1 day ago
Dell (DELL) Shares Tumble Over 5% Following Analyst Downgrade to Hold
-
Business3 days ago
Entergy settles forward sale agreements, raises $672 million in cash proceeds
-
 Crypto World7 days ago
Can Charles Hoskinson Really Rescue Cardano?
-

 Sports7 hours ago
FIH Pro League: India defeat Pakistan 7-1, register biggest win of campaign | Other Sports News
-

 Crypto World11 hours ago
RTX holders must register wallets before token distribution begins
-
Crypto World14 hours ago
Hyperliquid Named on Singapore MAS Investor Alert Register
-

 Crypto World7 days ago
Jake Chervinsky accuses CME of protecting derivatives monopoly
-

 Sports2 days ago
India vs Bangladesh LIVE Score, Women’s T20 World Cup: Bangladesh Opt To Bat; India Enter ‘Do-Or-Die’ Stage As Semi-Final Race Heats Up
You must be logged in to post a comment Login