

Crypto World
Extreme fear at 16: Bitcoin’s bottom signals
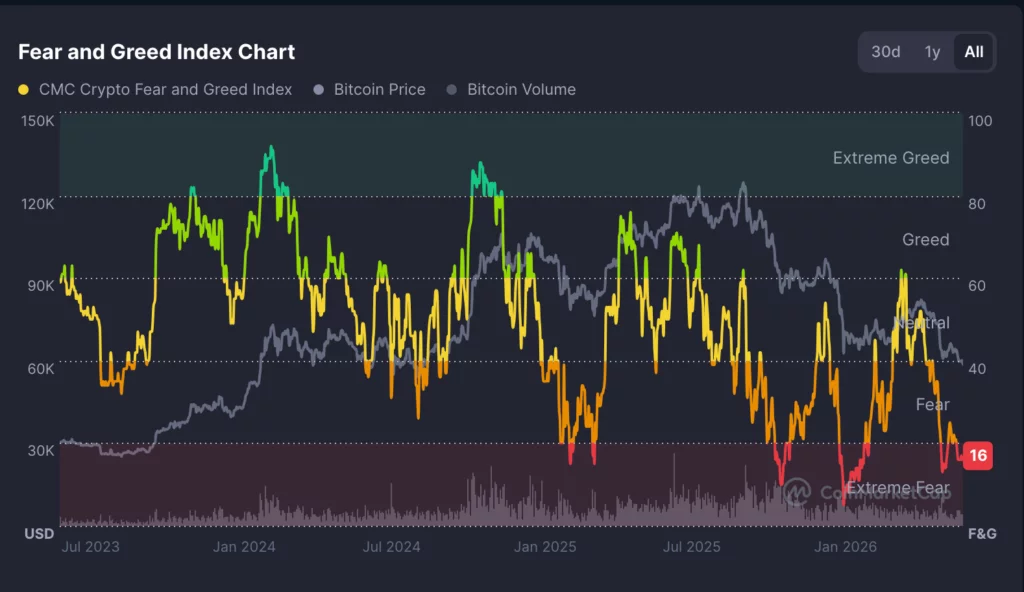
Bitcoin sits near $58,000 to $60,000 with the Fear and Greed Index buried in extreme fear. History says washed-out sentiment often precedes bottoms, but fear is a signal, not a floor. Here are the gauges traders are actually watching.
Summary
- Bitcoin trades near $58,000 to $60,000 as of July 1, 2026, down about 53% from its October 2025 record of $126,198, after back-to-back quarterly losses to open the year.
- The Fear and Greed Index sits around 12 to 16, deep in extreme fear, a zone that has historically appeared near local bottoms but is not a timing tool on its own.
- Bullish positioning signals are stacking up: open interest has collapsed from over $90 billion to about $44.5 billion, leverage is flushed, and coins are leaving exchanges in a pattern that suggests accumulation.
- The bearish counterweight is real: spot Bitcoin ETFs posted a record $4.5 billion of outflows in June, the Fed is hawkish with a likely December rate hike priced in, and one cycle model points to a bottom only around mid-October.
- The signals that would confirm a turn are concrete: reclaiming the 20-day and longer moving averages, a flip back to ETF inflows, open interest rebuilding alongside price, and the fear gauge lifting off its extremes.
Extreme fear is one of the most misread conditions in markets. When the Fear and Greed Index drops into the low teens, the crowd reads it as a reason to run, and the contrarian reads it as a reason to buy. Both are oversimplifying. Sentiment this low tells you that positioning is stretched and conviction is gone, which is often the raw material of a bottom, but “often” is not “now,” and fear can always get more extreme before it breaks.
The useful move is not to treat the fear gauge as a signal by itself, but to read it alongside the harder data on positioning, flows, and price. This piece walks through the signals traders are watching, lays out the bullish and bearish readings of each, and identifies what would actually confirm that the turn has arrived. The key point is simple: fear tells traders to pay attention, not to assume the bottom is already in.
What the Fear and Greed Index is saying
Start with the gauge everyone quotes. The Fear and Greed Index compresses several inputs, volatility, momentum, volume, and social signals, into a single 0 to 100 reading, and the latest chart still shows the market deep in extreme fear. Historically, readings this low have clustered near local bottoms, because they mark the point where sellers have largely exhausted themselves and the marginal holder is fearful rather than greedy. That is the contrarian appeal: when nobody wants the asset, much of the selling may already be done.

The caution is that the index is a description of the present, not a prediction of the future. Extreme fear can persist for weeks, and it can deepen. During genuine downtrends, the gauge has sat in fear for long stretches while price kept falling, so treating a low reading as an automatic buy signal has burned plenty of traders. The right way to use it is as context: it tells you the emotional backdrop is washed out, which raises the odds that other bottoming signals are meaningful, without confirming anything on its own.
That is why how the index works matters before using it as a trading signal. The number is useful because it summarizes the market mood, but it is not a floor under price. For confirmation, traders still need price levels, ETF flows, leverage data, and macro conditions to line up.
Signal one: positioning has reset
The most constructive signal under the surface is what happened to leverage. Open interest in Bitcoin derivatives has collapsed from above $90 billion to roughly $44.5 billion over recent weeks, less than half its peak. That drop reflects long liquidations, profit-taking, and traders reducing speculative exposure. In plain terms, the leverage that builds up in a rally and makes a market fragile has been flushed out.
Why this matters for a turn is mechanical. A market loaded with leveraged longs is vulnerable, because small drops trigger liquidations that cascade into larger drops. A market where that leverage has been cleared is sturdier, because the forced-selling fuel is gone. Resets like this often precede bottoms, since they remove the overhang that drags price lower and leave room for fresh positioning to push the other way.
The bearish reading is that falling open interest also signals fading demand and cautious participation, not just healthy deleveraging. Traders stepping back can mean they see no reason to buy, and a market with thin conviction can drift lower on light volume. The reset is a necessary condition for a durable bottom, but it is not sufficient by itself, because clean positioning can still sit under a price that keeps grinding down.
Signal two: exchange flows and accumulation
The second signal comes from where the coins are moving. Through the drawdown, Bitcoin has seen exchange outflows exceed inflows, meaning more coins are leaving exchanges than arriving. That pattern is typically read as accumulation: holders pulling coins into self-custody or long-term storage rather than keeping them on exchanges ready to sell. When supply leaves the venues where selling happens, it thins the pool of coins available to hit the market.
The bullish interpretation is that long-term holders are quietly buying weakness while short-term traders panic, a divergence that has marked accumulation phases before. Steady outflows during extreme fear suggest conviction underneath the fear, the kind of hands that absorb selling and set the base for a recovery. That is the constructive version of the on-chain story, and it fits with the broader idea that the market is moving from forced selling toward accumulation.
The counterpoint is that exchange flows are noisy and can reflect custody shifts, institutional plumbing, or one-off moves rather than genuine accumulation. Outflows are encouraging, but they are a soft signal, easily overstated. On their own they confirm that some holders are unbothered, not that the bottom is in. They matter most when they line up with stronger evidence from ETF flows and price.
Signal three: the ETF bid
The third signal is the one cutting against the bulls, and it is the most important on the bearish side. Spot Bitcoin ETFs recorded about $4.5 billion of net outflows in June 2026, their worst month since launching, removing the steady institutional bid that had cushioned earlier declines. The funds that were supposed to represent durable, price-insensitive demand instead became a source of selling, and their flows have tracked the drawdown closely.
This matters because the ETF bid was a structural change in how Bitcoin traded. When it was flowing in, it provided a floor of consistent demand. When it reverses, that floor becomes a headwind, and the market has to find other buyers to absorb the redemptions. For sentiment to turn convincingly, this is the signal that most needs to flip.
A return to sustained ETF inflows would tell the market that institutions are stepping back in, which would validate the bullish reading of the other signals. Continued outflows would keep the pressure on regardless of how washed out the fear gauge looks. That is why the ETF bid that reversed deserves more weight than a sentiment reading alone. In this cycle, flows are not a side detail; they are one of the main channels moving the market.
Signal four: oversold technicals
The fourth signal is on the chart. The relative strength index has dropped near 30, the oversold threshold, indicating that momentum has fallen far and fast and that the move may be stretched to the downside. Price sits near support in the $58,000 area, below the 20-day exponential moving average around $62,450, and well beneath the longer-term moving averages, the 200-day near $65,200 and the 50-month near $65,600, that mark the bull-bear boundaries.
The bullish read is that oversold conditions at support are where reversals begin, and a bounce off the high $50,000s that reclaims the moving averages would signal the downtrend is weakening. The bearish read is that oversold can stay oversold in a strong downtrend. Until price actually reclaims those moving averages, the path of least resistance points lower, with a break below support opening the door toward the mid-$50,000s. The technicals frame the levels, but they do not resolve the direction until price picks one.
That is why the level-based bottom question matters alongside sentiment. Bitcoin does not bottom because the index is low; it bottoms when buyers defend levels, reclaim resistance, and force trend-followers to change position. The fear gauge tells traders the market is stretched. The chart tells them whether the stretch is becoming a reversal.
The bull read: capitulation precedes bottoms
Put the constructive signals together and a coherent bottoming case emerges. Extreme fear, flushed leverage, steady accumulation, and oversold momentum are the classic ingredients of capitulation, the moment when the last weak hands sell and stronger hands absorb the supply. In prior cycles, this combination has marked the exhaustion of a downtrend, the point where selling pressure runs out because everyone inclined to sell already has. In this reading, the current setup looks less like the start of a new collapse and more like the late stage of a forced reset.
The bull case also treats the record ETF outflows as a lagging sign of the same capitulation instead of a fresh catastrophe. Institutions derisked into weakness, leverage was cleared, and sentiment collapsed into extreme fear. If that selling has already happened, the market may be closer to a base than the headline fear suggests. The reset positioning and the accumulation on-chain suggest a foundation is forming under the panic.
If that is right, the setup favors a recovery once a catalyst arrives to flip sentiment, and the extreme fear reading becomes, in hindsight, the marker of the low. This is the contrarian thesis, and the data gives it real support. The key caveat is timing: a market can be in a bottoming zone before the actual bottom is printed. Bulls still need confirmation before calling the turn.
The bear read: fear can deepen
The opposing case is equally grounded, and it starts with the fact that Bitcoin is down about 53% from its high with back-to-back quarterly losses, a genuine bear market instead of a shallow dip. Deep drawdowns can extend, and washed-out sentiment can get more washed out. The macro backdrop offers no relief: the Fed is hawkish under its current chair, markets are pricing a strong chance of a December rate hike as inflation drifts back toward 4%, and a key jobs report looms, all of which pressure risk assets like Bitcoin, which trades as high-beta risk far more than as a haven.
There is also a timing argument. One cycle model notes that bear-market corrections have averaged about 12 months, which, measured from the October 2025 record, points to a bottom only around mid-October 2026. By that reading, the current fear could be a stop along the way instead of the destination, with more downside and more time required before a durable low. The record ETF outflows, in this frame, are an active headwind, not a capitulation tail.
Fear is a signal, not a floor, and it can persist far longer than the impatient expect. The chart can stay oversold, ETF flows can stay negative, and macro can keep forcing risk assets lower. That does not invalidate the bottoming signals; it simply means they are conditions, not confirmations. The bear case is strongest as long as price remains below the key moving averages and the ETF bid stays absent.
What would confirm a turn
The way to cut through the debate is to watch for confirmation instead of guessing at the bottom. Four signals would mark a genuine turn. The first is price reclaiming the 20-day EMA near $62,450 and then the heavier resistance around $64,000, which would break the pattern of lower highs and put buyers back in control. The second is ETF flows flipping from outflows back to sustained inflows, the clearest sign the institutional bid has returned.
The third is open interest rebuilding alongside a rising price, which would show fresh capital coming in with conviction instead of a low-volume drift. The fourth is the Fear and Greed Index lifting off its extremes, confirming that the emotional backdrop is normalizing. Until several of those align, the constructive signals remain a setup instead of a trigger. Extreme fear, reset leverage, and accumulation describe a market that could turn, not one that has.
The discipline is to treat washed-out sentiment as a reason to watch closely, while waiting for price and flows to confirm before concluding the low is in. That is how experienced traders use a reading in extreme fear: not as a buy button, but as a cue to track the signals that actually mark the turn. The lower the fear gauge falls, the more important confirmation becomes, because the emotional temptation to act early grows stronger.
How this fear compares with past bottoms
Extreme fear is not new, and prior episodes offer a rough guide to how it tends to resolve, with a large caveat. In earlier cycles, the deepest fear readings have often clustered near major lows, appearing when a drawdown was closer to its end than its beginning, precisely because fear peaks when selling has run far. The pattern that has marked durable bottoms combines washed-out sentiment with flushed leverage and steady accumulation by long-term holders, the same three ingredients visible now. On that template, the current setup rhymes with past bottoming conditions.
The caveat is that the template has failed often enough to demand humility. Extreme fear has also appeared in the middle of downtrends, not just at their ends, and readers who bought every low reading in a bear market bought too early more than once. The difference between a fear reading that marks a bottom and one that marks a pause is usually not visible in the sentiment gauge itself. It shows up later, in whether price reclaims key levels and whether the institutional bid returns.
There is also a structural change that makes the comparison imperfect. The presence of spot ETFs has altered how Bitcoin trades, adding a large, flow-driven institutional participant that did not exist in earlier cycles. That means past bottoming patterns, built in a market without ETFs, may not map cleanly onto this one. The ETF flows can amplify moves in both directions, which is why the record June outflows matter so much and why this cycle’s bottom may look different from the ones the historical template describes.
The macro calendar that matters
Because Bitcoin is trading as a high-beta risk asset, the signals most likely to flip or deepen sentiment are macroeconomic, and the calendar is crowded. The nearest is the monthly jobs report, a read on labor-market strength that feeds directly into rate expectations: a hot number would reinforce the case for the Fed staying tight, pressuring risk assets, while a soft number could revive hopes for easier policy and lift them. Traders watching for a sentiment turn are watching that print closely. It is not a crypto-native signal, but it can decide whether crypto-native bottoming signals actually matter.
Further out sits the Fed itself. With markets pricing a meaningful chance of a December rate hike as inflation drifts back toward 4%, each inflation report and each Fed meeting becomes a potential catalyst. A hawkish surprise would deepen the risk-off mood that has weighed on Bitcoin, while any sign the tightening is ending could mark the macro turn that a sentiment-driven bottom needs. The path of rates, more than any crypto-native signal, is the backdrop against which the fear gauge will either normalize or sink further.
The practical point is that a durable turn in Bitcoin sentiment probably requires a shift in the macro wind, not just an oversold chart. The internal signals, reset leverage, accumulation, extreme fear, describe a market primed to respond, but the trigger is likely to come from outside crypto: a softer labor market, a friendlier inflation path, or a Fed that signals the end of tightening. Until the macro calendar delivers one of those, the constructive crypto signals remain a coiled setup waiting for a catalyst, which is why traders track the economic data as closely as the order book right now.
The one signal that matters most
With so many gauges flashing at once, it helps to rank them, and in this cycle one signal outranks the rest: the ETF bid. Before spot Bitcoin funds existed, a bottom was mostly a story about on-chain holders, leverage, and sentiment, the classic signals. Those still matter, but the arrival of ETFs added a large, flow-driven institutional participant whose buying and selling now sets much of the marginal price. When that participant is buying, it provides a steady floor. When it is selling, as it was through the record June outflows, it becomes a persistent drag that the other signals cannot easily overcome.
That is why the ETF flow number deserves more weight than the fear gauge or the RSI. Extreme fear can mark a bottom, reset leverage can prime one, and accumulation can build a base, but none of them forces the institutional bid to return. The flows do that directly. A market can sit at extreme fear with clean positioning and still grind lower if the funds keep redeeming, because the redemptions are real selling that has to be absorbed.
Conversely, a decisive flip back to sustained inflows would validate every other constructive signal at once, confirming that the capitulation the other gauges describe has actually ended. The practical takeaway is a hierarchy. Treat the ETF flows as the primary confirmation, the signal that most reliably separates a real turn from a false one. Treat reset leverage and on-chain accumulation as supporting evidence that the setup is favorable. Treat extreme fear and oversold technicals as context that raises the odds without confirming anything.
The macro calendar is the likely trigger that moves the flows one way or the other. Reading the signals in that order, flows first, positioning second, sentiment last, is how to avoid the classic trap of buying extreme fear too early. The gauge in extreme fear tells you the market is primed. The ETF flows will tell you when it has actually turned.
Frequently asked questions
What does a Fear and Greed reading near 16 mean?
It means the index sits deep in extreme fear, its lowest zone, reflecting washed-out sentiment across volatility, momentum, volume, and social signals. Historically, readings this low have appeared near local bottoms because much of the selling may be exhausted. But it is a description of the present, not a prediction, and extreme fear can persist or deepen during a real downtrend.
Is extreme fear a reliable buy signal?
Not on its own. Low readings raise the odds that a bottom is near, but sentiment can stay fearful for weeks while price keeps falling. It is best used as context alongside harder data on positioning, flows, and price, instead of as a standalone trigger. Treating a low reading as an automatic buy has repeatedly caught traders too early.
Why does falling open interest matter?
Open interest dropping from over $90 billion to about $44.5 billion means leverage has been flushed out through liquidations and derisking. That makes the market sturdier, because the forced-selling fuel that drives cascading drops is gone, which often precedes bottoms. The caveat is that falling open interest can also signal fading demand, so it is a necessary but not sufficient condition for a turn.
What are exchange outflows telling us?
More Bitcoin has been leaving exchanges than arriving, a pattern typically read as accumulation, with holders moving coins into storage instead of keeping them ready to sell. It suggests conviction underneath the fear. But exchange flows are noisy and can reflect custody or institutional shifts, so they are a soft signal that some holders are unbothered, not proof the bottom is in.
Why are the ETF outflows so important?
Spot Bitcoin ETFs posted a record $4.5 billion of outflows in June 2026, turning the steady institutional bid that once cushioned drops into a headwind. Because that bid was a structural support, its reversal is the signal that most needs to flip for a convincing turn. A return to sustained inflows would validate the bullish case, while continued outflows keep pressure on regardless of sentiment.
Where is Bitcoin’s key support and resistance?
Support sits near the $58,000 area, and reclaiming the 20-day EMA around $62,450 is the first upside test, followed by heavier resistance near $64,000 and the longer-term moving averages around $65,200 to $65,600. RSI near 30 shows oversold momentum. A break below support opens the door toward the mid-$50,000s, while reclaiming the moving averages would signal the downtrend is weakening.
Could Bitcoin fall further from here?
Yes. Bitcoin is down about 53% from its record with back-to-back quarterly losses, and deep drawdowns can extend. A hawkish Fed, a likely December rate hike, and looming jobs data pressure risk assets, and one cycle model points to a bottom only around mid-October 2026. Extreme fear is a signal, not a floor, and it can persist longer than expected.
What would confirm that Bitcoin has turned?
Four signals: price reclaiming the 20-day EMA near $62,450 and then resistance around $64,000, ETF flows flipping back to sustained inflows, open interest rebuilding alongside a rising price, and the Fear and Greed Index lifting off its extremes. Until several align, the constructive signals describe a market that could turn instead of one that has, so confirmation should come before conviction.
Disclaimer: This article is for information purposes only and does not constitute financial, investment, or trading advice. Cryptocurrency prices are highly volatile, and technical and sentiment analysis is speculative and may not predict actual movements. Nothing here is a recommendation to buy or sell any asset. Always do your own research and consider consulting a licensed professional before making financial decisions. Figures are accurate as of July 1, 2026, and will change.

Forward Industries has expanded its Solana treasury after buying more than 500,000 SOL during fiscal Q3 2026.
Summary
- Forward Industries bought over 500,000 SOL, raising its treasury to 7.55M SOL by June 30.
- The company reported 36% annualized SOL-per-share growth while selling 93,642 shares during fiscal Q3 2026.
- Earlier losses show Solana treasury firms remain exposed to price swings and U.S. accounting rules.
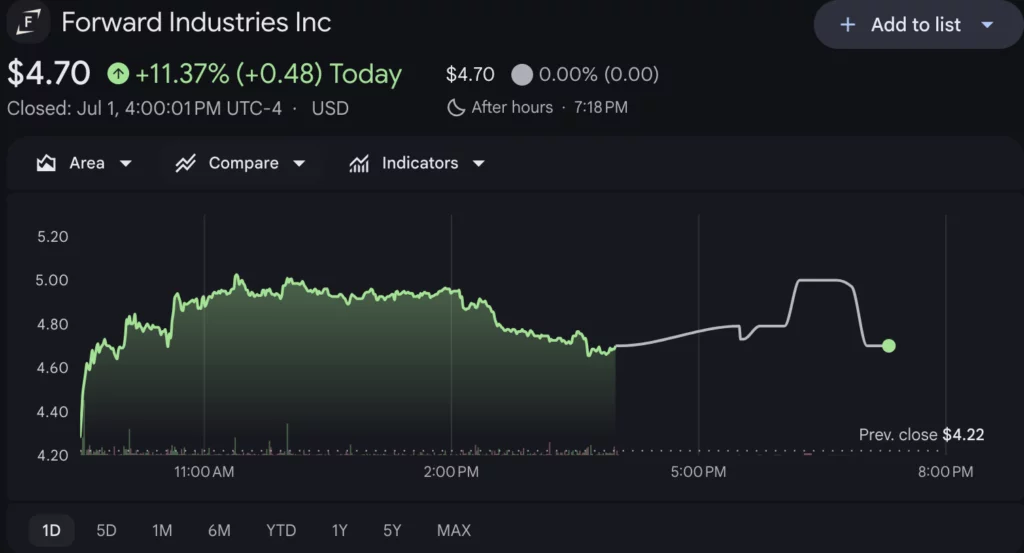
The Nasdaq-listed company said its total holdings reached 7.55 million SOL as of June 30.
The company bought the tokens at an average price of about $79 per SOL. It also said SOL per fully diluted share rose to 0.0729 from 0.0669 at the end of the prior quarter.
Forward Industries stock recently traded at $4.70 on Nasdaq, up more than 10% in the past day, with an intraday high of $5.04 and volume above 3 million shares (per Google Finance data).

Forward Industries said the increase represented 36% annualized SOL-per-share growth. The update comes as the company continues to build its Solana treasury while earlier filings show how crypto price moves have shaped its reported results.
Forward Industries expands Solana holdings
In a July 1 company release, Forward Industries said it sold 93,642 common shares through its At The Market offering during fiscal Q3. The company said it used public market capital in a way that raised SOL per share for existing shareholders.
Forward described itself as the largest Solana treasury company. It said its recent inclusion in the Russell 2000 and Russell 3000 indexes gives it wider access to institutional investors when its shares trade above net asset value.
The company also said it can borrow against fwdSOL collateral through institutional partners. Forward said this lets it seek liquidity at a lower cost than its staking yield, which it placed between 6.4% and 7.3%.
Forward links strategy to SOL per share
“Our mandate is simple: maximize SOL per share and create long-term shareholder value,” said Chief Investment Officer Ryan Navi. He said the company uses several capital formation methods to add SOL in a way it views as accretive.
Navi added that Forward can repurchase shares when they trade below net asset value and issue equity when they trade above it. He said the Russell index additions could also widen the company’s investor base and help fund more SOL purchases.
Forward also pointed to Solana network activity in a separate X post. The post quoted SolanaFloor data saying daily, weekly, and monthly Solana transaction counts had reached record levels across measured timeframes.
Earlier losses remain part of the story
The latest purchase follows a period of reported losses tied to SOL price changes. As previously reported, Forward Industries neared a $1 billion Solana paper loss after the company reported a $585.6 million net loss for the quarter ended Dec. 31, 2025.
That earlier result included a $560.2 million loss on digital assets and a $33 million impairment under U.S. GAAP treatment. The company said the loss reflected fair-value accounting for its SOL holdings, not a direct cash outflow.
In addition, Forward also transferred 455,784 SOL to Coinbase Prime in June. That move drew attention because deposits to prime brokerage platforms can serve several purposes, including custody, liquidity management, collateral use, or asset sales.
Solana treasury model faces market test
Forward launched its Solana treasury strategy in September 2025 with backing from investors and partners including Galaxy Digital, Jump Crypto, and Multicoin Capital. The company says its strategy includes buying, holding, staking, trading, and investing in SOL-related assets and projects.
The broader digital asset treasury sector has faced pressure during crypto market declines. As crypto.news reported, treasury companies tied to Bitcoin, Ethereum, and Solana have carried large unrealized losses as token prices fell.
Forward’s Q3 update shows that the company is still adding SOL despite earlier losses. The central measure it is asking investors to watch is SOL per fully diluted share. That metric now sits higher than the prior quarter, while the value of the treasury still depends on SOL market prices, staking revenue, borrowing costs, and shareholder dilution.


Binance said its Direct Stocks product crossed $1 billion in U.S. equities acquired within 30 days of launch.
Summary
- Binance’s Direct Stocks crossed $1B in user-held U.S. equities within 30 days of launch globally.
- Emerging markets made up 73% of users, showing demand for app-based access to U.S. stocks.
- Stablecoins helped users buy fractional equities beside crypto without traditional brokerage and bank transfer barriers.
The product went live on June 1 and gives eligible users access to more than 7,000 U.S. stocks and ETFs in the same app they use for crypto.
The exchange said the product also processed close to $3 billion in trading volume during the same period. The 30-day window included 22 trading days, according to a Binance blog post.
Binance said about 73% of Direct Stocks users came from emerging markets. The company framed the data around demand from regions where brokerage accounts, bank wires, minimum balances, and foreign market access have often limited retail participation.
Binance stock access gains early demand
Direct Stocks lets users buy fractional U.S. stocks and ETFs with stablecoins and selected crypto balances. As previously reported, Binance opened U.S. stock trading access for eligible non-U.S. users in June, offering more than 7,000 equities and ETFs with purchases starting from $5.
The product places equities beside crypto balances in one interface. Binance said the setup removes some steps tied to traditional brokerage access, including separate bank transfers and new account flows. The company said users acquired more than $150 million in U.S. equities per day during the first 30 days.
Emerging markets drive the user base
Binance said emerging markets accounted for most Direct Stocks users. The company also said about one in seven visitors to its stock trading page registered an account, and nearly 90% of those new sign-ups placed a trade.
The data follows earlier Binance Research claims about broader demand for equity access through crypto exchanges. As reported by crypto.news, Binance Research projected that crypto exchanges could bring 300 million new equity investors and $2 trillion in new capital into global stock markets by 2031. The report linked that growth to stablecoins, crypto exchange reach, and users in underbanked regions.
Shunyet Jan, Binance’s Head of Spot and Derivatives Business, said, “A billion dollars in 30 days is a sign of the demand that’s been waiting decades for a door to walk through.” He added that Binance built the product for users who “never had a way in.”
Stock trading uses broker-linked rails
Binance does not custody the securities traded through Direct Stocks. Binance disclosed an Alpaca stake as its stock trading service expanded. Nest Trading acts as introducing broker, while Alpaca handles execution, clearing, settlement, custody, dividends, and corporate actions.
The model gives Binance exposure to traditional equities while keeping securities activity linked to regulated brokerage partners. Users fund stock purchases with stablecoins and supported crypto assets. Binance said the product targets eligible users outside the U.S.
Tokenized equity race widens
The direct stock rollout comes as exchanges add more equity-linked products. Crypto.news reported that Binance launched bStocks, letting eligible users convert supported U.S. stock holdings into tokenized assets that can trade around the clock.
Moreover, other exchanges are also moving into stock access. Bitget launched Stock+, allowing eligible users to buy real U.S. stocks with crypto converted into USDC through regulated brokers.
Binance said technology stocks made up the largest share of Direct Stocks holdings. It said the technology sector accounted for about 71% of holdings, while semiconductor names made up around 48%. The company also projected that Direct Stocks could exceed $10 billion by the end of 2026 if current growth continues, though it said the projection was illustrative and not a guarantee.
Crypto World
FBI Director Kash Patel caught sleeping on required disclosure of six-figure MSTR investment


FBI Director Kash Patel failed to timely disclose a six-figure purchase of stock in Strategy (MSTR), the world’s largest publicly-listed bitcoin holder, according to a report by nonpartisan news outlet NOTUS.
Patel supposedly purchased between $100,001 and $250,000 worth of MSTR on Nov. 21, but did not report the trade to regulators until May 26.
The reason for the delay? miscommunication. Patel informed the Office of Government Ethics that he “inadvertently omitted” the transaction due to an unspecified “miscommunication.”
According to the Stop Trading on Congressional Knowledge (STOCK) Act, high-ranking executive branch officials need to publicly disclose individual stock trades over $1,000 within 45 days from the transaction.
The trade has drawn intense scrutiny from government watchdogs due to Strategy’s BTC accumulation business and its previous business with federal agencies.
The company, which according to NOTUS has done millions of dollars in business over the years with the Justice Department, calls itself as a “Bitcoin Treasury Company,” and aggressively accumulates BTC as its primary reserve asset. Since 2020, the company has built a coin stash of 847,363 BTC, worth over $50 billion as of this writing.

French Interior Minister Laurent Nuñez has promised a “more ambitious” approach to tackling crypto ransom attacks after confirming there were 77 kidnapping, extortion or attempted extortion incidents linked to crypto in the first half of 2026.
Nuñez said Tuesday that the 77 incidents recorded so far this year are up sharply from the 45 recorded in all of 2025, according to local outlet BFM Business.
“These are serious matters, and your concern is legitimate,” he told the Association for the Development of Digital Assets (ADAN) as he promised more government support.
France has become one of the biggest hot spots for crypto wrench attacks, where criminals use physical violence to coerce victims into handing over crypto. Approximately 11% of French people own cryptocurrencies, according to ADAN, which equates to about 7.3 million people.
France’s rapid alert and protection system
Earlier this year, French authorities launched a dedicated prevention platform and a rapid-alert and protection system for crypto holders and professionals, which has attracted 724 sign-ups so far, Nuñez said.
Nuñez said that emergency measures have resulted in 200 arrests, with one recent attacker being arrested within eight hours on Friday, thanks in part to the victim using an emergency identification hotline.
Related: StarkWare introduces ‘Private KYC’ to address personal data breaches
Nuñez promised a “more ambitious” three-part plan to reinforce security measures for the crypto sector. This includes stronger intelligence-sharing, since criminal networks are often based abroad, a deeper partnership with ADAN and better operational coordination between security services.
French wrench attacks on the rise
Blockchain security firm CertiK reported in May that wrench attacks globally were up 41% in the first four months of 2026, compared with the same period last year, with most attacks in Europe.
The firm said France is the “epicenter” of attacks because of the presence of several flagship industry companies and their executives, a “culture of flexing and voluntary doxxing that remains deeply embedded in the community,” and proven exposure from numerous sensitive data leaks.
David Balland, co-founder of French hardware wallet maker Ledger, was kidnapped and held for ransom along with his partner in January 2025 before being rescued by police.
Ledger suffered one of the industry’s most damaging data breaches when its customer database was hacked in 2020, resulting in the leak of more than 270,000 personal records and a wave of phishing and wrench attacks that continue to this day.
“France ranks among the most targeted countries in the world for this type of breach,” CertiK said.
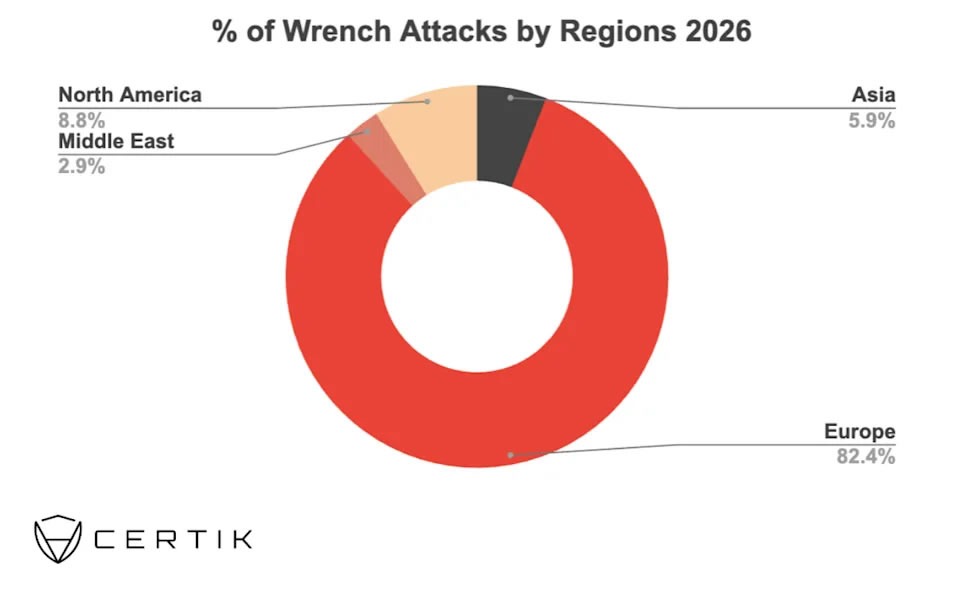
Europe is becoming a hotbed for wrench attacks in 2026. Source: CertiK
Magazine: Bitcoin slides to $58K, XRP hits $1 but onchain data promising: Market Moves
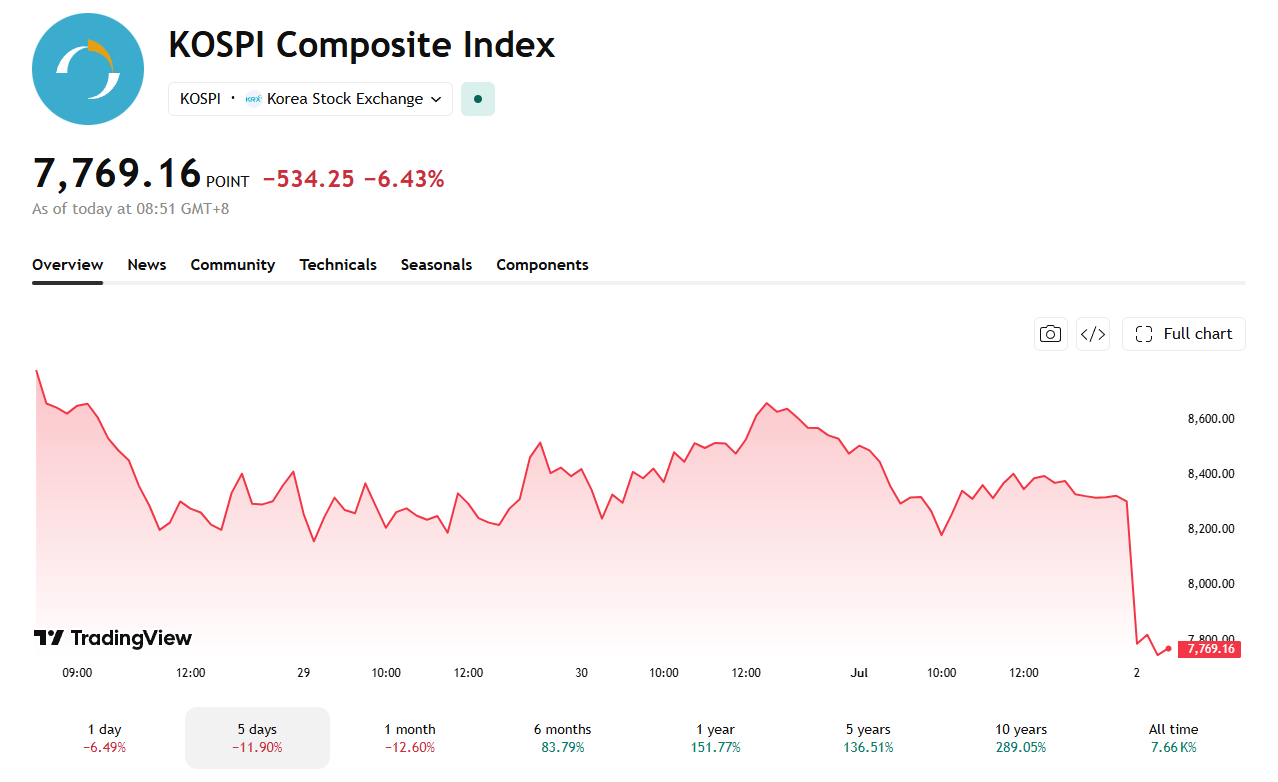
The KOSPI sank below 8,000 on July 2. The drop pushed the Korea Exchange (KRX) to activate a sell-side sidecar within minutes of the opening bell.
The Korea Exchange suspended program trading on KOSPI-listed shares for five minutes. Heavy selling in semiconductor stocks drove the move. The benchmark opened 4.46% lower and kept falling from there.
Another Halt in a Record-Breaking Year
The index had dropped 534.25 points, or 6.43%, to 7,769.16 by 9:51 a.m. local time. A sell-side sidecar triggers automatically once KOSPI 200 futures fall 5% or more for at least one minute.

Thursday’s pause is far from an isolated event. The exchange has repeatedly triggered sidecars and circuit breakers throughout 2026. Volatility this year has already topped the 2008 financial crisis, when the KOSPI set its prior annual sidecar record of 26 halts.
By late June, the KRX had logged close to 30 sidecar activations and five circuit breakers this year alone. Both figures already beat that 2008 tally.
Chipmakers Bear the Brunt
Samsung Electronics and SK Hynix together make up roughly half of the KOSPI’s market capitalization. The two chipmakers have repeatedly driven these swings. Their shares extended losses again Thursday, tracking a global chip stock selloff that started on Wall Street overnight.
The Nasdaq Composite slid 0.66% Wednesday. The VanEck Semiconductor ETF lost 5.4%. Micron Technology and Sandisk each dropped more than 10%. The rout followed weeks of sharp reversals in the KOSPI’s chip-driven rally, a rally that had pushed the index to record highs earlier this year.
Semiconductor stocks still dominate the index. Traders now face a familiar question: will Thursday’s selloff deepen further, or fade as quickly as prior swings have this year.
The post KOSPI Drops Below 8,000, Triggers Yet Another 2026 Trading Halt appeared first on BeInCrypto.
Senator Cynthia Lummis defended the Clarity Act against Senator Elizabeth Warren, rejecting claims that the digital-asset bill creates illicit finance loopholes and pointing to more than 16 safeguards written into the legislation.
The Wyoming Republican responded after Warren argued that adversaries exploit crypto to move billions and that the bill would weaken standards. Their clash comes as the Senate races against a narrow legislative calendar.
Follow us on X to get the latest news as it happens
Lummis Points to Built-In Safeguards
Lummis countered that the Clarity Act strengthens illicit finance rules rather than weakening them. She listed specific provisions in a public rebuttal.
Lummis noted that Section 201 applies the Bank Secrecy Act and anti-money laundering (BSA/AML) rules to crypto. Section 303 adds new sanctions aimed at Iran. Section 305 lets exchanges freeze dirty money.
“If you don’t like crypto, then say it, but stop these baseless attacks,” she said.
Illicit finance concerns have become a central sticking point for the legislation. Law enforcement groups and Catholic coalitions pushed back in separate letters last month.
Their objections targeted Section 604, the bill’s developer safe harbor. Critics say broad exemptions could weaken oversight of criminal fund flows.
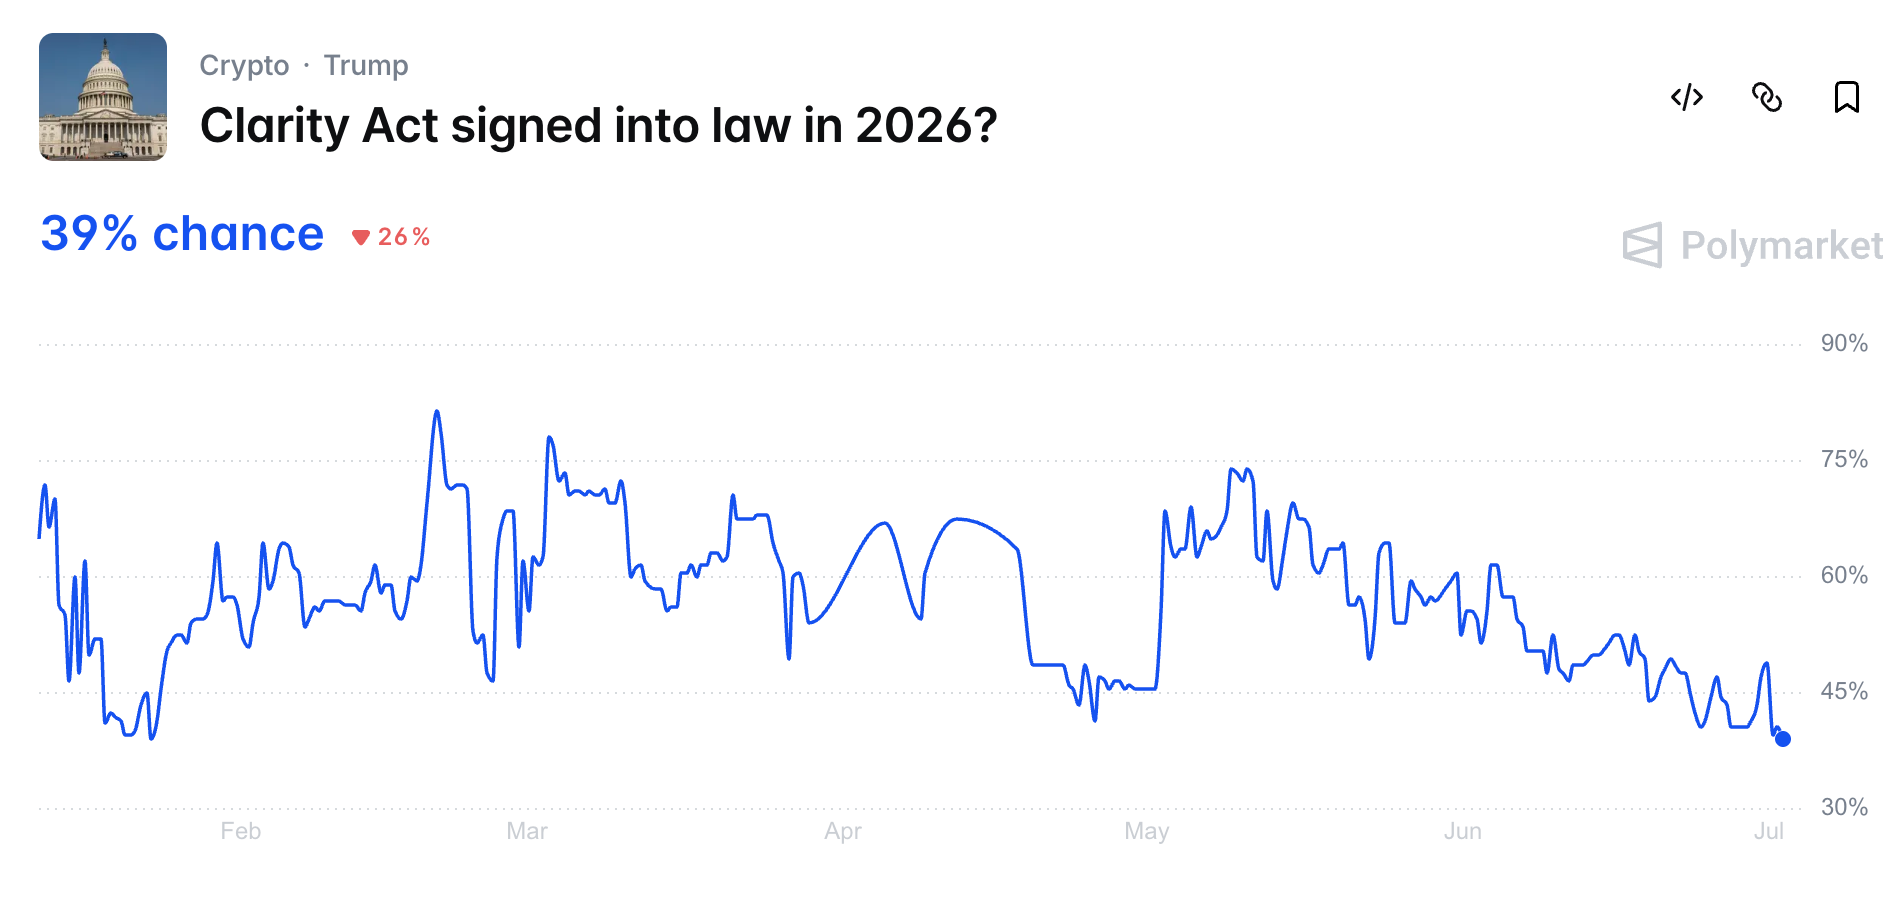
Clarity Act Passage Odds Slide on Polymarket as Deadline Nears
Meanwhile, the timing raises the stakes for the bill. The Senate returns from recess on July 13, leaving a narrow window before the August break.
The bill must clear the Senate by then to stand a chance of becoming law this year. That path requires 60 votes, including at least seven Democrats.
Prediction markets have turned cautious. On Polymarket, the odds of the Clarity Act becoming law in 2026 fell to 39%, down from 64% in early June.

Analysts have shifted, too. Galaxy Research now puts the odds of the CLARITY Act becoming law in 2026 at 50%, down from 60% on June 5, citing the shrinking Senate calendar.
Subscribe to our YouTube channel to watch leaders and journalists provide expert insights
The post Senator Lummis Calls to Stop ‘Baseless Attacks’ on the Clarity Act appeared first on BeInCrypto.


Tether has frozen USDT balances in 131 TRON wallets linked to ISIS-K after U.S. sanctions officials added more than 100 crypto identifiers tied to the group.
Summary
- Tether froze USDT balances across 131 ISIS-K-linked TRON wallets after OFAC updated its sanctions identifiers.
- Chainalysis said the TRON wallets received over $1.4 million and sent over $880,000 since 2023.
- The action adds pressure on VASPs to update sanctions screening for newly listed crypto addresses.
The move places stablecoin issuer controls at the center of a new terrorism-financing action involving TRON and Monero addresses.
Chainalysis said the U.S. Treasury’s Office of Foreign Assets Control updated its ISIS-K designation on July 1. The update added 134 crypto wallet identifiers, including 131 TRON addresses and three Monero addresses.
“Tether has frozen the balances on all 131 TRON addresses,” said Chainalysis.
The official OFAC update lists the wallets under ISIL Khorasan, also known as ISIS-K. The group is the Islamic State’s Afghanistan and Pakistan branch. OFAC had already designated ISIS-K as a terrorist group before adding the new crypto wallet identifiers.
Chainalysis tracks Tether flows across TRON wallets
Chainalysis said the 131 TRON addresses had received more than $1.4 million since 2023. The same wallets sent out more than $880,000 over that period. The blockchain analytics firm said several listed wallets had exposure to mainstream services and also sent funds to Syria-based crypto exchangers.
The report said ISIS-K’s media branch, al-Azaim Media Foundation, has used websites and messaging platforms to seek crypto donations. Chainalysis said it had collected past donation addresses on TRON, Monero, and Bitcoin. The firm also noted that earlier public terrorism-financing campaigns often used smaller donations, rather than a few large transfers.
Stablecoin freeze role keeps growing
The latest freeze follows a wider rise in issuer-level enforcement around USDT. As previously reported, Tether’s T3 Financial Crime Unit passed $450 million in frozen suspected illicit assets since its 2024 launch. The unit is backed by Tether, TRON, and TRM Labs, and focuses on USDT activity on the TRON network.
Moreover, Tether froze more than $514 million across 370 addresses during one 30-day period earlier this year. Most of the frozen funds were on TRON. BlockSec data cited in that report showed Tether blacklisted 4,163 addresses in 2025, freezing $1.26 billion across Ethereum and TRON.
Sanctions pressure reaches compliance teams
The ISIS-K action also comes after other terrorism-linked wallet freezes this year. Victims with U.S. terrorism judgments asked a New York court to order Tether to turn over 344,149,759 USDT held in two OFAC-blocked TRON wallets linked to Iran’s IRGC. That case centers on whether frozen stablecoins can be transferred to judgment creditors.
Chainalysis said the July 1 actions require virtual asset service providers and financial institutions to update sanctions screening and transaction monitoring. The firm also said it labeled the relevant addresses in its products. The step gives compliance teams a way to detect exposure to the newly listed ISIS-K wallets and related networks.


Circle co-founder and CEO Jeremy Allaire published a lengthy rebuttal on X on July 1 to the pitch behind OUSD, the stablecoin launched by the Open Standard consortium, arguing that USDC's advantages in distribution, liquidity and regulatory licensing are not easily replicated. "We've had lots of… Read the full story at The Defiant


K Wave Media has sold its remaining Bitcoin holdings, ending a short-lived treasury push that once aimed to turn the Nasdaq-listed Korean media company into a major corporate BTC holder.
Summary
- K Wave Media sold its remaining 88 BTC to repay $6 million in debt obligations.
- The company once said it wanted to expand Bitcoin holdings toward 10,000 BTC quickly afterward.
- K Wave’s filing shows it halted Bitcoin strategy while shifting focus toward AI infrastructure investments.
The sale came less than a year after the company said it had access to up to $1 billion in financing for its Bitcoin strategy.
K Wave sells 88 BTC to repay debt
In a June 30 SEC filing, K Wave said it liquidated 88 Bitcoin held in its treasury and used the proceeds to repay $6 million of Initial Notes. The transaction was tied to an April 29 amendment to its securities purchase agreement with Anson Funds.
The same filing says K Wave sold all of its Bitcoin holdings on May 6. It also says the company has not abandoned its treasury strategy, but has decided to halt it and focus on AI infrastructure. That shift puts its Bitcoin balance at zero after it once marketed itself as a Korean media company with a Bitcoin-backed treasury model.
Company once aimed for 10,000 BTC
K Wave’s exit marks a sharp turn from its July 2025 announcement. At the time, the company said it had secured $1 billion in total capital capacity through a $500 million convertible note agreement with Anson Funds and a $500 million standby equity purchase deal with Bitcoin Strategic Reserve.
The company said it had completed an initial purchase of 88 BTC and planned to scale its holdings.
“Our objective is clear: to scale our holdings toward 10,000 Bitcoin as soon as possible,” said CEO Ted Kim.
The company also said at least 80% of net proceeds from the first Anson tranche had to be used to buy Bitcoin.
AI strategy replaces Bitcoin plan
K Wave later changed course. As previously reported, K Wave redirected up to $485 million from its Bitcoin treasury plan toward AI infrastructure, including data centers, GPU compute operations, and possible acquisitions. Its shares fell about 25% after that update.
The SEC filing adds more detail to that pivot. K Wave said it has started a strategic transformation toward AI infrastructure and is pursuing data centers, GPU clusters, AI cloud platforms, power systems, cooling systems, and related technology assets. The company also expects shareholders to consider the planned sale of Play Company and the disposal of its Solaire stake.
K Wave is also dealing with Nasdaq compliance issues. The filing says Nasdaq notified the company in January that its shares failed to meet the $1 minimum bid rule. Nasdaq sent another notice in June after the company failed to meet the required $15 million market value of publicly held shares.
Treasury firms face wider pressure
K Wave’s move adds to stress across the digital asset treasury sector. As crypto.news reported, Sequans sold half of its Bitcoin as debt pressure tested its treasury plan. That report also cited K Wave’s earlier Bitcoin-to-AI shift as another case of public firms rethinking BTC reserves.
The wider model has also come under review. Crypto.news explained that Bitcoin treasury companies often depend on investor demand, share premiums, and access to fresh capital. When those conditions weaken, debt and dilution can make the structure harder to maintain.
Previously, crypto.news reported that Strive’s Ben Werkman warned that a long Bitcoin downturn could force some treasury firms to restructure, especially those that relied on convertible debt. K Wave’s sale shows how a company can move from an aggressive BTC target to debt repayment and a new business focus within one year.
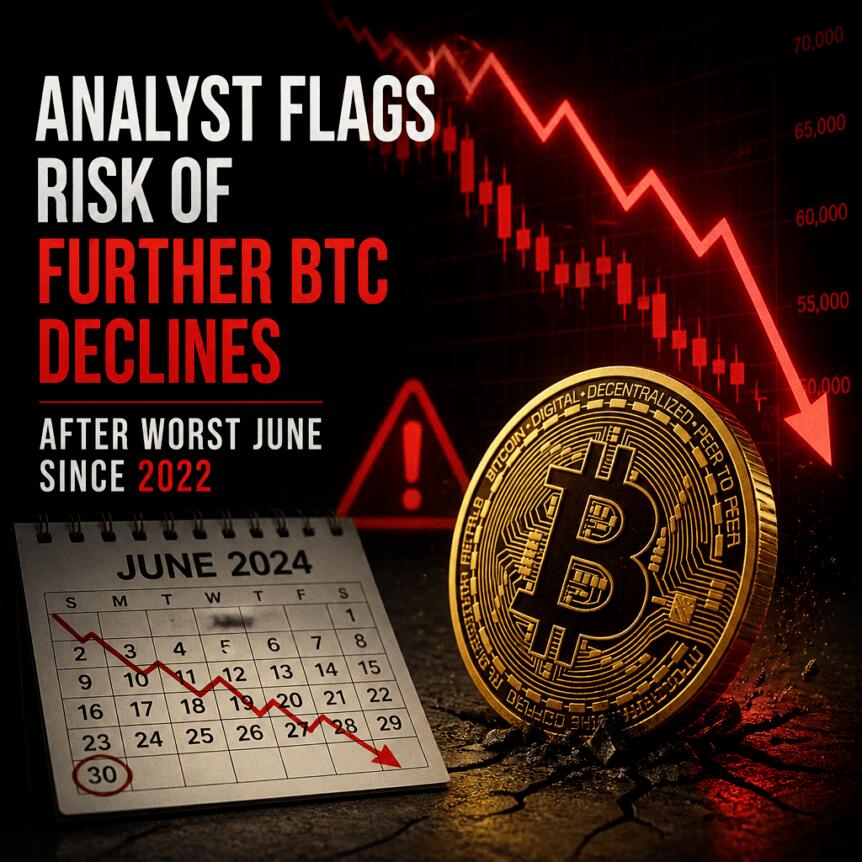
Bitcoin ended June at $58,526, sliding 20.5% over the month and recording its weakest monthly performance since June 2022. The retreat left the flagship cryptocurrency trading below its 200-week moving average near $62,000, but still above a key on-chain valuation metric known as realized price (around $52,000), a configuration that some analysts interpret as a warning that the market may not have reached a full bear-market bottom.
Crypto analyst PlanB, creator of the stock-to-flow pricing model, argued that this price positioning matters because previous bear-market troughs occurred below realized price. In a post shared this week, PlanB said the setup suggests Bitcoin’s downside could continue, potentially revisiting the realized-price area and beyond.
Key takeaways
- Bitcoin’s June close at $58,526 placed it below the 200-week moving average (about $62,000) while remaining above realized price (~$52,000).
- PlanB says earlier bear-market bottoms formed below realized price, implying the market may still be searching for its bottom.
- Analysts at Bitrue Research Institute and Bitget Wallet both described the June-to-$60,000 region as a developing bottom zone, but with risk of further drawdowns.
- Benjamin Cowen suggested Bitcoin may see a cycle-bottom window tied to the US midterm election year, historically aligning with accumulation phases in 2018 and 2022.
Why June’s “in-between” level is drawing attention
PlanB’s argument centers on what he views as the relationship between price and realized price during bear markets. According to the stock-to-flow analyst, Bitcoin’s historical bear-market bottoms have not simply arrived after price fell below major moving averages; they also tended to appear after price moved to levels beneath realized price.
In earlier posts, PlanB highlighted that if Bitcoin breaks down below realized price, it would align with that prior pattern. He referenced the possibility that Bitcoin could fall to $52,000, which would correspond closely with realized price.
From an investor perspective, this distinction can be important because realized price is often used as an on-chain proxy for the average cost basis of coins in circulation. When market price trades above realized price, the market may still be able to bounce; when it slips below, the distribution of holders’ costs versus current valuations tends to become more unfavorable, which can prolong bearish conditions.
Realized price explained—and what it signals
Realized price is calculated by valuing all Bitcoin outputs (typically discussed in terms of unspent transaction output or UTXO cohorts) at the price when each coin last moved on-chain. The result is an aggregate measure of the average acquisition price for the existing supply.
Because realized price reflects holder cost basis, it is frequently used to identify potential support areas during downtrends. The idea is that when price is substantially below realized levels, the market is effectively pricing Bitcoin below what many holders paid when they last moved coins, which can coincide with capitulation phases and supply shakeouts.
Against that backdrop, June’s outcome—still above realized price but no longer above the 200-week moving average—has led analysts to frame the current range as transitional rather than conclusive.
Analysts see a bottom developing, but not confirmed
Andri Fauzan Adziima, research lead at Bitrue Research Institute, told Cointelegraph that Bitcoin’s June close carried a signal consistent with prior cycles. He said the month’s finish above realized price but below the 200-week moving average “signals the bear bottom is still ahead per prior cycles.”
Adziima added that he is watching for a potential capitulation period in late 2026 before a subsequent move higher—while also arguing that the decline could be shallower this cycle due to the role of institutions.
Meanwhile, Lacie Zhang, research analyst at Bitget Wallet, characterized the current consolidation around $60,000 as an area that may be approaching a bottom. She told Cointelegraph that if further downside occurs, the market could build “strong historical and technical support” around $55,000.
Taken together, these views reflect a common tension in market bottoms: technical indicators and on-chain benchmarks can both suggest stabilization, yet neither can confirm capitulation has fully played out. In this case, the “middle” positioning—between the 200-week moving average and realized price—is leaving room for additional volatility before a more durable floor forms.
Cycle-bottom theory tied to US midterms
Beyond on-chain valuation levels, some analysts are also looking at macro calendar effects. ITC Crypto founder Benjamin Cowen speculated that Bitcoin may see a cycle bottom this year, pointing to the fact that it is a US midterm election year.
Cowen argued that the second half of midterm years often marks an accumulation zone and a market cycle bottom, noting that such timing previously coincided with bear market bottoms in 2018 and 2022. The next US midterms are scheduled for Nov. 3, with all House of Representatives seats and about a third of Senate seats up for election.
While this framing is not the same as a realized-price breakdown model, it can influence how traders time risk—particularly when they treat the calendar as a factor that shapes liquidity and positioning. Investors watching this thesis would likely focus on whether Bitcoin’s downtrend stabilizes into accumulation rather than continuing to grind toward or below realized price.
For now, the key takeaway from all perspectives is that June’s close did not neatly resolve the debate. Bitcoin is weak enough to be below its long-term trend proxy, but it has not yet fallen to the on-chain valuation zone that PlanB says has marked prior trough formation.
Traders and long-term holders will likely watch whether Bitcoin can hold above realized price around $52,000 and whether weakness extends toward $55,000 support. The market’s next step—whether it stabilizes into accumulation or breaks below realized valuation—may determine if this is merely consolidation or the start of a more complete bear-market bottom.

yo bailando en vez de estudiar #money #onlineshop #memes

Harry Kane Scores Twice in Final 15 Minutes to Rescue England Over Congo DR in World Cup Thriller

Forward Industries adds 500K SOL despite earlier crypto losses

No Jackpot Winner as $257 Million Prize Rolls Over to $269 Million Monday Draw

Renter of Home in Anne Heche Crash Denies Settlement With Son

Weekend Open Thread: Staud – Corporette.com
yo bailando en vez de estudiar #money #onlineshop #memes

WHICH MONEY? (Official Video) NITIN CHHANIAALA | LAMBA | New Haryanvi Song 2026 |Haryanvi Songs 2026

Trump made nearly $1.2B from crypto businesses last year while investors lost money
-
 Fashion6 days ago
Weekend Open Thread: Staud – Corporette.com
-

 Politics6 days ago
The House | Manchesterism won’t survive the painful trade-offs unless it gets citizens on board
-

 Crypto World2 days ago
Strategy authorizes up to $1.25B in Bitcoin sales under new capital plan
-

 Politics6 days ago
Potential 2028er World Cup attendee leaderboard
-

 Business6 days ago
Asia stock markets slide as tech shares slump
-

 News Videos3 days ago
MAJOR BITCOIN & MARKET UPDATE!!!! (MUST WATCH ASAP!!!)
-

 Tech6 days ago
A Look At A Gaggle Of Transputer Boards
-
 Crypto World7 days ago
Dell (DELL) Shares Tumble Over 5% Following Analyst Downgrade to Hold
-

 Crypto World5 days ago
Coinbase, Circle Deepen Crypto Stock Losses Despite Resilient S&P 500
-

 Business2 days ago
Australia treasurer says alleged access of prime minister’s bank data ’incredibly concerning’
-

 Crypto World5 days ago
Kraken's xStocks Opens Bending Spoons IPO Registration to EEA Retail
-

 Sports5 days ago
FIH Pro League: India defeat Pakistan 7-1, register biggest win of campaign | Other Sports News
-
 Crypto World6 days ago
Bitcoin Sparks $600M Hourly Liquidations With $65,000 Set To Become Resistance
-

 Tech4 days ago
Bluekit phishing kit adopts browser-in-the-middle for login theft
-

 Tech2 days ago
Anonymous researcher drops 0-day ‘exploitarium’ repo
-

 Tech5 days ago
Russian hackers now target Signal backup recovery keys
-
 Crypto World6 days ago
Hyperliquid Named on Singapore MAS Investor Alert Register
-

 Crypto World6 days ago
RTX holders must register wallets before token distribution begins
-

 Sports17 hours ago
Broncos roster: OL Ben Powers (No. 74) entering final year of contract
-
 Business3 days ago
The AI boom won’t burst all at once. It will pop in ‘rolling bubbles’: Macquarie
You must be logged in to post a comment Login