

Crypto World
Anchorage Digital unlocks Lido staking without leaving custody


Anchorage Digital has integrated Lido into its institutional platform, allowing clients to access wrapped staked Ether (wstETH) while keeping assets inside its regulated custody environment.
Summary
- Anchorage Digital has integrated Lido, letting institutions mint and burn wstETH without leaving regulated custody.
- Clients can access Ethereum staking rewards while keeping custody, governance, reporting, and settlement on one platform.
- Lido says rising institutional demand and its audited staking infrastructure are driving adoption of custody-based staking.
According to a July 2 announcement from Anchorage Digital, institutional clients can now connect directly to the Lido application to mint and burn wstETH without transferring assets outside the firm’s custody platform.
The integration lets investors earn Ethereum staking exposure while continuing to use the custody, governance, reporting, and settlement processes they already rely on.
Institutions can stake Ethereum without moving assets
The newly added service centers on wstETH, a liquid staking token that represents staked Ether while remaining transferable. Instead of distributing staking rewards directly, the token’s value increases relative to stETH over time, allowing institutions to retain liquidity alongside staking exposure.
Commenting on the launch, Anchorage Digital co-founder and CEO Nathan McCauley said liquid staking has become one of Ethereum’s most important components for institutional participation.
“By integrating with Lido, we’re giving institutions access to wstETH without the operational or security tradeoffs that have historically kept large allocators on the sidelines.”
Anchorage Digital, which operates the first federally chartered crypto bank in the United States, said clients can now complete staking-related activity without moving assets across multiple providers. The company said keeping custody, staking, governance, and settlement within one regulated platform simplifies institutional operations.
Earlier this week, as reported by crypto.news, Anchorage Digital also expanded its institutional infrastructure through a partnership with Binance. The agreement allows eligible institutional clients to trade on Binance while keeping assets in segregated custody through Anchorage’s Atlas platform. Binance said the arrangement separates custody from trade execution, mirroring practices commonly used in traditional financial markets.
Lido highlights security and institutional demand
Interest from institutional investors has continued to grow as staking infrastructure and regulation have matured, according to Kean Gilbert, head of institutional relations at the Lido Ecosystem Foundation.
Gilbert told Crypto Briefing that asset managers, liquid funds, and Ether treasury holders have increasingly sought custody-based access to staking because it reduces operational complexity and compliance concerns while fitting existing institutional workflows.
The first phase of the integration focuses on minting and burning wstETH inside Anchorage Digital. Institutions can convert ETH into wstETH and redeem it back through the platform, while the token remains transferable for collateral use or deployment into other investment strategies.
Unlike conventional staking positions that often require investors to wait before withdrawing funds, wstETH can be transferred without first exiting the underlying staking position. According to Lido, this gives institutions additional flexibility while preserving exposure to Ethereum staking rewards.
Gilbert also pointed to Lido’s security record as institutional adoption continues to expand. He said the protocol has spent more than $4 million on smart contract audits, received an A+ security rating from independent firms including Credora, and has operated since 2020 without a smart contract exploit.
He added that Lido distributes staked Ether across more than 900 node operators, with no individual operator controlling more than 1% of the network, reducing reliance on any single participant.
Looking ahead, Gilbert said that institutional adoption will depend on whether staking products fit existing operational requirements. He said making wstETH available through Anchorage Digital brings the token onto a major U.S. institutional platform and strengthens the role of Lido’s staking infrastructure for professional Ethereum investors.


Cross-margining lets your whole account balance backstop every open trade, so a winning position can keep a losing one alive. It is more capital-efficient than isolated margin, and it can also wipe out your entire account in one bad move. Here is how it works.
Summary
- Cross-margining is a margin mode in which all the funds in your account act as shared collateral for all your open positions, so gains and spare equity in one position can support a losing one.
- It contrasts with isolated margin, where a fixed amount of collateral is locked to each position and losses are capped to that amount.
- Cross margin is more capital-efficient and can delay liquidation, but it puts your entire account at risk, because a large enough loss can be covered from the whole balance and trigger a portfolio-wide liquidation.
- Traders generally use cross margin for hedged, offsetting, or core positions, and isolated margin for speculative, high-risk, or single bets where they want a hard loss cap.
- The same principle scales to institutions, where prime brokers cross-margin positions across entire asset classes, using assets like stablecoins as shared collateral.
Cross-margining is a way of managing collateral in leveraged trading where your entire account balance backs all of your open positions at once, instead of each trade standing on its own. In practice, that means the profit or spare equity in one position can be used to support another that is losing, which can keep trades alive through volatility. The trade-off is that your whole account is exposed: a large enough loss draws on the entire balance and can liquidate everything. Cross margin is one of the two main margin modes offered on crypto trading platforms, the other being isolated margin, and understanding the difference is essential to managing risk. This explainer covers how margin trading works, how cross and isolated margin differ, a worked example, the pros and cons, and how the same idea operates at the institutional level.
Margin trading basics: leverage, collateral, liquidation
Cross-margining only makes sense once the basics of margin trading are clear. Margin trading means borrowing funds to open a position larger than your own cash balance would allow. The money you put up is the margin, and it serves as collateral for the borrowed funds. Leverage describes how much larger your position is than your own capital: at five-to-one leverage, a trader controls a position five times the size of their margin. Leverage amplifies everything, so both gains and losses grow in proportion to the position size instead of the smaller amount of capital actually committed.
Two thresholds govern a margin position. The initial margin is the collateral required to open the position. The maintenance margin is the minimum equity that must be kept to hold it open. As long as the position’s equity stays above the maintenance margin, the trade continues. If the market moves against the position enough that equity falls below the maintenance margin, the platform issues a margin call or, more commonly in crypto, moves straight to liquidation.
Liquidation is the forced closure of a position when its equity drops below the maintenance requirement. The platform’s liquidation engine closes the position at market prices, sometimes in partial steps, to prevent the account from going negative. Because leverage magnifies losses, liquidation can happen fast: at high leverage, a small adverse price move can wipe out the margin buffer entirely. This is the central risk of all margin trading, and the choice between cross and isolated margin is fundamentally a choice about how liquidation is calculated and how much of your account is exposed to it.
Cross margin versus isolated margin: the core difference
The two margin modes differ in one crucial respect: what pool of collateral backs each position. In cross margin, all the funds in your account form a single shared pool that backs every open position together. Unrealized profits and spare equity from one position can flow to support another that is drawing down, which can delay or prevent the liquidation of the losing trade. The account is managed as one book, and liquidation becomes a portfolio-level event that depends on the combined equity of everything you hold.
In isolated margin, collateral is ring-fenced to each position individually. You decide how much of your funds to assign to a specific trade, and that amount is the maximum you can lose on it. If the position is liquidated, only its allocated collateral is lost, and the rest of your account, including your other positions, is untouched. Isolated margin gives you a predictable, per-trade liquidation price and a hard cap on the damage any single idea can do, at the cost of not being able to draw on the rest of your balance to save a position.
The consequence is a clear trade-off between capital efficiency and risk containment. Cross margin uses your capital more efficiently, because idle equity and winning positions automatically backstop losing ones, and it tends to produce fewer forced liquidations on individual legs. But it places your entire account on the line, since a bad enough move can consume the whole balance. Isolated margin sacrifices efficiency for control: each position is walled off, so a single blow-up cannot spread, but you must actively manage collateral and accept more frequent single-position liquidations. Neither is inherently better; the right mode depends on the strategy.
A worked example
A concrete example makes the difference tangible. Imagine a trader with a $15,000 account who wants to open a leveraged long position on Bitcoin with an initial margin requirement of $5,000. Under cross margin, the entire $15,000 backs the position, giving a $10,000 buffer above the initial requirement. That large cushion makes liquidation far less likely on a normal pullback, because the whole account absorbs the drawdown. If the trader also holds other positions, profits on those can further support the Bitcoin trade. The catch is that if the combined account equity falls below the maintenance level, the liquidation engine can close positions and consume the full $15,000, not just a slice of it.
Now run the same trade under isolated margin. The trader allocates exactly $5,000 to the Bitcoin position and no more. If Bitcoin falls and the position is liquidated, the maximum loss is that $5,000, and the remaining $10,000 in the account is safe, available for other trades or simply preserved. The liquidation price is predictable and tied only to that position’s collateral. The downside is that the position has a much thinner buffer, so it will be liquidated sooner than the cross-margined version, since it cannot draw on the rest of the account to survive a dip.
The example shows the core tension. Cross margin gave the Bitcoin trade a bigger cushion and a better chance of surviving volatility, but it risked the entire $15,000. Isolated margin capped the loss at $5,000 but liquidated the position more readily. A trader who is confident and wants staying power, and who is comfortable risking the whole account, leans cross. A trader who wants a firm loss limit on a specific, uncertain bet leans isolated. The same $15,000 produces very different risk profiles depending on the mode chosen.
The pros and cons of cross-margining
Cross-margining has real advantages that explain its popularity among active and professional traders. Its main strength is capital efficiency: because all equity backs all positions, none of your capital sits idle behind a single trade, and winning positions automatically support losing ones. This produces a smoother equity curve and fewer forced exits on individual legs, which is especially valuable for hedged or offsetting strategies where one position is meant to counterbalance another. It is also simpler to monitor in one sense, since you watch a single account-level margin level instead of tracking collateral on many separate positions.
The disadvantages are equally real and more dangerous if ignored. The defining risk is that your entire account is exposed: once combined equity falls below the maintenance margin, liquidation can consume the whole balance, not a contained portion. This becomes acute when positions are correlated, which is common in crypto, where many assets move together. In a sharp, broad sell-off, several cross-margined positions can lose at once, draining account equity rapidly and triggering a cascade of liquidations across the book. A single violent move can therefore wipe out everything, where isolated margin would have contained the damage.
Cross margin also carries a psychological hazard. Because the shared pool makes positions feel more resilient, it can tempt traders to over-leverage, opening larger positions than they should because the buffer looks generous. That temptation, combined with the whole-account exposure, is how traders turn a manageable loss into a total one. The mode rewards discipline and punishes its absence. Used carefully within a hedged framework, cross margin is efficient and forgiving of ordinary volatility; used carelessly with correlated, over-leveraged bets, it is the fastest route to a blown-up account.
When to use cross versus isolated
The choice between the modes should follow the strategy rather than habit. Cross margin fits situations where positions offset or support one another. Hedging programs, basis trades, pairs trades, and market-making all benefit from a shared collateral pool, because a gain on one leg naturally cushions a loss on another, and pooling the collateral reduces the chance of an unnecessary single-leg liquidation. Core positions that a trader intends to hold through volatility also suit cross margin, since the deeper buffer provides staying power. In these cases, the whole-account exposure is an acceptable trade for the efficiency and resilience gained.
Isolated margin fits the opposite situations. Speculative, event-driven, or high-volatility bets, and single-ticket trades where the outcome is uncertain, are better ring-fenced, so that if the idea fails it cannot damage the rest of the account. A trader taking a focused shot on a volatile small-cap token, for instance, can cap the loss at a fixed amount and sleep easily knowing the rest of the balance is safe. Isolated margin also suits newer traders building discipline, because it enforces a hard maximum loss per trade and makes the risk of each position explicit.
Many experienced traders combine both in a core-satellite structure. They run cross margin on a core book of hedged or offsetting positions that benefit from pooled equity, while keeping speculative satellite trades in isolated buckets with fixed loss caps. This keeps the core capital-efficient without letting a single high-risk bet sink the whole account. The practical rule is to match the mode to the intent of each trade: shared exposure for positions designed to work together, walled-off exposure for standalone bets you want to contain. Some platforms even offer a smart cross margin that nets opposite-direction positions across products, further improving efficiency for hedged books.
Cross-margining at the institutional level
The same principle that governs a retail trader’s account scales all the way up to the largest institutions, and it is worth seeing the connection. When a hedge fund or trading firm operates through a prime broker, the broker cross-margins the firm’s positions across entire asset classes, netting exposures in digital assets, foreign exchange, derivatives, and fixed income so the firm posts collateral against the combined risk of its whole book rather than each position separately. This is cross-margining as a foundation of professional trading, and it is a major reason institutions value prime brokers: it frees up enormous amounts of capital that would otherwise sit idle.
Crypto has begun importing this institutional version. Prime brokers serving digital assets now let clients cross-margin crypto positions against traditional exposures, and stablecoins have started to play the role of shared collateral in that system. Ripple’s RLUSD, for example, has been positioned as a stablecoin that enables cross-margining between digital assets and traditional markets through institutional prime brokerage, letting a firm post the token as collateral recognized across both worlds. That is the same idea a retail trader meets in a cross-margin account, applied at the scale of institutional portfolios spanning many markets.
Seeing the two levels together clarifies what cross-margining really is: a method for treating a collection of positions as a single risk pool to use capital more efficiently. For a retail trader, the pool is the account balance backing a handful of trades. For an institution, it is a multi-asset book backed by cash and collateral like stablecoins across a prime broker. The mechanics and the stakes differ by orders of magnitude, but the core logic, and the core trade-off between efficiency and concentrated risk is identical.
The risks you must respect
Whatever the level, cross-margining demands respect for a specific set of risks, and ignoring them is how accounts are lost. The first is correlation risk. Crypto assets frequently move together, so a broad sell-off can push multiple cross-margined positions into loss simultaneously, draining shared equity far faster than a single position would. The very diversification that looks like safety can become a synchronized drawdown when markets turn risk-off together, and the shared pool that was meant to cushion individual losses instead absorbs many at once.
The second is liquidation and leverage risk. Because cross margin can make positions feel durable, it invites higher leverage, and higher leverage means a smaller adverse move can breach the maintenance margin. When that happens in cross mode, the liquidation is a portfolio-level event that can close multiple positions and consume the whole account. Flash crashes and liquidation cascades, where forced selling drives prices lower and triggers still more liquidations, are especially dangerous, and thin order books during such events can cause execution at prices far worse than expected. The market has seen sharp, leverage-driven cascades wipe out over-extended traders in minutes.
The disciplined response is to size positions conservatively, avoid over-leverage, and match the margin mode to the trade. Use cross margin for genuinely hedged or core positions where offsetting exposure justifies the shared pool, and isolate speculative or high-beta bets so a single failure cannot spread. Set alerts and plan collateral top-ups in advance instead of reacting during a crash. Cross-margining is a powerful tool for capital efficiency, but it concentrates risk at the account level, and the traders who use it well are the ones who never forget that the whole balance is on the line.
Frequently Asked Questions
What is cross-margining in simple terms?
Cross-margining is a margin mode where all the funds in your trading account act as shared collateral for all your open positions at once. Profits and spare equity from one position can support another that is losing, which can delay liquidation. The trade-off is that your entire account is exposed, so a large enough loss can be covered from the whole balance and liquidate everything.
How is cross margin different from isolated margin?
In cross margin, your whole account balance backs every position, so gains on one can cushion losses on another, but your entire account is at risk. In isolated margin, a fixed amount of collateral is locked to each position, capping the loss on that trade to the allocated amount and protecting the rest of your account. Cross is more efficient; isolated is more contained.
Which is better, cross or isolated margin?
Neither is universally better; it depends on the trade. Cross margin suits hedged, offsetting, or core positions that benefit from a shared collateral pool and staying power. Isolated margin suits speculative, event-driven, or single high-risk bets where you want a hard loss cap. Many traders use both, running cross margin on a core book and isolating speculative satellite trades.
What is the main risk of cross-margining?
The main risk is that your entire account is exposed. Once combined equity falls below the maintenance margin, liquidation can consume the whole balance rather than a contained amount. This is especially dangerous with correlated crypto assets, where a broad sell-off can push several positions into loss at once, draining shared equity quickly and triggering a portfolio-wide liquidation.
Can cross-margining cause bigger losses?
It can, because it puts the full account balance behind your positions. In a sharp, correlated downturn or a flash crash, multiple cross-margined positions can lose simultaneously and a portfolio-level liquidation can wipe out the entire account. Cross margin can also tempt traders to over-leverage because the shared buffer feels generous, which magnifies losses when the market turns.
What is a maintenance margin?
The maintenance margin is the minimum equity you must keep to hold a leveraged position open. As long as equity stays above it, the position continues. If the market moves against you and equity falls below the maintenance margin, the platform liquidates the position. In cross margin, this is calculated at the account level; in isolated margin, it is calculated for each position separately.
Do institutions use cross-margining?
Yes, at large scale. When institutions trade through a prime broker, the broker cross-margins their positions across entire asset classes, netting exposures in digital assets, foreign exchange, derivatives, and fixed income so the firm posts collateral against the combined risk of its whole book. Stablecoins such as RLUSD have started to serve as shared collateral in this institutional cross-margining system.
How can I use cross-margining safely?
Match the mode to the trade: use cross margin for hedged or core positions where offsetting exposure justifies the shared pool, and isolate speculative or high-volatility bets. Size positions conservatively, avoid over-leverage, set liquidation alerts, and plan collateral top-ups in advance. Always remember that in cross mode, your entire account is on the line, so discipline about leverage and position size is essential.
Disclaimer: This article is for information and educational purposes only and does not constitute financial, investment, or trading advice. Margin trading involves a high risk of loss, including the potential loss of your entire account, and is not suitable for all investors. Nothing here is a recommendation to trade or use any strategy. Always do your own research and consider consulting a qualified professional before trading on margin. Information is accurate as of July 2, 2026, and may change.
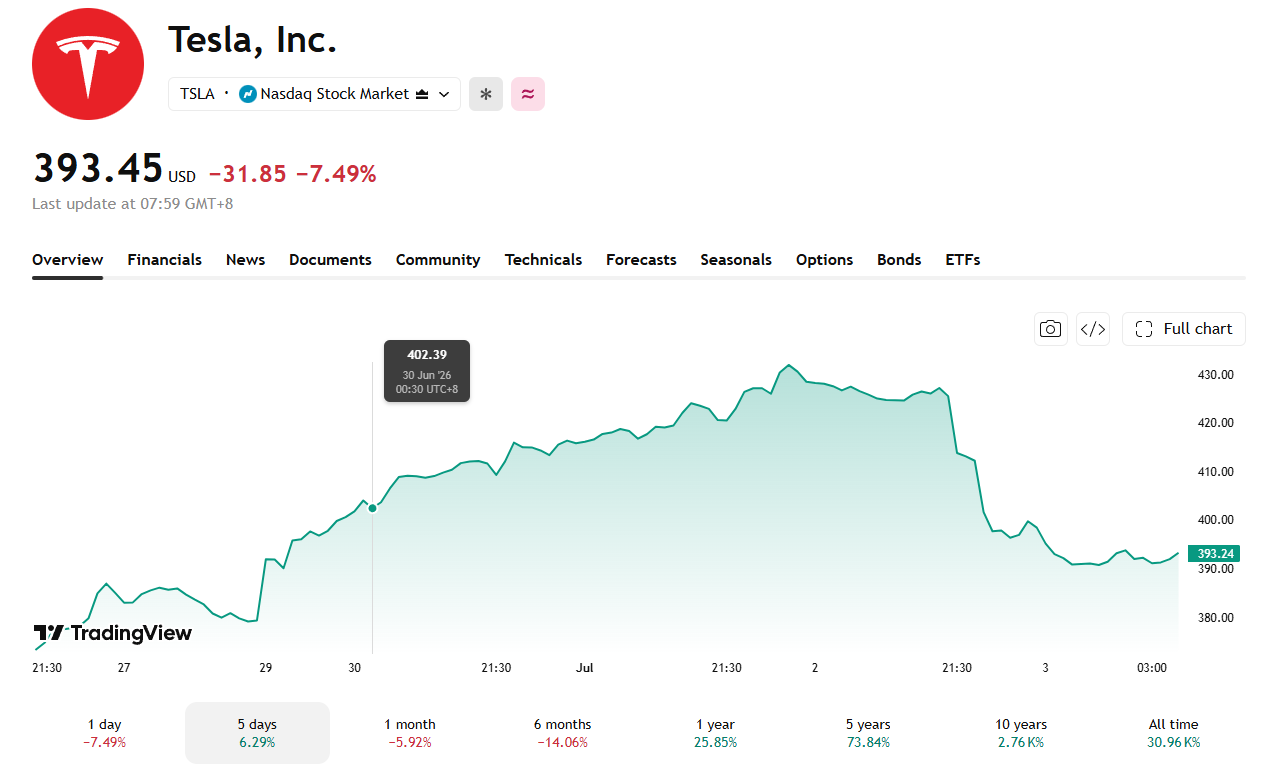
Tesla shares sank about 7.5% on July 2, their worst single-day decline in nearly a year. The drop came even after the company reported second-quarter deliveries far above Wall Street’s expectations.
The selloff came just three trading days after Tesla stock jumped more than 8% on optimism around a new self-driving software rollout.
Deliveries Crushed Estimates, But the Rally Came Early
Tesla reported 480,126 vehicle deliveries for the second quarter, against a company-compiled consensus of 406,024 and a StreetAccount estimate of 406,600. Production came in at 451,758 units.
The result marked a 25% jump from the same period last year. It also represented a 34% increase over the first quarter’s 358,023 deliveries. Tesla also shipped more cars than it built, drawing down inventory that had ballooned earlier in the year.

Much of the setup traces back to June 29. Tesla shares posted their biggest single-day gain in over a year after the FSD v14 Lite update rolled out. The update reached older Hardware 3 vehicles for the first time in more than a year. That rally already reflected rising expectations for the delivery report itself.
Why a Beat Still Sank the Stock
CNBC’s Phil LeBeau called the numbers a clear beat on air Thursday morning.
“The consensus estimate going into today was 406.6 thousand vehicles. They beat it by 74,000 vehicles. So just a massive beat from Tesla for the second quarter.”
Attribution: CNBC
Yet the stock fell anyway. Fund manager Gary Black noted that Tesla and Rivian shares had both climbed heading into their delivery reports. That timing undercuts the idea that new autonomy enthusiasm drove the earlier run-up.
Higher European gasoline prices from the Iran conflict likely pulled some demand forward. Tesla’s cheaper Model 3 and Model Y variants added to that effect. China-made EV sales rose 24.4% year over year in June, while Norway registrations fell 43%.
Valuation Still Hinges on Autonomy, Not Cars
Tesla’s roughly $1.6 trillion valuation now rests largely on its robotaxi and Full Self-Driving story rather than car sales. That mirrors the doubts investors raised during Tesla’s volatile 2010 IPO period.
A National Highway Traffic Safety Administration probe remains open into a fatal June 19 crash involving Tesla’s driver-assistance software. That probe keeps safety scrutiny on the same technology stack Tesla is now rolling out on robotaxis.
Tesla reports full second-quarter financial results on July 22. That release will show whether the delivery beat came with pricing discipline or with margin-eating incentives.
The post Why Did Tesla’s Stock Drop 7% Despite a Record Delivery Quarter? appeared first on BeInCrypto.

The U.S. Treasury’s Office of Foreign Assets Control (OFAC) has expanded its sanctions targeting ISIS-Khorasan (ISIS-K), sanctioning 134 cryptocurrency wallet addresses tied to the group. ISIS-K has been designated as a Specially Designated Global Terrorist since September 2015.
OFAC added the addresses to its Specially Designated Nationals (SDN) list on Wednesday. The SDN designation covers individuals, entities, and digital asset addresses linked to terrorism and other illicit activity, bringing more crypto-linked points of contact into the U.S. enforcement framework. OFAC’s recent action outlines the update.
Key takeaways
- OFAC sanctioned 134 cryptocurrency wallet addresses associated with ISIS-Khorasan, adding them to the SDN list.
- Blockchain analysis by Chainalysis says 131 of the sanctioned addresses were on Tron and were frozen by Tether; three were on Monero.
- Chainalysis reports the Tron addresses received more than $1.4 million in crypto donations since 2023 and sent over $880,000.
- The new action follows OFAC’s prior ISIS-support financier sanctions issued on June 22.
OFAC adds 134 crypto addresses to the SDN list
The latest OFAC update is part of an ongoing effort to disrupt terrorist financing conducted through digital assets. By designating specific wallet addresses, OFAC places them within the SDN framework—aimed at preventing U.S. persons and covered businesses from dealing with the sanctioned parties or facilitating transactions tied to them.
According to OFAC’s description of the measure, earlier rounds focused on “key facilitators who enable ISIS to move funds among its regional affiliates.” The new tranche expands the net further by targeting additional wallet infrastructure associated with ISIS-K’s illicit financial activity. OFAC’s SDN list update records the addresses added this week.
Tether freezes Tron holdings; Chainalysis flags Monero addresses
Industry blockchain forensics firm Chainalysis, in a report released alongside the sanctions news, attributed the breakdown of wallets by network: 131 Tron addresses and three Monero addresses were identified in the OFAC action. Chainalysis said Tether froze balances tied to the 131 Tron addresses, while the remaining addresses were on the Monero network.
The freezing step matters operationally. Sanctions can create legal and compliance barriers, but the immediate restriction of balances by major stablecoin infrastructure can reduce the near-term ability of sanctioned actors to access funds—even before prosecutions or extended enforcement follow.
Chainalysis’ analysis of the specific wallets and their network exposure was published in its report on the July 2026 sanctions round: “ISIS Designation of Crypto Addresses — July 2026”.
Where the money flowed: donations and transfers traced on-chain
Chainalysis also described what it found when mapping the sanctioned wallets’ activity. The report says the 131 Tron addresses received more than $1.4 million in cryptocurrency donations since 2023 and sent over $880,000. The group has reportedly sought crypto donations historically through campaigns using websites and messaging platforms.
Beyond aggregate totals, Chainalysis says it identified donation-related addresses used across multiple networks—including Tron, Monero, and Bitcoin—and noted what it characterized as “significant exposure to mainstream services.” The firm also found wallets that routed funds to cryptocurrency exchanges based in Syria.
That mix—terror-linked wallets interacting with larger crypto services—highlights a key enforcement challenge. Even when an illicit actor uses anonymity-oriented networks (such as Monero), their broader financial graph can intersect with centralized or regulated endpoints through exchange flows, custody, or liquidity routes. For compliance teams, that intersection is often where disruptions become most practical.
Sanctions momentum builds after June 22 enforcement
This week’s OFAC action arrives a little more than a week after the agency sanctioned additional individuals and entities connected to ISIS-related financing. On June 22, OFAC sanctioned three individuals and six entities across Europe, the Middle East, and West Africa, including MSB Bitcoin Xchange (Syria) and MSB Spider (Turkey). OFAC’s June 22 press release describes that previous round and the agency’s rationale.
Comparing the two actions, the pattern appears to be widening from alleged facilitators toward the transactional endpoints used to receive or move funds. By adding wallet addresses to the SDN list, OFAC reduces flexibility for sanctioned networks and increases compliance pressure across exchanges, custodians, and stablecoin-related entities that manage address-based monitoring and balance controls.
It also reinforces the role of blockchain analytics in sanctions design. Chainalysis’ ability to identify donation flows and network-specific wallets helped connect the sanctions process to on-chain behavior, enabling a targeted approach rather than a broad, non-specific sweep.
Why blockchain intelligence is becoming central to enforcement
Across counter-terrorism and financial-crime policy, blockchain intelligence tools are moving from “supporting evidence” to operational components in enforcement. Earlier this year, TRM Labs said onchain evidence was key to securing convictions of three individuals for terrorism financing in Indonesia in 2024 and 2025. TRM Labs argued that courts have treated cryptocurrency evidence—such as wallet addresses, transaction histories, and on-chain flows—as admissible and capable of anchoring prosecution. The company described this in a statement on its site: TRM Labs: on-chain intelligence and terrorism financing prosecutions.
The broader implication for market participants is straightforward: sanctions enforcement increasingly depends on traceable, address-level data. That trend tends to raise the importance of robust address-screening and transaction monitoring, especially for companies that deal with stablecoin liquidity, exchange withdrawals, or custody services across multiple networks.
For readers following this area closely, the next question is how quickly more connected wallets and counterparties are identified—and whether additional enforcement actions will target exchange routes, intermediary services, or other infrastructure tied to the newly sanctioned addresses. Chainalysis’ reporting suggests ISIS-K’s crypto activity has been persistent, but OFAC’s approach is shifting toward more granular, address-specific disruption that can constrain access to funds in real time.

SBI Crypto, the cryptocurrency-focused unit of Japan’s SBI financial group, will shut down its Bitcoin mining pool after five years of operations. The company says it will end mining pool services on July 31 and will stop accepting mining shares at the same time, while asking miners to keep directing hashrate to the pool through the cutoff so final payouts can be calculated correctly.
Beyond the operational details, the closure underlines a shift in how SBI wants to position itself in crypto. Instead of concentrating on mining infrastructure, SBI has been expanding its broader strategy across exchanges and stablecoins—an approach that appears to be moving resources away from pool-based services.
Key takeaways
- SBI Crypto will stop accepting Bitcoin mining shares and close its mining pool on July 31.
- Miners are being told to maintain hashrate on SBI Crypto until the cutoff to ensure accurate final payouts.
- SimpleMining data places SBI Crypto’s pool among the largest globally—currently around the 12th position by hashrate.
- SBI Crypto has pointed customers toward alternative pools, including Braiins, Luxor, and NeoPool.
- The shutdown aligns with SBI’s wider push into trading and stablecoin-related initiatives rather than mining.
End of SBI Crypto’s Bitcoin pool service
In an announcement posted on its site, SBI Crypto confirmed it will terminate its mining pool operations on July 31 and end share submissions at the same time. The company did not cite a specific reason for closing the pool.
In the same update, SBI Crypto emphasized operational continuity for miners. It asked customers to keep submitting hashrate to the pool until the final day so the platform can complete its payout calculations based on end-of-period share data. “We would sincerely appreciate your continued support by mining with us until the final day of operation,” the company wrote.
Where SBI Crypto sits in global pool rankings
SBI Crypto launched its Bitcoin mining pool in March 2021, entering a competitive segment that, at the time, already included major pool operators such as Poolin, F2Pool, and Binance Pool.
According to data tracked by SimpleMining, SBI Crypto currently ranks as the 12th largest Bitcoin mining pool worldwide. The dataset attributes roughly 21.46 exahashes per second (EH/s) of hashrate to SBI Crypto, representing about 2.24% of the network’s total share.
That position is significantly behind the very top pools. SimpleMining data shows Foundry USA controls about 24.49% of total network share, while AntPool sits around 19.05%. Mid-tier and lower-tier pools such as ViaBTC and MARA Pool account for approximately 8.55% and 5.15% of global Bitcoin mining hashrate, respectively.
For miners and operators monitoring pool reliability, rankings like these matter because they can influence factors such as the consistency of payouts and the pool’s overall draw of hashpower. Even without SBI Crypto’s exact rationale, the size of its current share means the migration away from its pool is likely to be watched closely by miners looking to avoid disruptions around the end date.
Hashrate migration options SBI Crypto recommends
With the July 31 shutdown approaching, SBI Crypto encouraged miners to redirect their hashing power to other Bitcoin pool operators. In its announcement, the company named several alternatives, including Braiins, Luxor, and NeoPool.
SimpleMining’s ranking data suggests that Braiins and Luxor each account for roughly 2% to 3% of global Bitcoin hashrate—placing them in the mid-tier portion of the pool market. NeoPool, meanwhile, is not included among the top-ranked pools by hashrate in the SimpleMining dataset.
SBI Crypto also indicated that some operators may run special programs or offer preferential conditions for clients transitioning from its platform. It advised customers to contact each pool directly to understand any available terms.
That guidance is likely important for both large mining operators and smaller participants. When a pool shuts down, miners typically face a tradeoff between operational convenience and the economics of switching—such as how quickly a new pool can reflect incoming hashpower and what payout structures apply after migration. SBI Crypto’s note that customers should check directly with alternative providers suggests these details may vary case by case.
SBI’s broader crypto direction: trading and stablecoins
The closure of SBI Crypto’s mining pool follows a broader pattern in SBI’s crypto strategy: shifting emphasis from mining toward expanding its financial-market role in digital assets.
Earlier, SBI Holdings agreed to acquire full control of the crypto exchange Bitbank in a deal valued at 46.7 billion Japanese yen (about $289 million), with the stated goal of building what it describes as Japan’s largest cryptocurrency exchange. SBI has also increased its focus on stablecoins—backing JPYSC, a new trust bank-backed Japanese yen stablecoin, and supporting Ripple’s rollout of its Ripple USD (RLUSD) stablecoin in Japan.
While the mining pool is closing due to SBI Crypto’s operational decision, these adjacent initiatives suggest where management believes growth is likely to be concentrated: in regulated exchange infrastructure and stablecoin rails rather than in running a corporate mining service.
For miners, the next question is less about long-term corporate strategy and more about execution: how smoothly hashrate transitions occur across pools and whether payout conditions remain stable around the July 31 cutoff. Watch SBI Crypto’s communications for any final operational clarifications, and track how major pools absorb redistributed hashpower as the shutdown date approaches.
Ripple’s cross-border token has enjoyed robust institutional demand, standing in stark contrast to spot BTC and ETH ETFs, which have been suffering heavy outflows lately.
However, that trend appears to have reversed over the past few days, putting XRP at risk of falling below the psychological $1 barrier.
First Time Since March
It was last November that Canary Capital launched the first spot XRP ETF in the US, with 100% exposure to the asset. Bitwise, Franklin Templeton, 21Shares, and Grayscale then followed suit, and since day 1, these products have generated a cumulative total net inflow of almost $1.5 billion.
Interest in the ETFs has remained solid even during the bear market that ultimately impacted Ripple’s native token. In the past two days, though, outflows have exceeded inflows, marking the first pair of consecutive days since March.
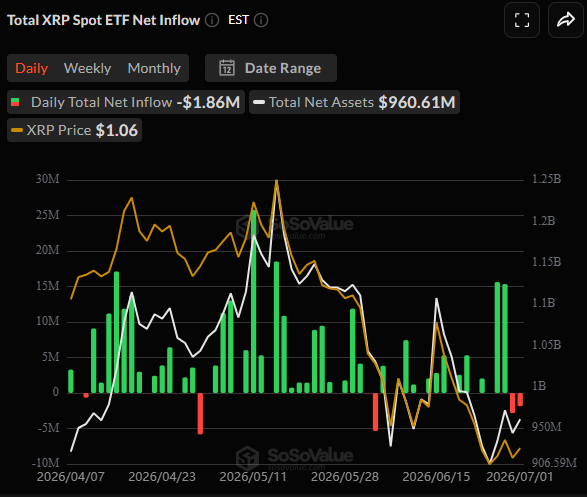
This development suggests that pension funds, hedge funds, and other conservative investors have reduced their exposure to XRP, prompting issuers of these products to sell holdings and further putting downward pressure on the token.
A few days ago, the asset’s price fell to nearly $1, and many feared that the bears would gain full control and suppress it below that crucial zone for the first time since late 2024. The bulls, though, stepped in and reclaimed some of the lost ground, and currently XRP trades at around $1.11 (per CoinGecko).
X user Diana remains cautious and predicted a potential downfall to as low as $0.87 if the asset breaks under $1.08 again. On the other hand, staying above that zone could pave the way for an increase to $1,30, she added.
The Bullish Signals
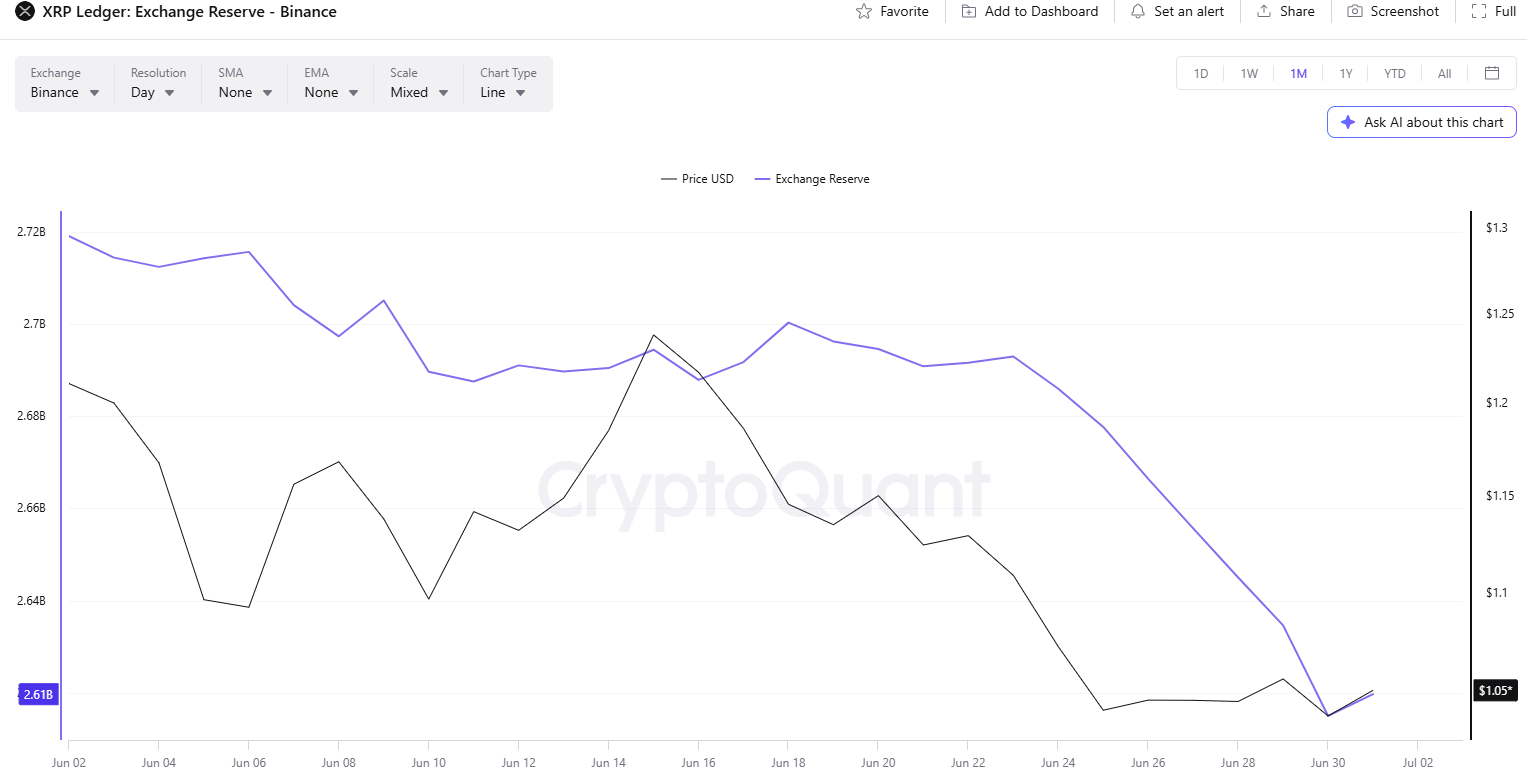
Despite recent ETF outflows, some factors suggest an upcoming upswing is more likely. The amount of XRP stored on Binance, for instance, recently dropped to a four-month low, resulting in reduced selling pressure.
Meanwhile, the popular analyst Ali Martinez revealed that the Tom DeMark (TD) Sequential Indicator (on a monthly scale) has flashed a buy signal on XRP (as well as other cryptocurrencies, including BTC, ETH, and SOL).
“On high-timeframe charts like the monthly, these trend-exhaustion setups carry significant weight. Historically, when multiple assets lock in concurrent monthly buy signals, it indicates seller fatigue and a high probability of a long-term market bottom,” he explained.
The post Ripple (XRP) Repeats a March Move: Could the $1 Floor Finally Crack? appeared first on CryptoPotato.

TLDR
- Ondo Finance launched tokenized versions of BlackRock’s IVV ETF and Micron stock in the U.S.
- The products use a third-party custodial model outlined by the SEC in January.
- Oasis Pro TA mints the tokens with 1:1 backing from the underlying securities.
- The tokenized IVV and Micron products are issued on Ethereum and held by regulated custodians.
- Token holders receive shareholder rights, issuer communications, and onchain proxy voting access.
Ondo Finance launched tokenized versions of BlackRock’s IVV ETF and Micron stock in the U.S. on Thursday. The products use a custodial model outlined by the SEC in January. The launch expands Ondo Finance’s regulated tokenized securities push.
Ondo Finance Uses SEC Custodial Framework
Ondo Finance said the products mark a new step for tokenized U.S.-listed securities. The firm tokenized BlackRock’s iShares Core S&P 500 ETF and Micron shares. Both products trade as blockchain-based representations of traditional securities.
The SEC described this structure in January guidance on tokenized securities. Under that model, a third party holds the underlying securities. It then issues crypto assets that represent investor entitlement to those holdings.
Ondo Finance said its IVV and MU tokens follow that structure. The underlying shares remain inside the normal U.S. custody chain. Oasis Pro TA mints tokens backed 1:1 by those securities.
BlackRock IVV ETF Enters Ondo Tokenized Offering
Ondo Finance issued the tokenized IVV product on Ethereum. Regulated custodians hold the related tokens for eligible users. The company said this structure keeps the product inside existing market systems.
The IVV ETF tracks the S&P 500 and remains a major U.S. equity fund. Ondo Finance now offers blockchain access to that exposure through tokenized ownership. However, the product still depends on traditional custody links.
Ondo Finance CEO Ian De Bode called the launch a regulatory and market milestone. “Today’s milestone shows we can tokenize securities in ways that meet both market and regulatory requirements,” he said.
He added that it supports broader onchain investment access.
Micron Stock Gets Tokenized Under Same Model
Ondo Finance also tokenized Micron shares under the same U.S. custodial setup. The MU-backed token gives eligible holders exposure to the chipmaker’s stock. The token uses the same 1:1 backing process.
Token holders receive shareholder rights linked to traditional brokerage accounts. These rights include issuer communications and proxy voting. Ondo Finance said Broadridge’s ProxyVote.com supports onchain proxy voting for the products.
Transfer limits also apply through broker-dealers, transfer agents, and custodians. These controls align the tokens with current regulatory requirements. Ondo Finance said the framework supports U.S. and global access.
Ondo Finance Expands Tokenized Securities Market
Ondo Finance focuses on tokenized real-world assets and institutional financial products. Its Global Markets platform outside the U.S. supports more than $1 billion in tokenized securities. The platform covers more than 430 stocks and ETFs.
The firm also expanded through a June partnership with Exodus. That deal launched Exodus Markets for eligible users through the Exodus app. The platform offers more than 200 tokenized stocks, ETFs, and real-world assets.
The tokenized equities sector reached a $5.5 billion market cap on June 8. That marked a 147% rise from $2.23 billion at year-start. Ondo Finance now adds U.S.-structured IVV and MU products to that market.


Crypto traders may still measure progress in candles, but the calendar for 2026 is increasingly being set by protocol teams rather than price action. Ethereum, Solana, Avalanche, and Coinbase’s Base network are all moving toward major infrastructure upgrades—while Bitcoin remains largely stuck in debate, with no clear activation path for the most contentious proposals.
According to Tim Sun, a senior researcher at Hong Kong asset manager HashKey Group, earlier rounds of blockchain development tended to prioritize features, speed, and throughput. In 2026, he argues the emphasis is shifting toward reliability, more predictable governance, and the kind of “institutional-grade” infrastructure that can support large-scale financial use cases.
Key takeaways
- Ethereum’s “Glamsterdam” is targeting better scalability and usability, with changes aimed at improving performance while reducing operational friction on the network.
- Solana’s “Alpenglow” focuses on faster finality through a redesigned consensus component, with an explicit goal of reducing confirmation times and simplifying validator activity.
- Base’s “Beryl” hard fork went live after a brief sequencer-related halt, adding a native token standard and shortening withdrawal finality.
- Avalanche’s next push is less about a single branded hard fork and more about performance improvements plus expanded appeal to institutional and tokenized-asset issuers.
- Bitcoin remains the outlier, with covenant and quantum-resistance proposals still lacking an agreed route to activation.
Ethereum’s Glamsterdam: scalability plus governance design
Ethereum’s Glamsterdam is positioned as the most consequential upgrade on the near-term horizon. Ethereum’s public roadmap says the upgrade is intended to improve scalability, harden the layer-1, and make the network easier to use, with a mainnet launch expected in the second half of 2026. (Ethereum upgrade milestone details are linked by Cointelegraph to Ethereum’s own roadmap updates.)
HashKey’s Tim Sun said Glamsterdam should increase throughput by enabling more transactions to be processed simultaneously and by improving capacity so Ethereum can handle more data at higher rates. He also highlighted an effort to reduce database bloat—changes he expects to make the chain better suited to stablecoin settlement and real-world asset workflows that demand steadier performance.
Holly Atkinson, chief product and technology officer at 1inch, described Glamsterdam as Ethereum’s most significant upgrade since The Merge in September 2022, which moved the network from proof-of-work to proof-of-stake. For Atkinson, a central element is enshrined proposer-builder separation (ePBS). She said the current ecosystem still relies heavily on specialized builders and relays, which can concentrate control over transaction ordering and, in turn, amplify risks tied to maximal extractable value (MEV), censorship, and centralization.
ePBS is meant to shift block building and proposing back into the protocol and make the process more transparent and accountable. However, Solana Foundation judge Pavan Kaur—who also runs a compliance engine for digital asset marketing—cautioned that ePBS should be viewed as one step in a larger roadmap rather than a complete solution. In her view, it does not eliminate MEV or fully resolve builder centralization concerns, meaning some behaviors (such as sandwich attacks) could potentially migrate rather than disappear entirely.
Solana’s Alpenglow: accelerating finality and reworking consensus mechanics
Solana’s headline change for 2026 is Alpenglow, a consensus upgrade aimed at reshaping the network’s core agreement process. After an overwhelming governance approval in September 2025, Alpenglow remains under development, with expectations tied to the later 2026 delivery of the Agave 4.1 validator client release.
At the heart of Alpenglow is a redesign intended to speed up how quickly the network reaches finality. Rather than relying on Solana’s existing TowerBFT-based consensus mechanism, the upgrade introduces a new voting component called Votor. The practical implication, as described in coverage of the upgrade, is a major drop in confirmation times—finality targeted at roughly 100–150 milliseconds in optimal conditions, compared with around 12.8 seconds today.
In addition to speed, Alpenglow removes onchain vote transactions, which currently contribute meaningfully to network activity. By streamlining how validators communicate and coordinate on the chain state, the upgrade is intended to make Solana lighter and more efficient when demand rises.
Hadley Stern, board director at DeFi Development Corp, framed the removal of onchain vote transactions as especially important for institutional allocators, saying it can “clean up validator economics” and produce “honest telemetry” that matters when underwriting SOL as a treasury asset. The broader institutional thesis, he implied, is tied to whether Solana’s governance and consensus changes can be integrated with the level of rigor demanded by regulated capital.
Base’s Beryl: post-outage hard fork adds a token standard and shorter exits
Coinbase’s Base network completed its Beryl hard fork on Friday, following a short sequencer-related outage. In that incident, block production stalled for about two hours after an invalid block triggered a temporary consensus failure. Base co-founder Jesse Pollak said user funds were unaffected, while also emphasizing that “a halt is not okay” and that lessons from the episode will be used to further strengthen Base for “global, 24/7 finance.”
Base’s documentation for Beryl says the upgrade introduces a set of changes intended to tighten network performance and reduce friction at the edges. The listed items include a B20 native token standard, a reduction in withdrawal finality from seven days to five, and integration with Reth V2—expected to lower node storage requirements while improving execution efficiency.
Sun characterized Base’s longer-term technical strategy as moving toward a more unified “stack” approach, giving the network more control over how it is built and upgraded. He said this can allow changes to ship more quickly than the earlier Optimism Superchain model. The trade-off, in his view, is the possibility of more fragmented liquidity—since capital that previously moved more easily across a broader ecosystem may become more constrained even as Base deepens integration with Coinbase’s wider user base.
Avalanche and the push for institutional-grade environments
Avalanche’s roadmap direction for 2026 is framed less around a single branded fork and more around broader performance upgrades while courting institutional participants and tokenized asset issuers. Sun pointed to the recent Etna hard fork as a major step: it replaced the earlier subnet model with sovereign Avalanche L1s, cutting the cost of launching a dedicated blockchain by more than 99% and making it easier for institutions to justify their own deployments.
To support that claim, Sun referenced activity he said demonstrates institutional demand. One example cited was Progmat, described as accounting for around 63% of Japan’s national security token market, which migrated more than $2 billion in tokenized assets to a dedicated Avalanche L1. Another example was the Avalanche Payments Collective supported by firms including Franklin Templeton, VanEck, and WisdomTree.
Meanwhile, Atkinson said Avalanche is pursuing two upgrades aimed at making its C-Chain one of the fastest EVM environments. She highlighted “Streaming Asynchronous Execution,” which separates transaction execution from consensus so the chain can run more continuously and scale capacity closer to normal demand. For users, the expected outcome is higher throughput and lower, steadier fees during high-activity periods.
Bitcoin: no scheduled breakthrough, as covenants and quantum-hardening remain unresolved
Bitcoin stands apart from the rest of the field because 2026’s biggest developments are not tied to a clear upgrade timetable. Instead, the focus remains on unresolved disagreements over how programmable Bitcoin should become—and how urgently it should harden against quantum threats.
Bitcoin hasn’t activated a major soft fork since Taproot in 2020, which expanded scripting flexibility and improved privacy. Since then, debate around covenant-related proposals such as OP_CAT, CheckTemplateVerify (CTV), and Lightning-focused ideas like LNHANCE has intensified, but none has an agreed activation route. Researchers are also discussing proposals such as BIP-360 and related ideas meant to ease migration of coins into quantum-resistant spending paths if the quantum threat becomes practical.
Atkinson described Bitcoin as the group’s wildcard: covenant proposals could unlock safer storage and richer scripting, but they remain divisive. Sun said they could improve aspects of self-custody security, fee management, and protocols like Lightning and Ark, potentially allowing institutions to implement programmable custody logic directly at the L1.
On consensus reality, there is broad agreement—according to the linked comparison coverage—that no covenant opcode is on track for activation this year, and that reaching consensus on proposals like OP_CAT or CTV is still some distance away. On the quantum-resistance track, BIP-360’s authors estimate that moving to quantum-resistant addresses and signatures would take years even under optimistic assumptions, making it unlikely that a quantum-resistance upgrade would be implemented before the end of 2026.
Looking ahead, the clearest near-term signal investors and builders should track is not debate, but delivery: Ethereum’s Glamsterdam mainnet timeline, Solana’s Alpenglow readiness alongside Agave 4.1, and whether Base’s post-Beryl stability improvements hold under sustained load. For Bitcoin, the key question is whether any covenant or quantum-hardening proposals can shift from discussion to an actual, shared activation path.


Market price tells you what Bitcoin is worth right now. Realized price tells you what the market actually paid for it. When spot falls below that line, the whole market is underwater, and history says that is where bottoms tend to form.
Summary
- Realized price is the average price at which all circulating Bitcoin last moved on-chain, which makes it a measure of the market’s aggregate cost basis rather than its current value.
- It is calculated by dividing realized capitalization, the sum of every coin valued at the price it last moved, by the circulating supply.
- When the market price sits above realized price, holders in aggregate are in profit; when it falls below, the aggregate market is underwater, a condition that has historically appeared near cycle bottoms.
- Realized price is the foundation of a family of on-chain metrics, including MVRV and the MVRV Z-score, that analysts use to judge whether Bitcoin is overvalued or undervalued.
- It is a context tool, not a timing signal: realized price can fall, it relies on assumptions about coin movement, and it works best cross-checked against other data.
Realized price is one of the most useful on-chain metrics for understanding where Bitcoin sits in its market cycle, and it answers a question the ordinary price chart cannot: what did the market actually pay for its coins? While the market price shows what Bitcoin is worth at this moment, realized price shows the average cost basis of every coin in circulation, based on the last time each one moved on the blockchain. That distinction turns realized price into a kind of break-even line for the whole market, and the relationship between spot price and that line has historically marked periods of profit, loss, and, at the extremes, major tops and bottoms. This explainer covers what realized price is, how it is calculated, why it matters, and where its limits lie.
Realized price versus market price
The starting point is the difference between two ways of valuing the same coins. Market price is simple: it is the current trading price of Bitcoin, and market capitalization is that price multiplied by the number of coins in circulation. It reflects the latest sentiment, updated tick by tick, and it swings with every wave of buying and selling. It tells you what the market thinks Bitcoin is worth right now.
Realized price takes a different approach. Instead of valuing every coin at today’s price, it values each coin at the price it held the last time it moved from one wallet to another on-chain. The assumption is that when a coin moves, it is changing hands at roughly the market price of that moment, which approximates the price its current holder paid. Summing all of those individual last-moved values, and dividing by the supply, gives the average on-chain cost basis of the entire market. That is realized price.
The practical effect is that realized price strips out short-term sentiment. A sudden rally or crash changes the market price immediately, but it barely moves realized price, because most coins have not changed hands at the new level. Realized price only shifts as coins actually move at new prices, so it behaves like a slow-moving average of what holders paid. This is why analysts treat it as a measure of the market’s underlying economic reality rather than its momentary mood, and why the gap between the two prices carries so much information.
How realized price is calculated
Realized price is built on a companion metric called realized capitalization, or realized cap. To construct realized cap, you take every unit of Bitcoin and assign it the price it held the last time it moved on-chain, then add all of those values together. For Bitcoin, whose ledger is made of unspent transaction outputs, every output has a recorded last-moved price, which makes this calculation precise. Realized cap is therefore the sum of the whole market’s cost basis, an aggregate of what everyone effectively paid.
Realized price is then simply realized cap divided by the circulating supply. If realized cap represents the total dollars the market has committed to its coins, realized price represents the average dollars per coin. The concept traces back to work by on-chain analysts around 2018, when realized cap and the ratios built on it were introduced to bring cost-basis thinking into Bitcoin cycle analysis.
A simplified worked example makes it concrete. Imagine a tiny network of just four coins that last moved at prices of $20,000, $40,000, $60,000, and $80,000. The realized cap is the sum, $200,000, and the realized price is that divided by four coins, or $50,000. Now suppose the current market price is $45,000. The market price sits below the realized price of $50,000, which means that, on average, holders paid more than the coins are currently worth. In aggregate, the market is underwater. Scale that logic up to Bitcoin’s millions of coins and years of transaction history, and you have a single number that tells you whether the average holder is sitting on a gain or a loss.
Why realized price matters: the market’s cost basis
The value of realized price comes from what the gap between it and the market price reveals. When the market price is above realized price, the average holder is in profit, because coins are worth more than they last moved for. When the market price is below realized price, the average holder is at a loss, sitting on unrealized losses across the market. Realized price therefore acts as an aggregate break-even line, and crossing it in either direction is a meaningful event.
That break-even framing has real behavioral consequences. When the market trades below realized price, a large share of holders are underwater, and history shows this dampens natural selling: many people are reluctant to sell at a loss, so supply from ordinary holders tends to dry up. At the same time, the holders who do capitulate and sell at a loss during these periods are often selling to longer-term, value-oriented buyers near cycle lows. This is the emotional churn of a bottom, where weak hands give way to strong ones, and realized price is the line that defines who is above water and who is not.
On the other side, when the market price runs far above realized price, most of the supply sits on large paper gains, which makes the market more sensitive to profit-taking. A market where nearly everyone is deeply in profit has more potential sellers waiting, which is one reason extreme readings of the gap have historically aligned with cycle tops. Realized price, in other words, does not just tell you the market’s cost basis; it tells you something about the pressure of latent buying and selling built into the current price.
Realized price at cycle bottoms
The most watched use of realized price is as a bottoming indicator. Historically, the periods when Bitcoin’s market price fell below its realized price have been rare and have tended to cluster around major cycle lows. Because falling below realized price means the aggregate market is underwater, it usually coincides with deep bear-market sentiment, capitulation, and negative news, exactly the conditions that have, in past cycles, preceded strong recoveries. Buying Bitcoin during these below-cost-basis stretches has, in hindsight, produced some of the best long-term returns in its history.
The mechanism behind this is the churn of holders described above. As the market grinds below realized price, holders who cannot tolerate losses sell to value investors who are willing to accumulate at prices below the market’s average cost. That transfer of coins from weaker to stronger hands is a hallmark of a maturing bottom. Eventually, selling pressure exhausts, and as the market recovers, the price climbs back above realized price into the next expansion phase. Realized price thus behaves like a floor that the market probes during capitulation and reclaims during recovery.
It is important to be precise about what this does and does not promise. A drop below realized price has historically marked value zones, but it is not a guarantee of an immediate bottom, and the market can trade below its cost basis for an extended period during a deep bear market. Realized price identifies when the average holder is underwater, which is a necessary feature of past bottoms, but not a precise timing tool for the exact low. It tells you the market is in a historically significant zone, not the day it will turn.
The metric family: MVRV and the MVRV Z-score
Realized price and realized cap are the foundation for a broader set of on-chain valuation tools, and understanding the family helps you use any one of them. The most common is MVRV, the market-value-to-realized-value ratio, which divides market cap by realized cap. MVRV expresses the same information as the realized-price gap in ratio form: an MVRV above one means the market trades above its cost basis, and below one means it trades below it. Historically, MVRV readings below one have marked some of the best buying opportunities, while very high readings have marked cycle tops.
A refinement is the MVRV Z-score, which takes the difference between market cap and realized cap and normalizes it by the historical volatility of market cap. This adjustment makes it easier to compare extremes across different cycles, because it measures how unusual the current deviation is relative to Bitcoin’s own history instead of in raw dollar terms. The Z-score has been notably effective at flagging cycle tops, historically identifying major highs within a couple of weeks, and its lower band has marked deep-value bottoms.
Analysts also split these metrics by holder cohort. Short-term and long-term realized prices separate coins by age, often at a threshold around 155 days, to compare the cost basis of recent buyers against seasoned holders. When the short-term holder cost basis breaks below the long-term one, or when the market trades between them, it signals stress or transition. Related metrics such as the spent output profit ratio, which tracks whether coins are moving at a profit or loss, and measures of supply in profit or loss, round out the toolkit. The lesson is that realized price is rarely used alone; it is the anchor for a system of cost-basis metrics.
Reading realized price today
Realized price is most talked about during downturns, and a deep drawdown is exactly when it becomes most relevant. When Bitcoin falls far from a prior all-time high, the market price approaches and can breach the realized price, pushing the aggregate market toward or below its cost basis. That is the moment analysts start citing realized price heavily, because it frames the central question of a bear market: is the market simply underwater in a historically normal way that has preceded recoveries, or is something more structural at work?
Reading it well means treating realized price as context rather than a trigger. If the market is trading near or below realized price, the metric tells you the average holder is close to break-even or underwater, which historically has been a zone of value and reduced selling pressure. It does not tell you the exact bottom, and it must be weighed against the wider environment, including liquidity conditions, demand from buyers such as funds and treasuries, and the behavior of long-term holders. A market below realized price with returning demand is a very different picture from one below realized price with demand still fleeing.
The most useful habit is to watch realized price alongside its relatives and the flows around it. Is spot above or below realized price, and by how much? What is MVRV or the Z-score saying about how extreme the deviation is? Are long-term holders accumulating or distributing? Combining realized price with those cross-checks turns a single line into a genuine read on the market’s cost-basis health, which is far more informative than the spot chart alone during the fear and noise of a downturn.
The limits of realized price
Realized price is powerful, but it comes with important caveats that separate careful analysts from those who misread it. The first is that it is not a timing tool. A market can trade below realized price for months during a severe bear market, so the metric identifies a value zone, not a turning date. Treating a single break below realized price as a signal to expect an immediate bottom has caught out many people who underestimated how long capitulation can last.
The second caveat is that realized price can fall, which surprises people who assume cost basis only rises. When holders sell heavily at a loss, those coins move at the new lower prices, which drags the aggregate cost basis, and therefore realized price, downward. In a deep enough decline, realized price itself declines, so a level that looked like firm support can drift lower. Realized price is a moving line shaped by holder behavior, not a fixed floor. There are also structural quirks: the metric assumes a coin moving between wallets represents a change of ownership at market price, which is not always true, since exchange transfers and internal shuffles can move coins without a real sale. Lost coins that can never move again also sit in the calculation at old prices, gently distorting it.
The final and most important caveat is that realized price should never be read in isolation. Its creators and the analysts who use it consistently pair it with other data: the spent output profit ratio, supply in profit or loss, exchange inflows and outflows, and the derivatives structure that can make the spot picture misleading. Different chains need different adjustments, and even for Bitcoin the metric works best as one input among several. Used that way, as a cost-basis thermometer read alongside its family and the surrounding flows, realized price is one of the most reliable tools in on-chain analysis. Used alone as a precise buy or sell signal, it will disappoint.
Realized price across holder cohorts and other assets
The aggregate realized price is the headline number, but the concept becomes more powerful when it is broken down, and understanding that adds real depth. Analysts often split realized price by holder cohort, most commonly separating short-term holders from long-term holders using a coin-age threshold around 155 days. Short-term holder realized price tracks the cost basis of recent buyers, who tend to be more reactive, while long-term holder realized price tracks the cost basis of seasoned holders, who tend to hold through volatility. The short-term line usually sits closer to the market price and often acts as nearer-term support or resistance, while the long-term line moves slowly and marks a deeper floor.
Reading the two cohorts together tells a story the aggregate hides. In a healthy uptrend, the market price sits above both cohorts’ cost bases, so almost everyone is in profit. When the market falls below the short-term holder cost basis, recent buyers move underwater first, which historically pressures the group most likely to panic-sell. When it falls all the way below the long-term holder cost basis, even seasoned holders are underwater, a condition seen only in the depths of bear markets and often near major bottoms. Watching which cohort’s line the price is testing gives a finer read than the single aggregate number.
The concept also extends beyond Bitcoin, though with adjustments. For Ethereum, which uses an account-based ledger instead of Bitcoin’s unspent-output model, data providers approximate address-level cost bases and aggregate them, preserving the spirit of cost-basis valuation. Ethereum also requires care around its supply: the fee burn introduced by its network upgrades reduces effective supply over time, and staking flows change what counts as circulating, so realized price and its ratios need burn-adjusted and staking-aware supply figures to be accurate. The same idea applies to other large assets, always with chain-specific quirks.
The takeaway is that realized price is not a single rigid number but a lens that can be focused. Aggregate realized price gives the market-wide cost basis; cohort realized prices reveal which groups of holders are in profit or pain; and adapting the metric to other chains extends its usefulness across the market. Used at these finer resolutions, and always with awareness of each chain’s supply mechanics, realized price becomes a far richer tool than the single line most people first encounter.
Frequently Asked Questions
What is realized price in simple terms?
Realized price is the average price at which all Bitcoin in circulation last moved on-chain, which makes it a measure of the market’s aggregate cost basis, or what holders effectively paid. Unlike the market price, which reflects the latest trading value, realized price only changes as coins actually move at new prices, so it behaves like a slow-moving average of the market’s break-even level.
How is realized price calculated?
Realized price is realized capitalization divided by the circulating supply. Realized cap is found by valuing every coin at the price it held the last time it moved on-chain and summing those values. So if four coins last moved at $20,000, $40,000, $60,000, and $80,000, realized cap is $200,000 and realized price is $50,000, the average on-chain cost basis.
What does it mean when Bitcoin trades below realized price?
It means the aggregate market is underwater, with the average holder sitting on an unrealized loss because coins are worth less than they last moved for. Historically, these periods have been rare and clustered near cycle bottoms, coinciding with capitulation and deep bearish sentiment. They have often marked strong long-term value zones, though not a precise date for the low.
Is realized price a reliable bottom signal?
It is a useful context tool, not a precise timing signal. Falling below realized price has historically marked value zones near cycle lows, but the market can trade below its cost basis for an extended period in a deep bear market. Realized price tells you the average holder is underwater, a common feature of past bottoms, but it should be combined with other data before drawing conclusions.
How is realized price related to MVRV?
They express the same idea in different forms. MVRV, the market-value-to-realized-value ratio, divides market cap by realized cap, so an MVRV below one means the market trades below its cost basis, the same message as spot falling below realized price. The MVRV Z-score refines this by normalizing the gap for volatility, making it easier to spot extreme highs and lows across different cycles.
Can realized price go down?
Yes. Realized price rises as coins move at higher prices, but it can also fall. When holders sell heavily at a loss, those coins move at lower prices and drag the aggregate cost basis, and therefore realized price, downward. This means realized price is a moving line shaped by holder behavior, not a fixed floor, and a level that looked like support can drift lower in a deep decline.
What is the difference between realized price and realized cap?
Realized cap is the total, and realized price is the per-coin average. Realized cap sums the value of every coin at the price it last moved, giving the market’s aggregate cost basis in dollars. Realized price divides that total by the circulating supply to give the average cost basis per coin. Realized cap is compared with market cap; realized price is compared with the market price.
What are the main limitations of realized price?
It is not a timing tool, since markets can stay below it for months. It can fall when holders sell at a loss, so it is not a fixed floor. It assumes coins moving between wallets represent real ownership changes at market price, which is not always true, and lost coins distort it. Because of these quirks, it works best alongside other metrics like SOPR, supply in profit or loss, and exchange flows.
Disclaimer: This article is for information and educational purposes only and does not constitute financial, investment, or trading advice. On-chain metrics describe historical patterns that may not repeat, and cryptocurrency prices are highly volatile. Nothing here is a recommendation to buy or sell any asset. Always do your own research and consider consulting a qualified professional before making financial decisions. Information is accurate as of July 2, 2026, and may change.
TLDR;
- Trump crypto earnings exceeded $1.4 billion, according to federal financial disclosures, with most income linked to World Liberty Financial and the TRUMP memecoin licensing business.
- Donald Trump said he does not actively manage his investments, explaining that external funds and blind trust arrangements oversee his personal finances rather than himself.
- Financial filings reveal more than $600 million came from TRUMP memecoin royalties and over $500 million originated from World Liberty Financial operations.
- Ethics experts continue debating whether blind trust protections remain effective when policies affecting digital assets overlap with businesses carrying the president’s own brand.
Trump crypto earnings have become a major talking point after newly released federal financial disclosures showed more than $1.4 billion in digital asset-related income. Speaking to reporters, President Donald Trump said he does not oversee his personal investments and relies on professional fund managers and blind trusts to manage his assets.
The disclosures indicate that most of the reported income came from businesses connected to the Trump family, including World Liberty Financial and licensing revenue tied to the TRUMP memecoin. The filings have renewed debate over ethics, financial transparency and potential conflicts involving cryptocurrency ventures.
Trump Crypto Earnings Driven by Memecoin and Financial Ventures
Federal financial disclosures filed with the U.S. Office of Government Ethics show that Trump reported more than $1.4 billion in digital asset income. According to the filing, over $600 million came from licensing and royalty agreements connected to the TRUMP memecoin.
World Liberty Financial generated more than $500 million of the reported income. The crypto project focuses on governance tokens and stablecoin products. Together, these businesses accounted for nearly all of the disclosed digital asset earnings.
Responding to questions, Trump said he does not actively monitor his investment portfolio. He explained that outside funds manage his assets and that he was not personally involved in day-to-day financial decisions. His remarks have become central to the discussion surrounding the latest disclosures.
Trump Crypto Earnings Fuel Ethics Debate Over Policy Decisions
The disclosures have intensified scrutiny from ethics experts and Democratic lawmakers. Critics argue that a blind trust is only effective if the beneficiary has no meaningful knowledge or influence over assets held within it. They also point to administration policies supporting digital asset innovation while businesses linked to Trump operate in the same industry.
The TRUMP memecoin illustrates the divide between project revenue and investor outcomes. After reaching prices above $74 following its launch, the token later traded near $1.68. Market analysts estimate retail investors collectively lost billions during the decline, while Trump-linked businesses reported substantial earnings from licensing activity.
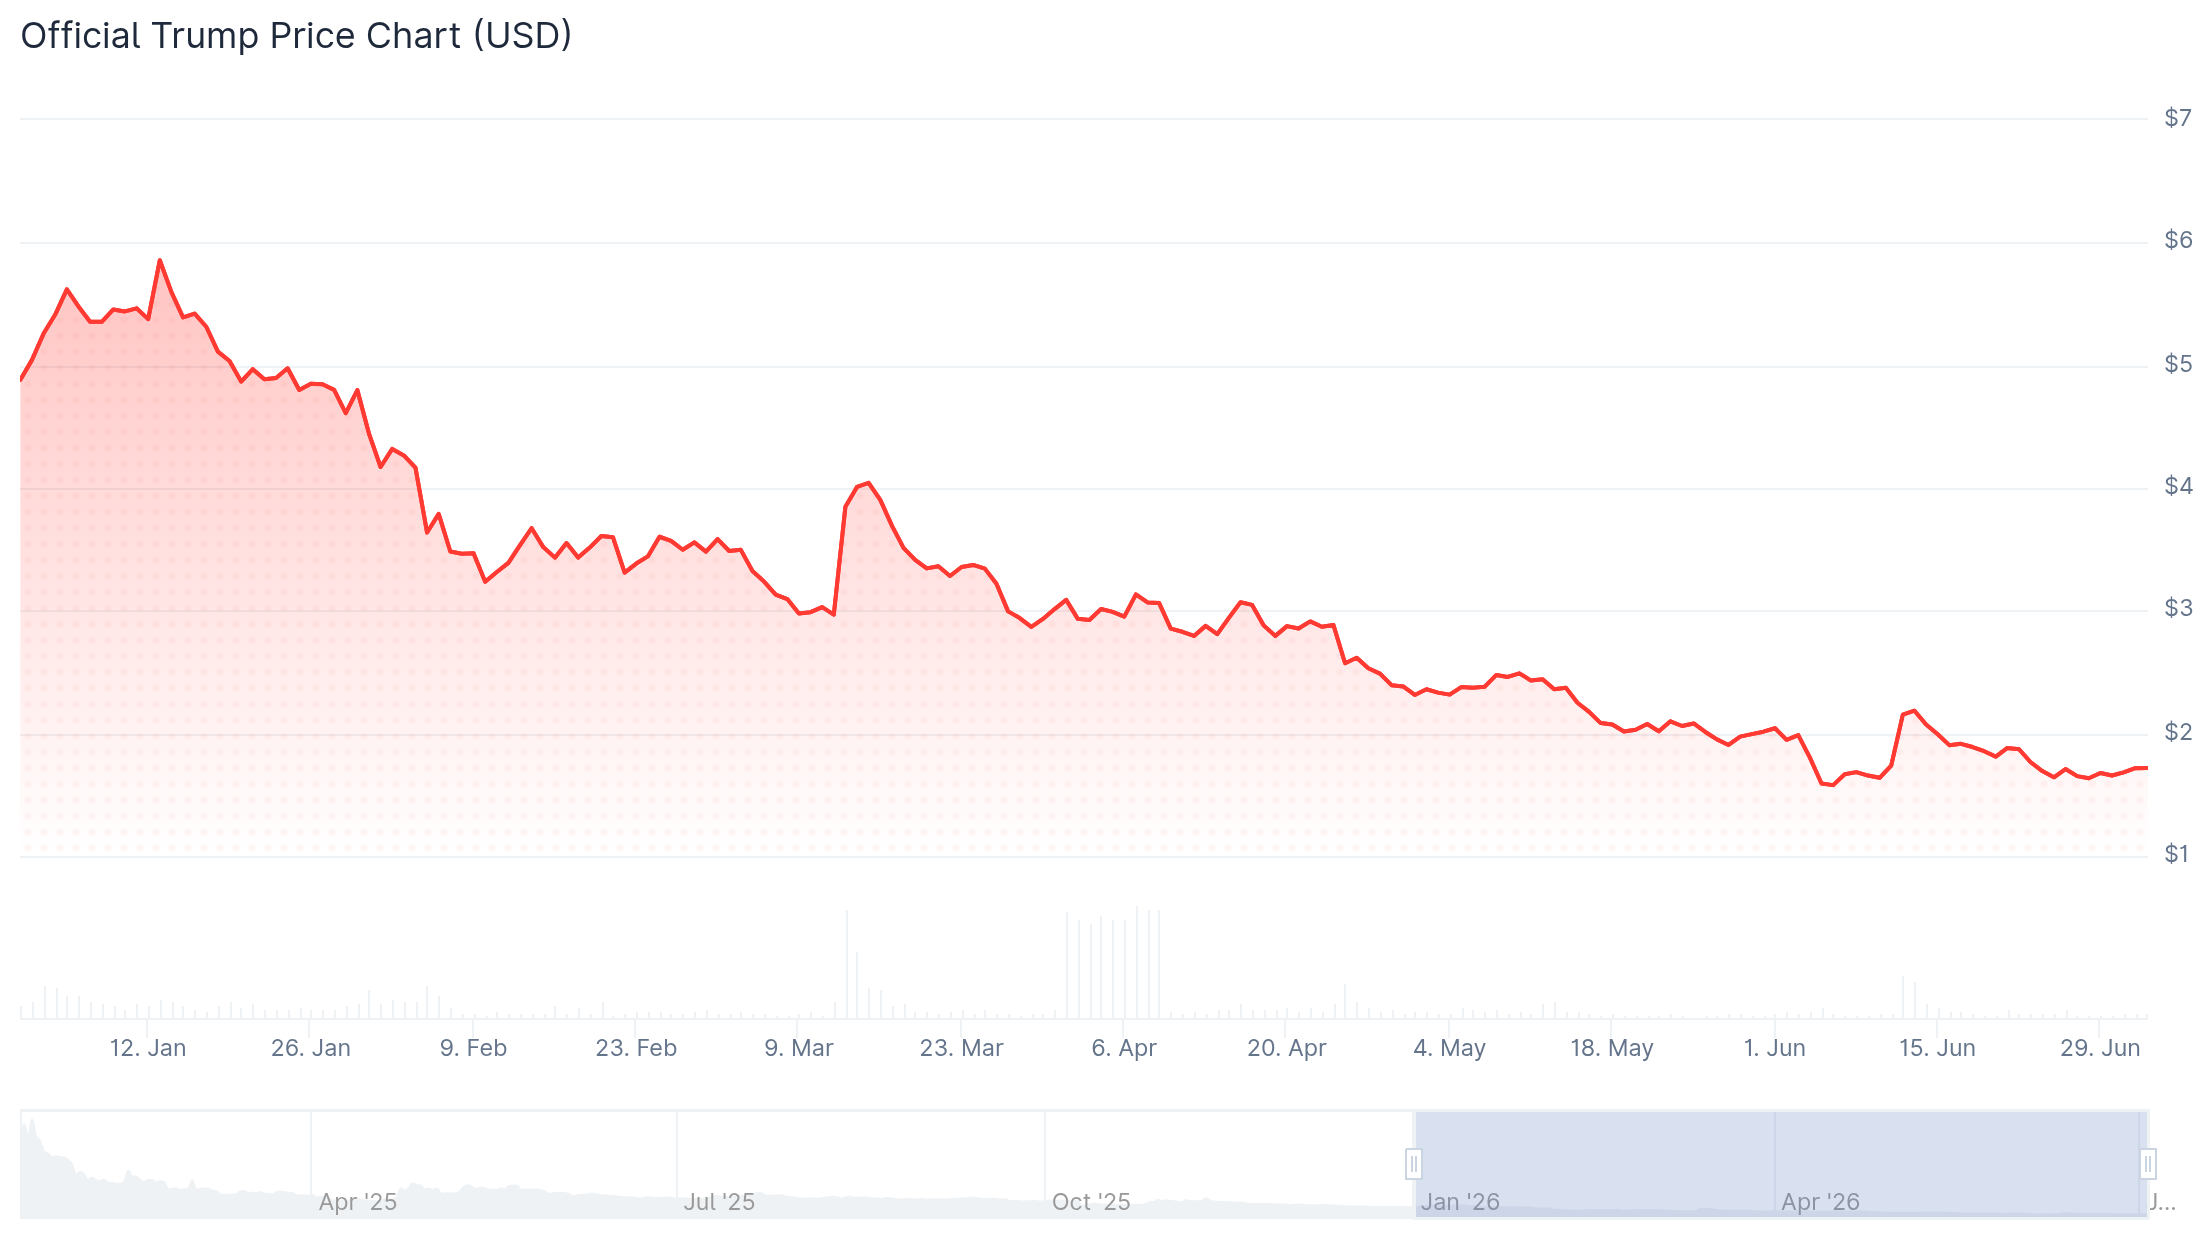
World Liberty Financial also experienced sharp price declines after its governance tokens entered the market. Additionally, a $500 million investment from a UAE-linked entity near Trump’s inauguration has drawn additional attention from ethics watchdogs.
The administration has defended its digital asset agenda, including support for stablecoin legislation through the proposed GENIUS Act. Opponents argue the overlap between crypto policymaking and family-linked business interests deserves closer examination, even though no official findings have alleged unlawful conduct.

Bitcoin has climbed more than 4% to briefly reclaim $62,000 after a weaker-than-expected U.S. jobs report reduced market expectations for another Federal Reserve rate hike this year.
Summary
- Bitcoin briefly climbed above $62,000 after weaker-than-expected U.S. payroll data reduced expectations for another Fed rate hike.
- Polymarket and CME FedWatch data showed traders lowering rate hike bets while increasing expectations that the Fed will hold rates steady in July.
- Analysts say Bitcoin must reclaim $62,500 to confirm a stronger recovery, though some still view the move as a relief rally.
According to the U.S. Bureau of Labor Statistics, the U.S. economy added 57,000 nonfarm payrolls in June, well below economists’ expectations of 115,000. The agency also revised May’s payroll figure lower by 43,000 jobs, ending a three-month stretch in which employment growth had consistently exceeded forecasts.
Meanwhile, the unemployment rate came in at 4.2%, slightly below the expected 4.3%, suggesting hiring has slowed even as the labor market remains relatively resilient.
The report sparked a rally across risk assets, with Bitcoin (BTC) surging from below $60,000 earlier in the week to more than $62,000 on July 2 before stabilizing near $61,655 at the time of writing, according to data from crypto.news. The recovery followed several sessions of weakness driven by fears that the Federal Reserve could tighten policy again after officials projected additional rate increases during last month’s policy meeting.
Softer jobs report has shifted Fed expectations
The latest labor market data immediately changed traders’ expectations for the remainder of the year. Polymarket data showed the probability of another Federal Reserve rate hike in 2026 dropping to 47%, down from 54% the previous day, as market participants reassessed the likelihood of further tightening if hiring continues to lose momentum.
The move is notable because policymakers struck a comparatively hawkish tone after the June Federal Open Market Committee meeting. Most Fed officials projected at least one additional rate increase before year-end in their updated economic forecasts, while several policymakers expected more than one hike.
Market sentiment also received support from comments made a day earlier by Federal Reserve Chair Kevin Warsh at the ECB Forum. Although Warsh declined to outline the future path of monetary policy, he said inflation risks were easing, remarks that investors interpreted as reducing the urgency for another rate increase.
Expectations for the upcoming July policy meeting shifted as well. CME FedWatch data showed an 80.2% probability that the Federal Reserve will leave interest rates unchanged, up from roughly 72% a day earlier, indicating traders now see policymakers waiting for additional economic data before making their next move.
Bitcoin faces a critical technical test after the rebound
The macro-driven rally has pushed Bitcoin into an area that several technical analysts consider pivotal for confirming whether the recent rebound can develop into a sustained recovery.
According to analyst Ardi, Bitcoin is approaching a decisive point where reclaiming both a long-standing descending trendline and the $62,500 horizontal resistance could alter the market structure that has dominated for the past month.
“If BTC can reclaim the trendline and 62.5k horizontal resistance, that would be the first structural break from this month-long pattern. This would also be the strongest structural base throughout this entire correction, confirming the 57k low as the mid-cycle bottom.”
Bitcoin’s own chart now shows the market moving toward that test. On the 4-hour timeframe, the cryptocurrency has reclaimed the 23.6% Fibonacci retracement near $60,065 and climbed above the 38.2% retracement around $61,444 after briefly trading beyond $62,000. The next resistance levels sit near the 50% Fibonacci retracement at $62,559, followed by the 61.8% level around $63,673, while the 78.6% retracement near $65,260 represents the next major upside hurdle if buyers maintain momentum.
Momentum indicators have also improved. The MACD has completed a bullish crossover, with the histogram turning increasingly positive, while the Supertrend indicator remains in bullish territory around $58,541, suggesting the recent rebound continues to hold technical support.
Other market observers have also pointed to improving conditions beneath the surface. Commenting on order-flow activity, crypto analyst Ted Pillows said aggressive Bitcoin buying was taking place on Binance and OKX, while selling pressure on Coinbase had cooled, indicating stronger spot demand was emerging across major exchanges.
Not everyone, however, believes the correction is over. Crypto trader Altcoin Sherpa said Bitcoin looks constructive on lower time frames and expects altcoins to continue performing well as long as Bitcoin remains healthy. Yet, he cautioned that the current move still resembles a relief rally and said he would only become confident that the correction has ended after Bitcoin reclaims the $65,000-$70,000 range on higher time frames.
Disclosure: This article does not represent investment advice. The content and materials featured on this page are for educational purposes only.

World Cup 2026: Portugal want to honour Diogo Jota by winning World Cup
More IPO Fluffing: Musk’s Starlink Hints At Becoming Full Wireless Phone Company

Daily Challenger #13- Financial Literacy


-

 Fashion6 days ago
Weekend Open Thread: Staud – Corporette.com
-

 Politics7 days ago
The House | Manchesterism won’t survive the painful trade-offs unless it gets citizens on board
-

 Crypto World3 days ago
Strategy authorizes up to $1.25B in Bitcoin sales under new capital plan
-

 Business7 days ago
Asia stock markets slide as tech shares slump
-

 News Videos4 days ago
MAJOR BITCOIN & MARKET UPDATE!!!! (MUST WATCH ASAP!!!)
-

 Tech3 days ago
Anonymous researcher drops 0-day ‘exploitarium’ repo
-

 Crypto World5 days ago
Coinbase, Circle Deepen Crypto Stock Losses Despite Resilient S&P 500
-

 Business3 days ago
Australia treasurer says alleged access of prime minister’s bank data ’incredibly concerning’
-

 Crypto World6 days ago
Kraken's xStocks Opens Bending Spoons IPO Registration to EEA Retail
-

 Sports6 days ago
FIH Pro League: India defeat Pakistan 7-1, register biggest win of campaign | Other Sports News
-

 Tech5 days ago
Bluekit phishing kit adopts browser-in-the-middle for login theft
-

 Crypto World7 days ago
Tether (USDT) Passes Ether in Market Cap as ETH Drops Toward $1.5K
-
Crypto World7 days ago
Hyperliquid Named on Singapore MAS Investor Alert Register
-

 Tech6 days ago
Russian hackers now target Signal backup recovery keys
-

 Crypto World6 days ago
RTX holders must register wallets before token distribution begins
-

 Sports2 days ago
Broncos roster: OL Ben Powers (No. 74) entering final year of contract
-
 Business3 days ago
The AI boom won’t burst all at once. It will pop in ‘rolling bubbles’: Macquarie
-

 Tech5 days ago
Claude Code turned every engineer into three. Now companies need more product thinkers
-
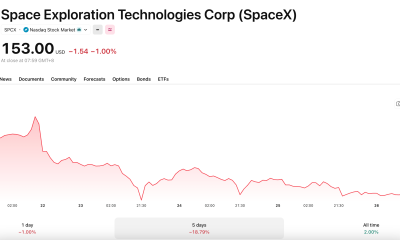
 Crypto World7 days ago
SpaceX Called a Market Top Signal Just 2 Weeks After Its $86 Billion IPO
-

 Tech5 days ago
Silicon Valley paid to kill AI regulation, now it wants the rules back
You must be logged in to post a comment Login