
Crypto World
What is realized price? Bitcoin’s on-chain cost basis



Market price tells you what Bitcoin is worth right now. Realized price tells you what the market actually paid for it. When spot falls below that line, the whole market is underwater, and history says that is where bottoms tend to form.
Summary
- Realized price is the average price at which all circulating Bitcoin last moved on-chain, which makes it a measure of the market’s aggregate cost basis rather than its current value.
- It is calculated by dividing realized capitalization, the sum of every coin valued at the price it last moved, by the circulating supply.
- When the market price sits above realized price, holders in aggregate are in profit; when it falls below, the aggregate market is underwater, a condition that has historically appeared near cycle bottoms.
- Realized price is the foundation of a family of on-chain metrics, including MVRV and the MVRV Z-score, that analysts use to judge whether Bitcoin is overvalued or undervalued.
- It is a context tool, not a timing signal: realized price can fall, it relies on assumptions about coin movement, and it works best cross-checked against other data.
Realized price is one of the most useful on-chain metrics for understanding where Bitcoin sits in its market cycle, and it answers a question the ordinary price chart cannot: what did the market actually pay for its coins? While the market price shows what Bitcoin is worth at this moment, realized price shows the average cost basis of every coin in circulation, based on the last time each one moved on the blockchain. That distinction turns realized price into a kind of break-even line for the whole market, and the relationship between spot price and that line has historically marked periods of profit, loss, and, at the extremes, major tops and bottoms. This explainer covers what realized price is, how it is calculated, why it matters, and where its limits lie.
Realized price versus market price
The starting point is the difference between two ways of valuing the same coins. Market price is simple: it is the current trading price of Bitcoin, and market capitalization is that price multiplied by the number of coins in circulation. It reflects the latest sentiment, updated tick by tick, and it swings with every wave of buying and selling. It tells you what the market thinks Bitcoin is worth right now.
Realized price takes a different approach. Instead of valuing every coin at today’s price, it values each coin at the price it held the last time it moved from one wallet to another on-chain. The assumption is that when a coin moves, it is changing hands at roughly the market price of that moment, which approximates the price its current holder paid. Summing all of those individual last-moved values, and dividing by the supply, gives the average on-chain cost basis of the entire market. That is realized price.
The practical effect is that realized price strips out short-term sentiment. A sudden rally or crash changes the market price immediately, but it barely moves realized price, because most coins have not changed hands at the new level. Realized price only shifts as coins actually move at new prices, so it behaves like a slow-moving average of what holders paid. This is why analysts treat it as a measure of the market’s underlying economic reality rather than its momentary mood, and why the gap between the two prices carries so much information.
How realized price is calculated
Realized price is built on a companion metric called realized capitalization, or realized cap. To construct realized cap, you take every unit of Bitcoin and assign it the price it held the last time it moved on-chain, then add all of those values together. For Bitcoin, whose ledger is made of unspent transaction outputs, every output has a recorded last-moved price, which makes this calculation precise. Realized cap is therefore the sum of the whole market’s cost basis, an aggregate of what everyone effectively paid.
Realized price is then simply realized cap divided by the circulating supply. If realized cap represents the total dollars the market has committed to its coins, realized price represents the average dollars per coin. The concept traces back to work by on-chain analysts around 2018, when realized cap and the ratios built on it were introduced to bring cost-basis thinking into Bitcoin cycle analysis.
A simplified worked example makes it concrete. Imagine a tiny network of just four coins that last moved at prices of $20,000, $40,000, $60,000, and $80,000. The realized cap is the sum, $200,000, and the realized price is that divided by four coins, or $50,000. Now suppose the current market price is $45,000. The market price sits below the realized price of $50,000, which means that, on average, holders paid more than the coins are currently worth. In aggregate, the market is underwater. Scale that logic up to Bitcoin’s millions of coins and years of transaction history, and you have a single number that tells you whether the average holder is sitting on a gain or a loss.
Why realized price matters: the market’s cost basis
The value of realized price comes from what the gap between it and the market price reveals. When the market price is above realized price, the average holder is in profit, because coins are worth more than they last moved for. When the market price is below realized price, the average holder is at a loss, sitting on unrealized losses across the market. Realized price therefore acts as an aggregate break-even line, and crossing it in either direction is a meaningful event.
That break-even framing has real behavioral consequences. When the market trades below realized price, a large share of holders are underwater, and history shows this dampens natural selling: many people are reluctant to sell at a loss, so supply from ordinary holders tends to dry up. At the same time, the holders who do capitulate and sell at a loss during these periods are often selling to longer-term, value-oriented buyers near cycle lows. This is the emotional churn of a bottom, where weak hands give way to strong ones, and realized price is the line that defines who is above water and who is not.
On the other side, when the market price runs far above realized price, most of the supply sits on large paper gains, which makes the market more sensitive to profit-taking. A market where nearly everyone is deeply in profit has more potential sellers waiting, which is one reason extreme readings of the gap have historically aligned with cycle tops. Realized price, in other words, does not just tell you the market’s cost basis; it tells you something about the pressure of latent buying and selling built into the current price.
Realized price at cycle bottoms
The most watched use of realized price is as a bottoming indicator. Historically, the periods when Bitcoin’s market price fell below its realized price have been rare and have tended to cluster around major cycle lows. Because falling below realized price means the aggregate market is underwater, it usually coincides with deep bear-market sentiment, capitulation, and negative news, exactly the conditions that have, in past cycles, preceded strong recoveries. Buying Bitcoin during these below-cost-basis stretches has, in hindsight, produced some of the best long-term returns in its history.
The mechanism behind this is the churn of holders described above. As the market grinds below realized price, holders who cannot tolerate losses sell to value investors who are willing to accumulate at prices below the market’s average cost. That transfer of coins from weaker to stronger hands is a hallmark of a maturing bottom. Eventually, selling pressure exhausts, and as the market recovers, the price climbs back above realized price into the next expansion phase. Realized price thus behaves like a floor that the market probes during capitulation and reclaims during recovery.
It is important to be precise about what this does and does not promise. A drop below realized price has historically marked value zones, but it is not a guarantee of an immediate bottom, and the market can trade below its cost basis for an extended period during a deep bear market. Realized price identifies when the average holder is underwater, which is a necessary feature of past bottoms, but not a precise timing tool for the exact low. It tells you the market is in a historically significant zone, not the day it will turn.
The metric family: MVRV and the MVRV Z-score
Realized price and realized cap are the foundation for a broader set of on-chain valuation tools, and understanding the family helps you use any one of them. The most common is MVRV, the market-value-to-realized-value ratio, which divides market cap by realized cap. MVRV expresses the same information as the realized-price gap in ratio form: an MVRV above one means the market trades above its cost basis, and below one means it trades below it. Historically, MVRV readings below one have marked some of the best buying opportunities, while very high readings have marked cycle tops.
A refinement is the MVRV Z-score, which takes the difference between market cap and realized cap and normalizes it by the historical volatility of market cap. This adjustment makes it easier to compare extremes across different cycles, because it measures how unusual the current deviation is relative to Bitcoin’s own history instead of in raw dollar terms. The Z-score has been notably effective at flagging cycle tops, historically identifying major highs within a couple of weeks, and its lower band has marked deep-value bottoms.
Analysts also split these metrics by holder cohort. Short-term and long-term realized prices separate coins by age, often at a threshold around 155 days, to compare the cost basis of recent buyers against seasoned holders. When the short-term holder cost basis breaks below the long-term one, or when the market trades between them, it signals stress or transition. Related metrics such as the spent output profit ratio, which tracks whether coins are moving at a profit or loss, and measures of supply in profit or loss, round out the toolkit. The lesson is that realized price is rarely used alone; it is the anchor for a system of cost-basis metrics.
Reading realized price today
Realized price is most talked about during downturns, and a deep drawdown is exactly when it becomes most relevant. When Bitcoin falls far from a prior all-time high, the market price approaches and can breach the realized price, pushing the aggregate market toward or below its cost basis. That is the moment analysts start citing realized price heavily, because it frames the central question of a bear market: is the market simply underwater in a historically normal way that has preceded recoveries, or is something more structural at work?
Reading it well means treating realized price as context rather than a trigger. If the market is trading near or below realized price, the metric tells you the average holder is close to break-even or underwater, which historically has been a zone of value and reduced selling pressure. It does not tell you the exact bottom, and it must be weighed against the wider environment, including liquidity conditions, demand from buyers such as funds and treasuries, and the behavior of long-term holders. A market below realized price with returning demand is a very different picture from one below realized price with demand still fleeing.
The most useful habit is to watch realized price alongside its relatives and the flows around it. Is spot above or below realized price, and by how much? What is MVRV or the Z-score saying about how extreme the deviation is? Are long-term holders accumulating or distributing? Combining realized price with those cross-checks turns a single line into a genuine read on the market’s cost-basis health, which is far more informative than the spot chart alone during the fear and noise of a downturn.
The limits of realized price
Realized price is powerful, but it comes with important caveats that separate careful analysts from those who misread it. The first is that it is not a timing tool. A market can trade below realized price for months during a severe bear market, so the metric identifies a value zone, not a turning date. Treating a single break below realized price as a signal to expect an immediate bottom has caught out many people who underestimated how long capitulation can last.
The second caveat is that realized price can fall, which surprises people who assume cost basis only rises. When holders sell heavily at a loss, those coins move at the new lower prices, which drags the aggregate cost basis, and therefore realized price, downward. In a deep enough decline, realized price itself declines, so a level that looked like firm support can drift lower. Realized price is a moving line shaped by holder behavior, not a fixed floor. There are also structural quirks: the metric assumes a coin moving between wallets represents a change of ownership at market price, which is not always true, since exchange transfers and internal shuffles can move coins without a real sale. Lost coins that can never move again also sit in the calculation at old prices, gently distorting it.
The final and most important caveat is that realized price should never be read in isolation. Its creators and the analysts who use it consistently pair it with other data: the spent output profit ratio, supply in profit or loss, exchange inflows and outflows, and the derivatives structure that can make the spot picture misleading. Different chains need different adjustments, and even for Bitcoin the metric works best as one input among several. Used that way, as a cost-basis thermometer read alongside its family and the surrounding flows, realized price is one of the most reliable tools in on-chain analysis. Used alone as a precise buy or sell signal, it will disappoint.
Realized price across holder cohorts and other assets
The aggregate realized price is the headline number, but the concept becomes more powerful when it is broken down, and understanding that adds real depth. Analysts often split realized price by holder cohort, most commonly separating short-term holders from long-term holders using a coin-age threshold around 155 days. Short-term holder realized price tracks the cost basis of recent buyers, who tend to be more reactive, while long-term holder realized price tracks the cost basis of seasoned holders, who tend to hold through volatility. The short-term line usually sits closer to the market price and often acts as nearer-term support or resistance, while the long-term line moves slowly and marks a deeper floor.
Reading the two cohorts together tells a story the aggregate hides. In a healthy uptrend, the market price sits above both cohorts’ cost bases, so almost everyone is in profit. When the market falls below the short-term holder cost basis, recent buyers move underwater first, which historically pressures the group most likely to panic-sell. When it falls all the way below the long-term holder cost basis, even seasoned holders are underwater, a condition seen only in the depths of bear markets and often near major bottoms. Watching which cohort’s line the price is testing gives a finer read than the single aggregate number.
The concept also extends beyond Bitcoin, though with adjustments. For Ethereum, which uses an account-based ledger instead of Bitcoin’s unspent-output model, data providers approximate address-level cost bases and aggregate them, preserving the spirit of cost-basis valuation. Ethereum also requires care around its supply: the fee burn introduced by its network upgrades reduces effective supply over time, and staking flows change what counts as circulating, so realized price and its ratios need burn-adjusted and staking-aware supply figures to be accurate. The same idea applies to other large assets, always with chain-specific quirks.
The takeaway is that realized price is not a single rigid number but a lens that can be focused. Aggregate realized price gives the market-wide cost basis; cohort realized prices reveal which groups of holders are in profit or pain; and adapting the metric to other chains extends its usefulness across the market. Used at these finer resolutions, and always with awareness of each chain’s supply mechanics, realized price becomes a far richer tool than the single line most people first encounter.
Frequently Asked Questions
What is realized price in simple terms?
Realized price is the average price at which all Bitcoin in circulation last moved on-chain, which makes it a measure of the market’s aggregate cost basis, or what holders effectively paid. Unlike the market price, which reflects the latest trading value, realized price only changes as coins actually move at new prices, so it behaves like a slow-moving average of the market’s break-even level.
How is realized price calculated?
Realized price is realized capitalization divided by the circulating supply. Realized cap is found by valuing every coin at the price it held the last time it moved on-chain and summing those values. So if four coins last moved at $20,000, $40,000, $60,000, and $80,000, realized cap is $200,000 and realized price is $50,000, the average on-chain cost basis.
What does it mean when Bitcoin trades below realized price?
It means the aggregate market is underwater, with the average holder sitting on an unrealized loss because coins are worth less than they last moved for. Historically, these periods have been rare and clustered near cycle bottoms, coinciding with capitulation and deep bearish sentiment. They have often marked strong long-term value zones, though not a precise date for the low.
Is realized price a reliable bottom signal?
It is a useful context tool, not a precise timing signal. Falling below realized price has historically marked value zones near cycle lows, but the market can trade below its cost basis for an extended period in a deep bear market. Realized price tells you the average holder is underwater, a common feature of past bottoms, but it should be combined with other data before drawing conclusions.
How is realized price related to MVRV?
They express the same idea in different forms. MVRV, the market-value-to-realized-value ratio, divides market cap by realized cap, so an MVRV below one means the market trades below its cost basis, the same message as spot falling below realized price. The MVRV Z-score refines this by normalizing the gap for volatility, making it easier to spot extreme highs and lows across different cycles.
Can realized price go down?
Yes. Realized price rises as coins move at higher prices, but it can also fall. When holders sell heavily at a loss, those coins move at lower prices and drag the aggregate cost basis, and therefore realized price, downward. This means realized price is a moving line shaped by holder behavior, not a fixed floor, and a level that looked like support can drift lower in a deep decline.
What is the difference between realized price and realized cap?
Realized cap is the total, and realized price is the per-coin average. Realized cap sums the value of every coin at the price it last moved, giving the market’s aggregate cost basis in dollars. Realized price divides that total by the circulating supply to give the average cost basis per coin. Realized cap is compared with market cap; realized price is compared with the market price.
What are the main limitations of realized price?
It is not a timing tool, since markets can stay below it for months. It can fall when holders sell at a loss, so it is not a fixed floor. It assumes coins moving between wallets represent real ownership changes at market price, which is not always true, and lost coins distort it. Because of these quirks, it works best alongside other metrics like SOPR, supply in profit or loss, and exchange flows.
Disclaimer: This article is for information and educational purposes only and does not constitute financial, investment, or trading advice. On-chain metrics describe historical patterns that may not repeat, and cryptocurrency prices are highly volatile. Nothing here is a recommendation to buy or sell any asset. Always do your own research and consider consulting a qualified professional before making financial decisions. Information is accurate as of July 2, 2026, and may change.

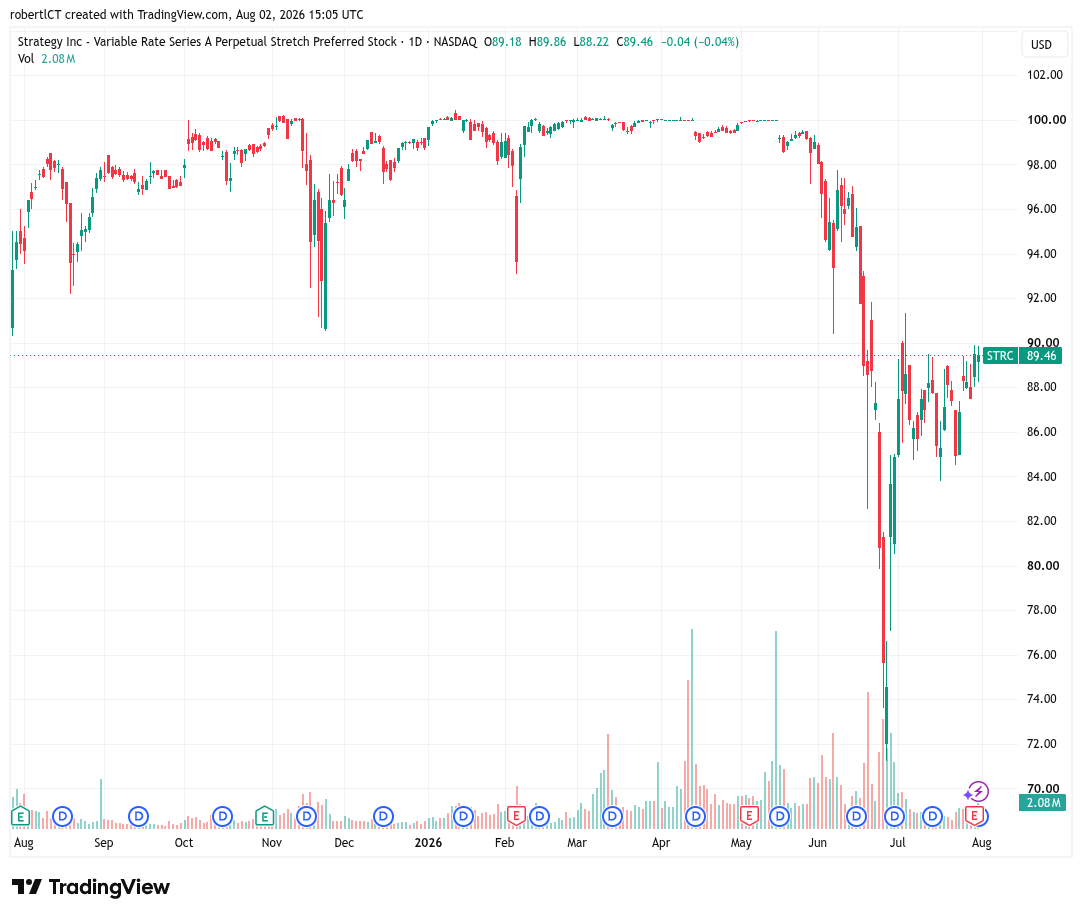
While Strategy’s preferred STRC shares ended July well below their $100 par value, investors were told that their August dividend will not increase, holding at 12%.
Executive chairman Michael Saylor delivered the news in a tweet on Saturday, continuing to pitch STRC as a way to “stretch your income.” August will be the second month that the dividend will be paid semi-monthly after shareholders approved that change in June.
STRC shares closed at $89.46 on Friday, clocking a 5.42% price increase for the month which began with a dividend hike — 50 basis points to 12% — after a poor stock performance in June. The volume on the Nasdaq-traded shares on Friday were about two-thirds of their daily average.
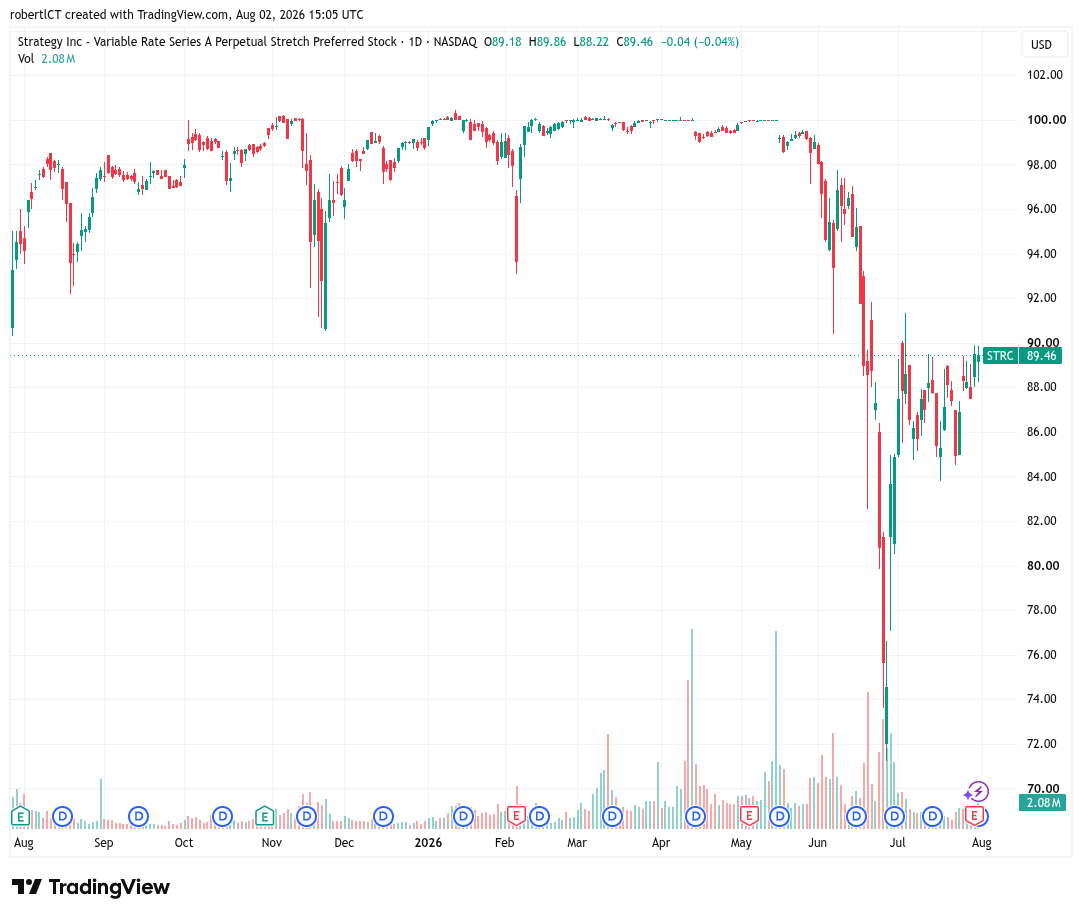
STRC shares continued to trade significantly below their $100 par value in July.
Source: TradingView
On Friday, Strategy CEO Phong Le reiterated that management’s “corporate objective is for STRC to trade at $99-$100 over time,” without elaborating when investors might expect that to transpire.
Related: Bitcoin ETFs end July in the green despite late-month selling
Building cash reserve to make preferred payouts
Saylor, however, did take to social media on Sunday to dangle the possibility that the company will be making an announcement of a change in its Bitcoin treasury holdings. “Bitcoin Drive engaged,” read his X post, following a familiar pattern of posting a chart of Strategy’s BTC buys from Saylortracker.com to start off the week.
Last week, Strategy reported an $8.22 billion second-quarter net loss, driven primarily by an $8.32 billion unrealized loss on its Bitcoin (BTC) holdings as the cryptocurrency’s price declined during the quarter.
The Bitcoin treasury company said it has built a $3.75 billion cash reserve to support preferred stock payouts following the launch of its BTC monetization program.
Strategy also said it has built a $3.75 billion U.S. dollar reserve, enough to cover more than two years of preferred dividend payments and interest obligations. The company recently repurchased $25 million of its STRC preferred shares at a discount to par and said it intends to continue buying the securities while they trade below $100.
Magazine: Here’s why the CLARITY Act’s ethics deal may be so hard to reach


Minnesota’s prediction market ban remained blocked on Aug. 2, one day after the law was scheduled to take effect.
Summary
- July 27 injunction keeps Kalshi and Polymarket operating while Minnesota’s preemption case continues in court.
- Walz barred state employees from using confidential information to trade prediction markets for private benefit.
- Fairshake reported $126.97 million cash on hand through June, amplifying crypto’s broader election influence nationwide.
U.S. District Judge Katherine Menendez granted a preliminary injunction on July 27 to the Commodity Futures Trading Commission, Kalshi and Polymarket US. The order prevents Minnesota from enforcing its new statute against CFTC-registered designated contract markets while three related cases continue.
The Minnesota law would make it a felony for businesses to create, operate or intentionally support covered prediction markets. It also reaches certain data providers, payment services and advertisements. Menendez found that the plaintiffs were likely to succeed on at least part of their federal preemption claim because many event contracts may qualify as swaps under the Commodity Exchange Act.
Court win protects federal markets, but only for now
The ruling does not settle the dispute. Menendez found that the CFTC’s exclusive jurisdiction probably covers a “considerable swath” of contracts offered by Kalshi and Polymarket. However, she also said the platforms had not shown that every listed event contract meets the federal definition of a swap. Any permanent injunction could therefore protect fewer products than the current order.
Minnesota Attorney General Keith Ellison said prediction markets are “gambling, plain and simple.” That remains the state’s legal position, not a final court finding. Kalshi responded that “States cannot ban things that they don’t have jurisdiction over.” The company’s statement likewise reflects its interpretation of federal law rather than the case’s final outcome.
The injunction only covers the new prediction market statute as applied to CFTC-registered markets. It does not decide whether Minnesota can apply older gambling laws to individual sports or entertainment contracts. The Department of Public Safety has not said whether it views the platforms as illegal under those existing provisions or whether another enforcement action is underway.
As previously reported, the current relief will remain in place until the district court reaches a final decision unless a later order or appeal changes it. The court could ultimately distinguish between contracts with financial or economic consequences and products that more closely resemble ordinary wagers.
Walz shifts Minnesota’s focus to insider trading
Governor Tim Walz responded one day after the ruling with Executive Order 26-09. It prohibits covered state employees, including the governor, lieutenant governor and agency commissioners, from using nonpublic or confidential government information to trade prediction-market contracts for private benefit.
The order does not cover the legislature, courts, independent elected officials or several boards and commissions. Walz encouraged those institutions to adopt similar policies. It becomes effective 15 days after publication in the State Register and filing with the secretary of state.
A new federal enforcement case also shows that CFTC oversight does not leave manipulation entirely unpoliced. On July 31, the agency ordered former U.S. Representative George Santos to disgorge $17,569.98, pay a $17,500 penalty and accept a three-year trading ban over manipulative activity in a State of the Union event contract.
The CFTC order said Santos traded on whether he would attend the speech while making misleading public statements about his plans. The agency said those statements moved contract prices in a direction that favored his positions.
Meanwhile, as crypto.news reported, Kalshi has introduced employer disclosures, risk scoring and expanded surveillance for higher-risk contracts. The company said it blocked more than 100 potential insider trades and made 20 law-enforcement referrals during the first quarter of 2026. Those remain company-reported figures.
U.S. politics could pull crypto lawmakers and PACs into the fight
The Minnesota ruling could give pro-crypto lawmakers another example for arguing that national financial markets need one federal framework. The CLARITY Act does not regulate prediction markets directly. However, its supporters are also seeking a larger CFTC role in U.S. digital asset oversight. Senate lawmakers released updated market-structure text on July 22 after the Banking Committee advanced the measure in May.
The court dispute also creates a counterargument for lawmakers wary of expanding the commission’s mandate. A July 21 Senate letter asked the Government Accountability Office to review a reported 25% reduction in CFTC staffing and weaker enforcement activity. Critics could argue that Congress should not widen the regulator’s duties without ensuring it has enough staff to oversee both digital assets and fast-growing event markets. This is a political inference based on the agency’s expanding workload and the staffing concerns raised in Congress.
The case does not involve Fairshake or another crypto PAC. Still, it could shape campaign arguments surrounding candidates supported by the industry. FEC records showed that Fairshake held approximately $126.97 million in cash at the end of June and had spent $74.25 million during the current two-year reporting period.
In related coverage, Protect Progress spent more than $2 million in Michigan’s 13th District race, where challenger Donavan McKinney tied crypto lobbying to President Donald Trump’s business interests. Similar campaign attacks could connect support for broader CFTC authority with the Trump family’s prediction-market relationships.
Kalshi named Donald Trump Jr. a strategic adviser in January 2025. Polymarket later added him to its advisory board when his investment firm, 1789 Capital, took a stake in the company. Those corporate relationships are confirmed, although they do not prove that the White House directed the CFTC’s Minnesota litigation.
Sports-law attorney Daniel Wallach described the change in federal policy as “classic regulatory capture.” That is his assessment, not a judicial or regulatory conclusion. However, the family relationships may give opponents of pro-crypto candidates a clearer campaign message about industry access, federal authority and possible conflicts.
Conflicting state cases keep national rules unsettled
Minnesota is one part of a wider federal-state contest. The CFTC has filed cases against several states to defend what it calls exclusive jurisdiction over registered prediction markets. Yet courts have not produced one nationwide answer. Minnesota’s injunction favored the platforms, while rulings involving Wisconsin and Washington allowed state gambling challenges to advance.
New York added another case on July 31 by suing Kalshi and alleging that its platform operates as unlicensed gambling. The state seeks an injunction, restitution, penalties and forfeiture of alleged gains. Those claims remain allegations that Kalshi can contest in court.
The CFTC’s proposed prediction-market rule is another key track. The public comment period closed on July 27. The proposal would define “gaming,” establish factors for public-interest reviews and create a process lasting as long as 90 days for certain event contracts. The commission has not issued a final rule.
There’s rarely a big altcoin gainer during the current market conditions, in which every breakout attempt is halted in its tracks. This is particularly true for weekend moves, as the market tends to freeze on Saturday and Sunday.
The latest example came in the past 36-48 hours. Even though the situation in the Middle East continues to develop quickly, with Trump claiming a Hormuz Strait deal is in the making and Iran refuting his statement once again, BTC and most altcoins have remained sluggish.
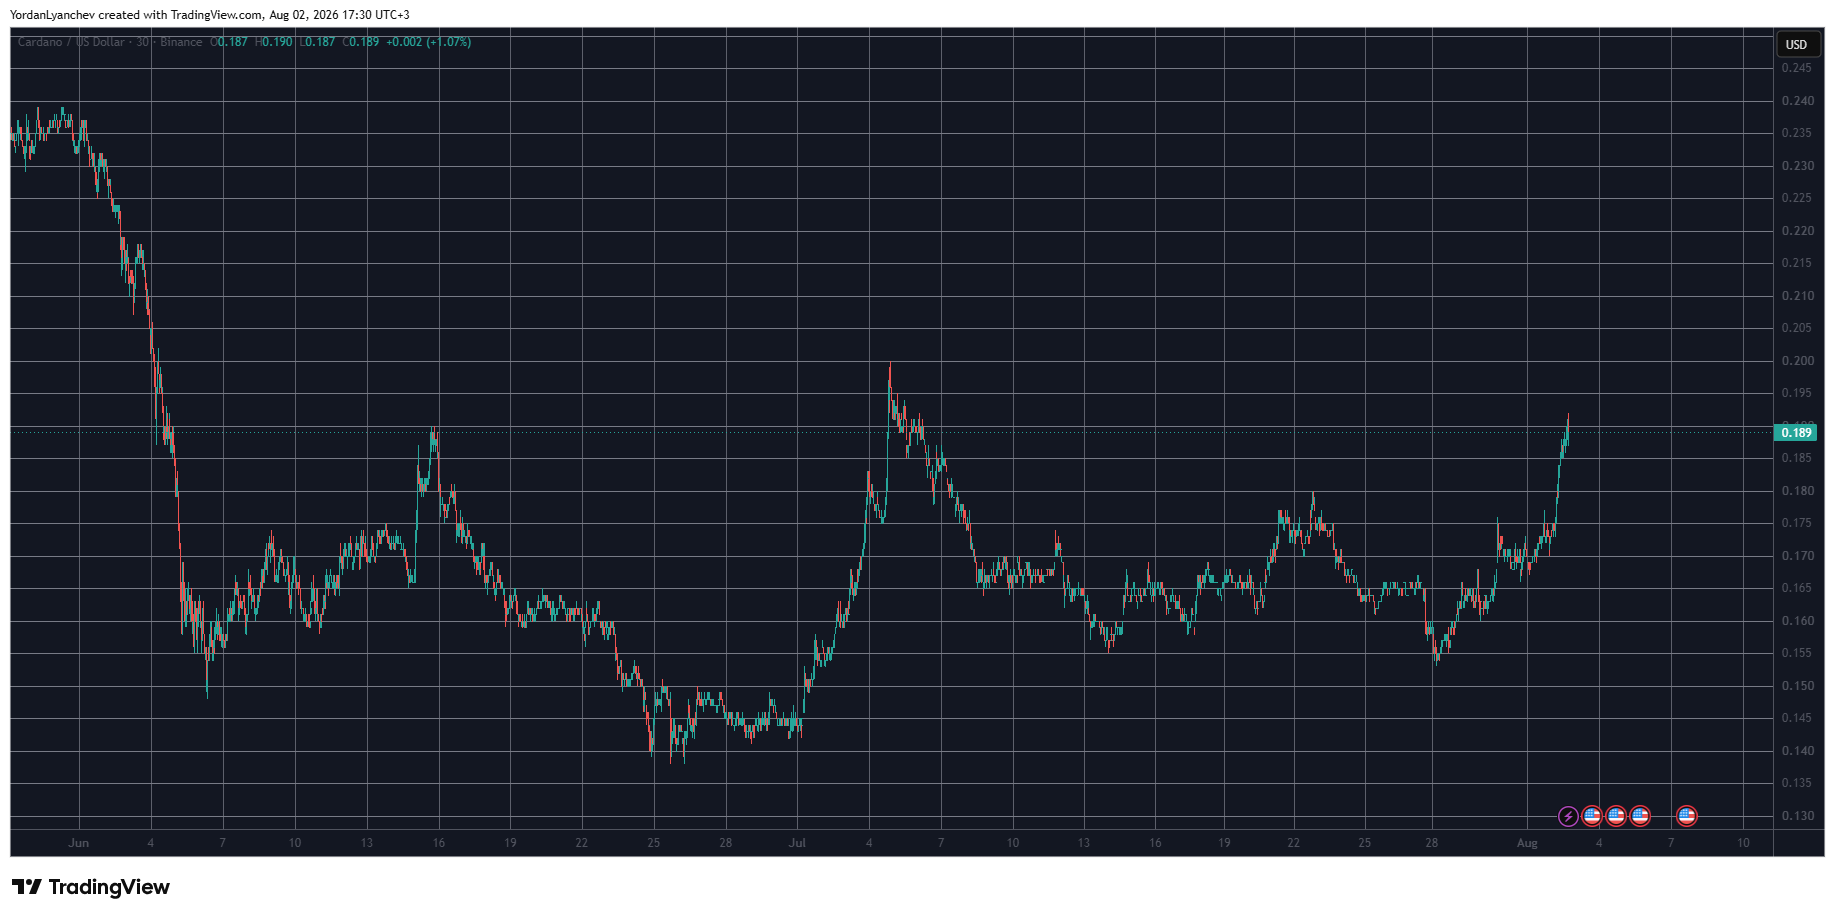
However, Cardano’s ADA has emerged as the clear winner this weekend, gaining over 9% and jumping past $0.19 hours ago for the first time in almost a month. Here’s the most likely reason and what could follow next.
Whales Are Buying
Since we are excluding a rally from the broader market, perhaps the most obvious reason behind ADA’s impressive resurgence over the past day has been the recent behavior of whales. These large market participants, who can influence the underlying asset’s price moves with big purchases or sales, have gone on an accumulation spree.
Santiment Intelligence data shared by Ali Martinez shows that whales have scooped more than 240 million ADA in less than a week. Their total holdings went to 14.55 billion before retracing slightly.
The analyst concluded that this substantial acquisition has helped fuel the asset’s notable 22% surge in the past five days, while the rest of the market stagnates.
Whales loaded up. Cardano took off.
Over 240 million $ADA have been accumulated in the past five days, helping fuel a 22% price surge per data from @SantimentData. pic.twitter.com/6Q6P6luBZn
— Ali Charts (@alicharts) August 2, 2026
Major Breakout Knocking on the Door
Another analyst going under the X moniker, Gerla, noted that ADA is “knocking on the door of a major breakout.” Their chart shows that ADA is fighting for the $0.19-$0.20 resistance level now, which capped its previous breakout attempt last month.
However, the bullish RSI divergence and the completion of an inverse head-and-shoulders suggest that ADA finally has the strength to overcome that obstacle and aim at the next one, positioned at around $0.30.
ZAYK Charts was even more bullish, indicating that a successful surge past the first resistance level could pave the way for another leg up toward $0.50.
The post Why Is Cardano (ADA) Up 9% Today While the Crypto Market Stalls? appeared first on CryptoPotato.
After several failed attempts to extend its recovery, Ethereum is beginning to show signs of exhaustion beneath the major100-day MA. The latest rejection from this zone has weakened short-term momentum and increases the probability of a broader pullback if key support levels fail to hold.
Ethereum Price Analysis: The Daily Chart
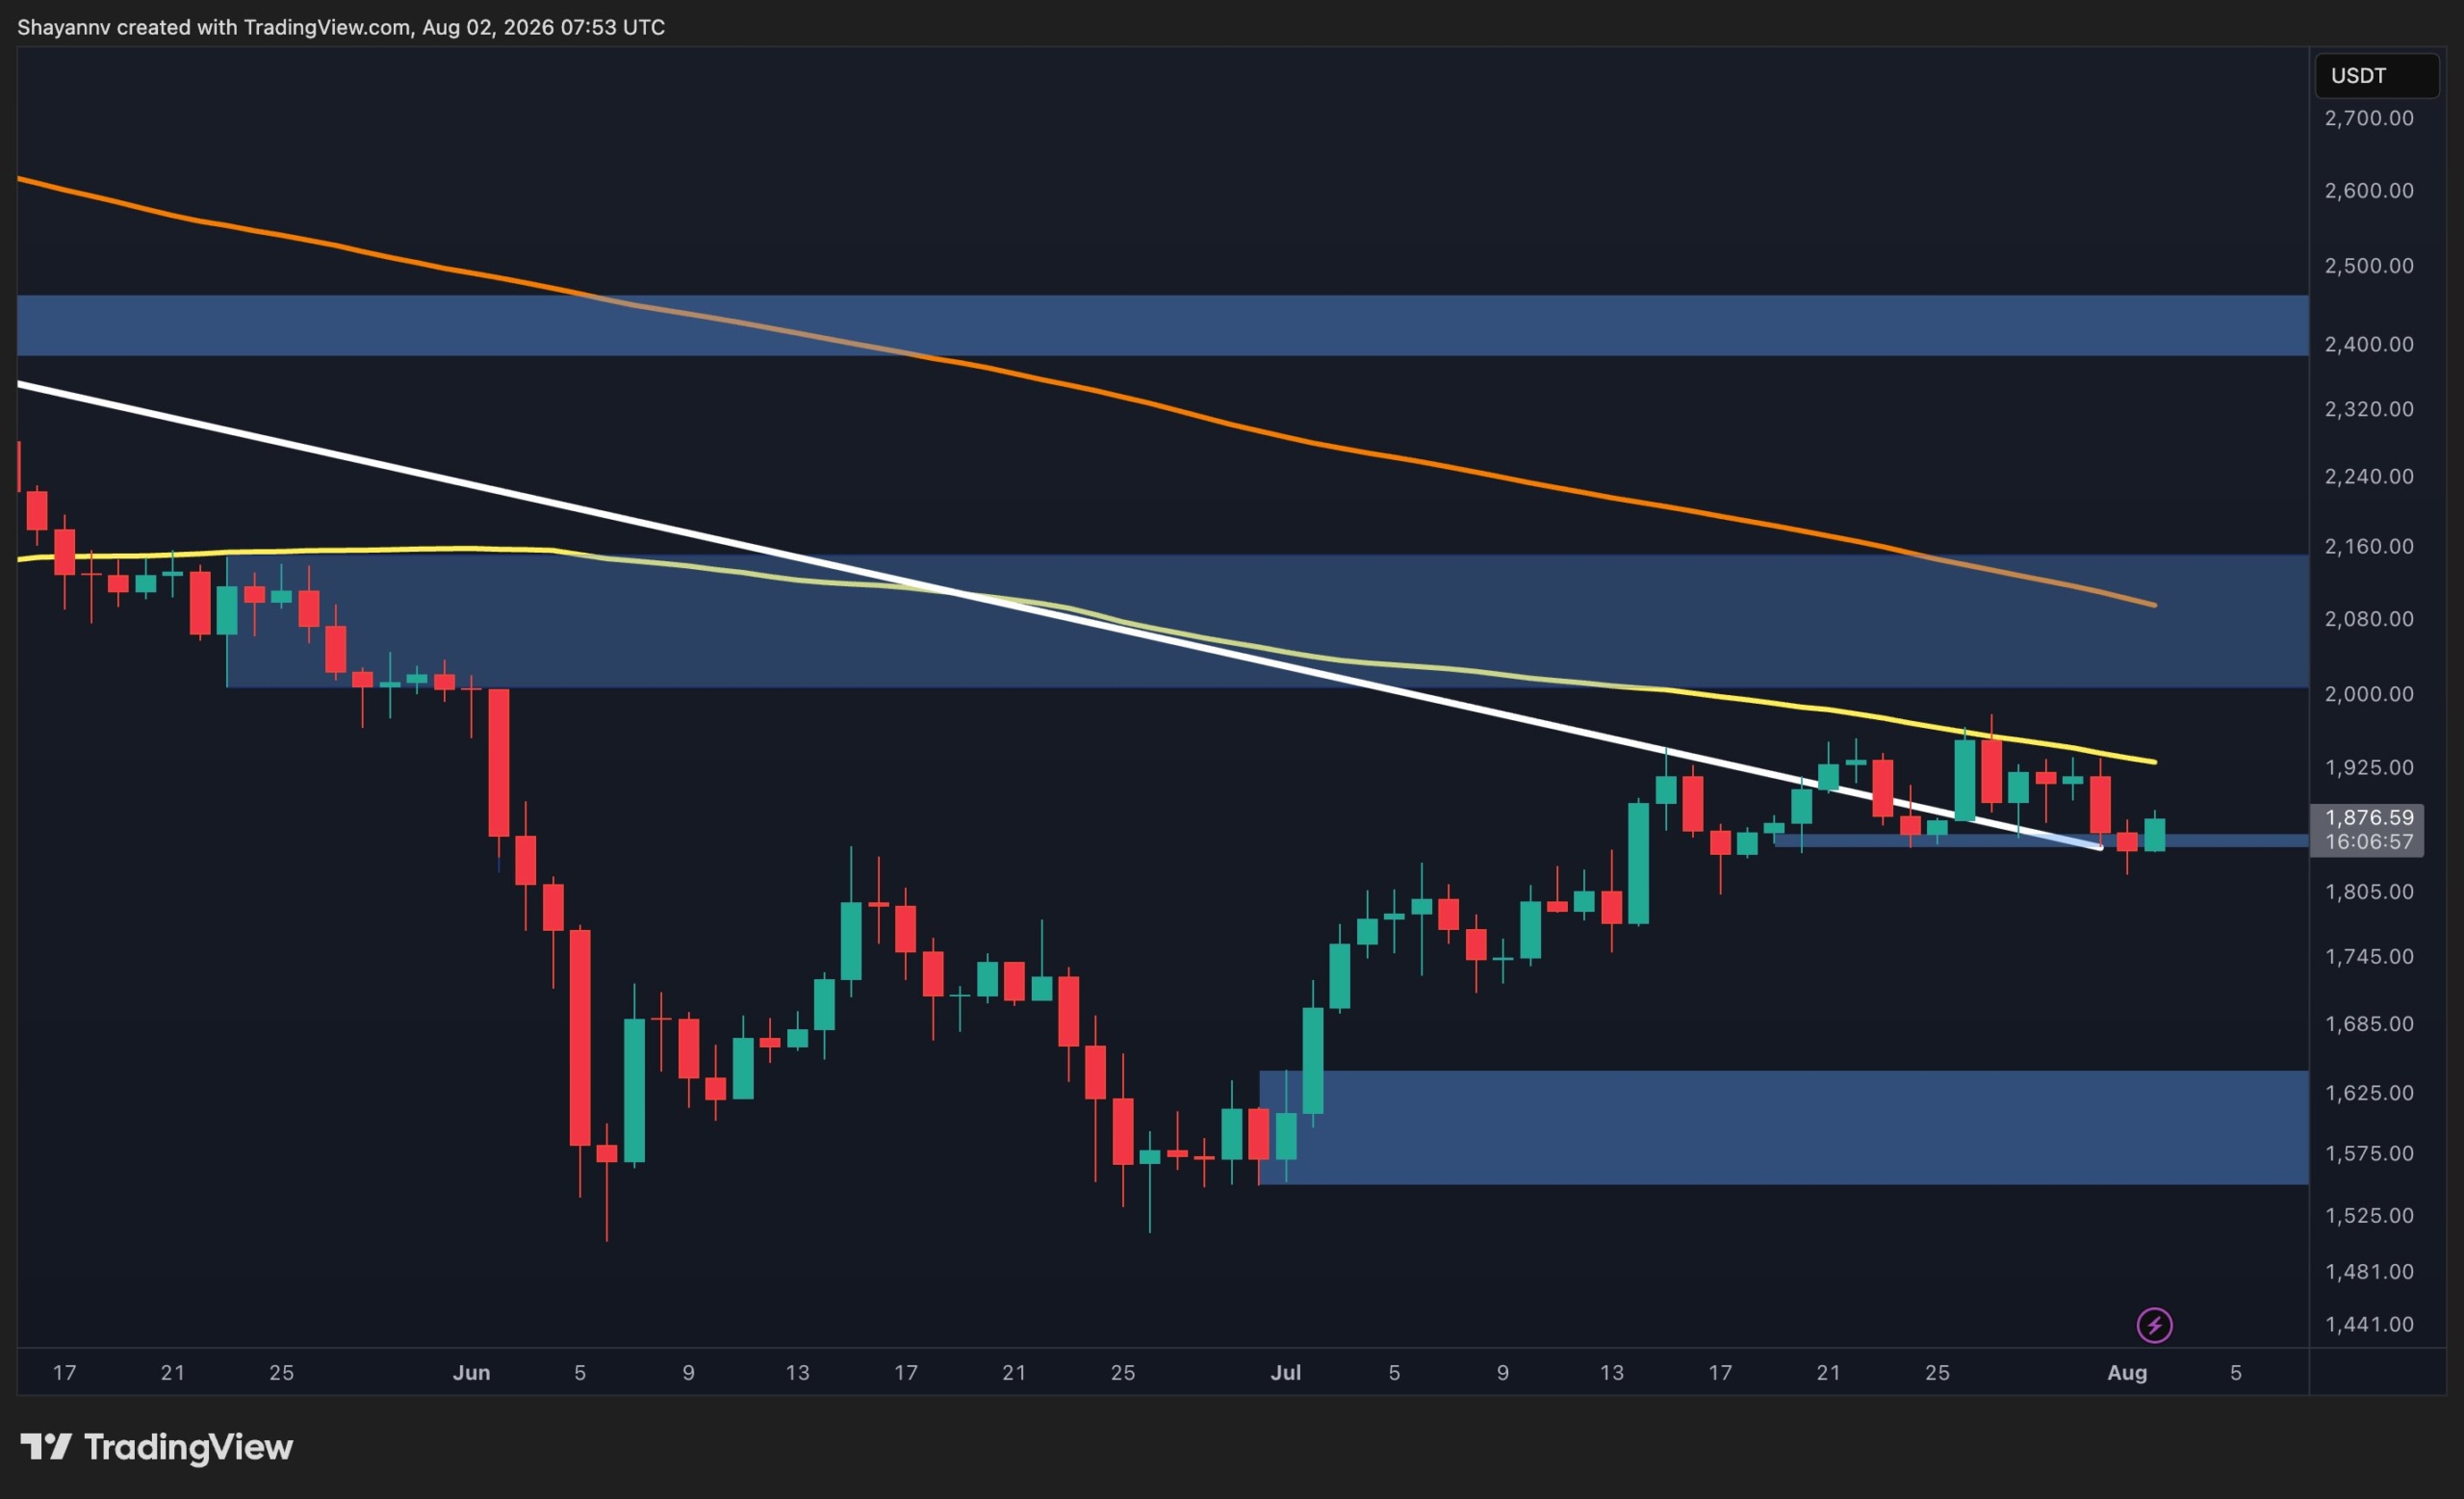
On the daily timeframe, ETH’s outlook is gradually shifting toward a bearish bias after multiple failed attempts to reclaim the 100-day moving average. The repeated rejection from this dynamic resistance around $1.95K, combined with the emergence of bearish daily candles, suggests buyers are losing momentum.
Meanwhile, Ethereum continues to struggle with the descending channel, with the upper boundary represented by the white trendline serving as the most critical support.
If sellers manage to push the price back inside this channel, it would confirm a bearish continuation and likely trigger a deeper decline toward the $1.56K to $1.64K demand zone. On the upside, bulls must first reclaim the $1.88K to $1.91K resistance area before attempting another move toward the 100-day MA near $1.95K.
ETH/USDT 4-Hour Chart
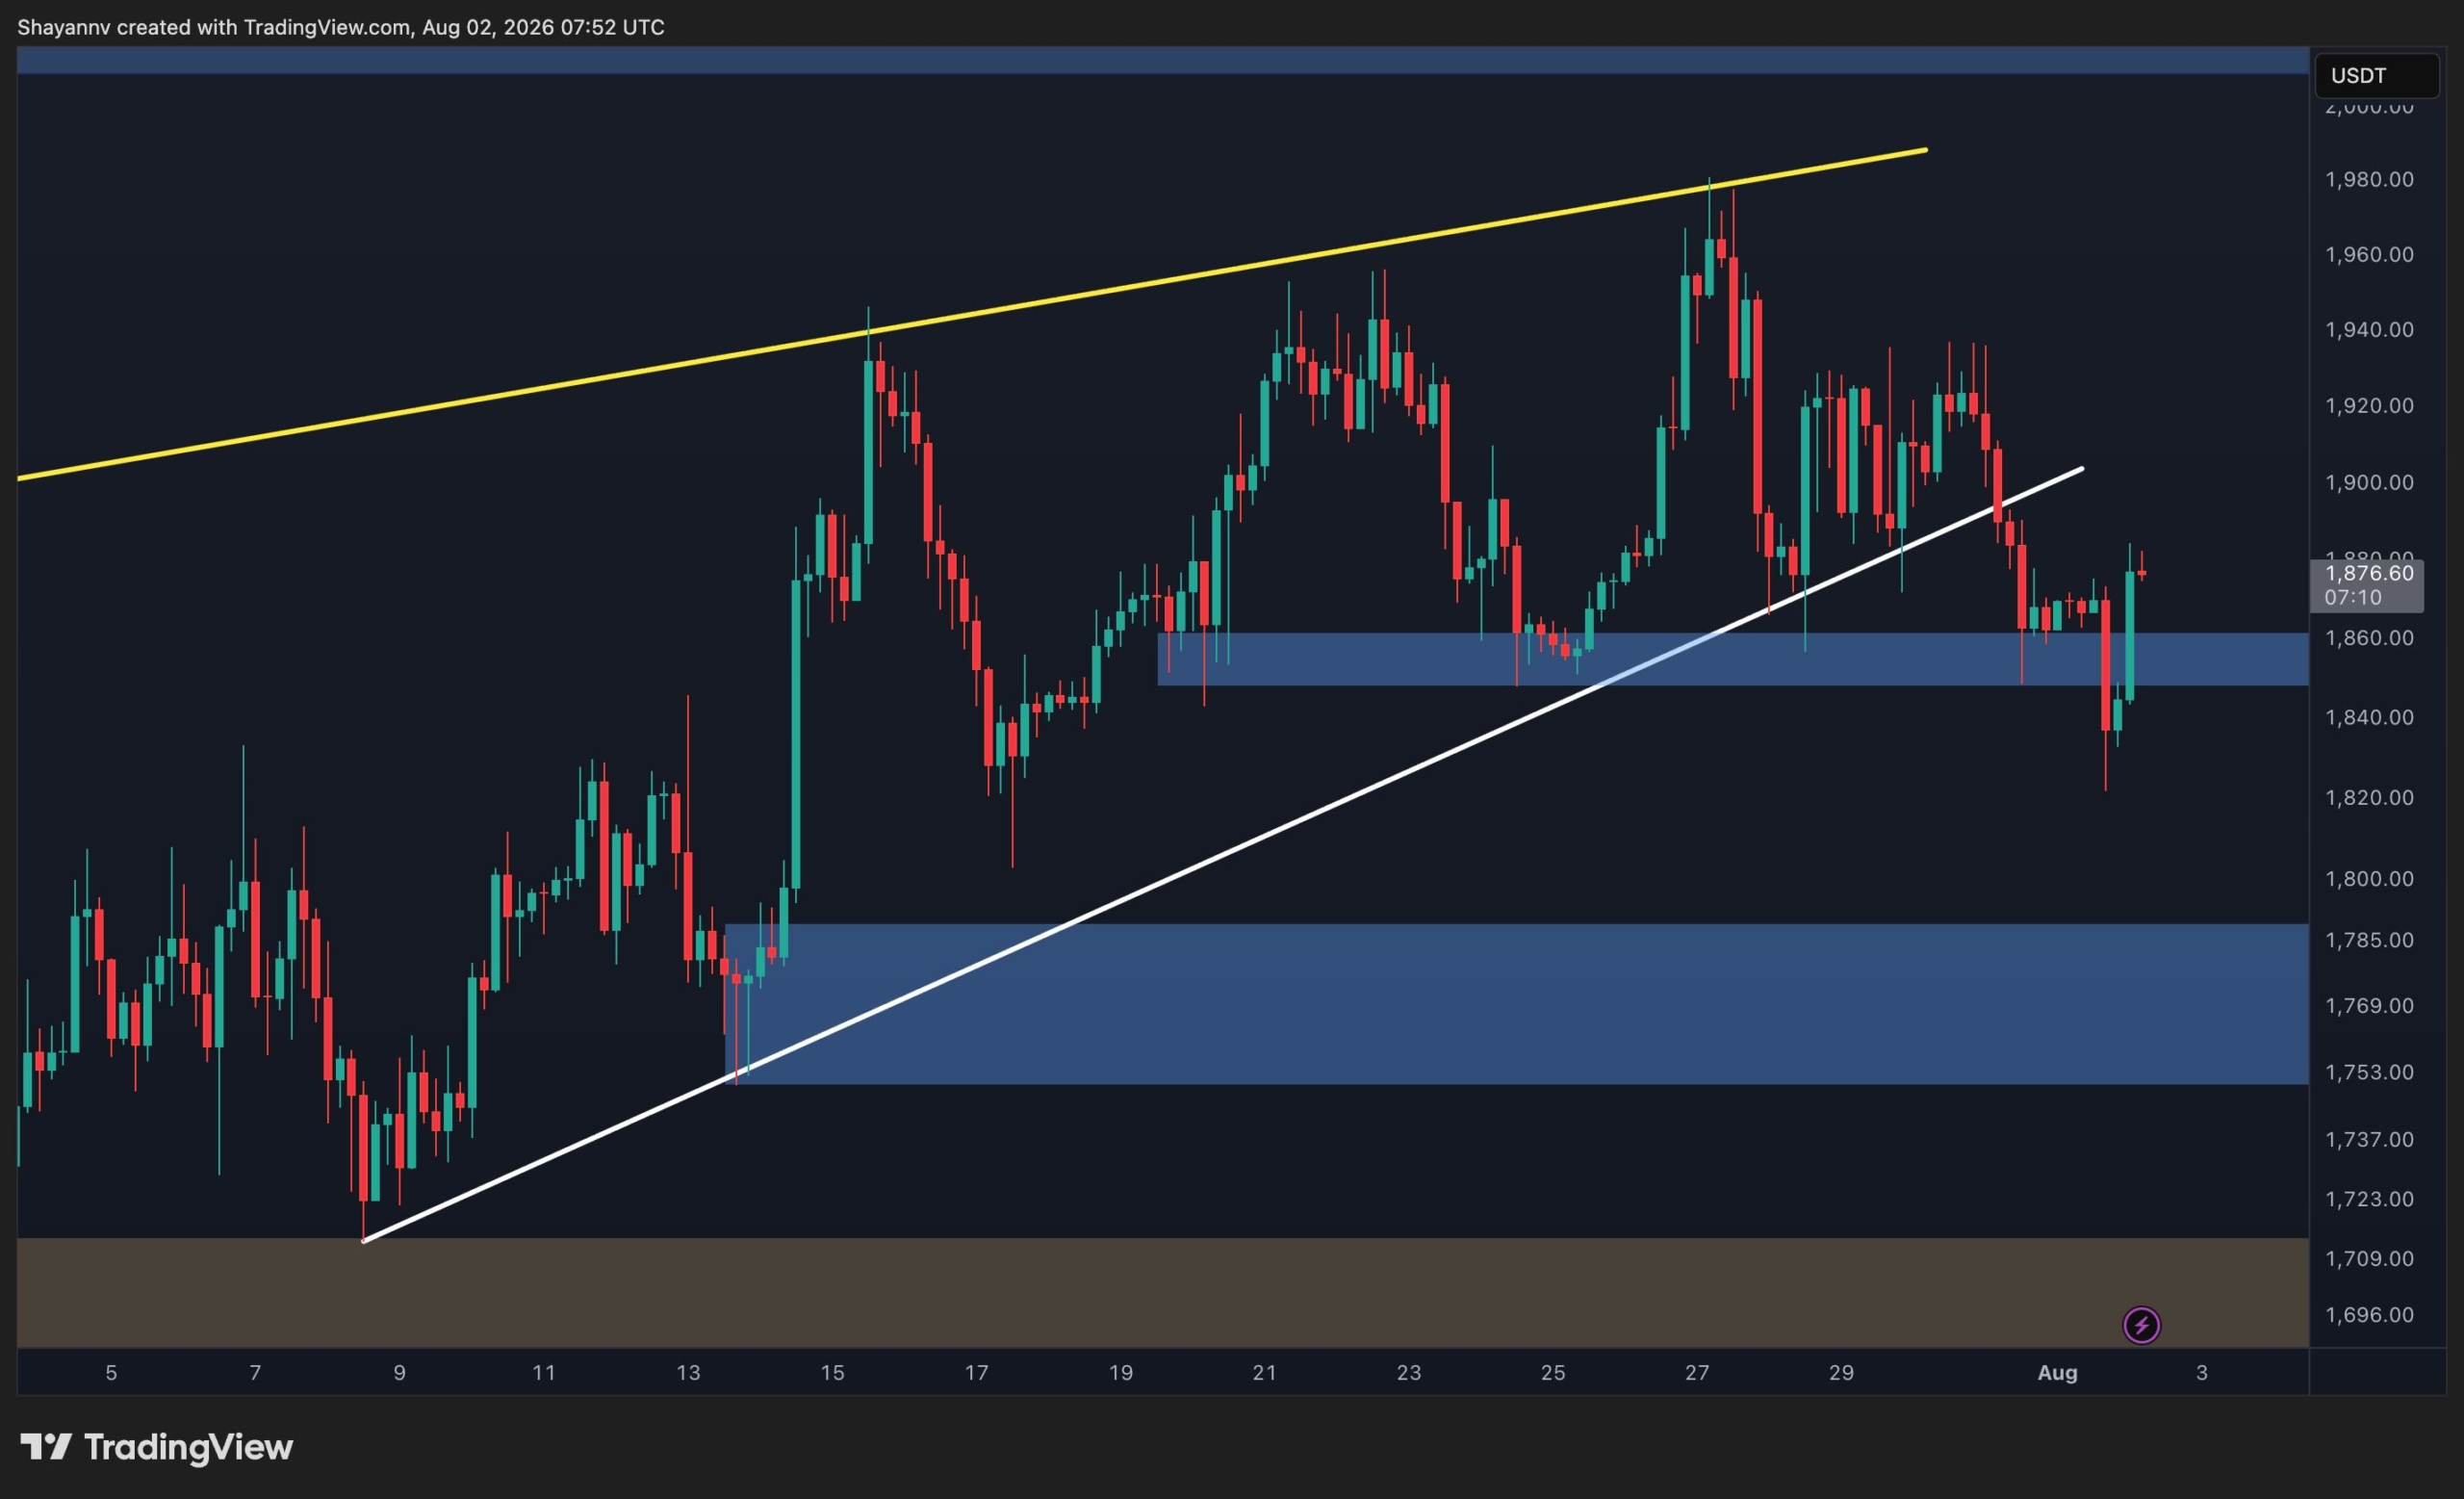
The 4-hour chart has turned more bearish after Ethereum broke below its ascending trendline, signaling that buyers have lost short-term control. This breakdown shifts the focus toward lower support levels unless bulls can quickly reclaim the broken structure.
The first support now lies within the $1.85K to $1.87K demand zone, where price is currently attempting to stabilize. Losing this area would likely accelerate the decline toward the next major demand zone between $1.75K and $1.79K.
On the other hand, the $1.88K to $1.91K supply zone has become the primary threshold for buyers. A successful reclaim of this region would invalidate the immediate bearish scenario and could allow Ethereum to challenge the descending resistance and the 100-day moving average once again.
Sentiment Analysis
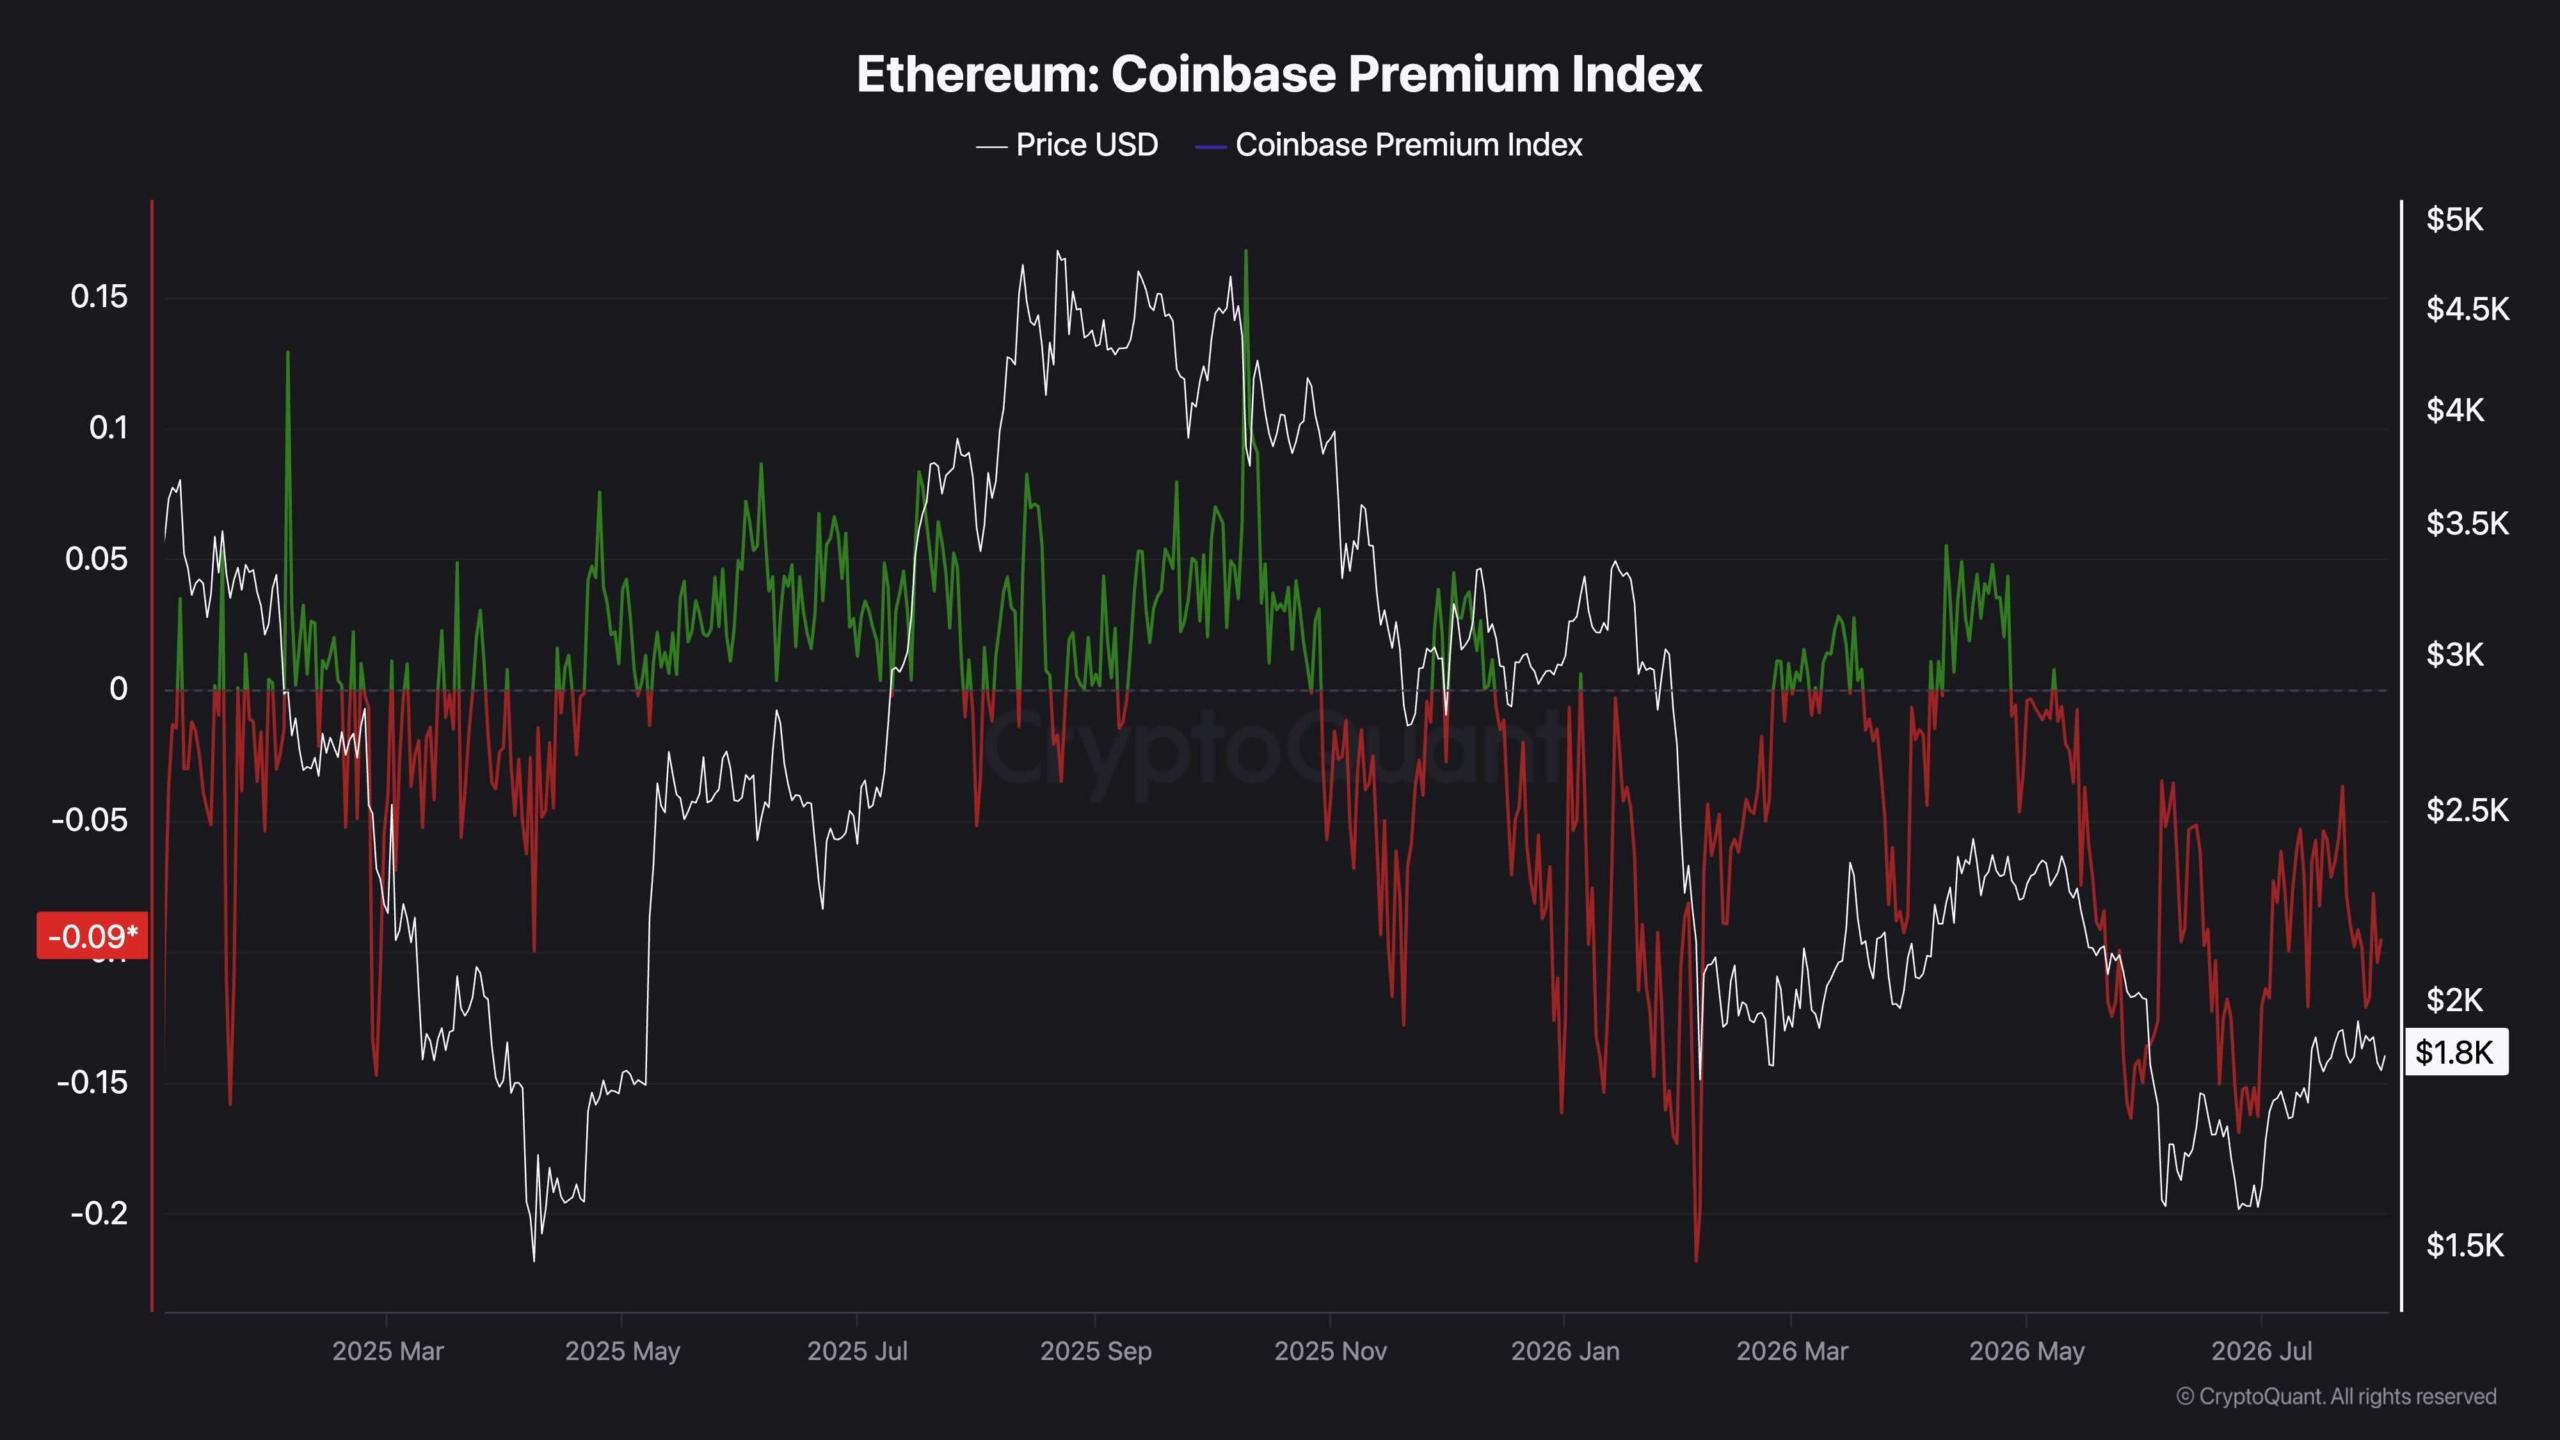
The Coinbase Premium Index remains in negative territory, indicating that Ethereum continues to trade at a discount on Coinbase relative to other major exchanges. This persistent negative premium suggests buying pressure from U.S.-based institutional participants remains relatively weak despite the recent recovery.
Historically, sustained positive readings have accompanied stronger bullish phases, whereas prolonged negative values often reflect cautious institutional sentiment. Until the premium returns to positive territory and remains there consistently, the current rebound may struggle to develop into a sustained uptrend, leaving Ethereum vulnerable to additional downside pressure if technical support levels begin to fail.
The post Ethereum Price Analysis: ETH’s Double Rejection at $2K Spells More Trouble Ahead appeared first on CryptoPotato.
Ripple’s XRP remains under steady selling pressure as the latest rebound attempts continue to lose momentum. The recent price action suggests sellers are maintaining control, while buyers are once again being forced to defend a critical support area.
Ripple Price Analysis: The Daily Chart
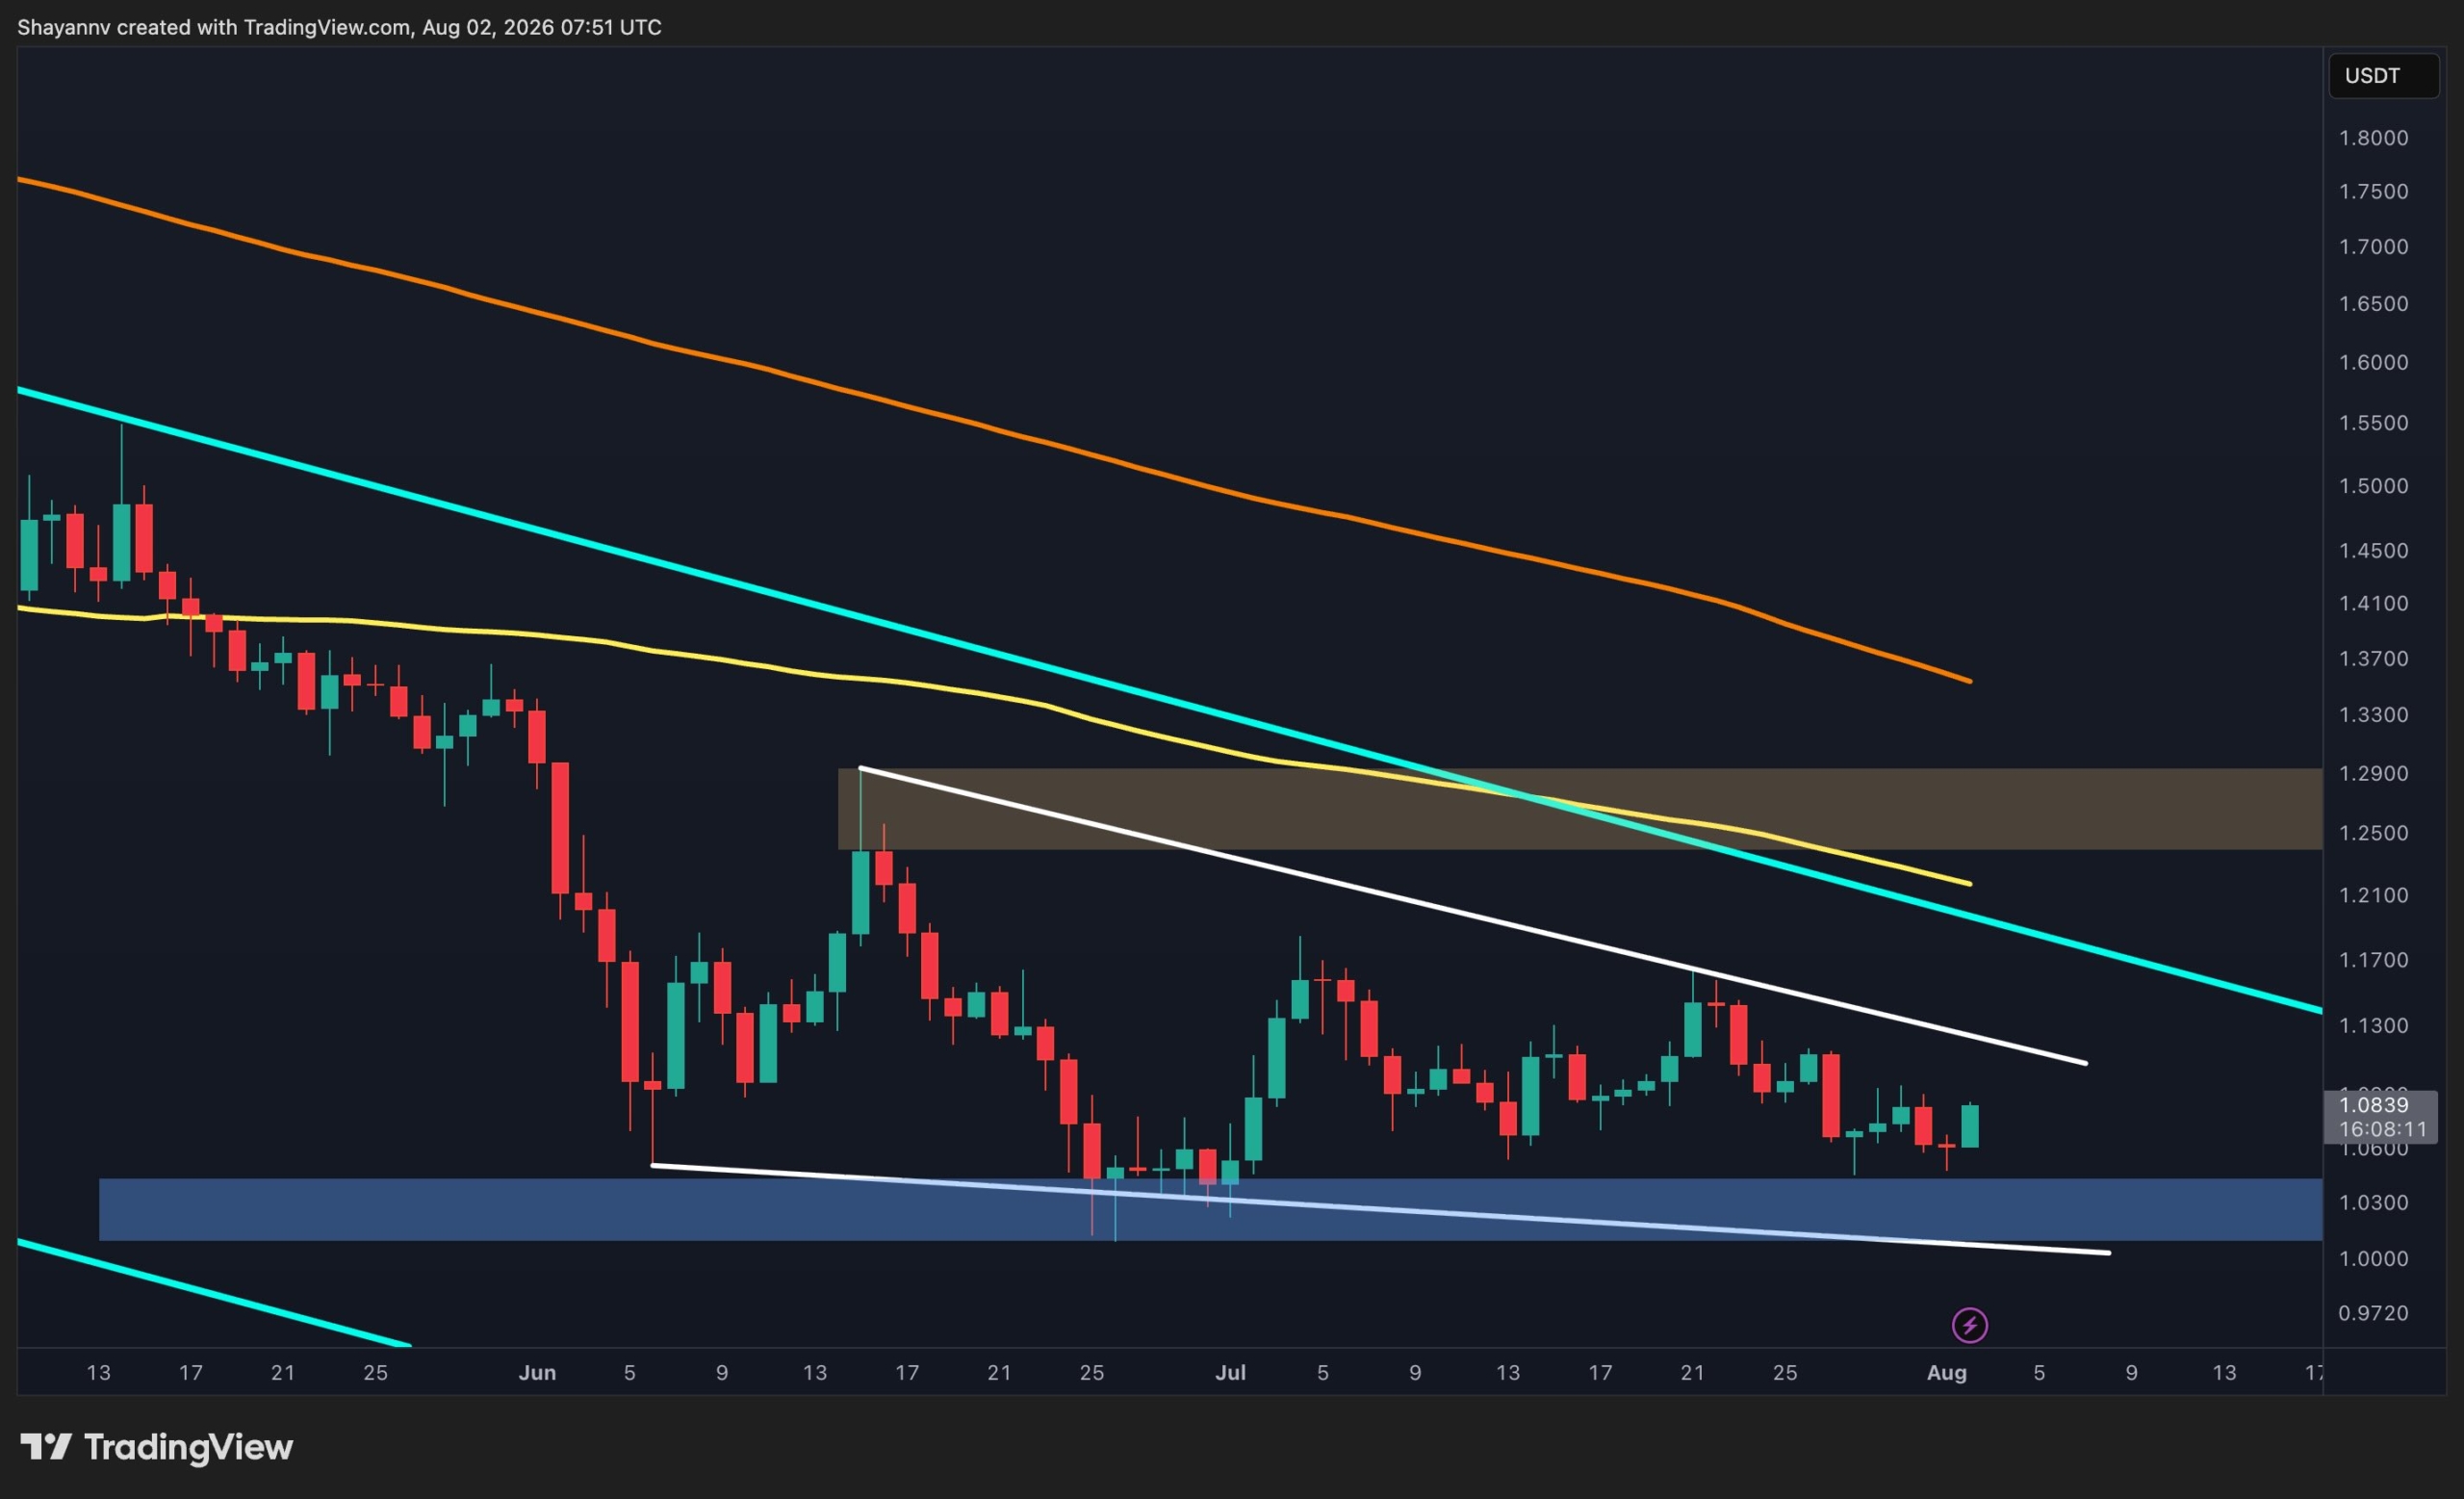
The daily chart shows little improvement compared to the previous analysis. The asset continues to trade beneath the descending resistance trendline while remaining well below the major moving averages, preserving the broader bearish market structure.
The latest candles indicate that sellers remain in control after another failed recovery attempt, pushing the price back toward the key demand zone around $1.01 to $1.04. This support has repeatedly prevented a deeper decline over the past several weeks, making it the most important level to monitor.
As long as XRP remains below the descending trendline and the main resistance between $1.24 and $1.29, the broader outlook favors continued weakness. A decisive breakdown below the $1.01 to $1.04 support zone would likely accelerate the decline toward the next major support around $0.89.
XRP/USDT 4-Hour Chart
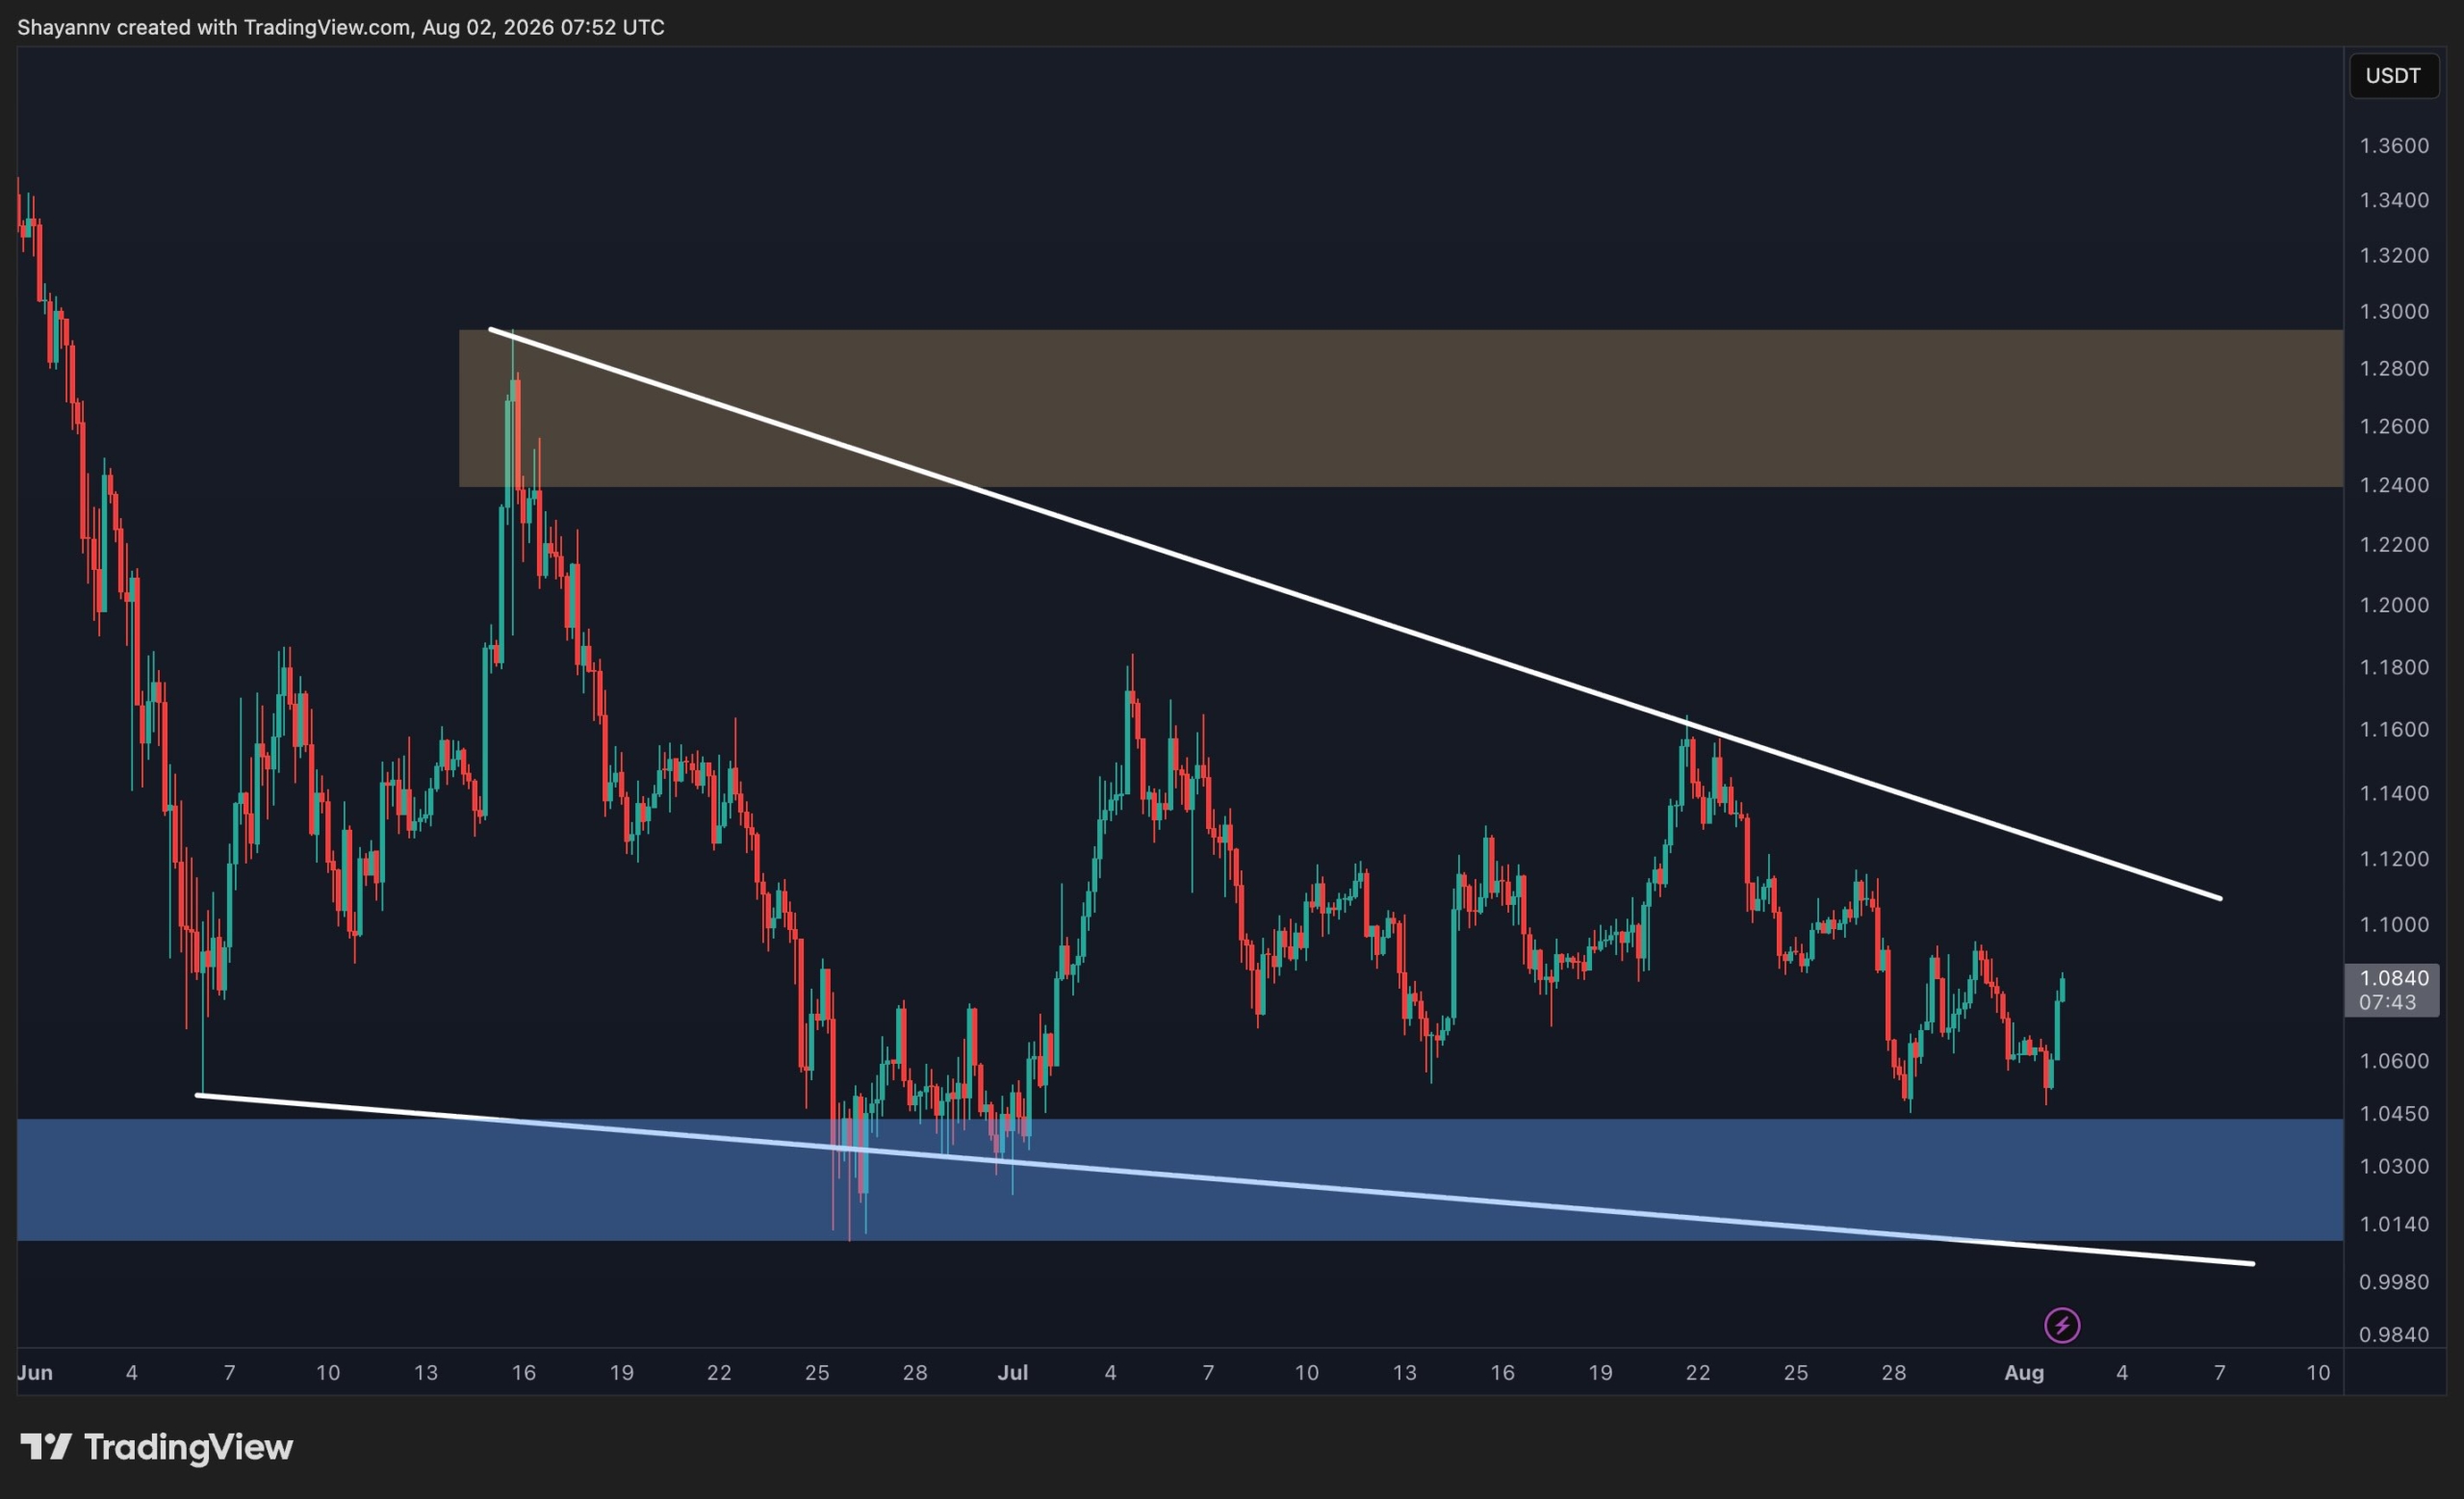
On the 4-hour timeframe, rather than recovering from support, XRP has continued to print lower highs and lower lows while remaining capped by the descending resistance trendline.
The recent rejection near $1.09 was followed by another decline toward the $1.01 to $1.04 demand zone, showing that buyers have yet to regain control. This area remains the last significant short-term defense for the bulls.
If this support fails, the bearish momentum is likely to intensify and extend the decline toward lower levels. Conversely, buyers would first need to reclaim the descending trendline before any meaningful recovery toward the $1.24 to $1.29 resistance zone could be considered. Until then, rallies are likely to face selling pressure and remain corrective in nature.
The post XRP Price Analysis: Is a Drop Below $1 Inevitable as Sellers Stay in Control? appeared first on CryptoPotato.
Bitcoin continues to trade without a decisive directional bias as both buyers and sellers defend key technical levels. Until one side forces a confirmed breakout, the current environment is likely to remain dominated by range-bound price action and short-term liquidity grabs.
Bitcoin Price Analysis: The Daily Chart
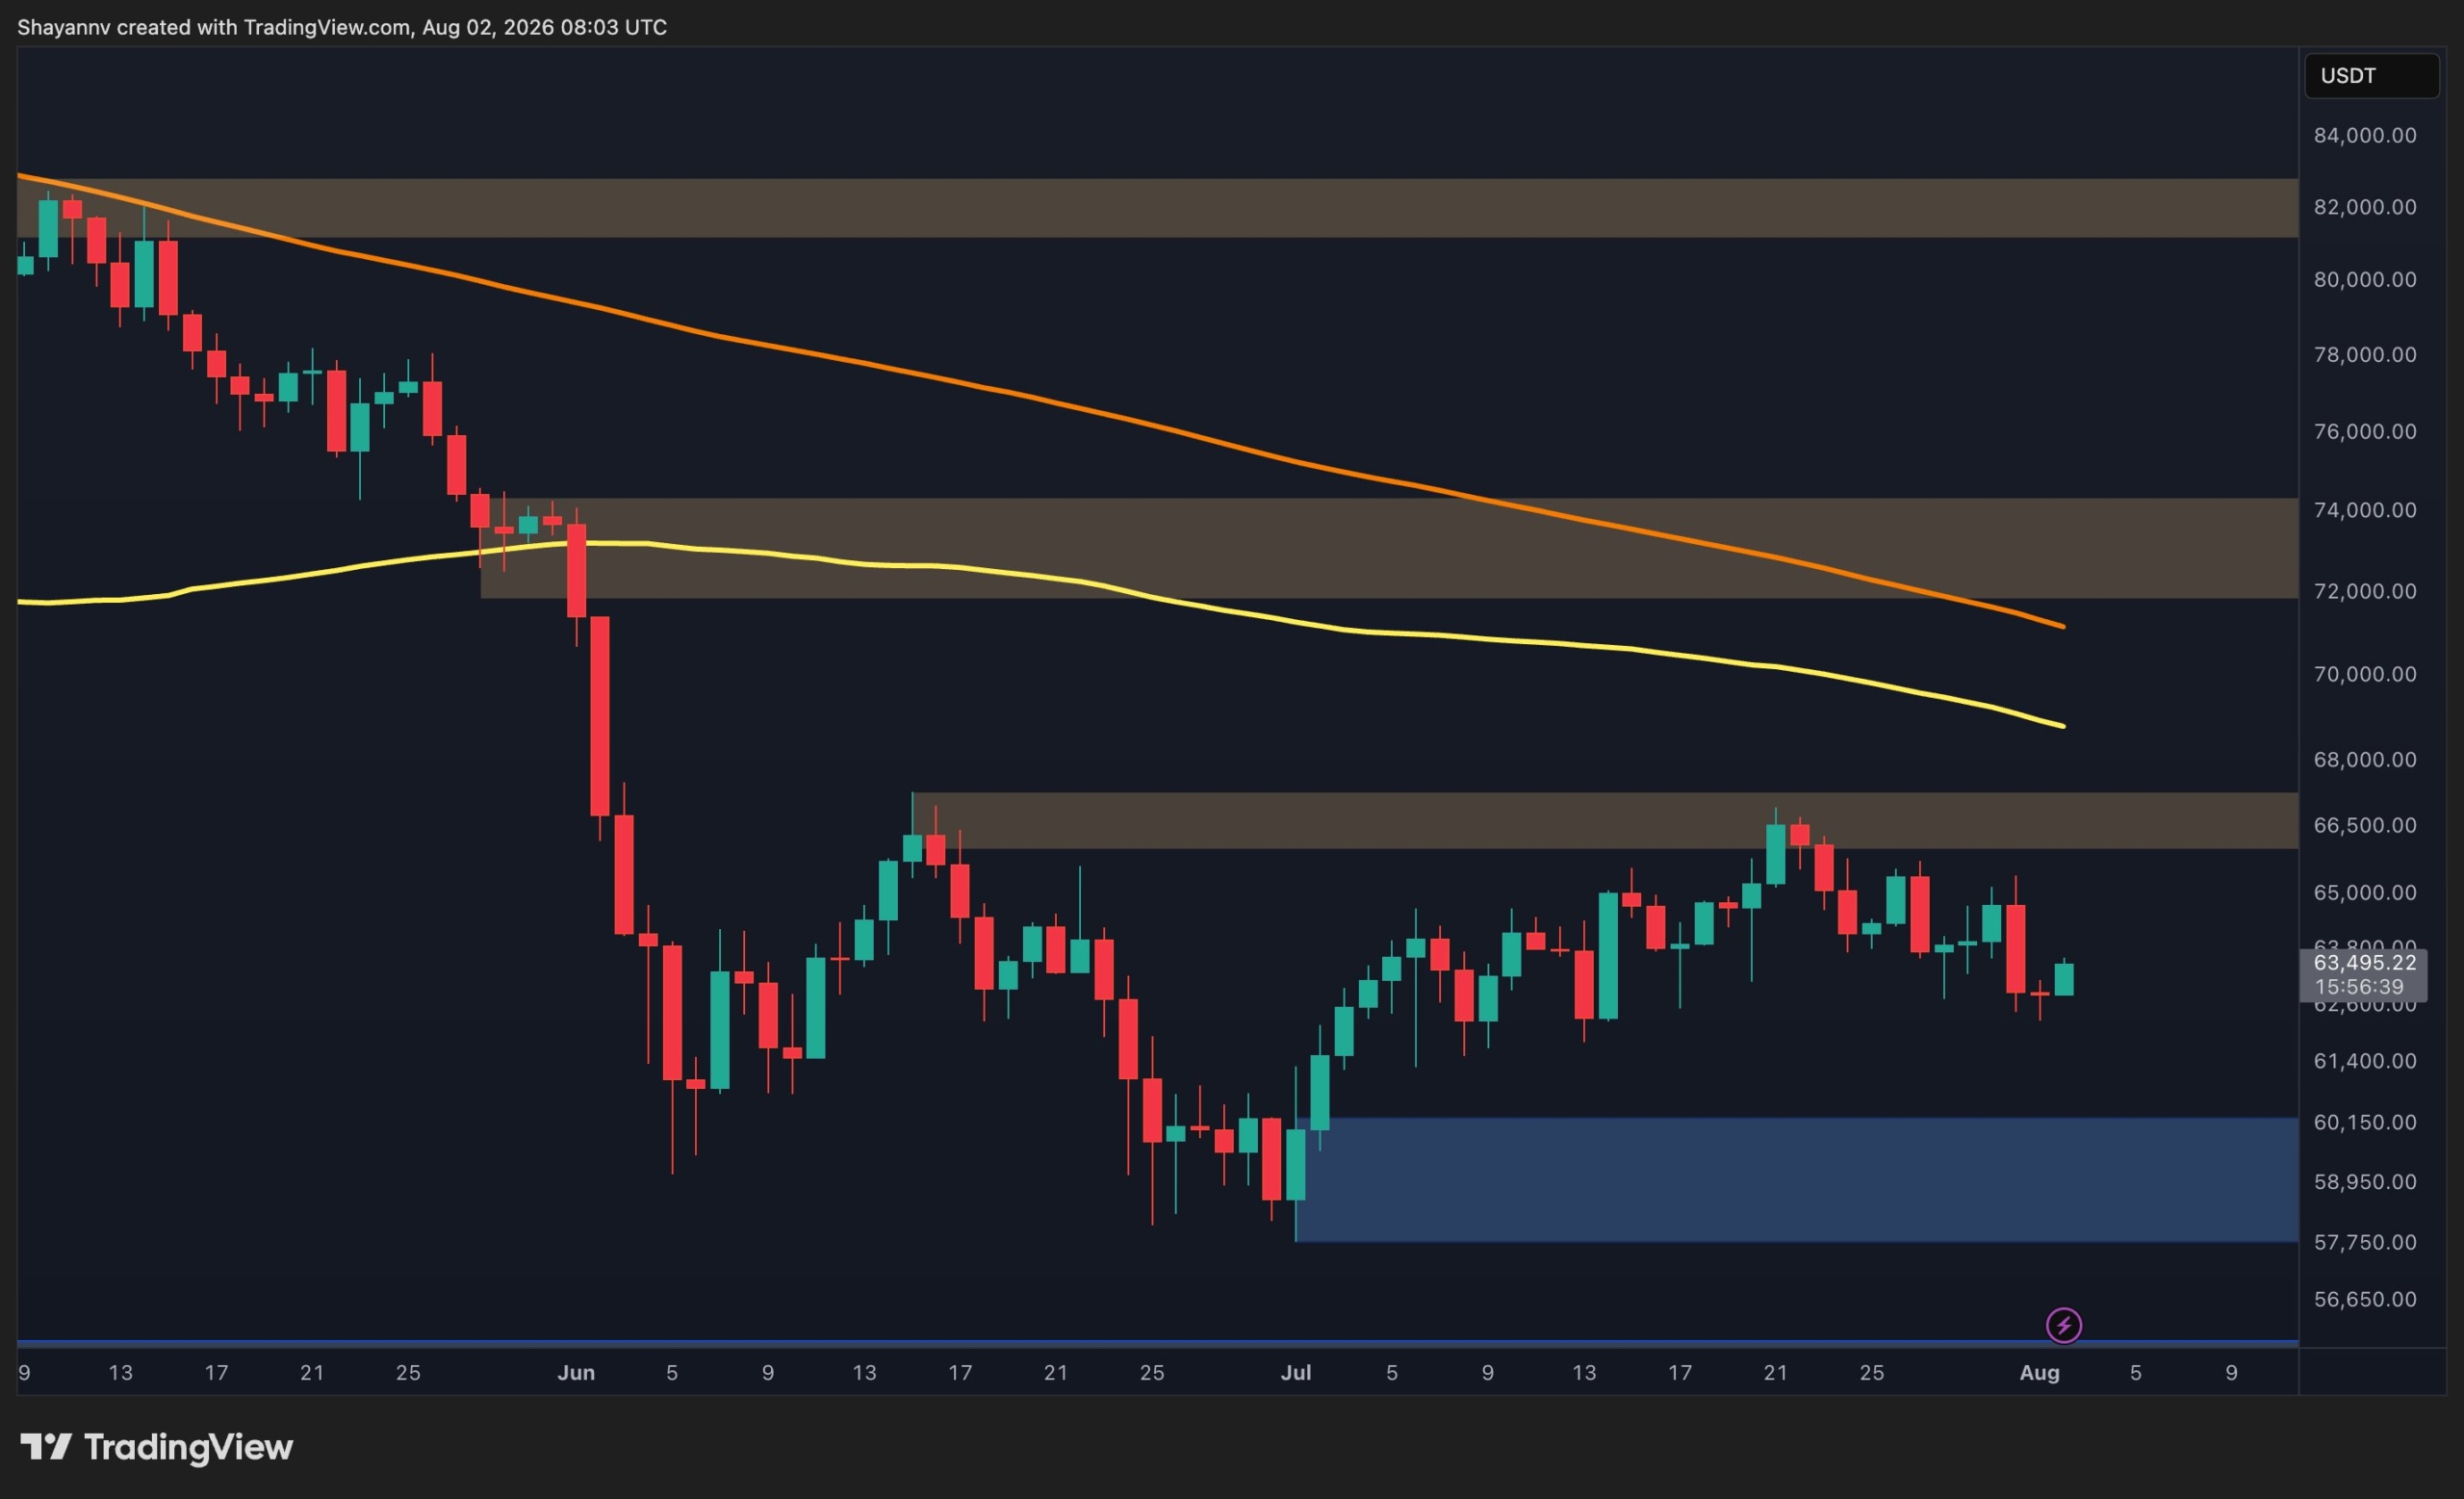
The daily chart suggests Bitcoin is still locked in a prolonged consolidation phase between the major support around $57.8K to $60.2K and the primary resistance at $66.2K to $66.8K. Despite several attempts by both buyers and sellers, neither side has managed to establish a sustained trend beyond these boundaries.
This type of market structure typically favors liquidity sweeps and stop hunts around local highs and lows before a genuine directional move develops. As long as the asset remains trapped between these two zones, traders should expect continued choppy price action rather than a sustained trend.
A confirmed breakout above the $66.2K to $66.8K resistance could trigger another leg toward the higher resistance around $72K to $74K. Conversely, losing the $57.8K to $60.2K demand zone would invalidate the current consolidation and expose Bitcoin to a deeper correction.
BTC/USDT 4-Hour Chart
On the 4-hour timeframe, Bitcoin is trading inside an even tighter range within the broader daily consolidation. Buyers continue defending the support region at $61.8K to $62.2K, while sellers repeatedly cap rallies below the resistance around $64.9K to $65.6K.
Holding above the buyers’ defense could allow another recovery attempt toward the upper boundary of this range. However, the recent sequence of lower highs indicates that sellers still hold a slight advantage, making a breakdown below the $61.8K to $62.2K support zone the more likely scenario if buying momentum continues to weaken. Such a move could accelerate selling pressure toward the lower boundary of the broader daily range.

Sentiment Analysis
The two-week liquidation heatmap shows a notable concentration of liquidity just beneath Bitcoin’s recent lows. This suggests futures market participants have been actively defending that area, with buyers stepping in to absorb selling pressure whenever the price approaches the lower liquidity cluster.
At the same time, a substantial pool of liquidity remains above the market around the $66K to $67K region, indicating that both sides still have attractive liquidation targets. As long as Bitcoin remains inside its broader consolidation, the price is likely to continue oscillating between these liquidity zones before a decisive breakout determines the next major trend.

The post Bitcoin Price Analysis: Will the Next Liquidity Sweep Push BTC Below $60K? appeared first on CryptoPotato.
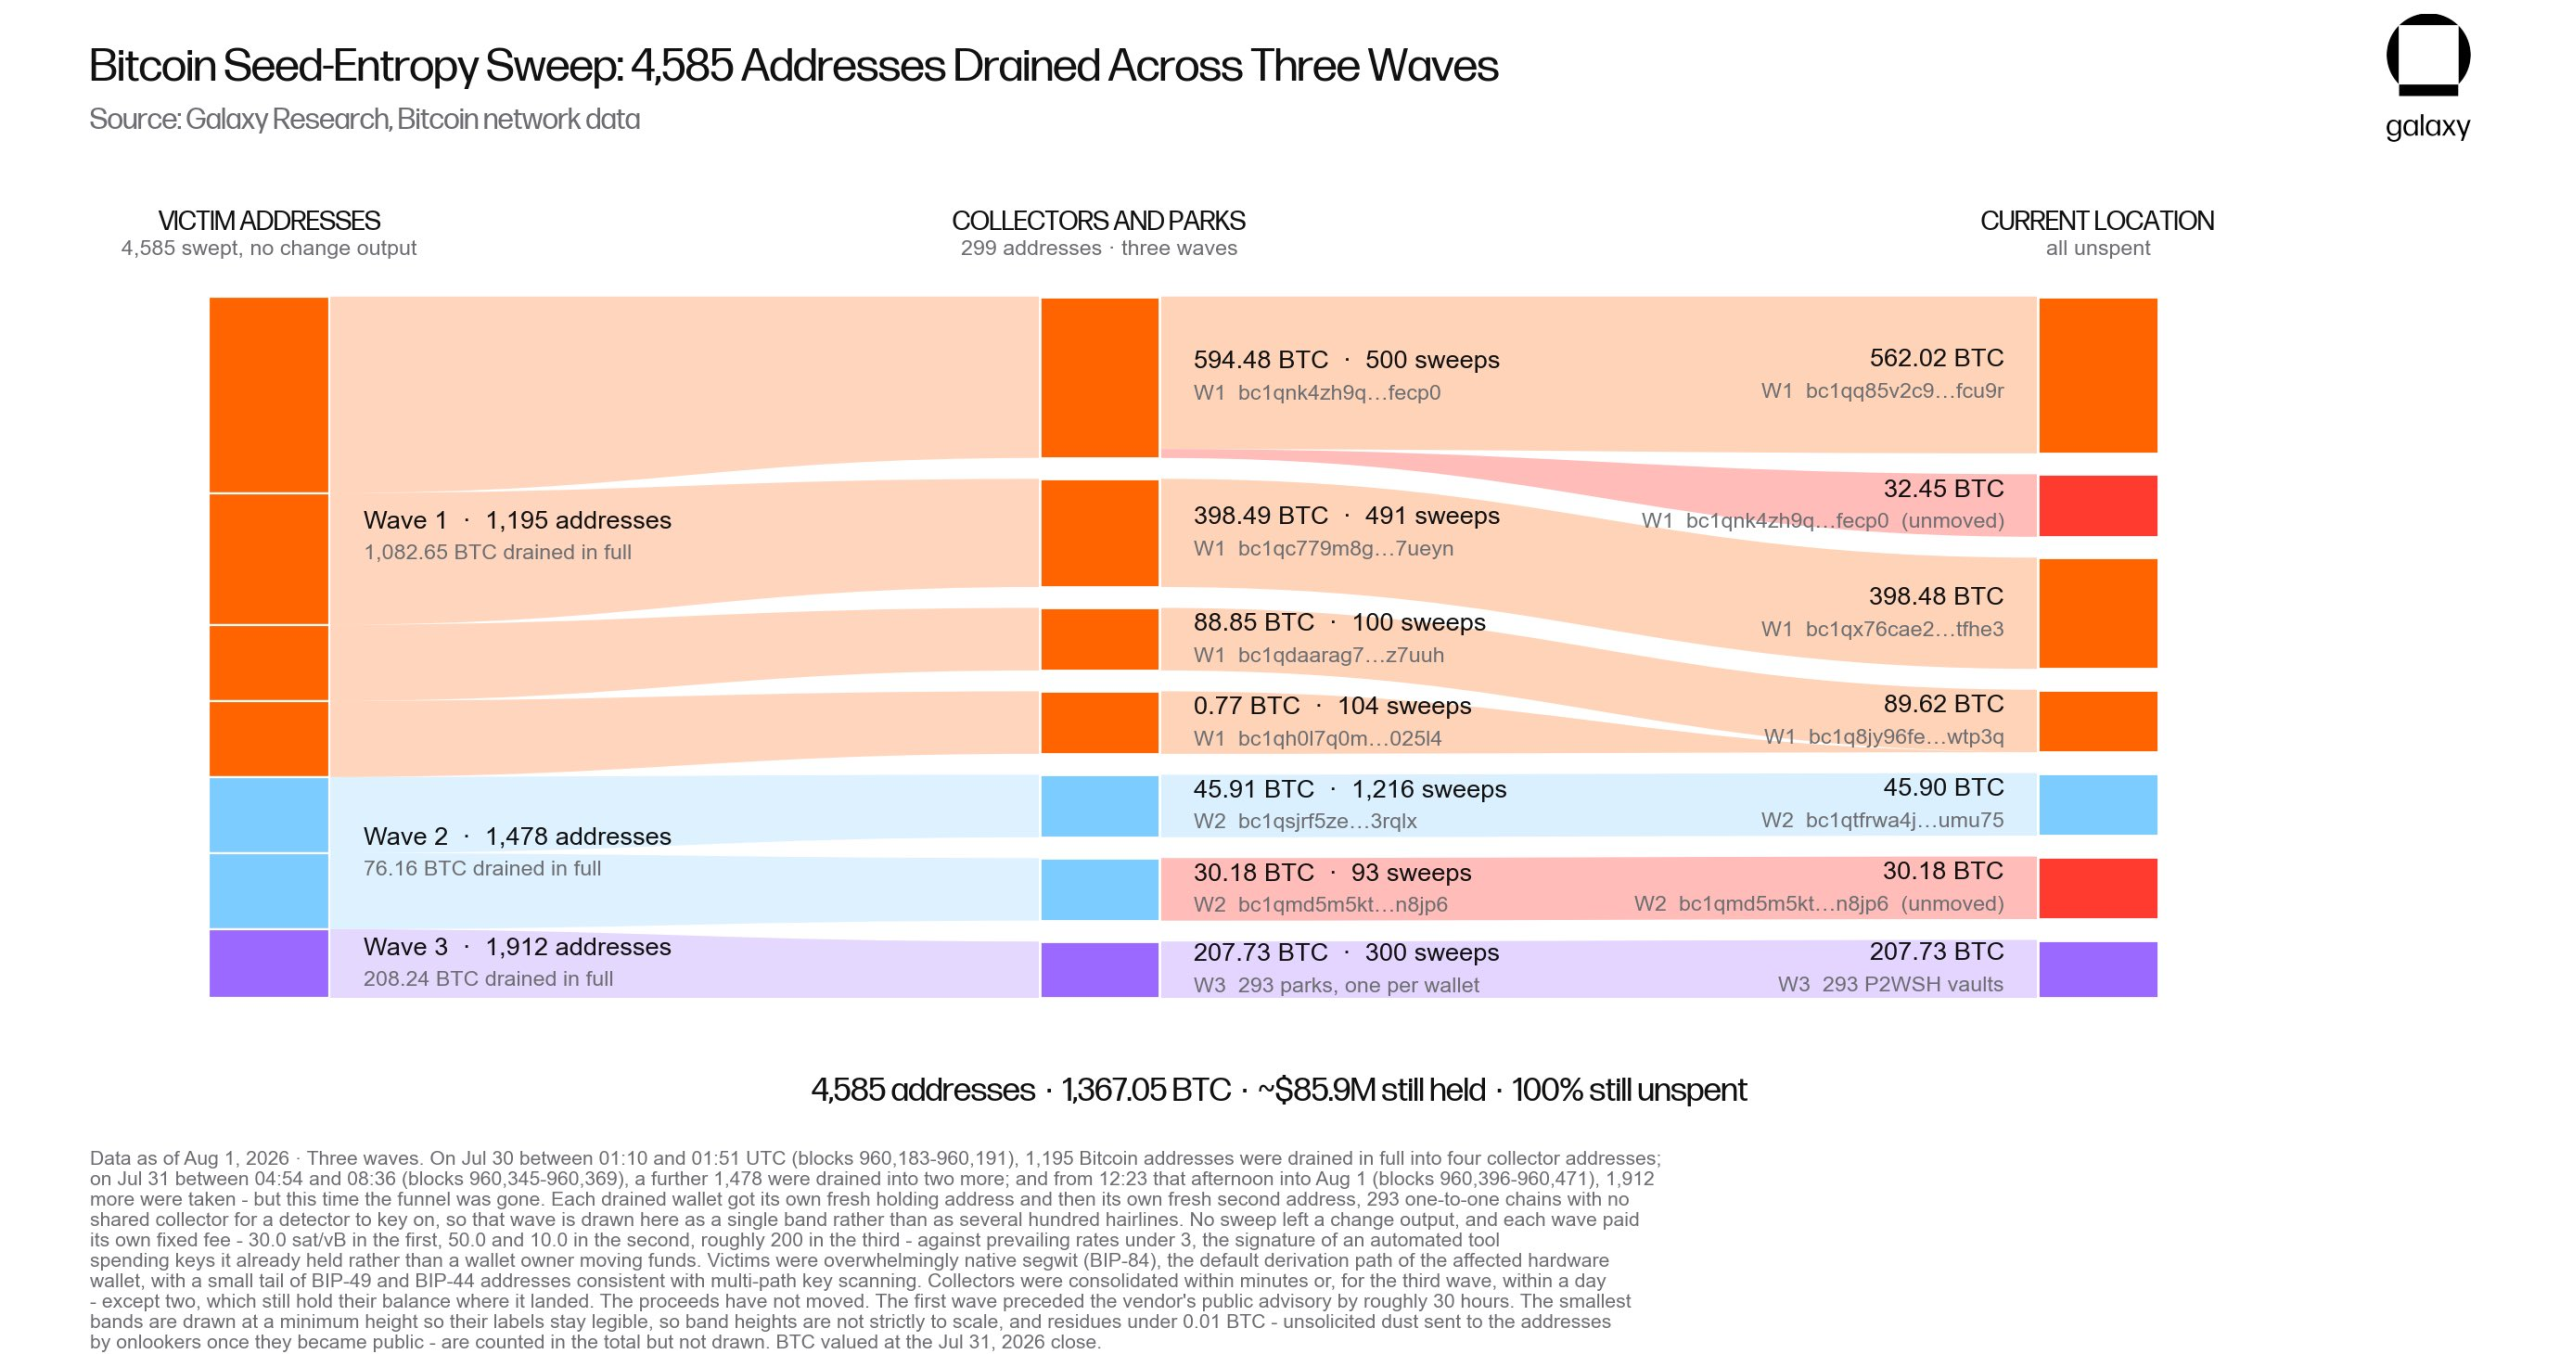
A Canadian entrepreneur lost more than $1.6 million in Bitcoin (BTC) from a Coldcard hardware wallet in under seven minutes, part of a wave that may total 1,367.05 BTC.
The case exposes an uncomfortable truth about self-custody: doing everything right may not be enough.
How One Holder Lost 18 BTC in Seven Minutes
Cold storage means keeping private keys on a device that never touches the internet. Jonathan Goodman followed that principle carefully, storing his Coldcard in a safety deposit box.
His 18.25 BTC sat in wallets secured across multiple safes. He never shared his seed phrase and kept every device isolated from online exposure.
None of it mattered on July 29, 2026. Between 9:36 and 9:43 that evening, every wallet he controlled was emptied.
Follow us on X to get the latest news as it happens.
Goodman first heard about a broader problem while at his cottage.
Assuming it would not affect him, he checked the balances in the Wasabi wallet software and found a series of red withdrawal transactions.
The vulnerability traces back to 2021. A flaw in the code that generates seed phrases left certain devices exposed, and attackers allegedly used artificial intelligence to brute-force the affected seed phrases.
He is filing reports with the police and the Ontario Securities Commission. Recovery hopes remain slim, though he wrote that the hardest part was having done everything right.
The scale extends far beyond one victim. Galaxy Research identified three suspected attack waves targeting addresses generated by Coldcard devices.
Those waves involved 4,585 source addresses and drained 1,367.05 BTC, worth roughly $88.6 million at the time of reporting.

What Galaxy Research Found in the Attack Data
Galaxy Research head Alex Thorn indicates that the attacks appear to be ongoing. He urged users who have not moved funds from potentially vulnerable setups to act immediately.
The first two waves showed similar transaction patterns and may share a common operator, though that remains unconfirmed. The third differed significantly, suggesting either updated tools or a separate actor exploiting the same key space.
The stolen Bitcoin remains in attacker-controlled addresses, with no further movement. Drained holdings had sat dormant for an average of 3.18 years, suggesting most victims were long-term holders rather than institutions.
Galaxy stressed an important caveat. Its findings rely solely on on-chain data and have not definitively confirmed insufficient randomness in the generation of the affected addresses.
“…this is a blow to bitcoin self-custody and we need to do better as a community: with security, with education, and with being realistic about complexity, expectations, and recommendations we make to friends, family, and the public…,” Alex Thorn said.
Analyst Shanaka Anslem Perera highlighted a deeper irony in Coldcard’s own documentation. The manual describes its default seed-generation method as the one it trusts most, while labeling it as low risk to users.
Subscribe to our YouTube channel to watch leaders and journalists provide expert insights.
Alternatives exist within the same device. Users can combine hardware output with dice rolls, or rely on dice alone, which the manual says removes all trust in the hardware. Most users likely followed the default path. That is precisely the method Galaxy Research now links to the losses.
The conceptual tension runs deeper. Reproducibility, prized for verifying firmware, becomes a liability in secret generation, since both weak and strong seeds produce valid 24-word phrases that appear identical.
Devices marketed under a “Don’t Trust, Verify” ethos can still harbor entropy flaws, leaving no visible trace. Affected users should assess their setups and migrate funds where necessary.
The post $1.6 Million Drained in a Blink: User Recounts His Dramatic Coldcard Wallet Hack appeared first on BeInCrypto.
Iran has denied President Donald Trump’s claim that a deal exists to reopen the Strait of Hormuz, the world’s busiest oil route. Oil jumped on the denial.
Bitcoin (BTC) barely moved. That gap says a lot about what crypto traders now choose to ignore.

Trump Says a Hormuz Deal Exists. Iran Says It Does Not
Trump posted on Truth Social early Sunday. He said he had canceled a planned strike on Iran.
He wrote that Iran and its neighbors asked him to hold off. The reason, he said, was that “the perimeters of a deal has been agreed to.”
That deal would open the Strait of Hormuz right away. It would also end Iran’s nuclear threat.
Iran answered within hours. Fars News Agency quoted a source close to the nuclear talks.
“There is no agreement regarding the reopening of the Strait of Hormuz, and the news published about it is false,” Fars News Agency, via CGTN.
Follow us on X to get the latest news as it happens
Iran’s acting defense minister, Seyyed Majid Ibn Al-Reza, called Trump’s words psychological warfare. Fars International called Trump’s terms a wish list.
None of this is new. An earlier pause in strikes in late July also went nowhere.
Talks did happen, though. Qatari mediators met Iran’s foreign minister, Abbas Araghchi, and US envoy Steve Witkoff on Saturday. Saudi Crown Prince Mohammed bin Salman urged Trump to cool things down.
Why Oil Jumped and Bitcoin Did Not
Start with the map. The Strait of Hormuz is a narrow sea lane between Iran and Oman.
About 20 million barrels of oil passed through it every day in 2024, EIA data shows. That is roughly a fifth of the oil the world uses.

Here is the problem. Only about 2.6 million barrels a day can go around it, through pipelines in Saudi Arabia and the UAE.
The rest has nowhere else to go. That is why one denial can move a market this big.
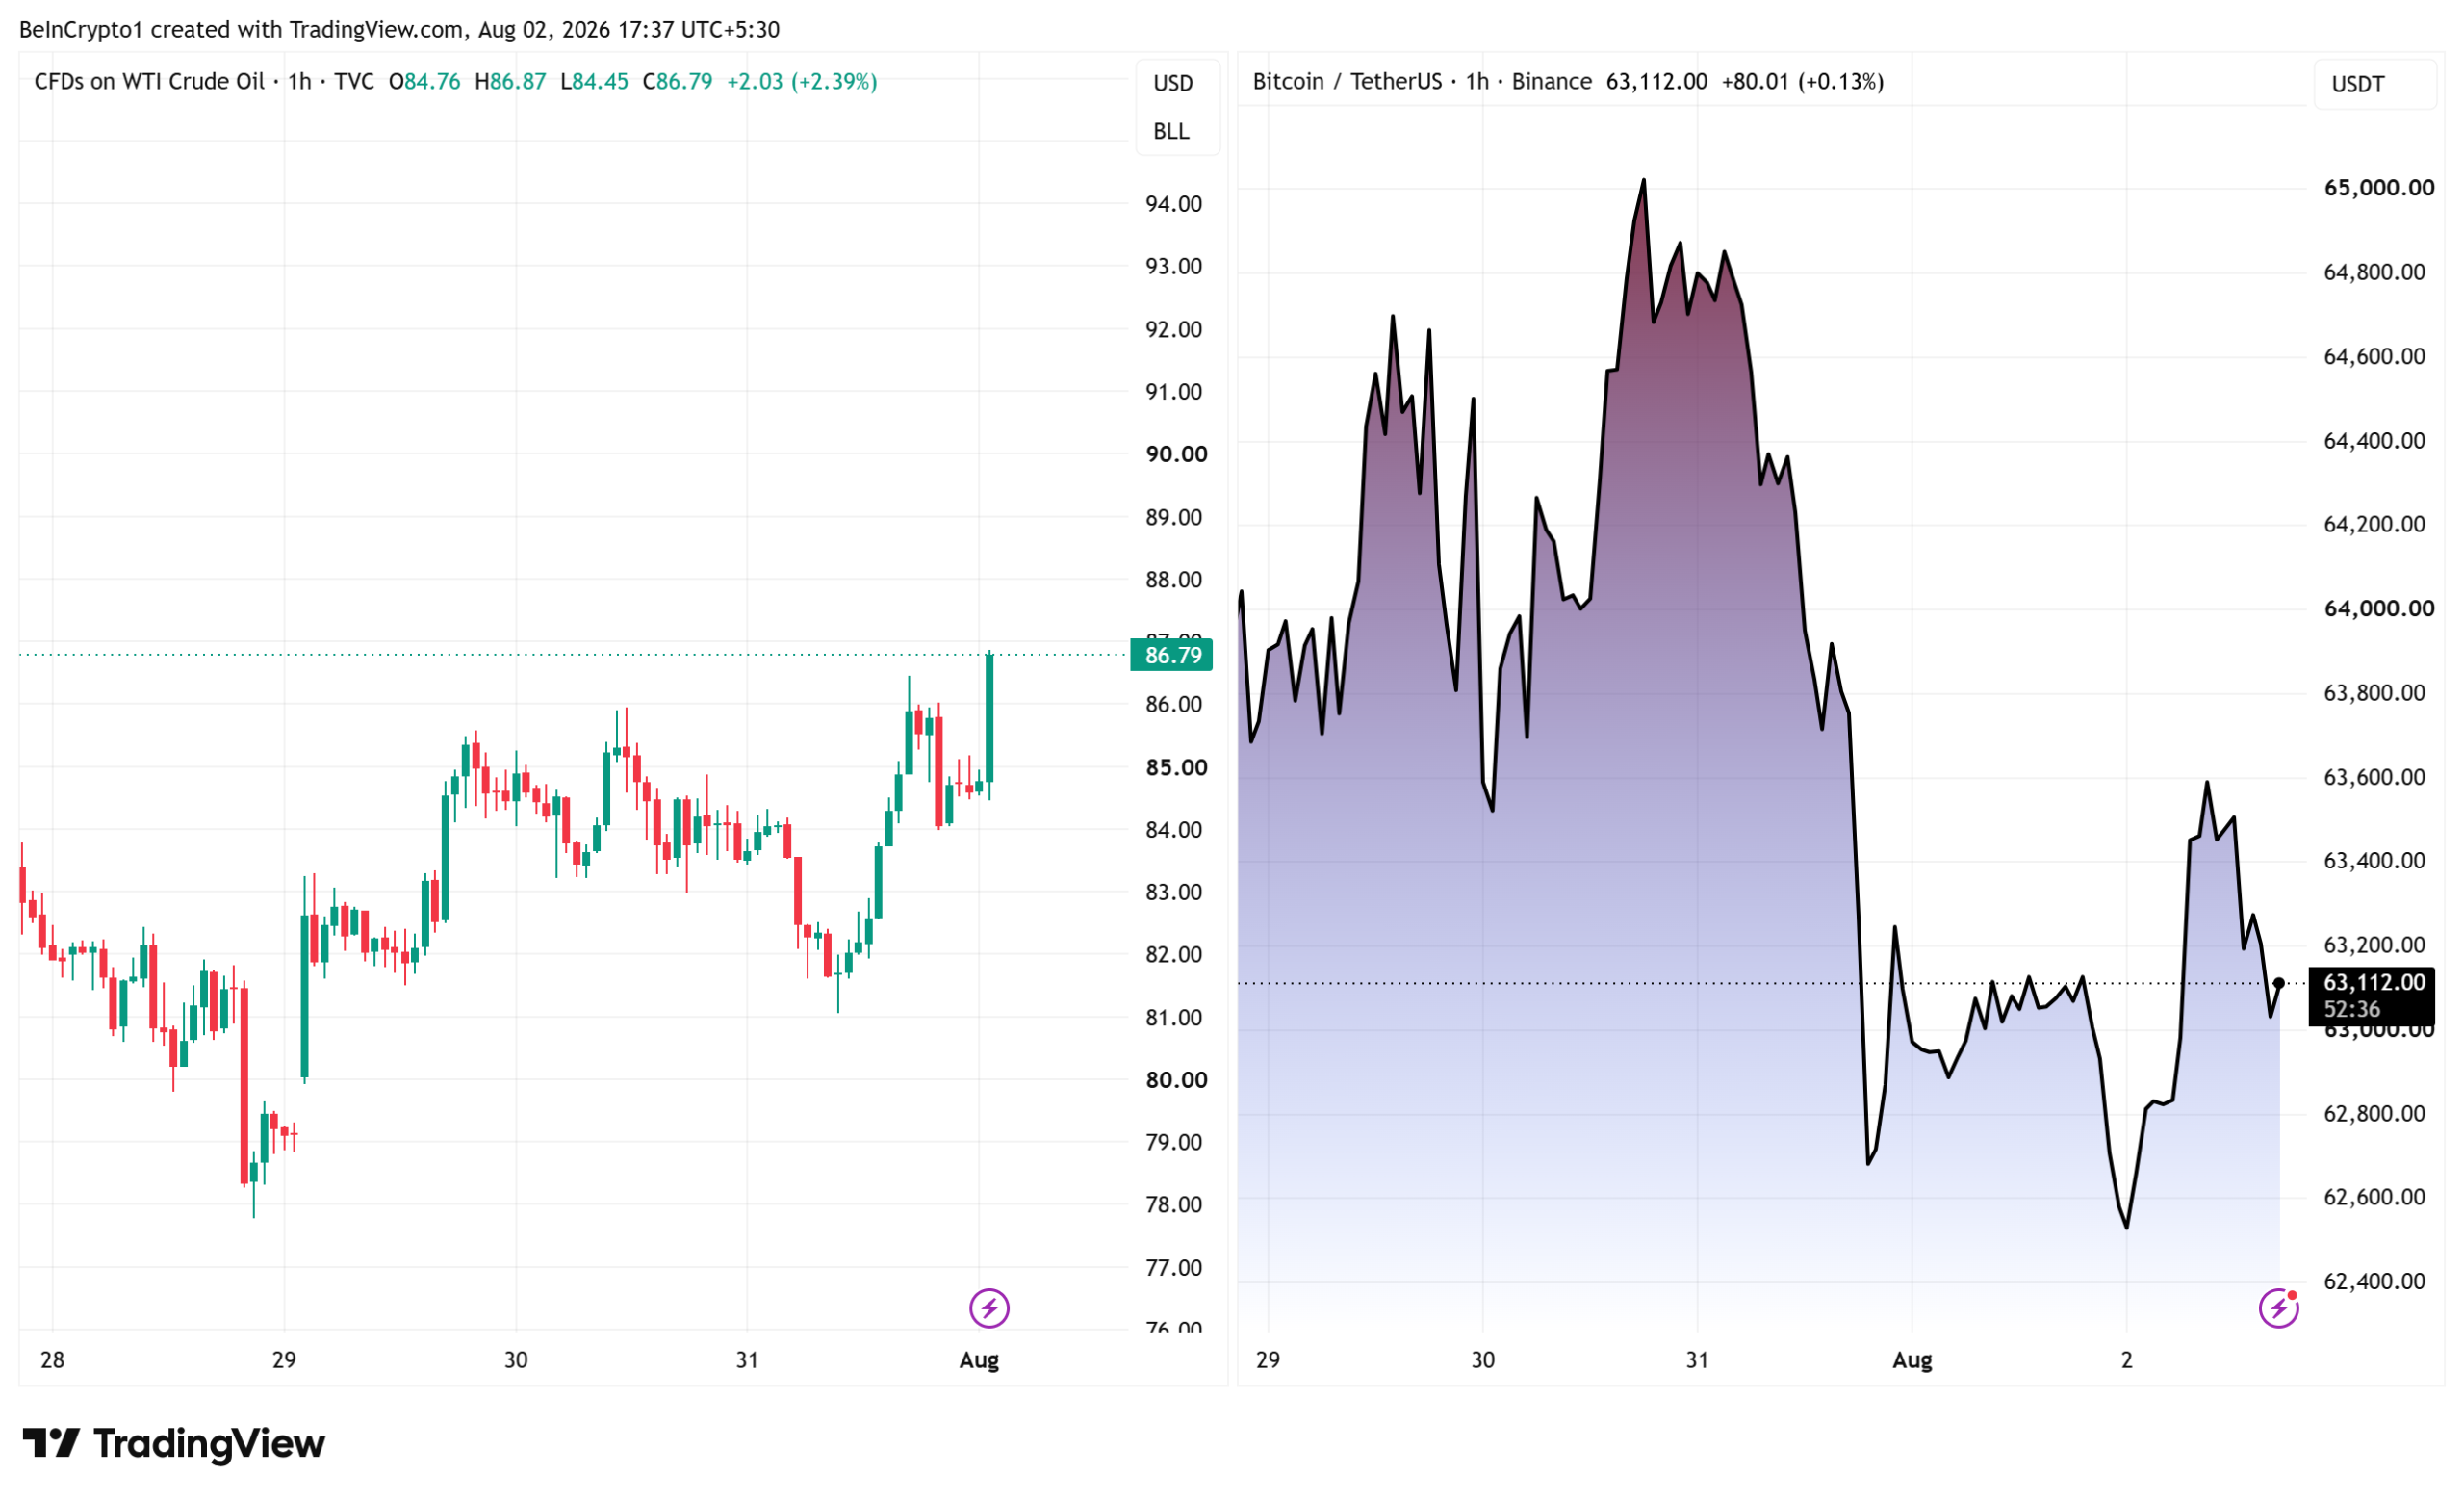
WTI crude, the US benchmark, closed at $84.67 on Friday. It then rose about 2.4% to trade near $86.79.

The denial also puts an official forecast in doubt. On July 7, the EIA cut its Brent crude forecast for this quarter by $27 a barrel, to $74. It cited the June US-Iran deal and busier traffic through the strait.
That June deal has since fallen apart. Analysts tracking Hormuz reopening timelines now expect the route to stay restricted into 2027.
Bitcoin did almost nothing. It added 0.08% in 24 hours and sat near $63,063.

It also trades about 50% below its record of $126,080, set on October 6, 2025. The muted Bitcoin price reaction suggests traders now ignore headlines that change nothing on the water.
What Happens Next
Oil matters to crypto for one reason. It feeds inflation.
June proved the link. US energy prices fell 5.7% that month, the steepest drop since April 2020.
The BLS said energy did most of the work. Headline prices fell 0.4% over the month. Annual inflation cooled to 3.5% from 4.2%.
Energy is still expensive over a full year, however. Gasoline is up 26.7%.
So a lasting jump in oil would undo that progress. That makes Federal Reserve rate cuts harder to justify. Rate cuts are what assets like Bitcoin want.
The next check comes August 12, when the BLS publishes July inflation.
Until ships can sail through Hormuz freely, oil keeps its war premium. Bitcoin keeps waiting.
The post Iran Denies Trump’s Hormuz Deal, Oil Jumps but Bitcoin Watches appeared first on BeInCrypto.


South Koreans sent $367 million more in stablecoins out of the country than they brought back in June. It was the 18th month in a row that money left.
The Financial Supervisory Service (FSS) handed those numbers to lawmaker Lee Jong-wook. The streak started in January 2025. Traders are chasing something they cannot get at home.
Why South Korea’s Stablecoin Outflows Keep Widening
Five exchanges handle almost all local crypto trading. They are Upbit, Bithumb, Coinone, Korbit, and Gopax.
In June, they sent roughly $1.8 billion in stablecoins to foreign platforms. About $1.44 billion came back. The gap was $367 million.
Local media reported that across the whole second quarter, close to $1.1 billion left.
Follow us on X to get the latest news as it happens
The size is what caught the attention of lawmakers. Koreans bought about $470 million of foreign shares in June, according to the Korea Securities Depository. The stablecoin outflow matched 77.6% of that figure.
A year earlier, the ratio sat near 20%. Crypto money now leaves the country almost as fast as stock money.
The trend held even as the local market shrank. Seoul confirmed a 22% crypto tax for 2027, and domestic trading volume fell nearly 55% in the first half.
One caveat belongs here. The FSS counts only the five licensed exchanges, so coins sent to private wallets first never show up.
What Foreign Exchanges Offer That Seoul Cannot
Korean platforms mostly offer plain spot trading. That is the whole problem.
Foreign venues offer far more.
- Crypto derivatives with heavy leverage
- Dollar-based real world assets (RWAs)
- Decentralized Finance (DeFi) protocols
- Staking rewards
Some also list Samsung Electronics, SK Hynix, and Hyundai Motor as tradable contracts. Leverage on those can run into the tens of times. A stablecoin transfer is the cheapest way in.
The same hunger shows up in regulated markets. Koreans put a net $1.28 billion into foreign leveraged exchange-traded funds (ETFs) in June. That was more than triple the May total.
Seoul did try to compete. Korea listed its first single-stock leverage ETFs on May 27. Less than a month later, FSS Governor Lee Chan-jin publicly criticized them.
A bigger fix is on the way. Four agencies published a plan on July 19 to legalize won-backed stablecoins. A separate bill would treat crypto as national wealth.
The Leverage Unwind Sitting Behind the Numbers
The regulator’s worry proved well founded. Fourteen leveraged ETFs track Samsung and SK Hynix. Their assets shrank from about $10.7 billion at the end of June to $6.3 billion by July 13.
Margin loans fell too. Korean brokerages held roughly $21.8 billion on July 30, down about $4.4 billion since June 24.
The Kobeissi Letter says $67 billion has drained from margin accounts across Korea, China, and Taiwan. BeInCrypto could not confirm that total.
The KOSPI lost 22.19% in July, its worst month since 1997. Then it jumped 17.91% on July 31, a record single day.
Economist Steve Hanke blames global fatigue with AI hype. That rebound, led by a 29.95% gain in SK Hynix, cuts against the idea. Asia’s unwinding AI trade has swung just as hard in Tokyo.
The stablecoin figures tell a steadier story. Korean money is not hiding. It is relocating, much as it did when Korean investors cashed out late last year.
Lee sits on the National Assembly’s finance committee for the People Power Party. He wants the government to act.
“As the ‘coin move’ from domestic to overseas spreads, funds are flowing abroad, and investors are being defenseless against high-risk derivatives on foreign exchanges,” local media reported, citing Lee.
Seoul can close the exits or widen the menu at home. That choice decides what month 19 looks like.
The post South Koreans are Sending Stablecoins to Foreign Exchanges at Record Rate appeared first on BeInCrypto.


Everything under one login
Round-the-clock trading is one part of the plans exchanges have for traditional assets. Coinbase and Binance want customers to trade crypto, stocks and other products through one account, a model both have described as an “everything exchange” or financial super app.
Coinbase is preparing to offer U.K. customers equities and derivatives alongside crypto after securing investment-services authorization from the Financial Conduct Authority under rules based on the Markets in Financial Instruments Directive, or MiFID.
The authorization allows Coinbase to offer traditional shares to retail customers and crypto, equity and commodity perps to eligible institutional and advanced traders, the company said.
“Perpetual futures are a core focus of what Coinbase is trying to bring to market,” said Keith Grose, U.K. CEO at Coinbase, in an interview with CoinDesk. “We’re really focused on being the ‘everything exchange.’”
Grose said the longer-term plan is to bring spot crypto, perpetual futures, traditional equities, and eventually tokenized versions of other assets into one place. That could allow customers to use positions across different markets as collateral or borrow against their equities.
Using stocks as collateral
Binance is testing another part of the model by allowing some high-net-worth clients to use tokenized stock positions as collateral for other trades.
“We recognize you could have Nvidia or SpaceX stock, a tokenized version,” Jan said. “You could actually have a tokenized stock put on our exchange, and we’ll use that as collateral for you to trade something else. It could be a crypto derivative.”

WWE SummerSlam 2026 card: Complete list of matches for Night 2 on Sunday

UV Printer? 3D Printer? HeyGears Says “Why Not Both”?

Indian Real big money…. #shorts #money #india #indiamoney


-
 Sports7 days ago
Commonwealth Games boxing: Jadumani Singh seals dominant 5-0 win over Pakistan’s Sumama Rehman to enter quarter-finals | Commonwealth Games News
-

 Business4 days ago
Why Trees Belong on the Risk Register
-

 Fashion2 days ago
Weekend Open Thread: Wit & Wisdom
-

 Tech7 days ago
Intel is reversing course and bringing hyper-threading back to its server chips
-

 Politics2 days ago
Meta enters AI-training agreement with far-right ‘propaganda rag’ Newsmax
-

 Politics6 days ago
Luke Littler dismantles Gerwyn Price to retain title in Blackpool
-
 Crypto World1 day ago
MicroStrategy Post-Earnings CLARITY Act Push Could Add New Catalyst for Its Stock
-

 Politics5 days ago
The Part of the Electric Transition Nobody Wants to Discuss
-
 Entertainment5 days ago
‘Stargate’ Creator’s New Sci-Fi Series Returns for Season 3 Tomorrow
-

 News Videos7 days ago
BITCOIN JUST ENTERED THIS CRITICAL ZONE…
-

 Business4 days ago
Major shareholder moves on Canyon
-

 News Videos3 days ago
Bitcoin Enters the 3rd Stage of the Bear Market
-

 Crypto World1 day ago
XRP Ledger v3.3.0 brings five institutional features
-

 Crypto World5 days ago
Kraken Enables Retail Access to Jersey Mike’s IPO via Tokenized Shares
-

 Tech6 days ago
New macOS Sequoia & Sonoma security updates for older Macs
-

 News Videos5 days ago
Claude: Build Financial Dashboards in Minutes (2026)
-

 Politics3 days ago
Luke Littler’s dominance sparks GOAT debate
-

 Sports3 days ago
Seema Kaliramna Wins Discus Throw Bronze, Takes India’s CWG Medals Tally To 17
-

 Business5 days ago
Johnson & Johnson agrees to $5.5B settlement over talc cancer claims
-

 Crypto World6 hours ago
Crypto PAC spending tops $2M in Michigan House race
You must be logged in to post a comment Login