
Crypto World
How do spot crypto ETFs actually work? Creation, redemption, and why flows move price



Spot Bitcoin and crypto ETFs have become the largest force in the market, absorbing and releasing billions of dollars of coins through a mechanism most of their own investors have never seen. This guide opens the machine: authorized participants, the creation and redemption loop, in-kind versus cash models, why a dollar of flow becomes a dollar of real buying or selling, how the arbitrage keeps ETF prices honest, and how to read the daily flow numbers everyone quotes.
Summary
- Spot crypto ETFs create and redeem shares through authorized participants, making ETF inflows and outflows translate into real buying and selling of cryptocurrencies.
- The creation and redemption process keeps ETF prices closely aligned with the value of the underlying coins through continuous arbitrage.
- Daily ETF flow data reflects actual spot market demand rather than investor sentiment alone, making it one of the market’s most closely watched indicators.
The most important trading desk in crypto does not trade on a crypto exchange. It sits inside a handful of Wall Street firms called authorized participants, and its job is to keep the price of spot crypto exchange-traded funds glued to the price of the coins they hold, by creating and destroying ETF shares in industrial quantities. When headlines report that Bitcoin funds bled $4.51 billion in a month, or took in $221.7 million in a day, they are reporting this machine’s output, and the machine’s mechanics, not sentiment, are why those flows translate directly into buying and selling of actual coins.
The spot ETF era has made these funds the marginal force in crypto’s market structure: they hold coins worth more than most national reserves, their daily flows are the most watched data series in the asset class, and their behavior in stress, as the recent record outflow month showed, can dominate price for quarters at a time. Yet the mechanism underneath, creation units, authorized participants, in-kind transfers, net asset value arbitrage, remains folk knowledge at best among the traders who quote its outputs daily.
This guide is the missing manual. It covers what a spot crypto ETF actually is and how it differs from the futures products and trusts that preceded it, the creation and redemption loop that is the entire engine, the in-kind versus cash distinction and why it matters for taxes and mechanics, the arbitrage that keeps the share price tracking the coins, why flows equal real spot demand and supply, what the daily flow numbers do and do not mean, and the honest list of what can go wrong.
What a spot ETF is, and what it replaced
A spot crypto ETF is a fund that holds the actual asset, real Bitcoin or Ether in institutional custody, and issues shares that trade on a stock exchange, each share representing a claim on a sliver of the coin pile. The design goal is simple to state and hard to engineer: make the share price track the coin price, continuously, within basis points, so that buying the ETF is economically equivalent to buying the coin, inside a brokerage account, with no wallets, keys, or crypto exchanges involved.
Everything distinctive about the structure exists to serve that tracking, and the point is sharpest against what came before. Futures-based ETFs held derivative contracts rather than coins and bled value to the cost of rolling those contracts month after month. Closed-end trusts held real coins but issued a fixed number of shares with no redemption mechanism, so their prices drifted to enormous premiums and discounts against their holdings, famously reaching double-digit discounts, because nothing forced the share price and the coin value together. The spot ETF’s innovation is precisely the forcing mechanism: an open-ended share supply that expands and contracts through arbitrage, executed by authorized participants. That mechanism is also, not incidentally, what separates an ETF from the treasury companies whose share prices float freely above and below their coin holdings: a treasury stock has no redemption loop, so its premium is a sentiment gauge; an ETF has one, so its premium is an arbitrage error measured in hundredths of a percent.
The engine: creation and redemption
The heart of every ETF is a wholesale market invisible to retail holders. ETF shares are not created when an investor clicks buy; they are created in bulk blocks called creation units, typically tens of thousands of shares at a time, by authorized participants, large trading firms and banks that hold agreements with the fund’s issuer.
The creation loop runs like this. When investor demand pushes the ETF’s market price even slightly above the value of the coins backing each share, its net asset value, an authorized participant sees free money: it buys the equivalent amount of actual coin on crypto markets, delivers it to the fund (or delivers cash the fund uses to buy the coin, a distinction the next section unpacks), receives newly minted ETF shares at NAV in exchange, and sells those shares into the stock market at the premium price. The AP pockets the spread; the share supply expands; the premium collapses back toward zero. Redemption is the mirror: when the ETF trades below NAV, an AP buys cheap shares on the stock market, returns them to the fund, receives coin (or cash from coin sales) worth full NAV, and sells the coin, pocketing the discount and shrinking the share supply until the price snaps back.
Read the loop again and notice what it implies, because it is the single most important fact in this guide: every net creation is real coin purchased on the market, and every net redemption is real coin sold. The flows are not sentiment surveys or paper reallocations; they are the visible exhaust of actual spot transactions, executed by the APs against crypto exchanges and OTC desks. A $500 million inflow day means roughly $500 million of coins were bought and moved into custody; a $4.51 billion outflow month means that much was sold out of it. This is why ETF flow data moves markets and why it deserves the obsessive attention it gets: it is the rare series that measures demand in the units that matter, coins actually changing hands, disclosed daily, to the dollar.
In-kind versus cash: the plumbing distinction
Creations and redemptions come in two flavors, and the difference, invisible to holders, shapes everything behind the scenes. In an in-kind model, the AP delivers and receives the actual asset: coins go in for shares, shares come back for coins, and the fund itself never trades. In a cash model, the AP delivers and receives dollars, and the fund’s own trading desk executes the coin purchases and sales. US spot crypto ETFs launched under a cash-creation regime, a regulatory choice that kept broker-dealers at arm’s length from handling coins, and the industry has since moved toward permitting in-kind, the structure ETFs use for every other asset class.
The distinction matters three ways. Mechanically, in-kind is cleaner: the fund holds coins and swaps them for shares, full stop, while cash models interpose a trading step where execution costs and timing slippage live. Tax-wise, in-kind is the quiet superpower of the ETF wrapper, letting funds shed appreciated assets through redemptions without realizing taxable gains, an efficiency cash models partially forfeit. And market-structure-wise, the cash model makes the fund itself a large, scheduled trader in the underlying market, whose execution patterns around creations and redemptions are studied, and sometimes anticipated, by everyone else. Either way, the coins end up in institutional custody, segregated wallets at qualified custodians, whose addresses on-chain observers track as a real-time audit of the funds’ holdings, one of the few places where traditional finance’s opacity meets crypto’s radical transparency and transparency wins.
The decade-long fight to exist
The mechanics above were nearly a decade in the courts and dockets before they were allowed to run, and the history explains several of the structure’s present quirks. The first spot Bitcoin ETF application was filed in 2013; the following ten years produced an unbroken record of rejections, with regulators citing manipulation risk in underlying crypto markets and the absence of surveillance agreements. The industry routed around the wall with inferior vehicles, the futures ETFs with their roll costs, the closed-end trusts with their wild premiums and discounts, and each inferior vehicle’s flaws became, ironically, evidence in the eventual case: the trust’s persistent discount showed concretely that investors were being harmed by the absence of a redemption mechanism, and a federal court’s 2023 ruling that rejecting spot products while approving futures ones was arbitrary broke the dam. The January 2024 approvals arrived as a batch, launching a dozen funds into simultaneous competition, which is why the market’s structure is a fee war among near-identical products rather than one dominant fund, and why issuer competition drove management fees to levels that undercut most of the world’s equity index funds within weeks of launch.
The cash-only creation requirement was the approvals’ regulatory fingerprint, imposed so that broker-dealers never touched coins directly, and its gradual relaxation toward in-kind is the quiet second act of the products’ regulatory story, unlocking the tax efficiency and mechanical cleanliness the wrapper was always meant to have. Ether funds followed Bitcoin’s, staking-enabled versions followed those, and the approval architecture built for two assets is now the template every other crypto asset’s ETF hopes, conditional on the classification framework Congress is deciding, to pass through. Ten years of rejection, in hindsight, built the most consequential piece of the structure: by the time the machine was switched on, the custody, benchmark, and surveillance infrastructure had been argued into institutional grade, which is a large part of why it has run through record inflows, record outflows, and a full market cycle without a single structural incident.
What holding the ETF actually costs
The wrapper’s convenience has a price list worth itemizing, because it is subtracted silently. The management fee, deducted daily from the fund’s assets, compounds into the tracking: a fund charging a quarter of a percent will lag its coin by exactly that much per year, before anything else. The NAV-timing gap adds a subtler cost for traders: the official NAV is struck once daily against an index snapshot, so orders executed at market prices far from the snapshot inherit tracking noise, trivial for holders, real for anyone trading the products tactically. Spreads and premiums cost basis points on entry and exit, tightest in the giant funds and wider in the small ones, and the arbitrage that minimizes them is weakest at the open and around crypto’s violent hours. And the structural exclusions, no staking yield in most products, no on-chain utility, no self-custody, are opportunity costs rather than fees, the value surrendered for the brokerage account’s convenience. Summed, the wrapper costs a diversified long-term holder a fraction of a percent annually against holding coins directly, which is, by the standards of what the access is worth to the capital that uses it, among the better bargains in finance, and knowing the itemization is what separates choosing the bargain from defaulting into it.
Why the tracking holds, and when it slips
The arbitrage loop keeps spot ETF prices within a whisker of NAV in normal conditions, but the whisker is worth understanding, because its width is a live diagnostic of market health.
The ETF trades during stock-market hours; the coins trade around the clock. Overnight and on weekends, the share price is frozen while the asset moves, so every open begins with a gap the APs arbitrage away in minutes, and the fund’s official NAV, struck once daily against a benchmark index of crypto exchange prices, is itself a snapshot of a moving target. Small premiums and discounts, hundredths to tenths of a percent, are therefore constant and meaningless. What matters is persistence: a discount that survives arbitrage signals that APs cannot or will not close it, because coin markets are too volatile to hedge, because borrowing shares is hard, or because redemption plumbing is stressed, and persistent dislocations in ETF land have historically been the smoke that precedes fire in the underlying market. The same logic runs through every wrapped-asset structure in finance, tokenized stocks keep their pegs by the identical mint-and-redeem loop, and the universal rule holds here: the wrapper is only as good as the arbitrage that binds it, and the arbitrage is only as good as the least reliable step in its loop.
One more participant deserves a paragraph: the basis trader. Because ETF shares can be held long against short futures positions, a meaningful fraction of ETF holdings at any time belongs not to investors who want crypto exposure but to arbitrageurs harvesting the spread between spot and futures prices. When that spread compresses, these holders redeem, mechanically, with no view on the asset, which means headline outflows always mix conviction selling with carry-trade unwinding in proportions no outside observer can fully separate. It is the single most important caveat when reading the flow numbers, and it cuts both ways: some of the most alarming outflow streaks in the products’ history were substantially plumbing, and some of the most celebrated inflow runs were substantially leverage.
A worked example ties the machinery together. Suppose strong demand lifts a Bitcoin ETF’s market price 0.2% above its NAV during a rally. An authorized participant simultaneously buys, say, $50 million of Bitcoin across exchanges and OTC desks and shorts the equivalent in ETF shares at the rich price, locking the 0.2% spread, about $100,000, minus costs. It delivers the coins (or cash) to the fund, receives creation units at NAV, and uses the new shares to close its short. Net result: the AP earned a riskless spread, the fund grew by $50 million of coins in custody, the day’s flow report shows a $50 million inflow, and the ETF’s premium collapsed back to a basis point or two. Reverse every step for a redemption into a discount. Multiply by every AP, every fund, and every trading day, and the aggregate is the flow series the market watches: not a survey, but the arithmetic residue of thousands of such loops, each one a real spot transaction with a paper trail. When the loops run large in one direction for weeks, as they did through June’s record redemptions, the ETF complex is not reflecting the market’s direction; at the margin, it is the market’s direction.
One design detail rounds out the picture: creation units keep the wholesale and retail layers honest simultaneously. Retail investors trade shares among themselves on the exchange all day without touching the fund at all, and only the net imbalance, the demand the secondary market cannot internally match, flows through the APs into creations or redemptions. The fund’s coin pile therefore moves only when the market’s aggregate position actually changes, which is why the flow series is such a clean demand signal: it nets out all the churn and reports only the residual conviction.
Reading the flows like a professional
The daily numbers reward a few disciplined habits. Read trends, not days: single sessions are noise, dominated by one fund’s creation calendar or one AP’s book, while multi-week runs, like the ten-day outflow streak that marked June’s low, are regime information. Distinguish flows from assets: net asset values fall when prices fall even while money flows in, and rise in rallies even during redemptions, so AUM headlines are mostly price echoes; the flow line is the demand signal. Watch the spread of participation: inflows concentrated in one fund are a product story, inflows across all issuers are an allocation story, and the custody balances that flows build are a structural supply force in their own right. Note the interaction with market hours: flows print against a US trading day, so they lag and compress around-the-clock crypto moves, and Monday’s number carries the weekend. And always carry the basis-trade caveat: the flow series measures shares created and destroyed perfectly, and measures investor belief only through that imperfect proxy.
Held together, the mechanics justify a conclusion stronger than the usual disclaimers: the spot ETF is the most consequential piece of market structure crypto has ever imported, precisely because its plumbing converts distant, regulated, advised capital into spot demand and supply with industrial efficiency and daily disclosure. It made the asset class legible to the largest pools of money on earth, and it made those pools’ behavior legible to everyone else, a two-way window that did not exist before 2024. The machine is neutral; June proved it pumps out as efficiently as it pumps in. Understanding the loop, APs, units, NAV, in-kind, basis, is what separates reading the window from being read through it.
One forward note completes the manual: the machine described here is still being extended. In-kind creation is arriving, staking-enabled funds have begun passing yield through the wrapper, options markets on the ETFs have layered a derivatives complex on top of the flow machine, and the same creation-redemption architecture is being fitted to additional assets as the regulatory perimeter settles. Each extension changes the reading of the flow data slightly, staking funds attract different holders than pure price trackers, options hedging generates mechanical creations and redemptions of its own, and the professional habit is to re-learn the machine’s output as its parts change. What does not change is the core: an arbitrage loop, run by profit-seeking intermediaries, converting the world’s brokerage demand into spot transactions, in public, every day. Crypto spent a decade fighting for that machine, and understanding it is the closest thing the asset class offers to reading its own pulse.
The reader’s bookmark list, finally, is short: each issuer’s daily holdings and flow disclosures, the aggregated flow dashboards the market quotes, the funds’ premium-discount trackers, and the custodian wallet monitors that let anyone verify the coins on-chain. Fifteen minutes a week across those four sources reproduces everything in this guide with live numbers, and turns the most quoted data series in crypto from a headline you consume into a machine you can actually read.
A last piece of perspective for scale: the creation-redemption machine described here is not a crypto invention but a thirty-year-old piece of market technology, refined across equity and bond ETFs holding trillions, and its arrival in crypto was less an experiment than a transplant of proven plumbing into a new asset. That pedigree is why it worked immediately at record scale, and it is also the quiet reassurance inside the daily drama of the flow numbers: whatever the coins do, the machine that wraps them has been stress-tested by every market crisis since the 1990s, and it has never been the thing that broke.
Disclaimer: This article is for educational purposes only and does not constitute investment advice. Digital asset markets are volatile and you can lose your entire investment. Structural details are current as of July 9, 2026, and may change. Always do your own research.
Frequently asked questions
How does a spot crypto ETF work in simple terms?
The fund holds real coins in institutional custody and issues shares that trade on a stock exchange, with each share representing a fraction of the coin pile. Large trading firms called authorized participants create new shares by delivering coins or cash to the fund, and destroy shares by redeeming them for coins or cash, an arbitrage loop that keeps the share price tracking the coin price within tiny margins.
What is an authorized participant?
An authorized participant, or AP, is a large financial firm with an agreement to create and redeem ETF shares in bulk blocks called creation units. APs arbitrage gaps between the ETF’s market price and the value of its holdings: buying coins and minting shares when the ETF trades rich, redeeming shares for coins when it trades cheap. Their profit motive is the mechanism that keeps the ETF honest.
Why do ETF flows move the crypto market?
Because flows are real spot transactions. A net inflow means authorized participants bought actual coins to create new shares; a net outflow means coins were sold to fund redemptions. Unlike sentiment indicators, the flow data measures coins genuinely changing hands, which is why sustained flow trends have become one of the most powerful forces in crypto price formation.
What is the difference between in-kind and cash creation?
In-kind creation swaps coins directly for shares, with the fund never trading; cash creation has the AP deliver dollars, which the fund’s own desk uses to buy coins. In-kind is mechanically cleaner and more tax-efficient, and it is the standard across ETFs generally; US spot crypto funds launched cash-only for regulatory reasons, with the industry since moving toward in-kind.
Can a spot ETF trade at a premium or discount?
Briefly and slightly, yes, especially at market opens after the coins moved overnight, but arbitrage closes gaps within minutes in normal conditions. Persistent premiums or discounts are rare and diagnostic: they signal that the creation-redemption loop is stressed, which historically has been a warning sign worth taking seriously. This tight tracking is the key difference from closed-end trusts and treasury stocks, which can drift far from their holdings’ value.
Do ETF outflows always mean investors are bearish?
No. A significant share of ETF positions belongs to basis traders holding shares against short futures to harvest the spread, and when that spread compresses, they redeem mechanically with no market view. Headline outflows therefore mix genuine de-risking with carry-trade plumbing, which is why flow trends matter more than single prints and why context from funding and futures data helps.
Where are the ETF’s coins actually kept?
With qualified institutional custodians, in segregated cold-storage wallets whose addresses on-chain analysts track publicly. The holdings are disclosed daily by the funds and independently observable on the blockchain, making spot crypto ETFs among the most transparent pooled investment vehicles in existence.
Is buying the ETF the same as buying the coin?
Economically it is very close: the tracking is tight and the convenience is real. The differences are structural: ETF investors hold shares, not coins, cannot self-custody or use the assets on-chain, trade only during market hours, pay an annual management fee, and rely on the fund’s custody arrangements. For brokerage-account exposure those trade-offs are usually acceptable; for crypto-native uses they are disqualifying.

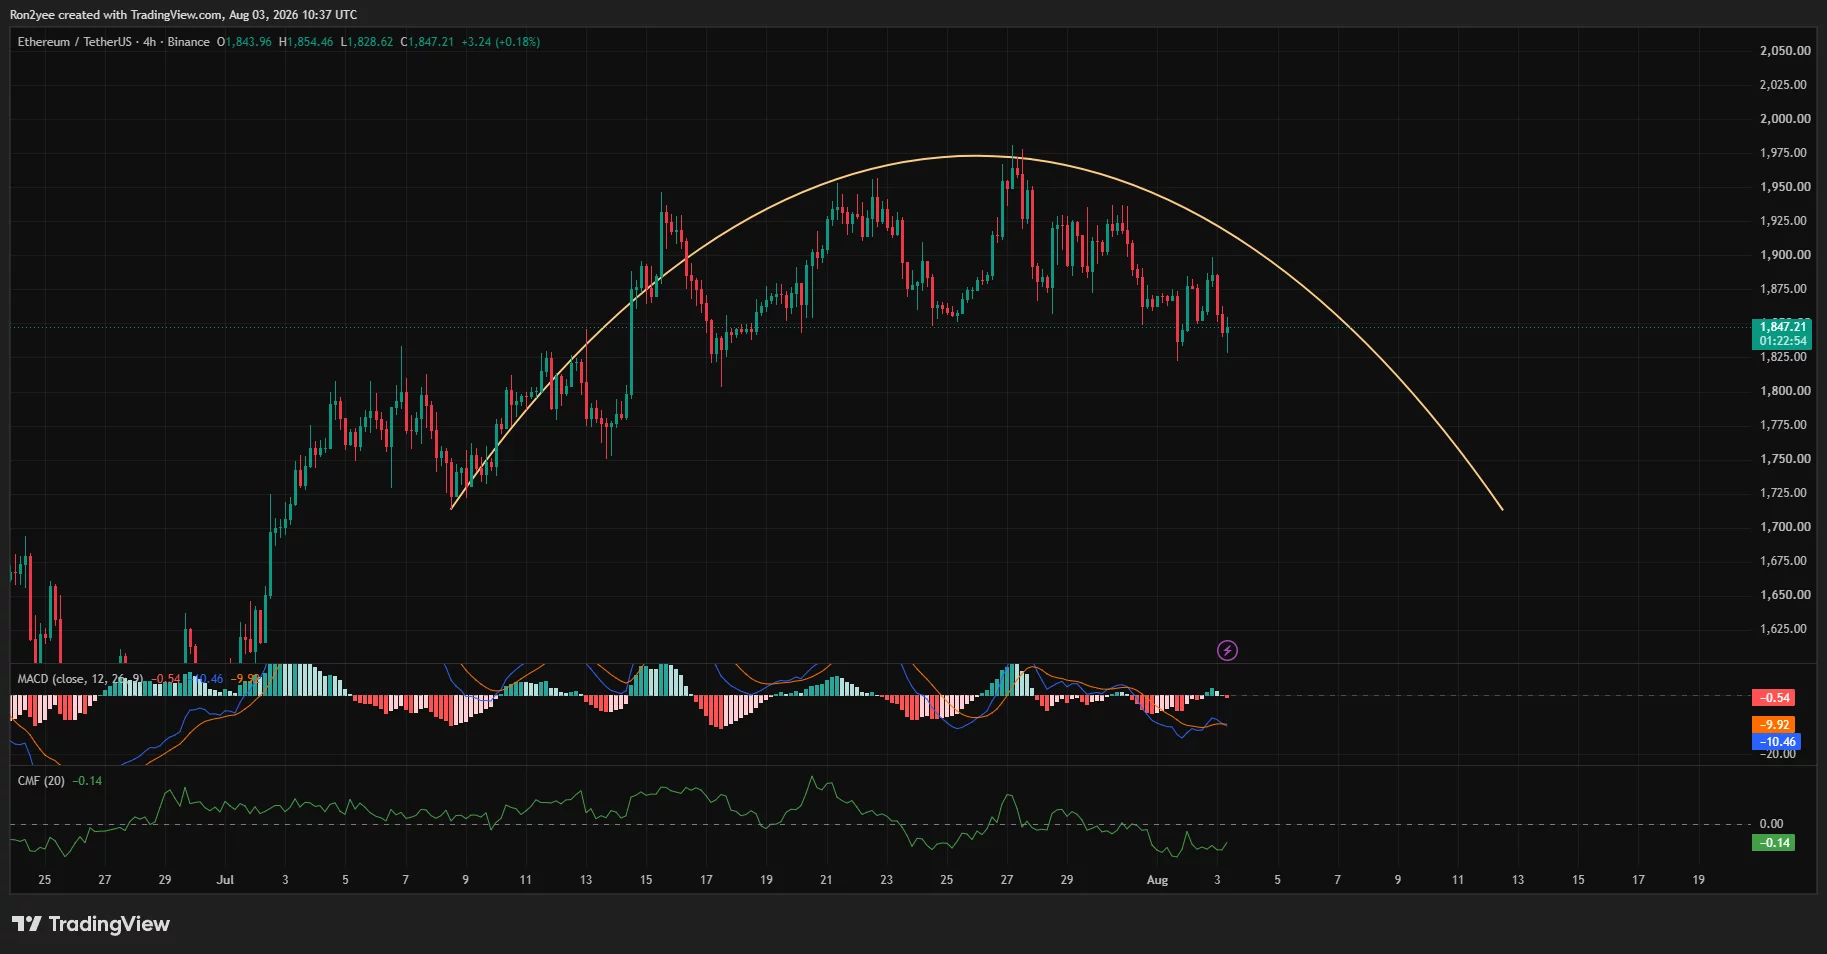
Ethereum price fell 2% to around $1,847 on Aug. 3 after another rejection near key moving averages left the $1,800 support zone exposed.
Summary
- Ethereum price fell 2.04%, reaching an intraday low of $1,828.
- ETH remains below its 50-day and 100-day moving averages at $1,889 and $1,927.
- 4-hour MACD and Chaikin Money Flow readings show weak momentum and continued selling pressure.
- A break below $1,800 could bring $1,785 and $1,700 into focus.
ETH slides after failing to reclaim $1,900
According to data from crypto.news, Ethereum (ETH) price traded at $1,847 at the time of writing, down 2.04% over the previous 24 hours. The token moved between an intraday high of $1,886 and a low of $1,829 on Binance.
The decline extended ETH’s retreat from its July 27 high near $1,975. Buyers have now failed several times to sustain a move above the resistance zone between $1,950 and $1,975.
ETH briefly rebounded after touching $1,828, but the recovery stalled around $1,850. That left the token near the lower end of its recent trading range and inside the closely watched $1,800–$1,850 support area.
The broader daily structure also remains defensive. Ethereum trades below its 50-day simple moving average at $1,889, its 100-day SMA at $1,927, and its 200-day SMA at $2,089.
Weak liquidity deepens Ethereum’s sell-off
The immediate pressure came from Ethereum’s failure to reclaim the moving-average resistance between $1,889 and $1,927. Sellers entered after the latest attempt faded, pushing ETH below $1,850 and toward its Aug. 3 low.
The 4-hour chart shows the price rolling over after forming a broad curved top below $1,975. Lower highs since late July suggest that buying demand has weakened, although ETH must still break below $1,800 to confirm a larger bearish continuation.
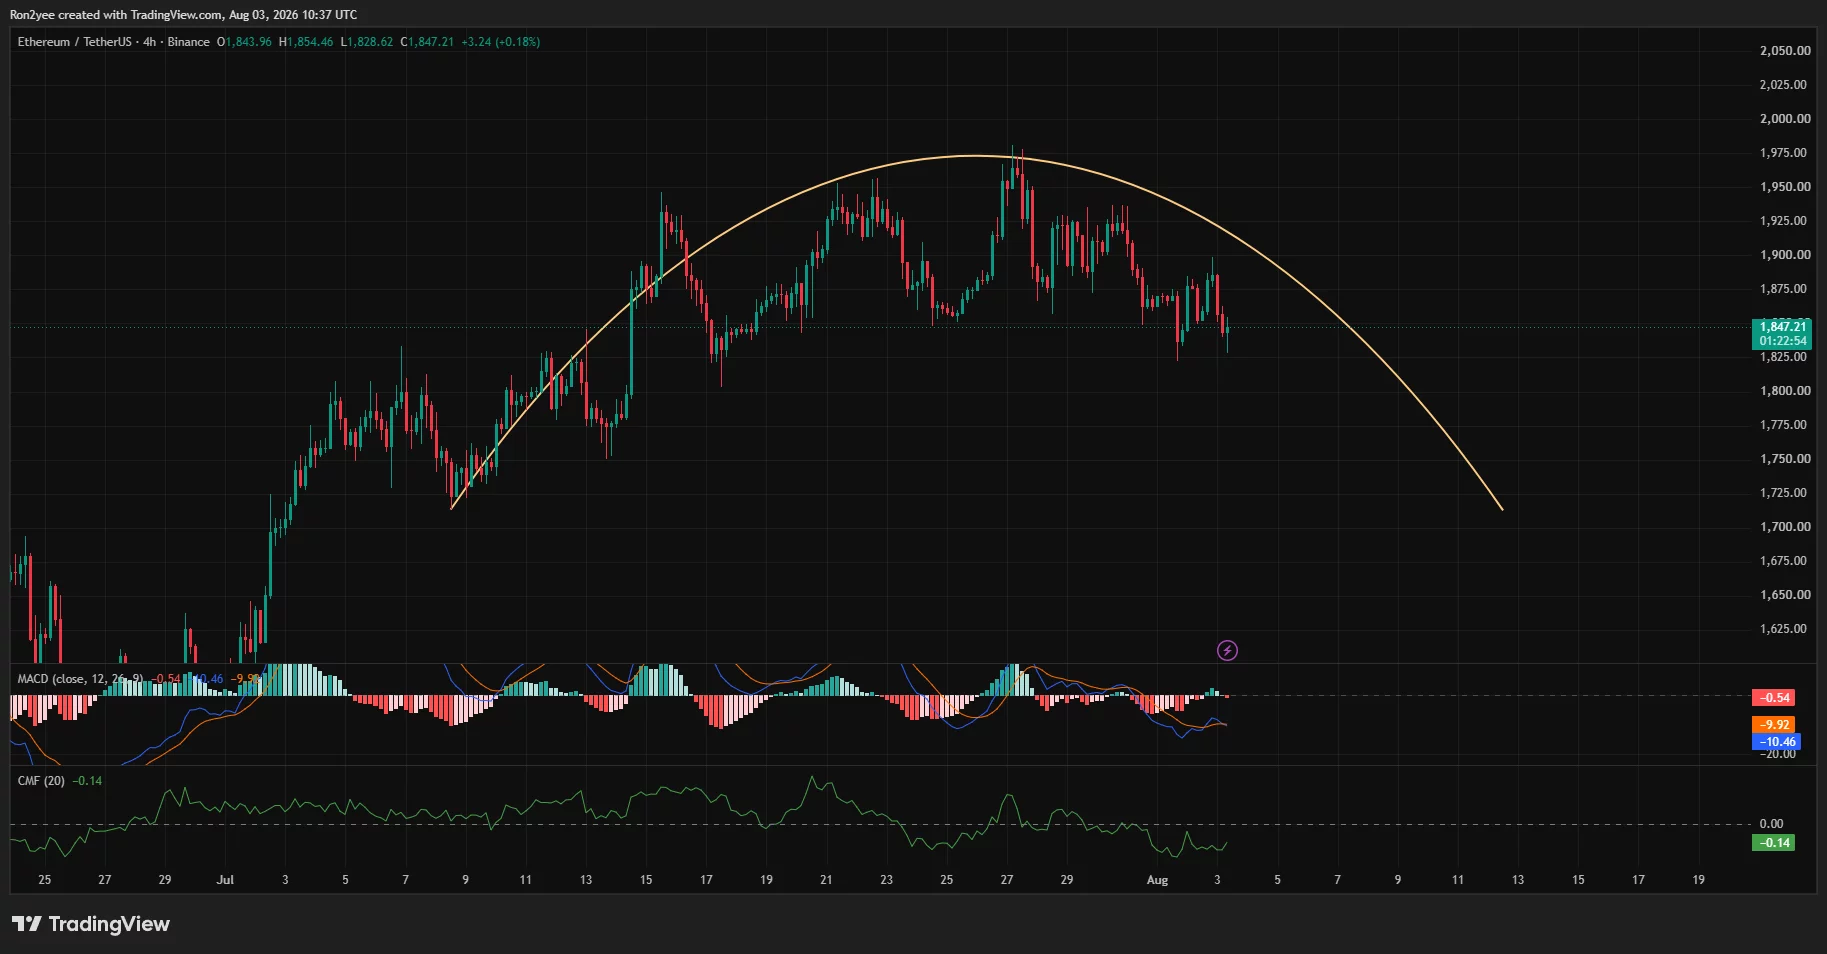
Momentum indicators support the cautious outlook. The 4-hour Moving Average Convergence Divergence remains below zero, with the MACD line near -10.46 and the signal line at about -9.92.
Chaikin Money Flow stands at -0.14. The negative reading indicates that selling volume has outweighed buying volume over the indicator’s measurement period.
Ethereum also faces broader liquidity pressure. A sharp weekly decline in Binance stablecoin netflows suggests less immediately available capital is entering the exchange, potentially reducing the buy-side liquidity available during market declines. However, exchange flows can change quickly and do not determine price direction alone.
Longer-term concerns include weaker institutional demand for Ethereum products relative to Bitcoin and lower mainnet fee revenue as activity shifts toward Layer-2 networks. These factors have weakened Ethereum’s investment narrative, but the current move remains primarily tied to the chart rejection and wider risk-off positioning.
Losing $1,800 could expose ETH to $1,700
The first support range sits between $1,828 and $1,800. ETH has already attracted buyers near the upper part of that zone, but repeated tests could weaken the remaining demand.
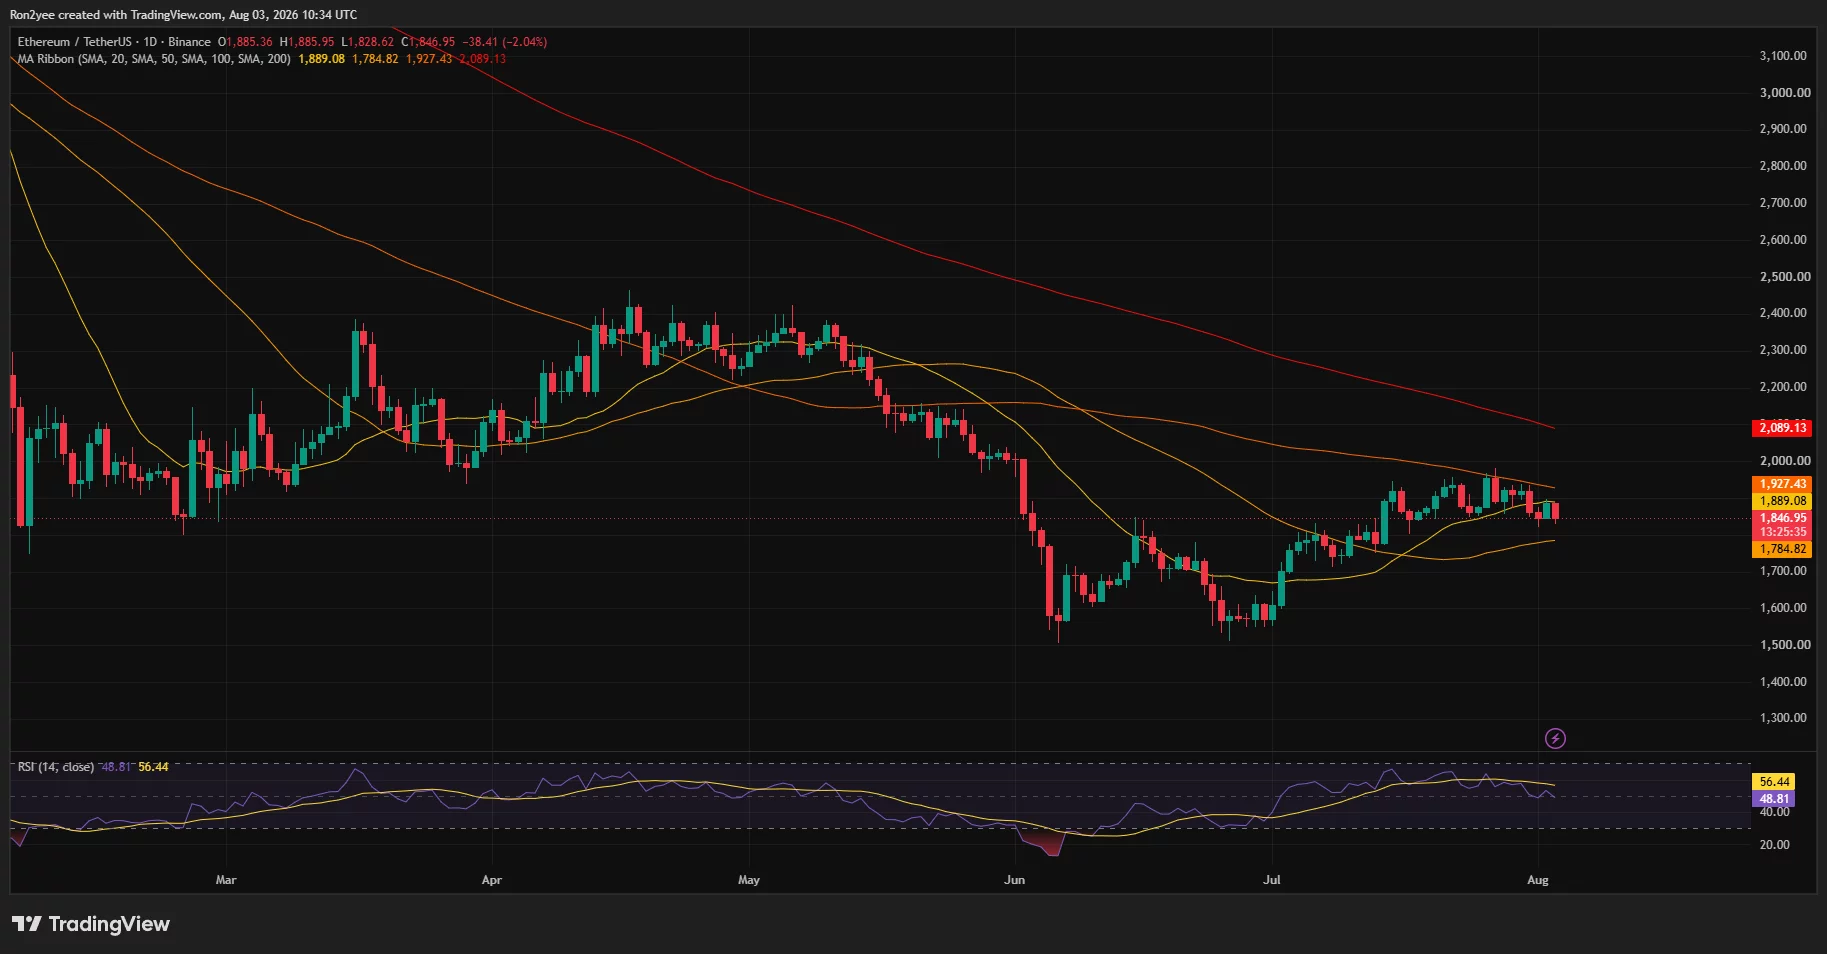
Ethereum’s lower daily moving-average ribbon stands near $1,785. A daily close below that level would strengthen the bearish setup and expose $1,700, followed by the June accumulation region around $1,550–$1,600.
CoinGlass’ 24-hour liquidation heatmap shows nearby leveraged-position clusters around $1,840, $1,820 and $1,810. A move through those levels could liquidate leveraged long positions and accelerate short-term volatility.
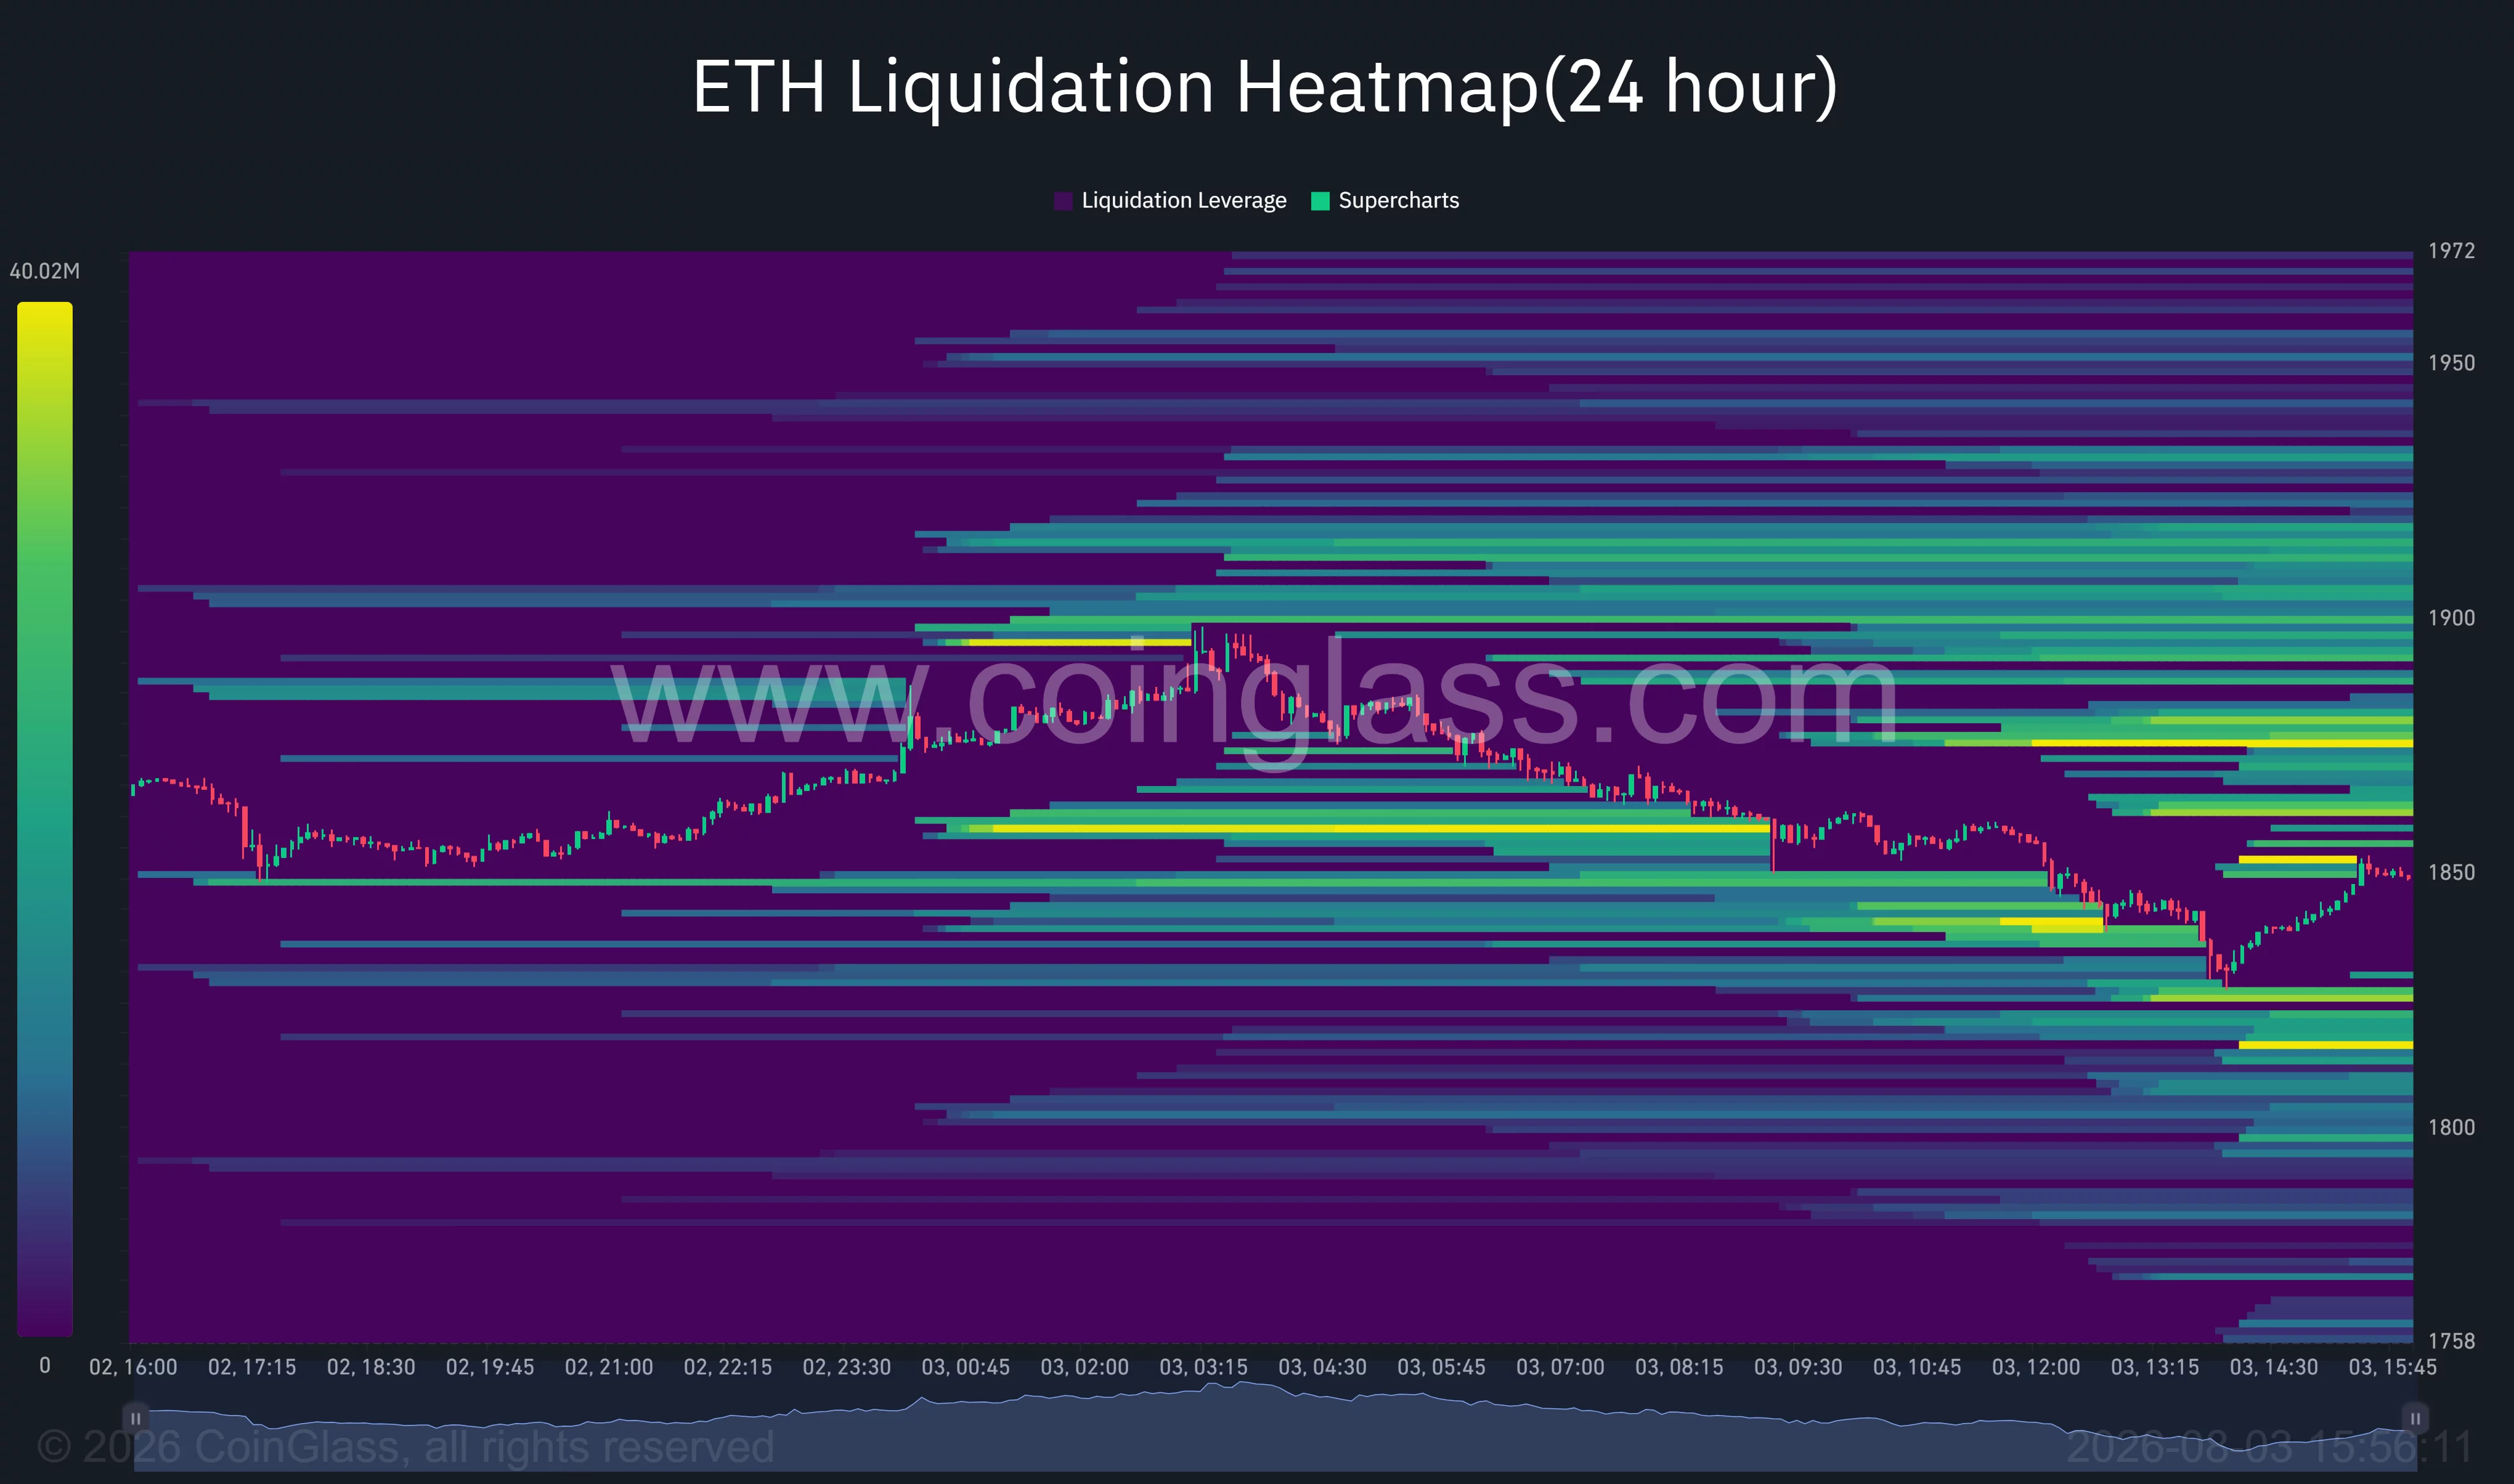
The map also shows overhead liquidity around $1,860–$1,875. If ETH rebounds above that range, short liquidations could help drive the price toward $1,890 and $1,920.
On the upside, Ethereum must first reclaim its 50-day SMA at $1,889. A daily close above the 100-day SMA at $1,927 would improve the setup, while a breakout above $1,975 would invalidate the current sequence of lower highs and place $2,000 back in focus.
The daily Relative Strength Index stands at 48.81, below its signal average of 56.44. The reading points to weakening momentum but remains well above oversold territory, leaving room for further selling if $1,800 fails.
Analyst sees Ethereum at a critical support zone
Crypto analyst Ted Pillows described the current support range as decisive for Ethereum’s next move.
“ETH is currently in the $1,800–$1,850 support level,” Pillows said. “This is very crucial for Ethereum to hold, or else it could drop towards $1,700.”
His chart presents two potential paths. Holding the current zone could allow ETH to recover toward $1,950 and then $2,050, while a confirmed breakdown could send the price toward $1,700.
The forecast aligns with the support levels visible on the daily chart, but the $1,700 target would require ETH to lose both the psychological $1,800 level and support near $1,785.
Fed outlook adds pressure on US crypto investors
Changing expectations for US monetary policy remain an additional risk for Ethereum and other speculative assets. Higher Treasury yields and a stronger dollar can reduce investor demand for crypto by increasing the relative appeal of dollar-denominated assets.
Slower-than-expected Federal Reserve rate cuts would keep financial conditions tighter and could limit institutional risk-taking. Ethereum may therefore remain sensitive to upcoming US inflation, employment and Fed policy signals.
For US investors, the near-term setup depends on whether ETH can defend $1,800 as macro liquidity remains constrained. A recovery above $1,927 would improve the technical outlook, but a daily close below $1,785 would shift attention toward $1,700.
Disclosure: This article does not represent investment advice. The content and materials featured on this page are for educational purposes only.
Solana price slipped below $73 on Aug. 3 as weak spot demand and sustained capital outflows raised the risk of a drop toward $70.
Summary
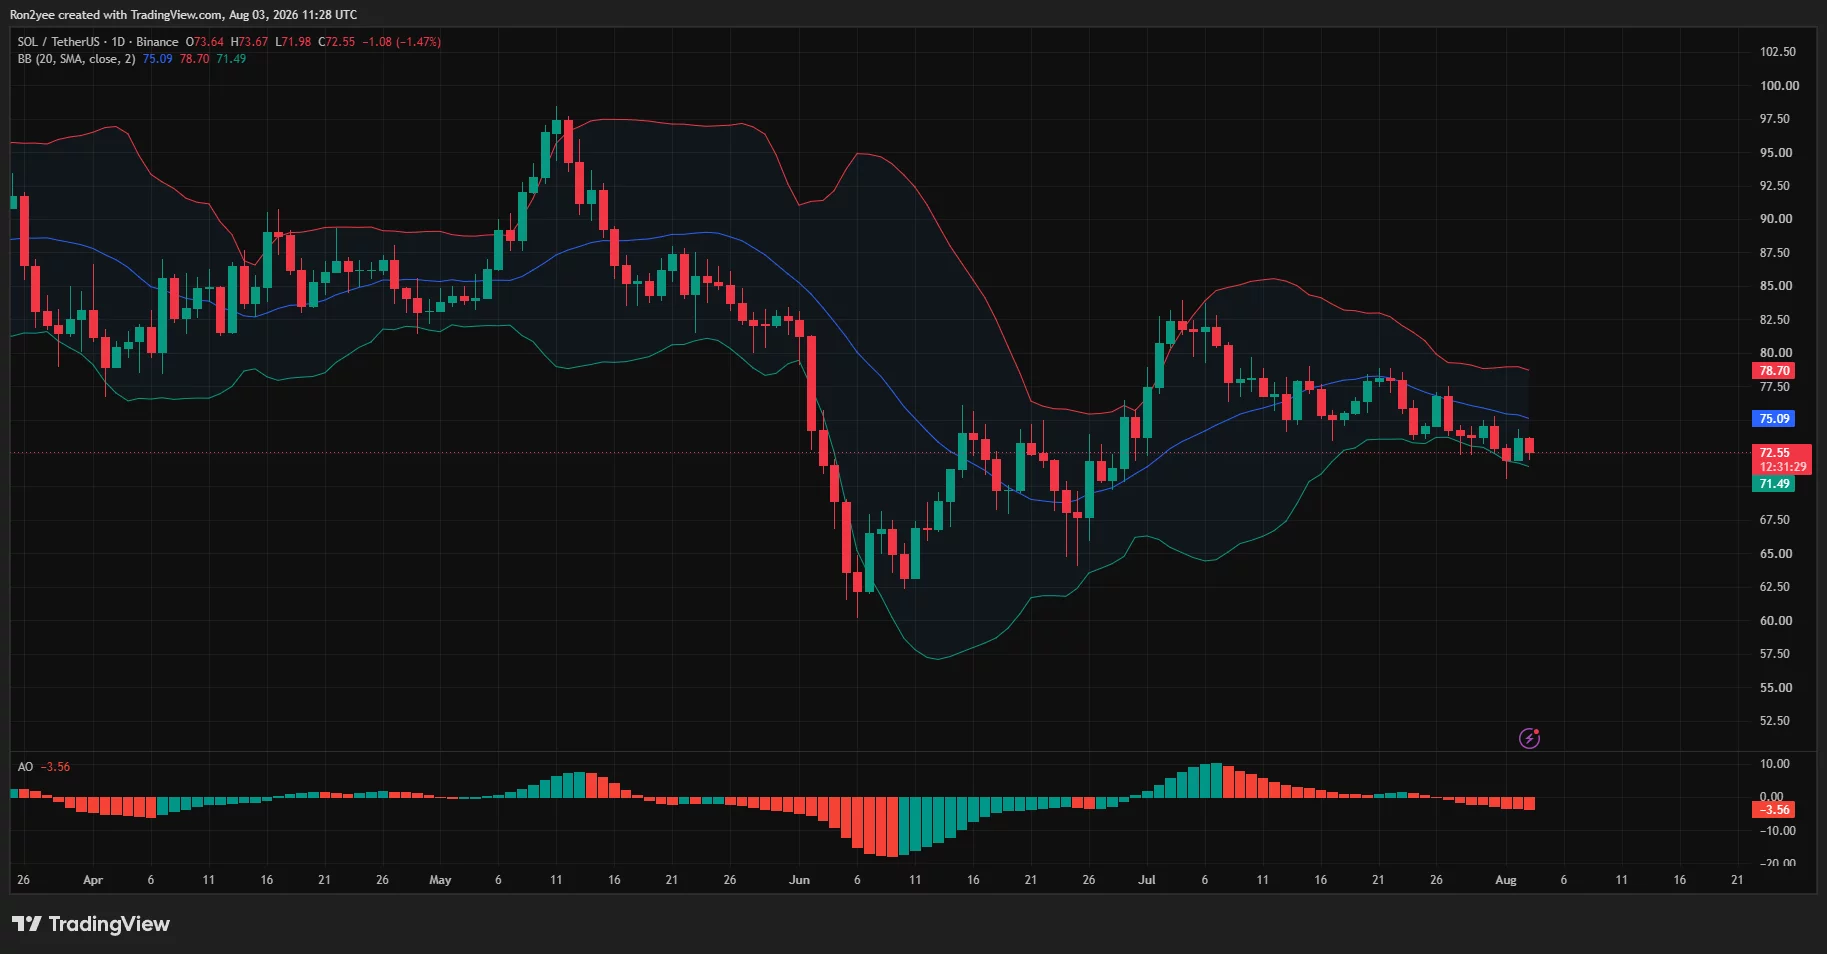
- Solana price fell 1.47% to $72.55, placing the token near its daily lower Bollinger Band.
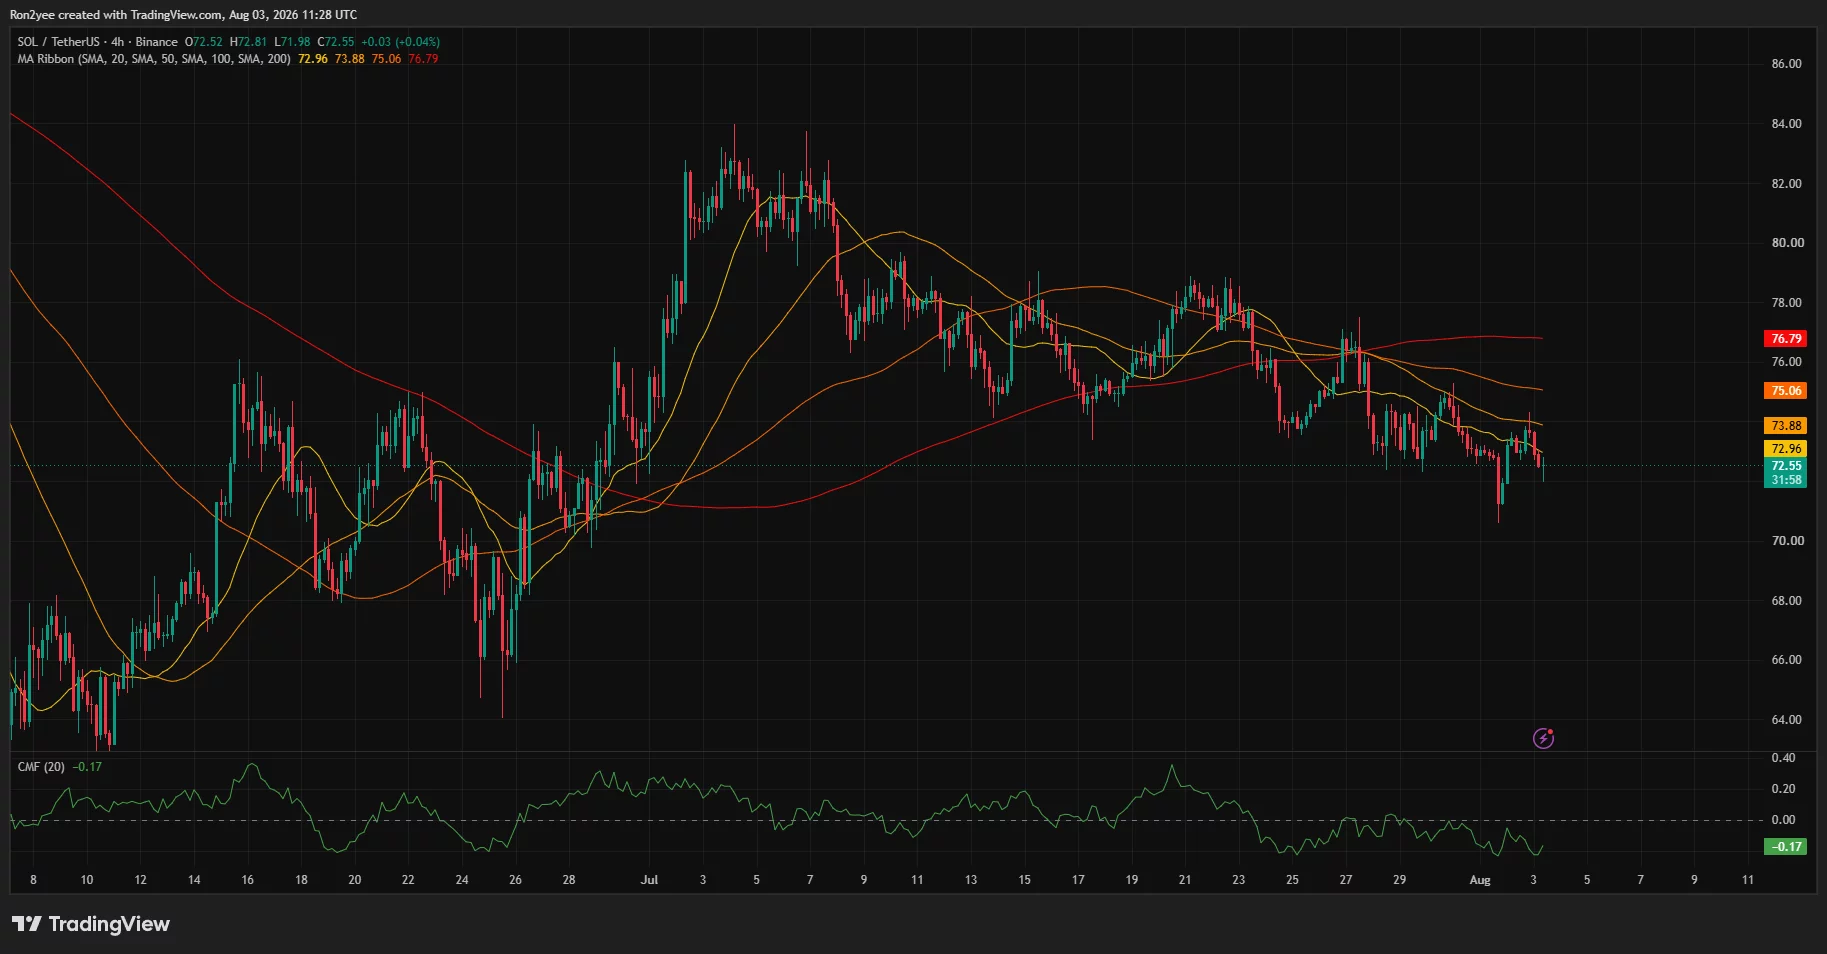
- The 4-hour chart shows SOL below all four tracked moving averages, with the 200-period SMA at $76.79.
- Chaikin Money Flow dropped to -0.17, indicating that selling pressure continued to outweigh buying demand.
- Liquidation liquidity is concentrated near $73.50–$74.50, making that zone the first major upside test.
Solana price extends its decline below $73
According to data from crypto.news, Solana (SOL) price traded at $72.55 on Aug. 3, down 1.47% on the daily chart after moving between an intraday high of $73.67 and a low of $71.98.
The decline extended a broader pullback from the July high near $82.50. SOL has formed a sequence of lower highs since that peak, with sellers defending rebounds around $78 and then $76.
Price has now fallen below the daily Bollinger Band midpoint at $75.09. This level previously acted as support but has turned into the first major resistance area.
SOL briefly moved below the lower Bollinger Band at $71.49 before recovering above $72. That reaction shows buyers remain active around $71.50–$72, but the limited rebound suggests they have not regained control.
The Awesome Oscillator stood at -3.56, with its red bars expanding below zero. That reading points to strengthening bearish momentum on the daily timeframe rather than an immediate trend reversal.
Flat spot demand weakens SOL’s recovery
Solana attempted to rebound after falling toward $71 on Aug. 2, but spot demand failed to recover alongside price.
Analyst Ted Pillows described the divergence as a sign of weakness.
“$SOL is bouncing back. But spot demand is flat. Sign of weakness.”
The 4-hour Chaikin Money Flow reading supports that view. CMF fell to -0.17, meaning more capital was leaving SOL than entering it during the measured period.
Declining spot participation can leave a rebound dependent on leveraged derivatives positions. Such moves are more vulnerable to reversals because they lack the direct buying pressure needed to absorb new selling.
The weakness also comes as activity tied to speculative Solana tokens cools from previous peaks. Lower decentralized exchange activity and weaker fee generation would reduce one source of demand for SOL, which traders need to pay network fees and interact with on-chain applications.
Four-hour indicators keep sellers in control
Solana remains below every major moving average displayed on the 4-hour chart. The 20-period SMA stands at $72.96, followed by the 50-period SMA at $73.88 and the 100-period SMA at $75.06.
The 200-period SMA, currently near $76.79, represents the strongest overhead technical barrier. SOL would need to reclaim that level to weaken the current sequence of lower highs.
The moving averages are also bearishly ordered, with each shorter-term average sitting below the longer-term measures. That structure suggests the decline is established across several trading horizons.
A move above $72.96 could open a retest of $73.88. The $73.88–$75.06 range is particularly important because it combines two moving averages with liquidity visible on the three-day liquidation heatmap.
Failure to reclaim that area would leave SOL exposed to another test of $71.50. A daily close below the lower Bollinger Band could bring $70 into focus, followed by the June support region near $67.50.
Liquidation clusters could increase volatility
CoinGlass’ three-day liquidation heatmap shows the largest nearby concentration of leveraged positions above the current price, particularly around $73.50–$74.
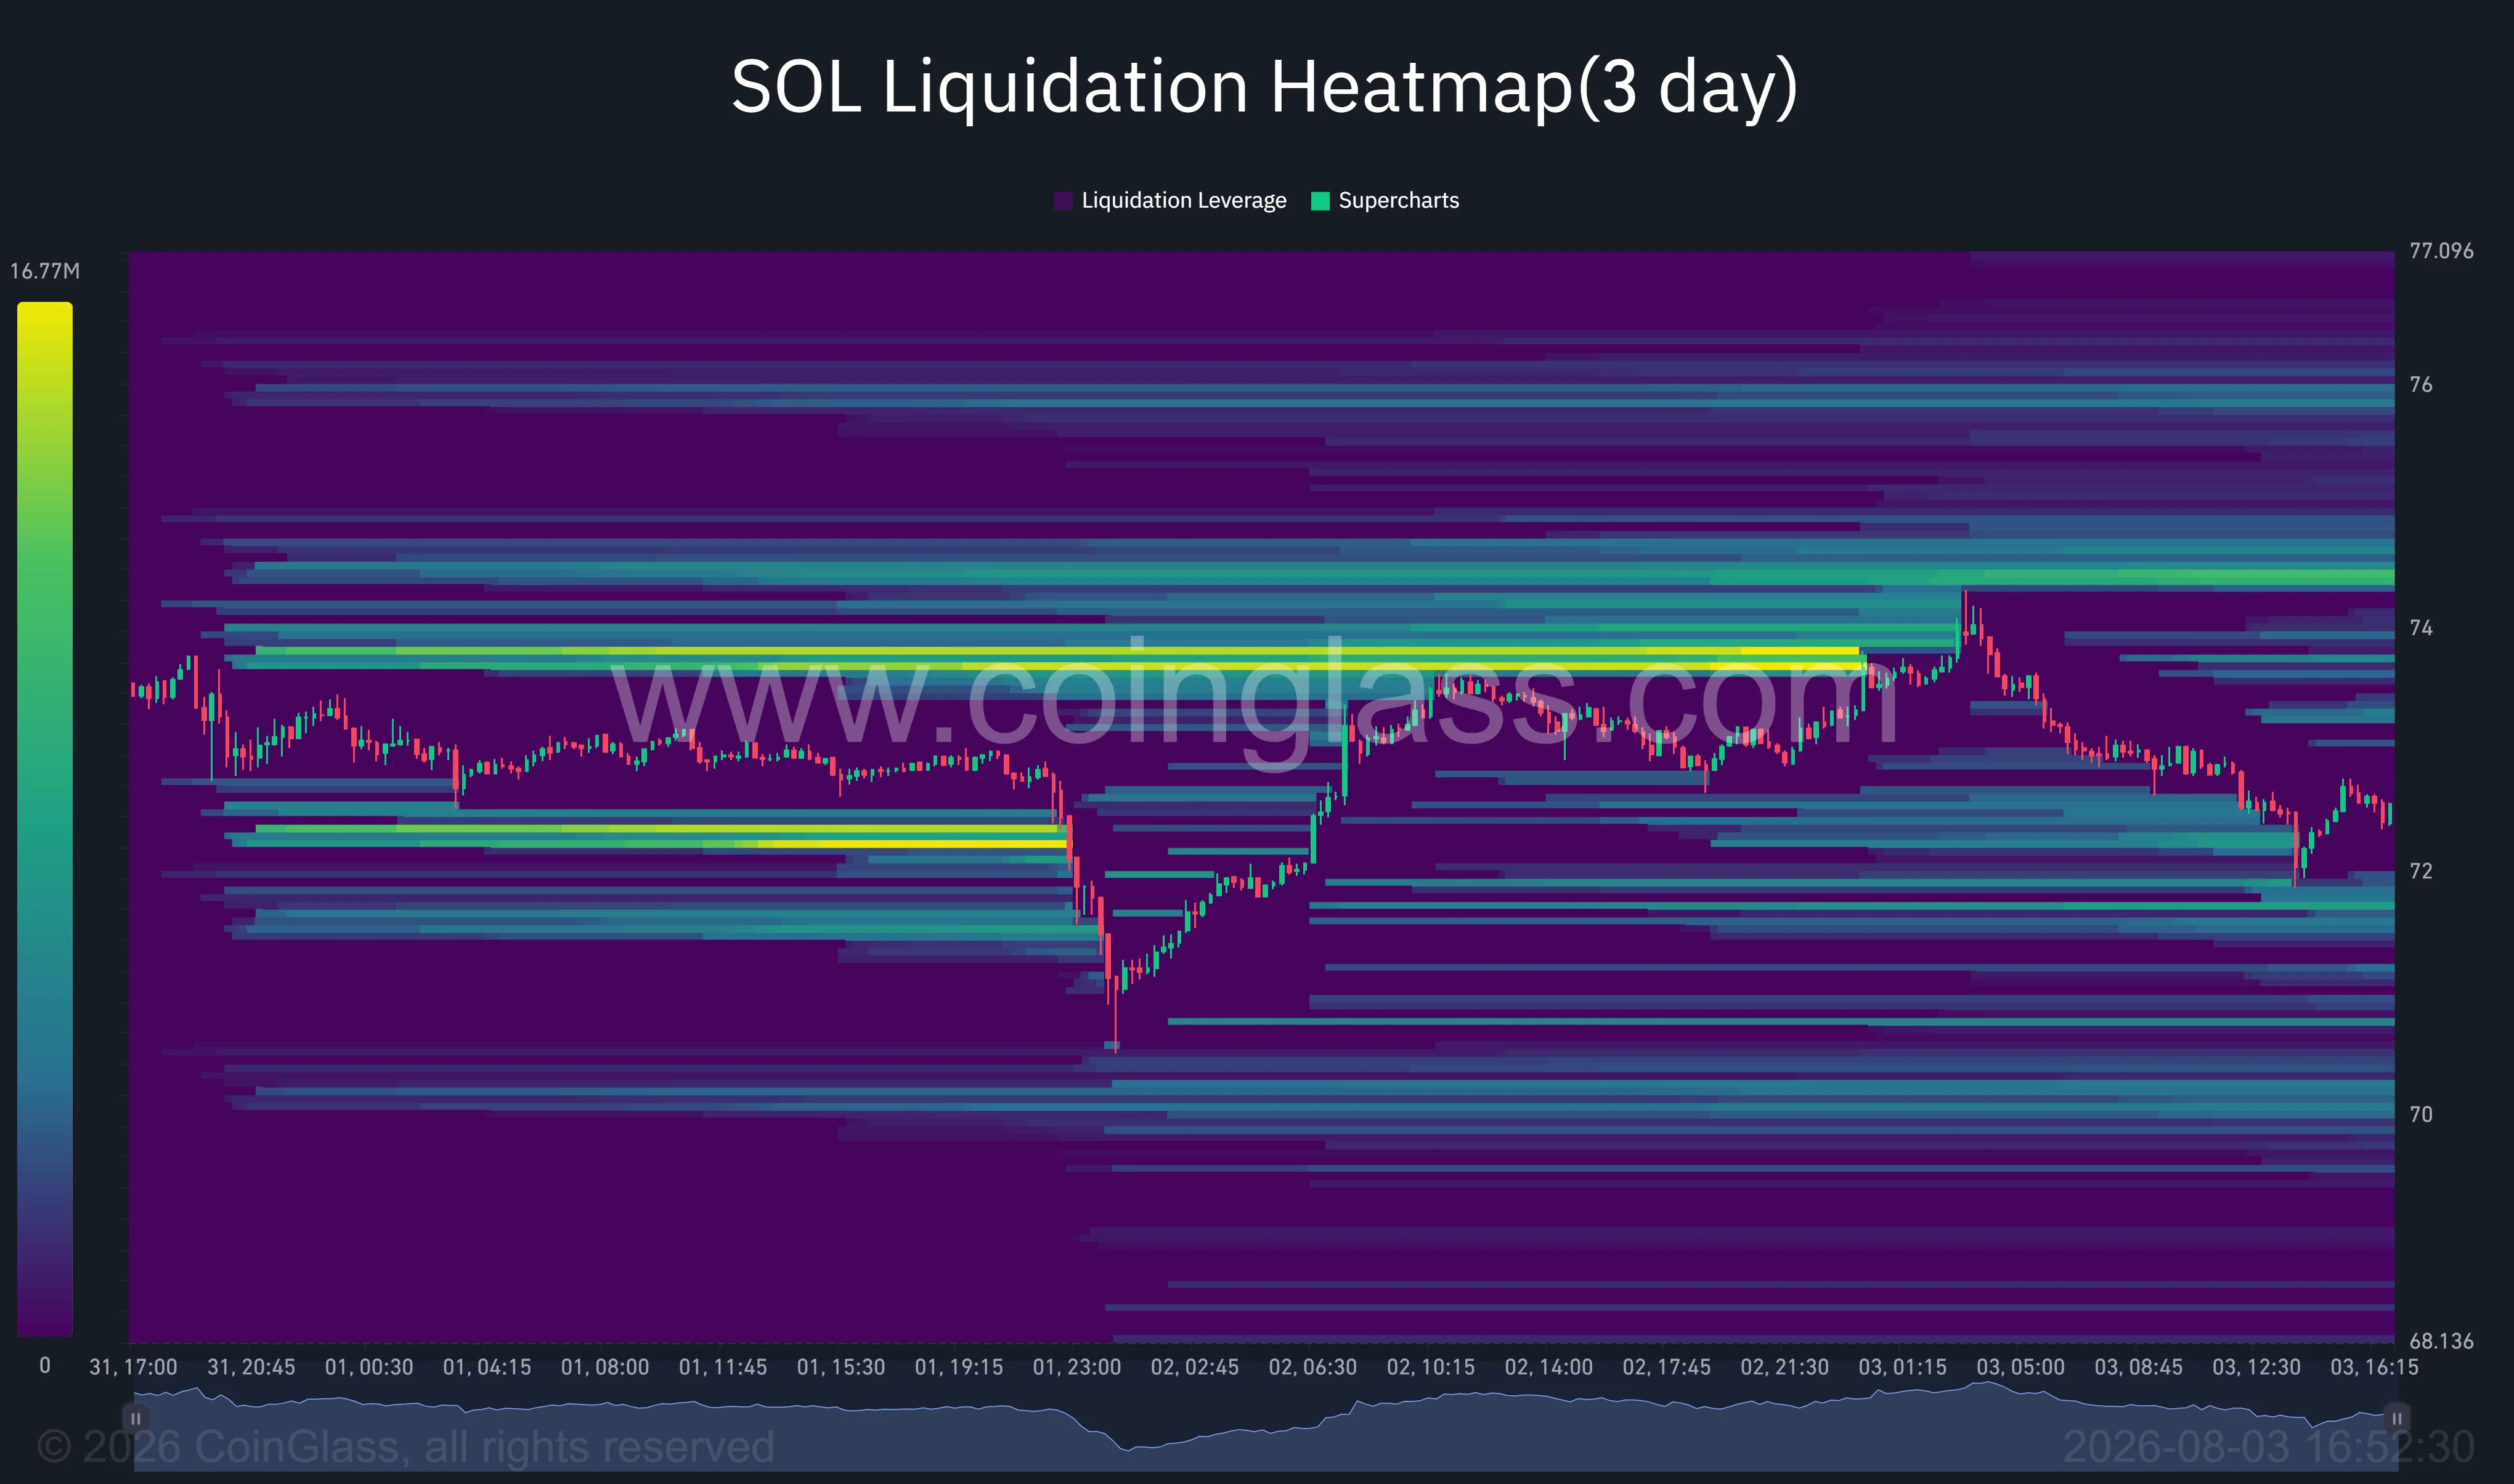
Additional liquidity appears near $74.50 and $76, creating potential targets if SOL begins a short-covering rebound. A move into these clusters could force bearish traders to close positions, accelerating the recovery.
However, liquidity also appears below the market around $71.50 and $70. These clusters could attract price if support near $72 fails.
This leaves SOL between competing liquidity zones. The closer upside concentration could produce a short-term bounce, but the weak CMF reading and bearish moving-average structure suggest any recovery must be confirmed by stronger spot buying.
Fee-burn vote offers Solana a potential catalyst
SolanaFloor reported that proposals addressing Solana’s fee burn and token disinflation were set to enter an initial vote on Aug. 3.
According to the report, the measures would double annual disinflation to 30%, remove about $1.36 billion in projected token issuance over six years and increase daily burns from roughly 650 SOL to 9,000 SOL.
Those figures remain projected outcomes rather than confirmed changes. The proposals must progress through governance before they can alter SOL’s supply dynamics.
For US investors, the immediate backdrop also remains tied to broader risk appetite. High-beta tokens such as SOL can face added pressure when elevated Treasury yields make lower-risk dollar assets more attractive. A shift in Federal Reserve expectations or US yields could therefore affect whether buyers return at the current support zone.
The short-term outlook remains bearish below $75.06. Reclaiming that level would improve the setup and expose $76.79, while a confirmed break below $71.49 would increase the risk of a move toward $70.
Disclosure: This article does not represent investment advice. The content and materials featured on this page are for educational purposes only.
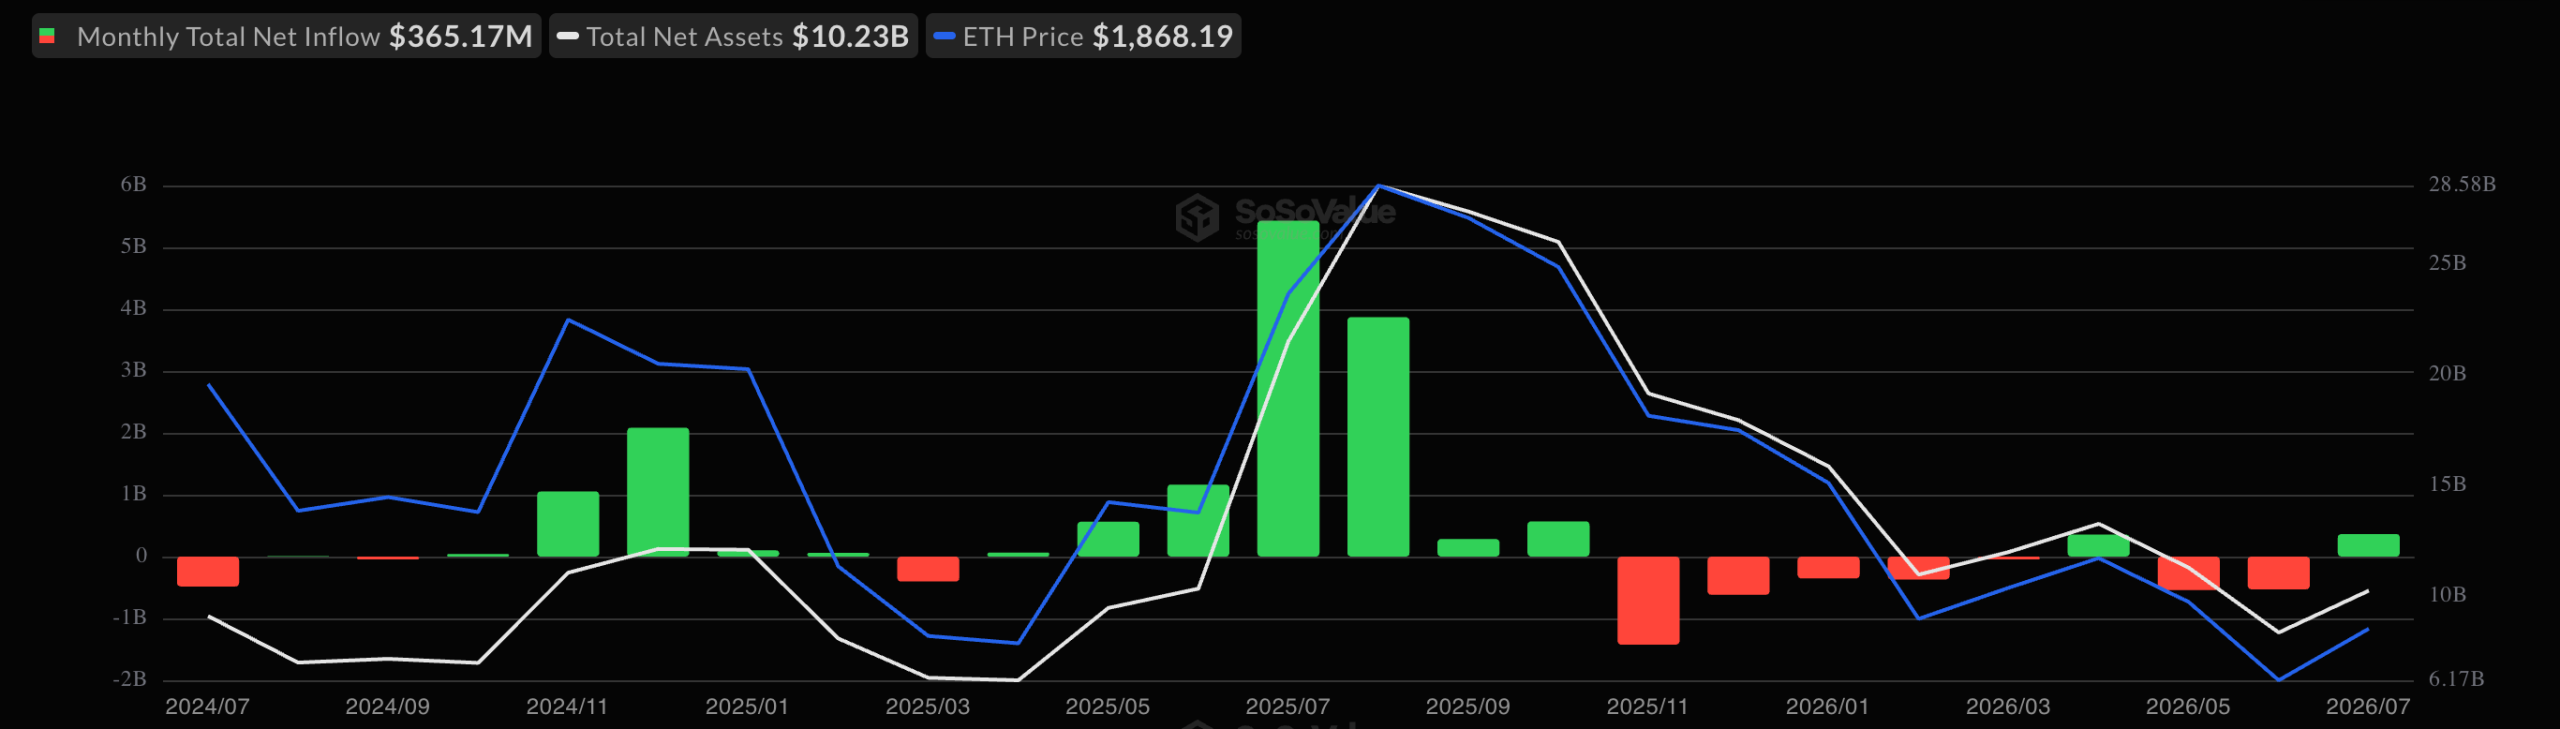
Ethereum (ETH) spot ETFs recorded their strongest month since October 2025. Yet the ending week of July raises concerns about whether institutional appetite is already fading.
Inflows dropped 74% in the final week as the Federal Reserve held rates steady. The pullback raises a key question over whether the demand will carry into August.
Ethereum ETF Inflows Hit 9-Month High Before Buyers Retreat
Ethereum funds attracted $365.17 million in July, their best showing in 9 months, per SoSoValue. The total came after back-to-back redemptions of $540.88 million in May and $528.99 million in June.
Follow us on X to get the latest news as it happens

The recovery lost steam fast, though. Weekly inflows collapsed from $103.9 million to $27.42 million in the week ending July 31.
Price action offered little help. ETH touched $1,967 on July 27, its highest level in nearly two months, before sliding to about $1,863 by Friday, CoinGecko data shows.
Demand also slowed across other ETF products. Bitcoin (BTC) funds shed $61.53 million during the week, snapping three straight weeks of net buying.
Hyperliquid (HYPE) products bled for a third consecutive week, losing $14.75 million. XRP (XRP) ETFs added $14.86 million, pushing cumulative inflows past $1.5 billion.
Fed Hold and Hike Odds Put August Demand in Question
Macro caution appears central to the retreat. The Federal Reserve voted 9-3 on July 29 to keep the interest rate at 3.50%-3.75%.
Three regional presidents, Beth Hammack, Neel Kashkari, and Lorie Logan, dissented in favor of a hike with inflation still above target. Markets now price in a 64% chance of a quarter-point hike in September, keeping tightening risk alive for risk assets.
“I want to stress, of course, that decisions by this committee matter a great deal, and where necessary and appropriate, we will not hesitate to act,” Fed Chair Kevin Warsh said.
If investors stay risk-off into August, the late-July slowdown may extend and erase the month’s progress. However, a revival in demand would confirm July’s rebound as the start of a broader recovery rather than a one-month bounce. The Fed’s Jackson Hole symposium in late August may offer the next signal.
Subscribe to our YouTube channel to watch leaders and journalists provide expert insights
The post Ethereum ETFs Post Best Month Since October 2025 but Fed Hold Chills Demand appeared first on BeInCrypto.
Strategy (MSTR) raised $104.73 million last week with the sale of 1,638 bitcoin, and raised an additional $290.6 million via the sale of common stock.
Alongside, the company repurchased 912,143 shares of its high-yielding preferred stock STRC for $81.2 million, according to an SEC filing Monday morning.
The bitcoin sales reduced Strategy’s holdings to 842,138 BTC, acquired for $63.51 billion at an average price of $75,419. The company lifted its USD reserve by $250 million.
The company announced over the weekend that it would maintain STRC’s annual dividend rate at 12%, saying it does not intend to recommend a reduction until the shares trade consistently near their stated $100 value.

In XRP news today, the XRP Ledger released xrpld 3.2.1 on July 31 after a validator manifest flood was detected hitting nodes that same day, with Ripple Director of Engineering Vijay Khanna issuing an urgent call on August 1–2 for all node operators to upgrade immediately.
The ledger continued closing normally throughout the incident, with no confirmed fund losses and no consensus failure, but unpatched nodes remain exposed to resource-exhaustion risk until operators complete the two-step upgrade process.
This news dropped as XRP USD fell 1.5% from $1.10 to $1.06 over the past 24 hours, with daily trading volume of $791M. This follows a worrying trend in which Ripple has crashed -4% over the past seven days.
XRP News: What the Manifest Flood Actually Did
The attack exploited a structural gap in how XRPL nodes handled validator manifests: before the patch, nodes would accept, cache, and rebroadcast an unlimited number of manifests tied to unknown validator keys with no ceiling on volume or storage.
An attacker could generate junk manifests at scale, forcing nodes to burn memory, disk space, and bandwidth processing data they would never act on.
The mechanism is closer to a denial-of-service resource drain than a consensus attack; the network’s transaction processing was never disrupted, but the exposure was real for any operator running unprotected infrastructure.
The development team confirmed the problem was specifically tied to how XRPLF nodes handled validator manifests, though as of publication the root cause and full exploitation details have not been publicly disclosed.
A technical post-mortem is forthcoming from XRPL Operations, which should clarify attacker behavior, traffic volumes, and any additional hardening steps.
For those tracking broader blockchain security vulnerabilities and attack vectors, the manifest flood fits a pattern where unbounded auxiliary data channels become leverage points even when consensus logic holds.
— Crypto Michael
 Urgent XRPL Update: Node Operators Told to Install Critical Fix
Ripple engineering director Vijay Khanna is urging XRP Ledger node operators to upgrade to **xrpld version 3.2.1**, which includes a hotfix designed to prevent a manifest flood attack observed on the network.…
 Dinarian888 (@Dinarian888) August 2, 2026
Discover: The Best Crypto to Diversify Your Portfolio
Four Safeguards Introduced in the Hotfix
The hotfix introduces four discrete protections targeting different points in the manifest handling pipeline. Oversized manifests are now rejected outright before full decoding. Incoming manifest batches per network message are capped.
The volume of manifest data shared with new peers is limited. And the unknown-key manifest cache is hard-capped at 100 entries, preventing unbounded growth from unrecognized validator identities.
Beyond those four caps, unknown validator manifests are no longer written to disk. That change means any pre-patch flood data is cleared on restart rather than persisting in storage, which is precisely why the upgrade requires a specific two-step sequence.
Firstly, install 3.2.1, let the server run for one to two minutes, then perform a second restart to purge any manifests retained from before the patch. Skipping the second restart leaves stale flood data in place. Operators should also verify their systems trust Ripple’s current GPG signing key, rotated February 18, 2026, or automatic upgrades may fail silently.
Trade XRP on Bybit and Get a Chance to Win Our $1,000 USDT Airdrop
Who Needs to Act and Why It Matters Now
—
 $XRP's momentum fades, but the bullish structure holds firm: price is drifting back into 6YR support that guided all breakouts since 2020 — each green-arrow marked previously triggered expansion; compression within a falling wedge is setting the stage for a major repricing
  pic.twitter.com/Es1Mae0poz
 ChartNerd
  (@ChartNerdTA) August 3, 2026
In other XRP news, exchanges, custodians, wallet back ends, data providers, and any business running its own XRPL server must complete the node upgrade. Ordinary XRP holders do not need to move funds or change keys.
The urgency is compounded by upgrade adoption lag: xrpld v3.2.0, the larger June 15 release that renamed the reference server and required infrastructure config change, spread faster among validators than across the broader node network, meaning a cohort of operators may still be running older versions that are now doubly exposed.
The network security response here was operationally sound: a targeted hotfix, clear operator instructions, and a pending post-mortem that signals the team is treating this as a formal security incident rather than routine maintenance.
In the broader XRP ecosystem, the incident comes as the ledger scales; the network added nearly 490,000 new accounts in the first half of 2026, per supplementary data from Coinpaper, pushing total accounts past 8.4 million.
That growth trajectory makes robust infrastructure hardening a structural necessity, not an edge-case concern. Institutional developments, including Aviva’s tokenized liquidity fund on XRPL and growing enterprise adoption, raise the stakes for any operator still delaying the patch.
Discover: The Best Token Presales
The post XRP News: xrpld 3.2.1 Hotfix Patches Manifest Flood Draining XRPL Node Resources appeared first on Cryptonews.


Trump-linked Bitcoin miner produced a record 932 BTC in the second quarter, lifting mining revenue 8% as its net loss narrowed from the previous quarter.


South Africa has proposed new rules requiring cross-border crypto transfers to pass through authorized providers and be reported to the central bank, expanding the country’s effort to bring digital assets under its financial control framework.
Summary
- South Africa has proposed rules requiring cross border crypto transfers to go through authorized service providers and be reported to the central bank.
- The draft says only transfers to offshore providers or private wallets would qualify as regulated cross border crypto transactions.
- Individuals would be allowed to move crypto offshore only within South Africa’s existing foreign currency allowances.
- The proposal builds on earlier plans to bring crypto under the country’s foreign exchange control framework.
- Public comments on the draft Crypto Asset Manual will remain open until Sept. 30.
According to local media, South Africa’s National Treasury and the South African Reserve Bank (SARB) on Monday released a draft Crypto Asset Manual setting out when crypto transactions become regulated cross-border events and how they must be handled. The proposal forms part of the country’s ongoing overhaul of its capital flow rules first introduced in April.
South Africa has defined when crypto transfers become reportable
Under the draft, moving crypto offshore will only qualify as a cross-border transaction in specific situations. A report to the SARB’s Financial Surveillance Department (FinSurv) would be required when crypto assets move from a locally authorized Crypto Asset Service Provider (CASP) to an offshore CASP or into a privately controlled non-custodial wallet.
The proposal says people who wish to transfer crypto abroad would have to use an authorized provider instead of sending assets directly through unregulated channels. FinSurv would receive reports of those transactions as part of the country’s foreign exchange monitoring process.
Domestic crypto activity would remain outside those reporting requirements. Buying or selling crypto in South African rand through a local authorized provider would not be treated as a cross-border event under the proposed framework.
For now, the draft allows only individuals to move crypto assets offshore, and only within South Africa’s existing foreign currency allowances. The SARB also said the framework does not recognize crypto assets as legal tender and currently does not distinguish between different categories of digital assets because additional research is still underway.
Interested parties can submit comments on the draft until Sept. 30.
Crypto rules build on South Africa’s earlier capital flow proposal
The new manual follows South Africa’s Draft Capital Flow Management Regulations released in April, which proposed bringing crypto assets into the country’s foreign exchange control system for the first time.
The National Treasury and SARB said in April that crypto assets would be treated as a form of capital moving across borders, placing them alongside other regulated assets under the country’s capital flow regime. The proposal was also designed to replace South Africa’s Exchange Control Regulations dating back to 1961 while aligning the country’s framework with recommendations from the Financial Action Task Force and the Organisation for Economic Co-operation and Development.
The April proposal introduced the concept of authorized crypto service providers, transaction reporting, declaration requirements and administrative penalties for non-compliance. Treasury officials said at the time the policy would focus on reporting, traceability and risk-based oversight instead of relying only on transaction-by-transaction approvals.
The draft Crypto Asset Manual now explains how those principles would work in practice by defining the point at which crypto movements become cross-border transactions that fall under financial surveillance rules.
Authorities have linked the framework to financial crime controls
According to Reuters, the reporting framework is intended to stop crypto assets from being used to bypass South Africa’s existing financial controls while helping authorities identify illicit financial flows.
By limiting offshore transfers to authorized service providers, regulators would receive transaction data through FinSurv instead of relying on transfers conducted outside the regulated financial system.
The proposal arrives as crypto adoption continues to grow in South Africa. Reuters, citing blockchain analytics firm Chainalysis, said the country already has hundreds of licensed virtual asset service providers, while several major banks are developing crypto products for institutional clients.
South Africa has become one of Africa’s largest digital asset markets in recent years. Earlier industry estimates placed annual crypto transaction value in the country among the highest on the continent, while blockchain investment has continued to attract institutional interest.
Crypto oversight has expanded beyond capital controls
The latest consultation follows another crypto policy proposal published in July by the South African Revenue Service (SARS), which released draft guidance explaining how existing tax laws apply to digital assets.
Unlike the latest capital flow proposal, the SARS draft focused on taxation rather than foreign exchange regulation. It confirmed that crypto assets are treated as intangible assets instead of legal tender or foreign currency under existing tax law and explained how income tax and capital gains tax could apply depending on each taxpayer’s circumstances.
The tax authority also outlined how activities including crypto trading, token swaps, staking, mining, decentralized finance participation and crypto payments may trigger taxable events under current legislation.
At the same time, South Africa has begun implementing the Crypto-Asset Reporting Framework (CARF), under which crypto service providers will collect and report selected customer and transaction information to SARS. The first reporting period runs from March 1, 2026, through Feb. 28, 2027.
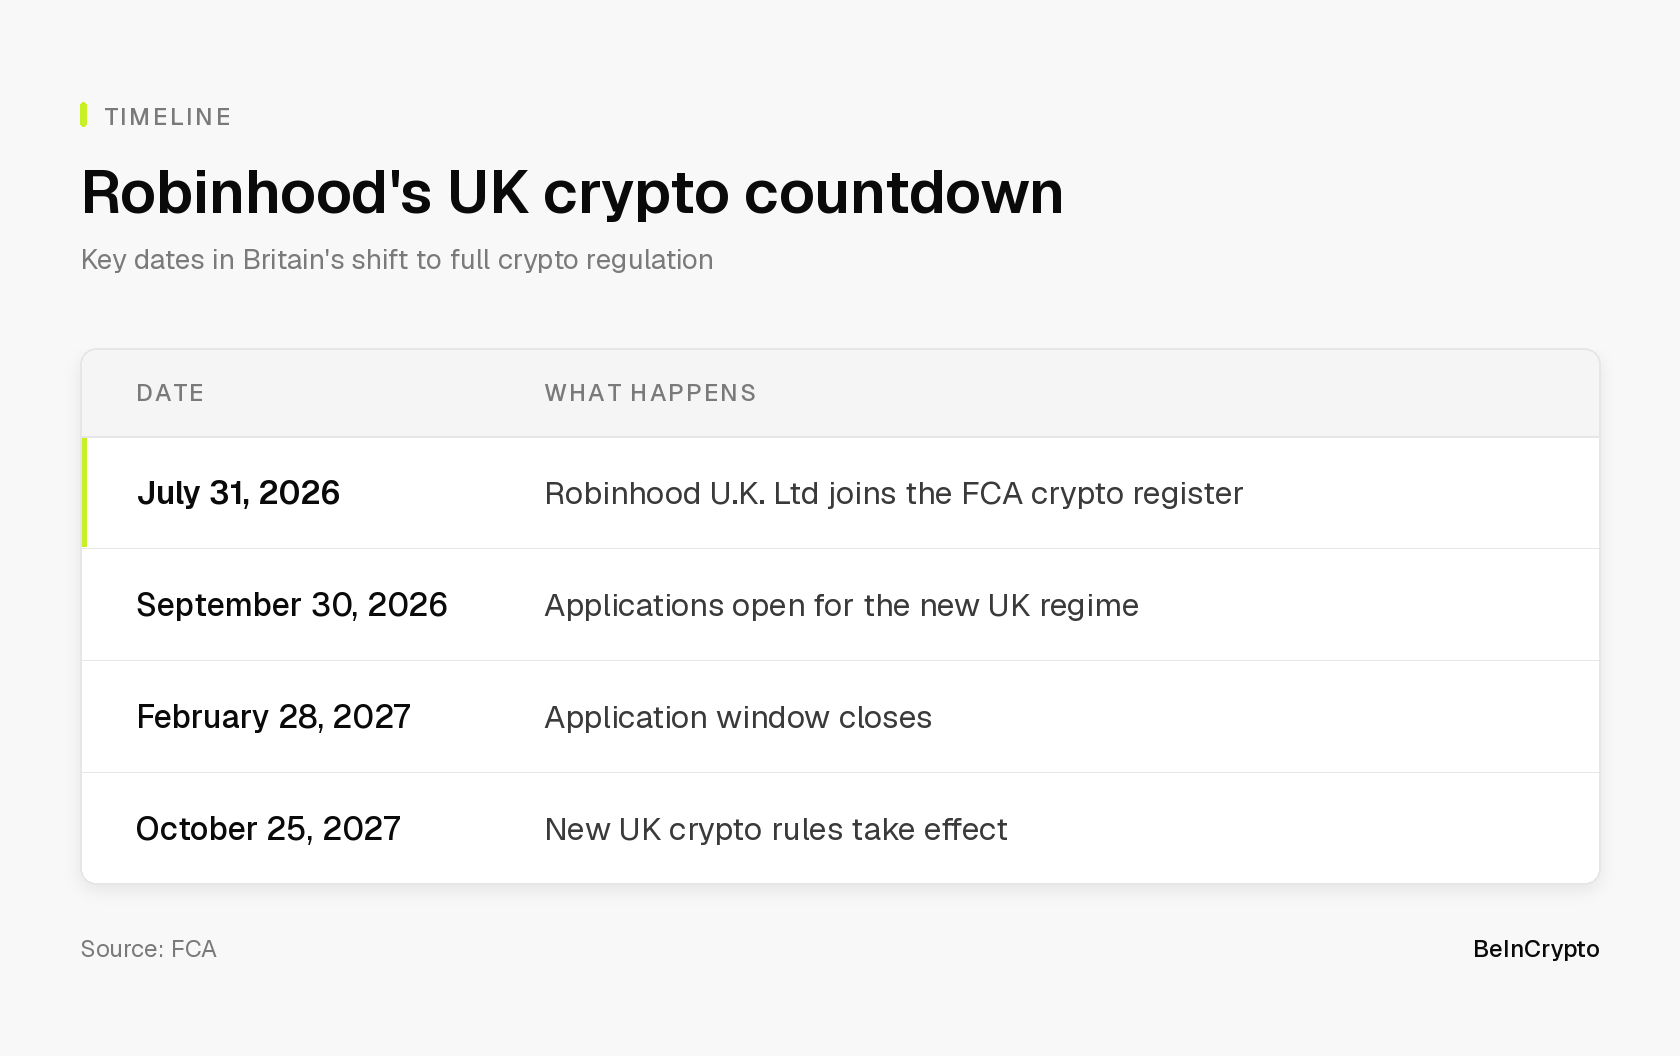
Robinhood Markets won UK crypto approval on July 31. The surprise is everything the approval does not allow.
The Financial Conduct Authority (FCA) added Robinhood U.K. Ltd to its crypto register. The company may pass customer orders to other firms. It cannot hold anyone’s coins.
What the FCA actually approved
Robinhood has been an FCA-approved stockbroker in Britain since August 2019. Crypto is new ground. The regulator added it to the crypto register on July 31, 2026.
Two limits took effect the same day, with the first one mattering most:
- Robinhood UK may only arrange crypto trades.
In plain terms, it takes your order and hands it to someone else to finish.
UK crypto rules cover two other jobs. One is running an exchange. The other is holding coins for customers. Robinhood got neither.
- The second limit bans crypto cash machines unless the FCA agrees in writing.
The register also says the firm cannot hold client money. Even this much is hard to win. FCA figures show 291 firms applied between January 2020 and October 2022. Only 38 made the register. Another 155 gave up before a decision.
One point matters for customers. Being on the register is not a safety net. The FCA warns that crypto services are unlikely to be protected if something goes wrong.
Britain’s compensation scheme rarely covers crypto losses. The financial ombudsman usually cannot help either.
Rivals Got There First, With More Freedom
Robinhood is late. The register opened in 2020.
Kraken’s UK arm, Coinbase, and Revolut are all on it. Several also hold e-money licences, which let them handle customer cash. Robinhood UK does not.
It already owns one company on the list. Bitstamp UK Ltd joined years earlier, and Robinhood bought its parent for $224 million in June 2025.
That makes Bitstamp the obvious place for UK orders to land.
Robinhood has also tried and failed here before. It agreed to buy British crypto app Ziglu in April 2022. Ten months later it walked away. The $12 million it had already sent Ziglu was written off.
So the new approval looks like housekeeping rather than a launch. Robinhood told investors in July it plans to start UK crypto soon.
Its own small print still says UK customers get no crypto trading or custody. Elsewhere the company keeps building, including its Robinhood Chain public testnet.
Why October 2027 Decides What Survives
This approval is temporary. Tougher UK crypto rules start on October 25, 2027.
Every firm on today’s register must apply again. Nothing carries over.

The window is five months long. Firms that miss it must stop most crypto work. The FCA has warned that today’s registration counts for nothing at that stage.
That deadline has driven Britain’s crypto policy debate all year, alongside UK stablecoin payment plans.
For investors, any reward is years away. Crypto revenue fell 38% to $100 million in Robinhood’s second quarter. Total revenue still hit a record $1.31 billion.
The market shrugged on Monday. HOOD closed Friday at $86.56, then traded at $87.22 before the bell, up 0.76%. Its 52-week high is $153.86.

The real test comes with that 2027 application. Robinhood sells trading, custody, and staking across Europe. An arranging license supports none of it.
What the company asks for will show how serious it is about Britain.
The post Robinhood Cleared for UK Crypto, But There Are Major Limits appeared first on BeInCrypto.
Crypto World
Solo Bitcoin (BTC) miner nets $200,000 as Coldcard wallet hack rocks sentiment: Crypto Daily


A solo miner scored a major win even as the broader market frets over a multimillion-dollar Coldcard hardware wallet exploit.
According to mempool data, an independent miner successfully packaged block 960,804 early Monday. The block reward of 3.157 BTC is valued at approximately $199,300. Details on the specific hardware used remain unknown.
The success came just three weeks after another solo miner, running a single hobbyist-grade Bitaxe device, struck block 957,382, pocketing 3.1382 BTC, worth roughly $200,000 at the time.
These back-to-back wins highlight a broader trend. Solo miners have already claimed 13 blocks this year. While individual operators continue to defy the odds with relatively modest setups, the wider Bitcoin mining sector has come under stress due to tight margins. That has prompted several large mining companies to pivot toward artificial intelligence data centers and related infrastructure in search of sustainability.
Meanwhile, small BTC holders continue to express frustration over the Coldcard incident, which has led to the loss of long-held Bitcoin savings. Over the weekend, onchain data showed signs of some BTC holders moving millions of dollars worth of coins to exchanges.
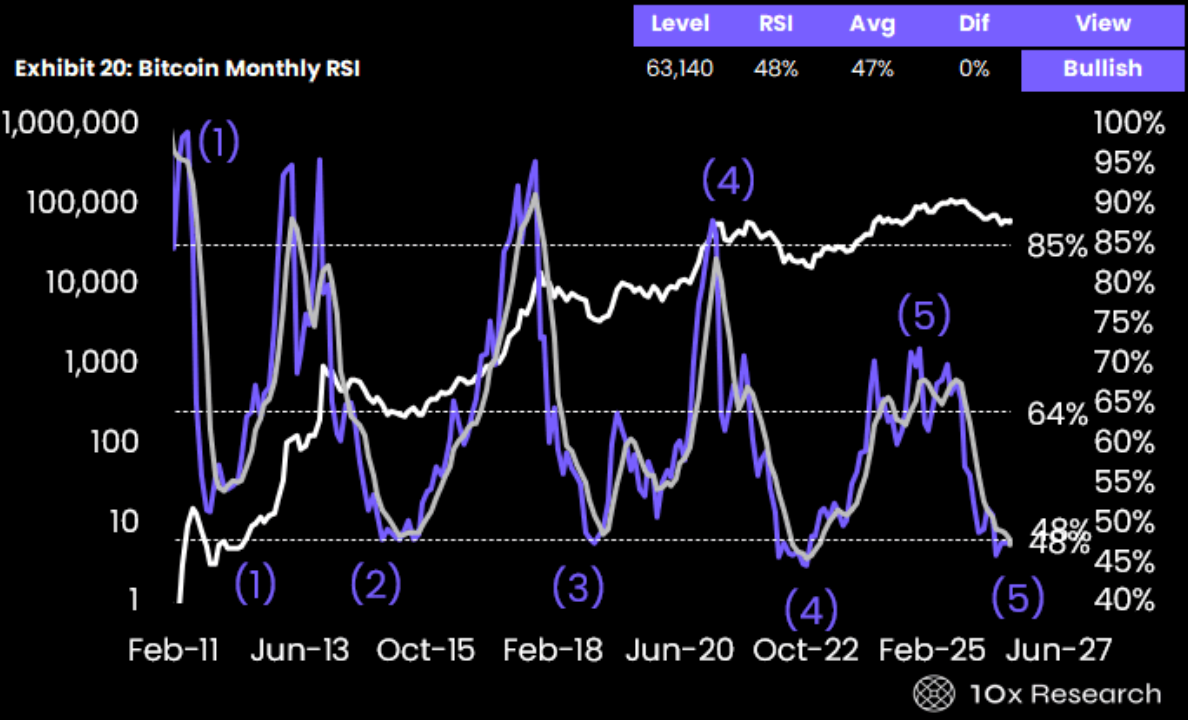
Bitcoin could confirm a bear-market bottom in August with a monthly close above $63,000, according to 10x Research.
Markus Thielen, founder of 10x Research, said in a Monday report shared with Cointelegraph that Bitcoin closed July below the threshold needed to confirm a technical bottom.
A monthly close near $63,000 would turn several of 10x Research’s cycle indicators bullish. Bitcoin was trading at $63,140 when the analysis was prepared, meaning a relatively small gain from July’s closing level could trigger the reversal signal. The company said it continued to favor long positions but would shift to a neutral stance if Bitcoin broke key support levels and moving averages.
The base case is that the Federal Reserve holds interest rates steady. However, further increases in the 10-year Treasury yield could force a September rate hike, while the Iran conflict remained an unpredictable risk.
The report said miners could generate roughly 100,000 BTC of selling pressure as some miners shift their businesses toward artificial intelligence. The company said it expected additional supply from Bitcoin treasury companies unwinding positions, though it described macroeconomic conditions as the larger risk to the market.
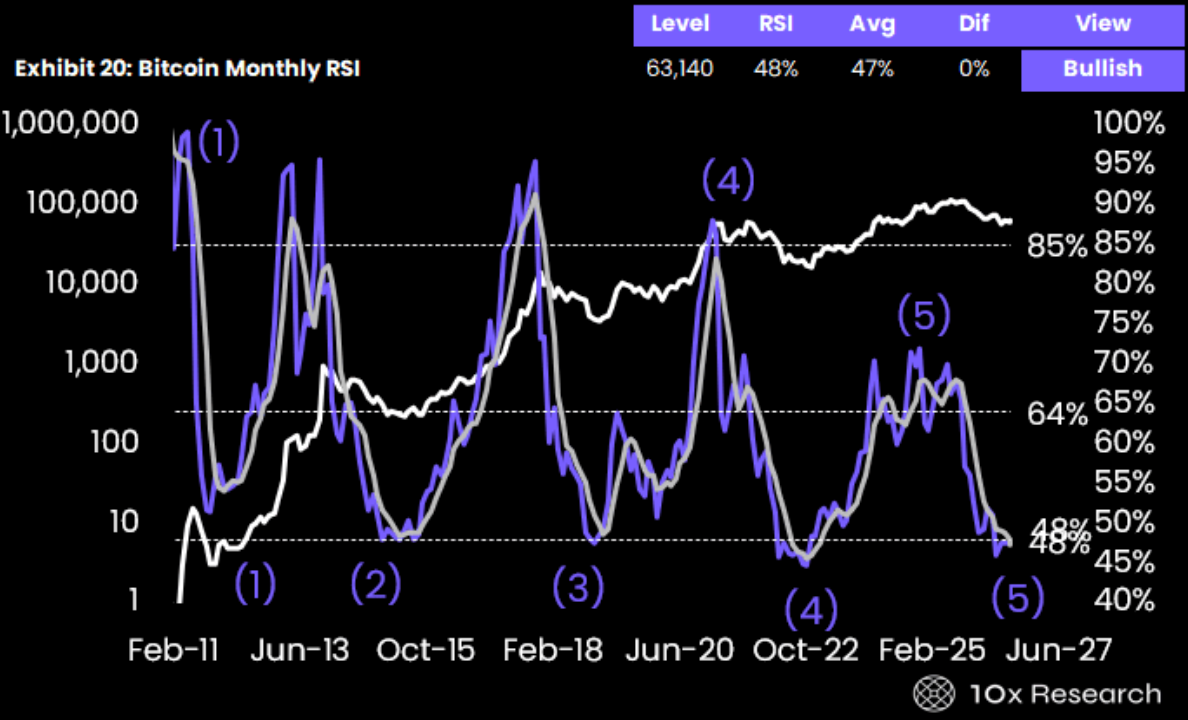
Bitcoin monthly relative strength index (RSI) chart. Source: 10x Research
Separately, Grayscale head of research Zach Pandl said in a July 22 report that Bitcoin may have bottomed earlier than the traditional four-year cycle would suggest. That pattern would place the cycle low in September or October.
Pandl said macroeconomic conditions, including Fed policy, would remain the primary drivers of Bitcoin’s price and could determine when it bottoms.
Related: Strategy-led group pledges $15M to quantum-proof Bitcoin network
More indicators point to an approaching Bitcoin bottom
Earlier in July, crypto brokerage K33 said more than half of Bitcoin’s supply was held at a loss, which it described as another indication that a market bottom was approaching.
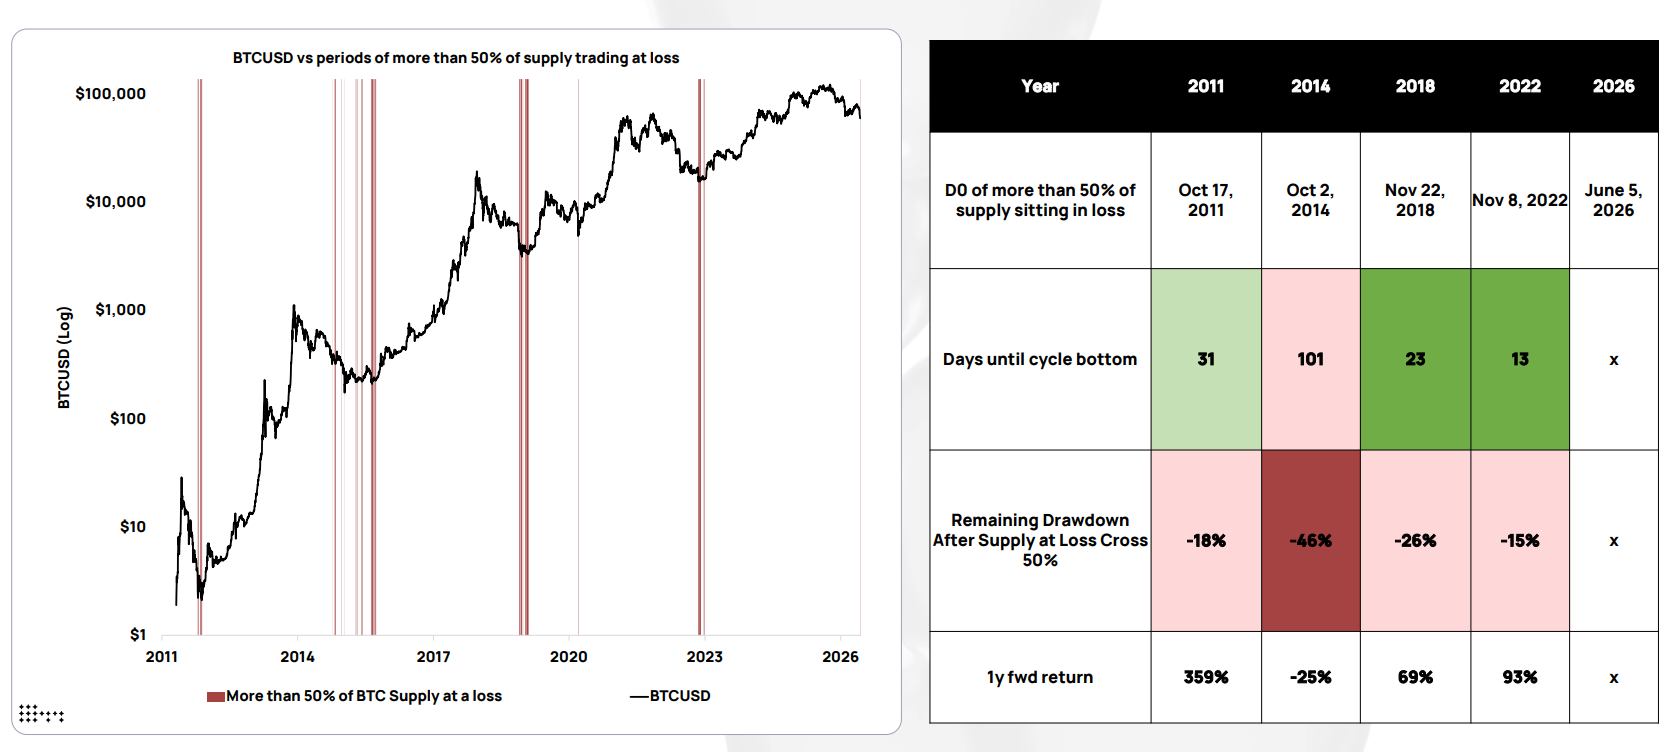
Bitcoin during periods when 50% of supply was held at a loss, with subsequent annual returns. Source: K33
Bitcoin bottomed within 13 to 31 days of the same threshold being reached in 2017, 2018 and 2022, according to K33.
In a June interview, Swan Bitcoin CEO Cory Klippsten told Cointelegraph that long-term holders’ record balance of 14.7 million BTC was another indication that Bitcoin was nearing a bottom.
Magazine: ‘Bitcoin Standard’ author explores reality where decentralized gold stopped WWI

How much money would the rich have to lose to fall below the top 1% of wealth? #money #politics

Arsenal get new Vinicius Jr update after key development in transfer saga

Ingersoll Rand Q2: Profitability Took A Hit, But There Are Ways It Can Come Back


-

 Business5 days ago
Why Trees Belong on the Risk Register
-

 Fashion3 days ago
Weekend Open Thread: Wit & Wisdom
-

 Politics3 days ago
Meta enters AI-training agreement with far-right ‘propaganda rag’ Newsmax
-
 Entertainment6 days ago
‘Stargate’ Creator’s New Sci-Fi Series Returns for Season 3 Tomorrow
-
 Crypto World2 days ago
MicroStrategy Post-Earnings CLARITY Act Push Could Add New Catalyst for Its Stock
-

 Politics6 days ago
The Part of the Electric Transition Nobody Wants to Discuss
-

 Business5 days ago
Major shareholder moves on Canyon
-

 Crypto World2 days ago
XRP Ledger v3.3.0 brings five institutional features
-

 News Videos4 days ago
Bitcoin Enters the 3rd Stage of the Bear Market
-

 Crypto World6 days ago
Kraken Enables Retail Access to Jersey Mike’s IPO via Tokenized Shares
-

 Tech6 days ago
New macOS Sequoia & Sonoma security updates for older Macs
-

 Politics4 days ago
Luke Littler’s dominance sparks GOAT debate
-

 News Videos6 days ago
Claude: Build Financial Dashboards in Minutes (2026)
-

 Business6 days ago
Johnson & Johnson agrees to $5.5B settlement over talc cancer claims
-

 Sports3 days ago
Seema Kaliramna Wins Discus Throw Bronze, Takes India’s CWG Medals Tally To 17
-

 Crypto World1 day ago
Crypto PAC spending tops $2M in Michigan House race
-

 Business3 days ago
Trump Announces Hamas Disarmament Agreement as Iran Strikes Kuwait Air Base and US Attacks Pause Overnight
-

 Tech5 days ago
Gemini can now summarize the messiest comment threads in Google Docs
-

 Tech1 day ago
ESET tracks rise in malicious AI skills and adaptable malware
-

 NewsBeat4 days ago
Four people die trying to cross Channel in small boats
You must be logged in to post a comment Login