
Crypto World
US Treasury targets Iran’s crypto sector in sanctions push



The U.S. Treasury Department has launched Operation Economic Outcast to target Iran’s international financial links, including cryptocurrency activity that American officials say supports sanctions evasion and the Islamic Revolutionary Guard Corps.
Summary
- Operation Economic Outcast covers cryptocurrency, technology, gold, aviation, shipping and other financial channels.
- OFAC can sanction people operating in Iran’s crypto sector, regardless of where they are based.
- Treasury says Iran uses digital assets to support transactions linked to the IRGC and government insiders.
- Bitcoin remained near $79,000 after briefly testing the psychological $80,000 level.
Operation Economic Outcast targets Iran’s financial links
The U.S. Treasury Department said President Donald Trump directed officials to begin Operation Economic Outcast as Washington seeks to cut Iran off from financial networks outside the country.
Under the campaign, Treasury plans to pursue people, companies, and intermediaries that it says help Iran sell oil, move money, avoid existing restrictions, or finance groups designated by the United States. Officials said they had already mapped facilitators, financial channels, and other networks used by Tehran.
“Today, in that same spirit, we are launching an economic onslaught against Iran’s financial connections around the globe,” Treasury said in its announcement.
The department presented Iran with two possible outcomes: continued isolation or a route back into the international economy. Reintegration, according to Treasury, would require the Iranian government to change conduct that Washington regards as a threat to the United States and its partners.
For foreign companies, Operation Economic Outcast also carries a warning about maintaining commercial ties with Iran. Treasury Secretary Scott Bessent said businesses and governments that work with the United States could benefit from that relationship, while parties that remain connected to Tehran could face similar isolation.
“Our objective is to sever every economic lifeline that sustains this tyrannical regime until Tehran stands alone.”
The campaign follows his earlier declaration of an “Economic D-Day” against Iran, which he described as the financial endgame of the U.S. campaign. Operation Economic Outcast expands that approach beyond Iran’s domestic institutions by focusing on overseas companies, payment channels and facilitators accused of keeping its economy connected to global markets.
US Treasury puts Iran’s crypto sector under scrutiny
Digital assets form a named part of the campaign because the Treasury says Iranian officials and connected groups increasingly use cryptocurrency to conduct transactions outside traditional banks.
According to the department, Iran has turned to crypto for sanctions evasion and for payments linked to the IRGC and government insiders. Treasury did not identify specific wallets, exchanges or transaction amounts in the campaign announcement, but it said the Office of Foreign Assets Control has authority to sanction people operating in the crypto sector of Iran’s economy, regardless of their location.
A person does not become sanctioned solely because the Treasury has announced the campaign. OFAC would still have to designate the person or entity under the relevant U.S. authority, after which any property under U.S. jurisdiction would generally be blocked.
American individuals and companies are generally prohibited from providing funds, services, or other economic benefits to designated parties. OFAC’s rules can also cover entities owned at least 50% by one or more blocked persons, even when the subsidiary or affiliated company does not appear separately on a sanctions list.
For exchanges, custodians, stablecoin issuers and payment providers, a new designation may require updates to wallet-screening systems and customer controls. Non-U.S. companies may also face sanctions exposure when they knowingly facilitate certain dealings involving blocked Iranian parties.
Other industries named by the Treasury include technology, gold, aviation, and shipping. The department said Iran has used international networks in these sectors to sell oil, receive payments, and obtain goods despite U.S. restrictions.
Earlier actions froze Iran-linked crypto funds
Operation Economic Outcast follows several U.S. actions against Iran-linked exchanges, wallets, and companies during 2026.
On Aug. 7, OFAC sanctioned Shelbit, Aban Tether, and Iranian national Siavash Kayvanpour after alleging that they helped move funds connected to sanctioned parties. As crypto.news reported earlier, the Treasury said IRGC-linked addresses sent more than $1 million in cryptocurrency to Shelbit, while wallets connected to the exchange allegedly transferred more than $2 million to IRGC-controlled addresses.
Treasury also alleged that Kayvanpour-linked wallets sent more than $2 million to Nobitex, Iran’s largest crypto exchange. Shelbit’s former management denied knowingly participating in sanctions evasion, terrorism financing or money laundering and said the company stopped accepting new business in December 2025.
OFAC separately accused Aban Tether of processing funds involving Nobitex, Wallex, Bitpin, and Ramzinex. The four Iranian exchanges had been sanctioned in June after U.S. officials alleged that they helped restricted entities use the digital asset market.
In July, U.S. authorities froze $131 million in USDT held across four Tron wallets linked by the Treasury to Iran’s central bank. Treasury confirmed the freeze but did not publicly explain how the funds had been obtained or what transactions the holders intended to conduct.
An earlier April action resulted in approximately $344 million in USDT being frozen across two Tron addresses that American authorities linked to Iranian networks. Tether enforced the restriction through controls built into the stablecoin, leaving the funds immovable without altering the Tron blockchain.
Centralized stablecoins give issuers a direct way to freeze assets held in named addresses. Bitcoin does not contain the same issuer-controlled function, so blocking BTC generally requires control over private keys, cooperation from a custodian, or an exchange account subject to legal restrictions.
Treasury’s actions have also covered alleged Bitcoin use outside Iran’s exchange sector. On July 29, OFAC sanctioned two insurers after accusing HormuzSafe Marine Services Authority of accepting Bitcoin and other digital assets to avoid restrictions and generate revenue for the IRGC.
The public designation did not include wallet addresses, transaction hashes, or payment totals supporting the allegation. It also did not announce a seizure, criminal charge, or court ruling against customers who may have used the company.
Bitcoin holds near $79,000 after testing $80,000
Bitcoin showed little immediate reaction to the Treasury campaign, trading around $79,000 after reaching an intraday high near $80,000. The level remains a psychological barrier after the cryptocurrency’s recovery from prices below $65,000 earlier in August.
Before the Treasury announcement, BTC had come under pressure as Trump escalated a trade dispute with Canada. The president threatened 50% tariffs on Canadian-made vehicles, auto parts and steel beginning Jan. 1, 2027, while Canada said it would respond with tariffs on U.S. goods.
Currency markets reacted more clearly to the two policy developments. Reuters reported that the U.S. dollar index rose 0.17% to 98.99 after the Iran measures and Canadian tariff announcement, while the Canadian dollar fell 0.61% against its U.S. counterpart. Bitcoin later recovered to approximately $78,993, up about 2.1% during the session.



Trump Media’s interim CEO, Kevin McGurn, defended the company’s Truth API service on CNBC Monday. He said customer sign-ups have grown to the mid-teens since the product launched on August 1.
Truth API sells high-frequency trading firms early access to President Donald Trump’s Truth Social posts. Critics say the arrangement lets paying customers trade on the president’s statements before the public sees them.
Sign-Ups Grow For Trump’s Signals
McGurn told CNBC’s Squawk Box that demand for the service came directly from the market, not from the company itself. He compared it to APIs long used by social platforms to feed trading firms, news outlets, and prediction markets.
“We’re getting into the mid-teens now, and we’re climbing.”
Kevin McGurn, CNBC
That is up from the more than 10 customer agreements McGurn cited on Trump Media’s earnings call two weeks earlier. Truth API costs up to $100,000 per month.
Congress Looking Into It
The service has drawn scrutiny from Congress and faces at least one lawsuit alleging it is unconstitutional. One federal complaint argues Trump cannot sell early access to posts the public effectively owns.
Trump holds his stake in Trump Media through a revocable trust. The structure lets him retain ownership without daily control. The company has already earned over $1 million from the service since its launch.
McGurn said Truth API also plans to expand into retail trading platforms, large language models, and prediction markets.
Whether the growing customer base outpaces the legal and political pressure remains the open question heading into the midterms.
The post Trump Media CEO Defends Truth API: Will Scrutiny Slow Sign-Ups? appeared first on BeInCrypto.


The Securities and Exchange Commission (SEC) has sent subpoenas to major Wall Street banks over their dealings with Situational Awareness, the artificial intelligence (AI) hedge fund that nearly collapsed last month.
Three people briefed on the outreach described the requests to the New York Times. Regulators want trade timing data and lender communications. The fund has not been accused of wrongdoing.
SEC Investigation Targets the Leverage Paper Trail
The subpoenas went to banks that cleared the fund’s trades and financed its positions. Bank of America, Citi, Goldman Sachs, and JPMorgan Chase ranked among its largest counterparties, according to a regulatory filing.
Investigators asked for the timing of specific trades. They also requested messages the banks exchanged with the fund about borrowed money, and told them to preserve every record tied to the San Francisco firm.
All four banks declined to comment. So did the SEC. A Situational Awareness spokesman said scrutiny of this kind was predictable.
“It is to be expected that regulators would closely examine any funds that are high profile, produce significant returns or have particularly dramatic drawdowns,” Situational Awareness said in a statement.
The timing lands as bank executives flag hidden borrowing across markets. JPMorgan chief Jamie Dimon warned this month that margin debt hit records.
A $30 Billion Book That Unwound in Days
At its peak the fund ran more than $30 billion and borrowed tens of billions more. Leopold Aschenbrenner, a 24-year-old former OpenAI researcher, founded it roughly two years ago.
Filings show the strategy turned far more aggressive before it broke. Protective put options worth $8.5 billion in March had largely disappeared by June 30, replaced by $12.5 billion in outright long positions.
AI names then dipped in late July while the traditional tech stocks the fund had shorted climbed. Margin calls followed, the portfolio fell about 67%, and Citadel bought the public book at a roughly 10% discount.
Bitcoin Miners Were Caught in the Middle
Crypto investors absorbed part of that unwind without knowing it. Mining stocks had grown to a quarter of the book, reaching $1.99 billion in the final 13F filing.
Core Scientific, Riot Platforms, and IREN led those positions. Ken Griffin’s firm has since cleared the miner overhang through nearly 100 block trades.
Any SEC investigation at this stage may never produce a case. The documents it gathers, however, could show how long the banks funded one concentrated AI bet before withdrawing credit.
Situational Awareness still holds a stake in Anthropic, which is weighing a public listing. That position now stands as the clearest measure of what survived July.
The post A $30 Billion AI Fund Implodes, Now the SEC Is Investigating Wall Street’s Role appeared first on BeInCrypto.
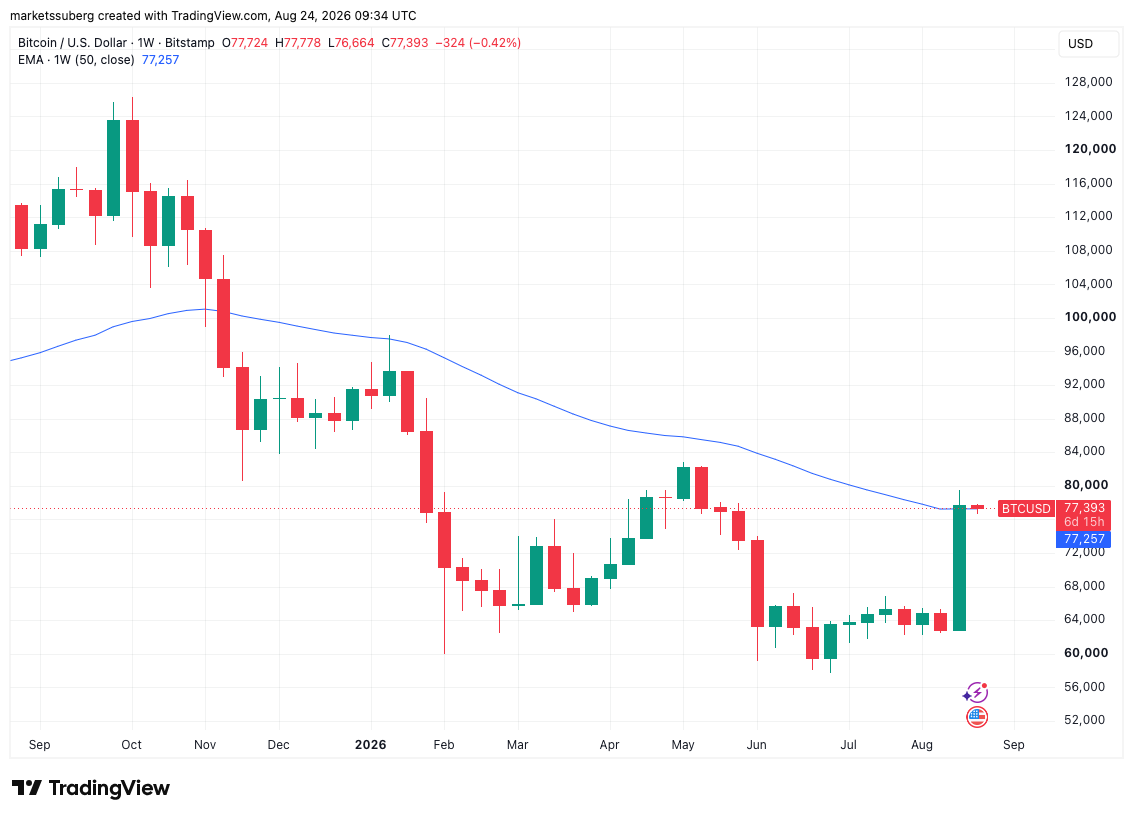
Bitcoin (BTC) starts the final week of August near its highest levels since mid-May as its bear-market recovery reaches a critical stage.
Key points:
- Bitcoin sees a weekly candle close above its 50-week exponential moving average (EMA) for the first time since November 2025.
- Amid its best August gains in almost a decade, BTC/USD returns investor cohorts to net profit, while new money enters at $73,000.
- Fed chair Kevin Warsh is in the spotlight ahead of the Jackson Hole symposium.
- US PCE data will be released on Wednesday as markets continue to respond to last week’s US Treasury debt buyback.
- Investor capital returns to exchange-traded products as Bitcoin ETF netflows hit $1.9 billion last week.
Bitcoin scrapes weekly close above key resistance
Bitcoin reached $79,550 last week, its highest levels since early May as a five-day rally brought gains of up to 27%. BTC/USD closed last week at $77,727 on Bitstamp, per data from TradingView. This signified a reclaim of its 50-week exponential moving average (EMA), a key resistance trendline that currently sits at $77,752.
The 50-week EMA is commonly brought into focus by traders during Bitcoin bear markets. The last candle close above this crucial line of resistance was in early November 2025. In prior bear markets, BTC has retested the 50-week EMA before capitulating into its ultimate macro lows. This has meant some traders remain unconvinced by last week’s strong price action.
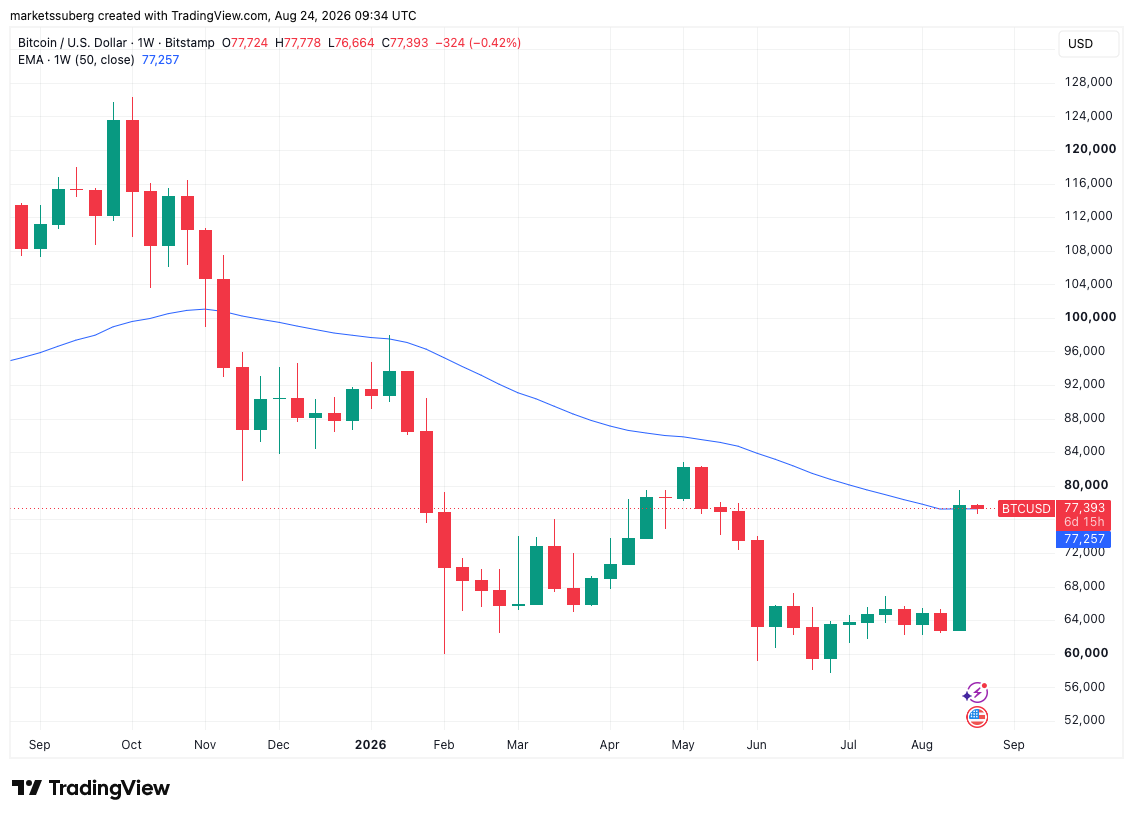
BTC/USD one-week chart with 50 EMA. Source: Cointelegraph/TradingView
Prior to the close, crypto trader and analyst Rekt Capital warned that not only the 50-week EMA but the entire area around $80,000 figured as resistance for bulls to overcome, while price so far has topped out lower.
“Each Bear Market Relief Rally thus far would retrace sharply in the week following a strong breakout rally,” he wrote in ongoing X analysis.
“Next weeks will be crucial. But maybe even already next week we’ll know whether Bitcoin can sustain these highs or not.”
An accompanying chart showed what Rekt Capital subsequently called a series of macro lower highs, potentially reinforcing the bear market despite recent strength.
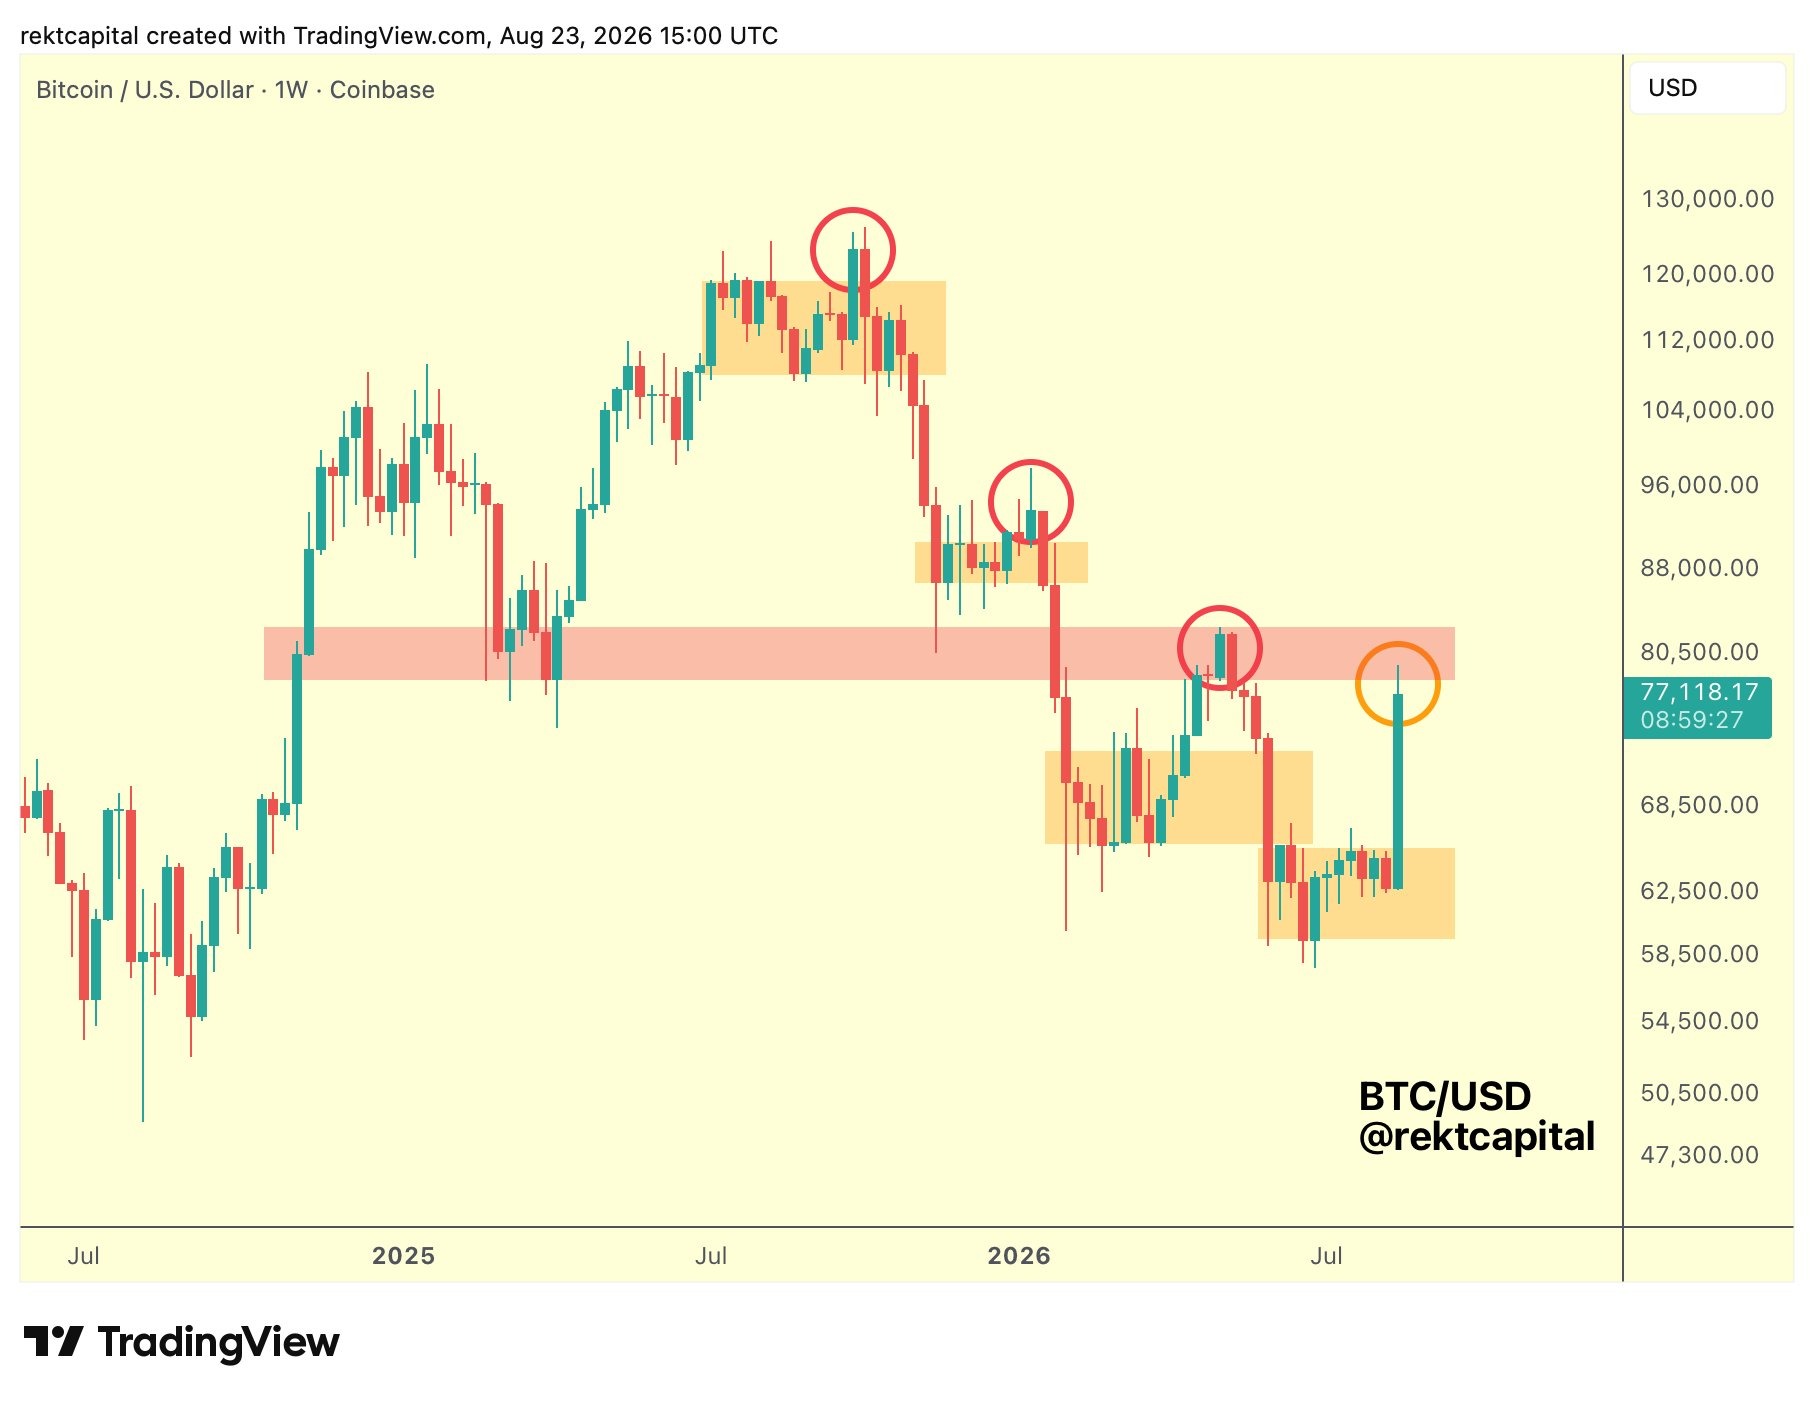
BTC/USD one-week chart. Source: Rekt Capital on X.com
Earlier, Cointelegraph reported on traders’ expectations of 2026 playing out in a similar manner to previous bear markets, with 2022 showing the most similarities in terms of timing.
“If history repeats, Bitcoin will try to get as close as possible to ~$93,000 in 2027. But first, Bitcoin needs to fully confirm its Bear Market bottom and fully confirm a break of the Macro Downtrend,” Rekt Capital added.
BTC price on track for best August in nine years
Bitcoin consolidated over the weekend, with price circling $77,500 at the time of writing, still up 22% month-to-date in its best performing August since 2017, per data from CoinGlass.
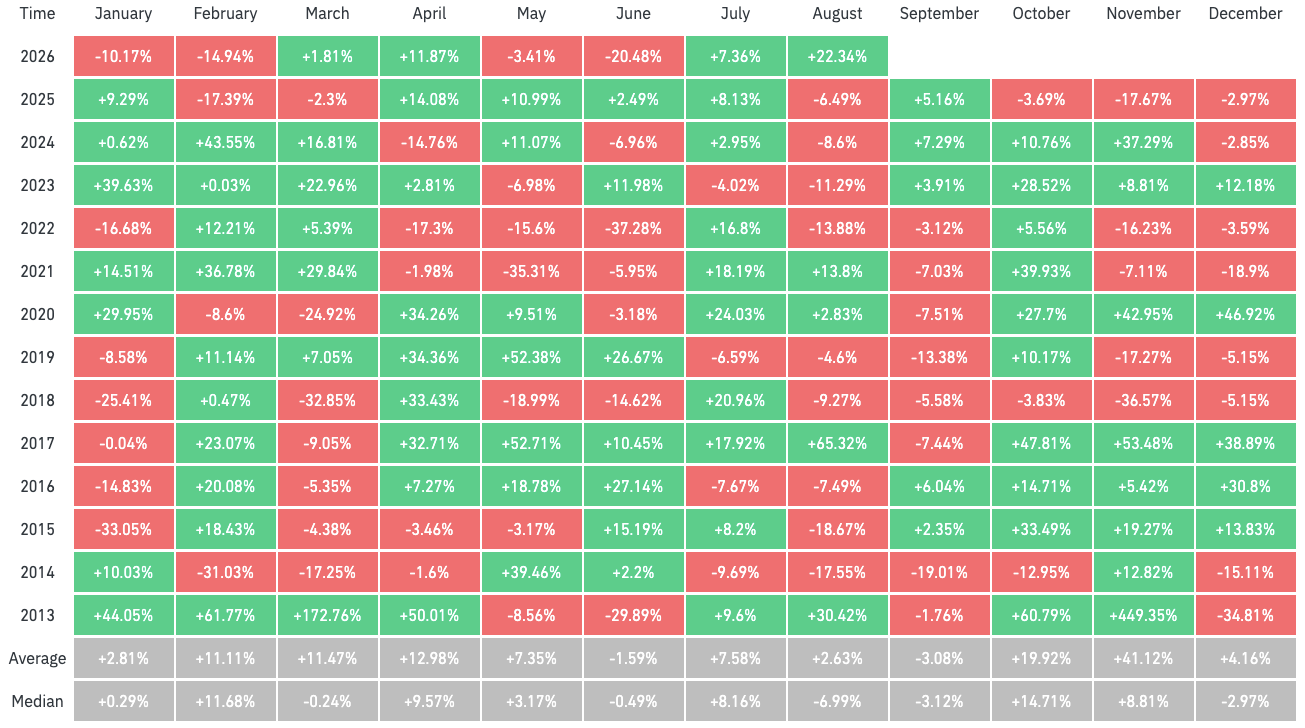
BTC/USD monthly returns (screenshot). Source: CoinGlass
The run-up saw the weekly candle reclaim several key price points, including the aggregate cost basis for short-term holders (STHs) — wallets holding a UTXO for less than 155 days — at $68,700. Onchain analytics platform CryptoQuant thus calculated STH net profitability at just over 11%.
“At the same time, Long-Term Holder profitability moved from approximately breakeven to +18.5%, while New Money profitability rose from -1.4% to +12.7%,” it reported on Monday.
Examining the cost basis of UTXOs as a whole, CryptoQuant noted that so-called “new money” now has a breakeven point at $73,000, above both the STH and LTH cost basis, leaving less margin for downside protection should BTC/USD reverse to attempt to find new support lower.
“That makes the 68K-73K region the key area to watch. Holding above it would suggest that the profitability reset is becoming structurally durable. Losing it would quickly push a large portion of recent buyers back into loss,” it added.
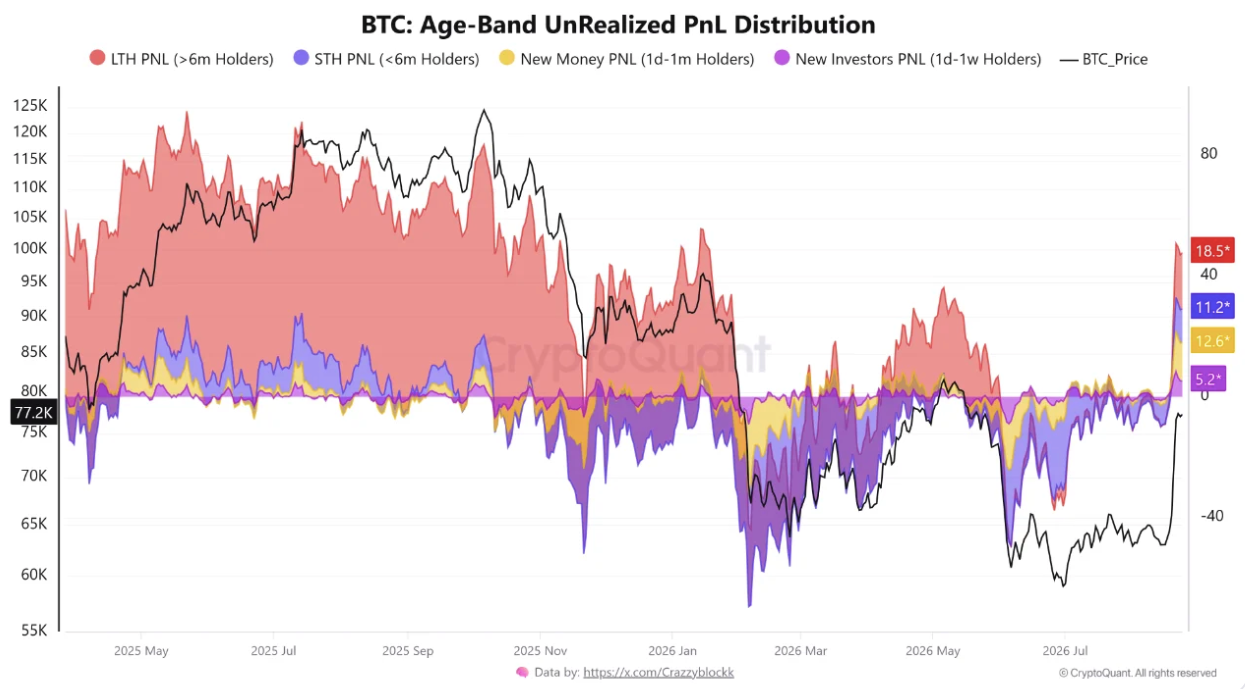
Bitcoin UTXO distribution by cohort age (screenshot). Source: CryptoQuant
Fed’s Warsh faces the music at Jackson Hole
All eyes are on the Federal Reserve and chair Kevin Warsh this week as the annual Jackson Hole economic symposium gets underway.
The event, which will feature central bankers from over 70 countries, sees Warsh’s first keynote speech as Fed chair and his first public speaking appearance since the press conference that followed the July Federal Open Market Committee (FOMC) meeting.
Warsh has maintained a tight-lipped stance on financial policy, especially when it comes to future interest-rate changes — a topic to which crypto and risk assets are sensitive. Recent inflation data has supported a softening of policy going forward, but the ever-present threat of oil-price spikes from the US-Iran war has kept markets wary.
The latest data from CME Group’s FedWatch Tool shows 63.1% odds of rates remaining at their current 3.50-3.75% level after the September FOMC meeting.
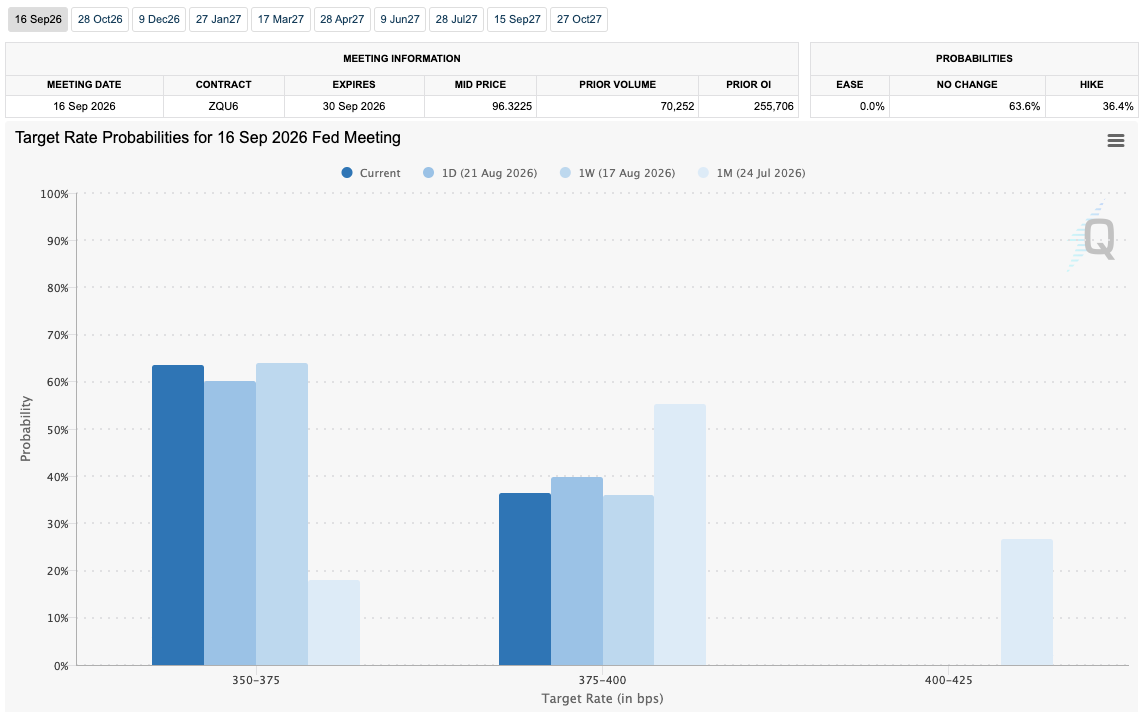
Fed target-rate probability comparison for September FOMC meeting (screenshot). Source: CME Group
Speaking to CNBC last week, Thierry Wizman, global foreign exchange and rates strategist at Macquarie Group, warned that Warsh now had to juggle the influence of the Treasury with his plan to reduce the market involvement of the Fed.
Wizman told the network that “were Warsh to signal that he would stay ‘dovish’ indefinitely, it could be self-defeating for him and the Treasury, since inflation breakevens would rise further, perhaps undoing the stability in the nominal long-term yields that [Treasury Secretary] Scott Bessent is trying to achieve.”
A survey of fund managers by Bank of America, quoted by Barchart and others, produced 72% odds of no rate hikes occurring before the US midterm elections in November. On policy, consensus coalesced around a “no landing” scenario over the next 12 months — where the economy avoids recession amid strong growth and low unemployment.
Yield curve control talk returns after Treasury debt move
Beyond geopolitics, a move by the US Treasury last week to at least double the size of its debt buyback purchases to $4 billion per operation was the key market mover last week. The announcement sparked a Bitcoin short squeeze that went on to wipe out a record $3.1 billion of crypto short positions over two days.
The extent of the reaction sparked suggestions that Bitcoin was once again anticipating global liquidity-regime changes amid the rising cost of government debt financing worldwide.
“The intervention ignited a move in assets sensitive to the outlook for liquidity, including gold and Bitcoin. That hints at market concerns over currency debasement should measures like quantitative easing make a return to contain interest rates,” trading resource Mosaic Asset Company wrote in the latest edition of its regular newsletter, The Market Mosaic.
Mosaic argued that the intervention represented not a mere liquidity move but a form of yield curve control (YCC), with short-term bonds issued to cover the cost of the added buybacks. Crypto commentators have long expected YCC to be all but guaranteed to prevent government bankruptcy.
“YCC is the end game. When it is finally implicitly or explicitly declared, it’s game over for the value of the USD vs. gold and more importantly Bitcoin,” Arthur Hayes, former CEO of crypto exchange BitMEX, forecast in a 2022 blog post.
“YCC is how we get to $1 million Bitcoin and $10,000 to $20,000 gold.”
The day prior to Warsh’s appearance, meanwhile, brings a crucial piece of US macroeconomic data that could skew the mood for markets.
The July print of the Personal Consumption Expenditures (PCE) index, due for release on Wednesday, is known to be the Fed’s “preferred” inflation gauge. In June it saw its first month-on-month drop since 2020.
Consensus around the upcoming print is for a 0.1% monthly increase, with the year-on-year increase cooling further to 3.6% versus 3.7% in June.
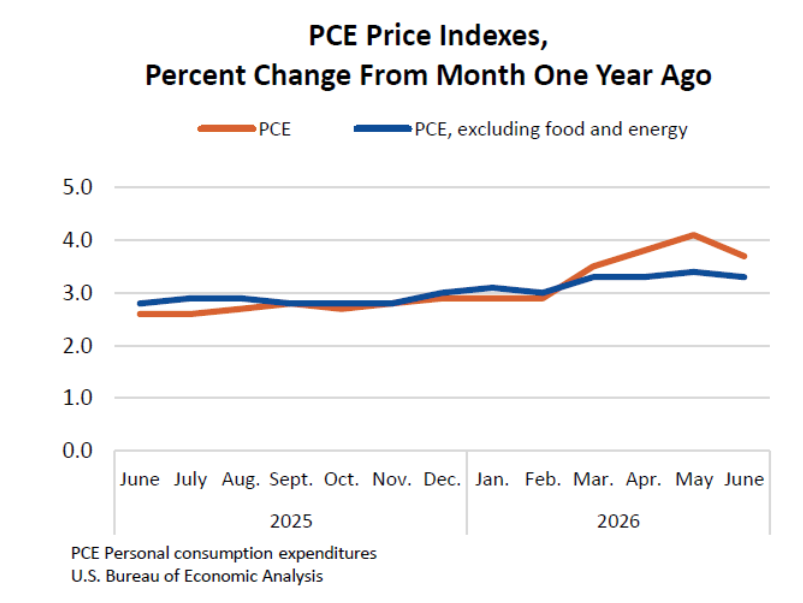
PCE index one-month % change (screenshot). Source: US Bureau of Economic Analysis
Bitcoin ETFs see strongest inflows in 10 months
Crypto fund inflows remain highly reactive to price volatility, with last week’s inflows to the US spot Bitcoin exchange-traded funds (ETFs) breaking records.
Related: Bitcoin has ‘largely purged’ froth that preceded 50% drop from $126K: BlackRock
Data from UK-based investment company Farside Investors shows the ETF cohort taking in $1.9 billion over the week’s five trading days — the strongest weekly tally since October 2025, when Bitcoin hit its latest all-time highs of $126,200.
Thursday saw particularly strong performance as BTC/USD extended gains beyond $70,000, with BlackRock’s ETF, the iShares Bitcoin Trust (IBIT), seeing net inflows of more than half a billion dollars.
“We saw net inflows on every trading day last week, which suggests renewed investor interest in Bitcoin,” Gracie Lin, chief executive officer of crypto exchange OKX SG, told Bloomberg.
“The question now is whether that momentum will hold. After such a strong move in Bitcoin, some profit-taking wouldn’t be surprising.”
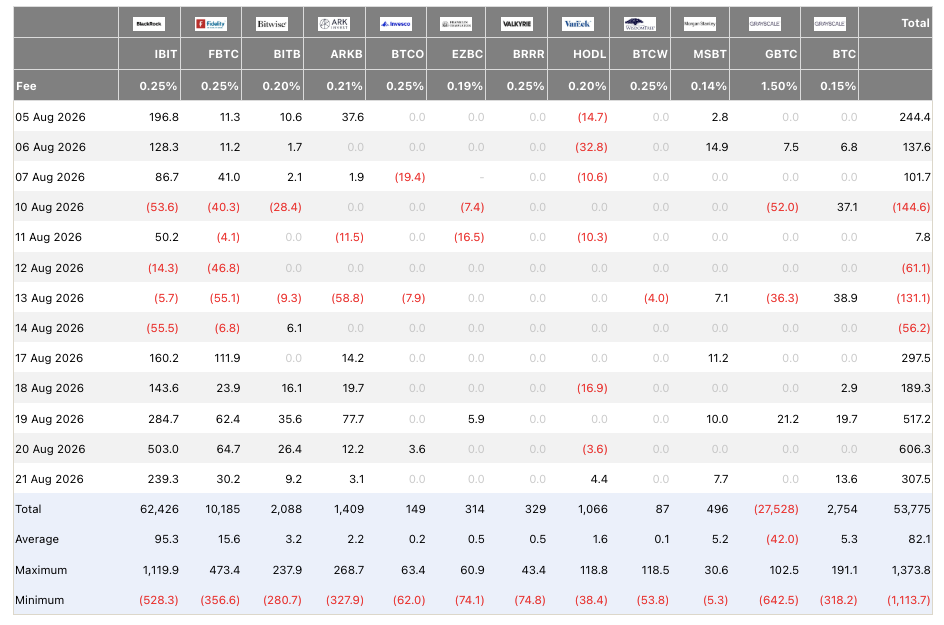
US spot Bitcoin ETF netflows (screenshot). Source: Farside Investors
The results heavily contrast with activity just two months ago, with June seeing unprecedented net outflows of more than $4.5 billion. At the end of last week, total August inflows stood at $2.38 billion, a new year-to-date record.
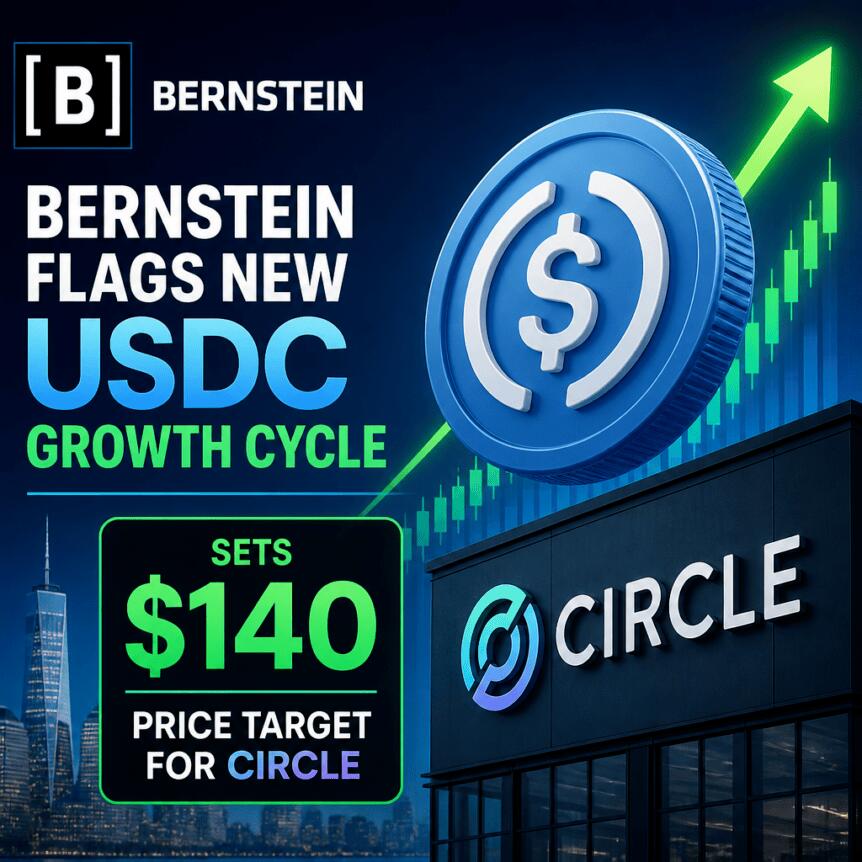
Circle is drawing fresh investor attention as analysts at Bernstein argue that USDC is entering a new expansion phase—one that could translate into meaningful momentum for the stablecoin issuer over the next year. In a research note published Monday, the firm pointed to a sharp pickup in USDC supply growth and an improvement in the stablecoin’s role within dollar-backed payments.
Bernstein said USDC is showing signs of what it called “digital dollar reflation” after its supply rose by roughly $2 billion in seven days, reversing a six-month stretch of stagnant or declining growth. The brokerage reiterated an Outperform rating on Circle and a $140 price target, implying about 60% upside from current levels. Circle shares have risen roughly 40% over the past month.
Key takeaways
- Bernstein cited a roughly $2 billion USDC supply increase over seven days, calling it “digital dollar reflation.”
- The firm maintained a $140 price target on Circle and an Outperform rating, expecting a boost over the next 12 months.
- Bernstein said USDC’s transaction presence improved, with its share of adjusted stablecoin volume rising from about 40% in 2025 to more than 60% so far in 2026, surpassing USDt by that metric.
- Analysts pointed to catalysts including renewed crypto market activity, clearer US regulation, tokenized capital markets, and stablecoins gaining traction in payments.
- Bernstein also noted early signs that AI agents may be using stablecoins in payments.
USDC supply and “digital dollar reflation”
The crux of Bernstein’s bullish case is an apparent shift in USDC’s growth dynamics. After months in which supply growth was described as stagnant or negative, the firm highlighted a sudden acceleration—about $2 billion added to USDC supply in just one week. For investors, that kind of reversal matters because stablecoin supply growth can be a leading indicator of broader on-chain and off-chain usage, which in turn can support the economics of issuance and ecosystem activity.
Bernstein’s note framed the move as “digital dollar reflation,” suggesting that demand for dollar-denominated digital assets may be strengthening again. The firm did not position this as a one-off event, instead describing it as the beginning of a broader growth cycle that could play out over the next year.
Why transaction share may be the bigger story
Beyond supply, Bernstein emphasized USDC’s increasing share of stablecoin transaction activity. While USDC remains the second-largest dollar-backed stablecoin by market capitalization, it trails Tether’s USDt (USDT). Still, Bernstein argued that USDC has gained ground in transactions, not just valuation.
According to the note, USDC’s share of adjusted stablecoin transaction volume rose from roughly 40% in 2025 to more than 60% so far in 2026, overtaking USDt on that measure. That matters because transaction volume is often treated as a proxy for real usage—transfers, swaps, and payments—rather than purely for holding patterns.
Put differently, Bernstein’s thesis suggests a divergence: even if USDC doesn’t lead by market cap, it may be winning by activity. Traders and businesses usually care about that distinction when stablecoins are used for settlement, routing, and payments where liquidity and flow can influence costs and reliability.
What Bernstein says could fuel the next growth cycle
Bernstein attributed the potential next phase of stablecoin growth to several overlapping factors. In its view, improved sentiment toward crypto more broadly could lift demand for stablecoins, while greater regulatory clarity in the United States could remove friction for issuers, partners, and regulated institutions.
The analysts also pointed to the expansion of tokenized capital markets and growing stablecoin adoption for payments. In practical terms, tokenization and payment use-cases can increase stablecoin demand by embedding dollar-denominated tokens into workflows that previously relied on bank transfers, prepaid balances, or legacy settlement rails.
Notably, Bernstein added that there are early signs of stablecoin use in payments made by artificial intelligence agents. While still an early signal, it aligns with a broader market pattern: as automation increases the number of transactions performed by software, stablecoins can become the unit of account for machine-to-machine payments—especially when they need dollar stability rather than crypto volatility.
Circle’s IPO-era volatility and recent fundamentals
Circle’s stock performance has reflected the volatility of public crypto exposure since it went public in June 2025. Bernstein’s note highlighted that the company priced shares at $31 in its IPO and raised roughly $1.1 billion. After an initial surge, the stock retreated toward its IPO level by November 2025 as the wider crypto market downturn weighed on publicly traded companies with sector exposure.
More recently, Circle has continued to report improved financial results. In its most recent quarter, the company reported $701 million in revenue and $48 million in net income, both higher than a year earlier.
For investors evaluating Bernstein’s stablecoin-growth thesis, that backdrop is important: improved operating performance can make it easier for markets to underwrite management’s ability to monetize stablecoin expansion rather than treating it as a purely narrative-driven trade.
Payments, regulation, and the “share of volume” test
Stablecoins sit at the center of several current crypto narratives—regulated dollar settlement, faster payment rails, and the infrastructure layer for tokenized finance. Bernstein’s emphasis on USDC’s transaction share suggests the firm believes the market is now grading stablecoins less on who is biggest by market cap and more on who is being used most in day-to-day activity.
At the same time, the regulatory and adoption catalysts Bernstein cites remain subject to real-world implementation and policy outcomes. That is why the near-term data points investors are likely to watch are continued supply growth, sustained improvements in transaction volume share, and evidence that payments use-cases—whether human-facing commerce or automation-driven transfers—are broadening beyond early experimentation.
For now, the debate centers on whether USDC’s recent supply acceleration and its rising share of transaction volume represent the start of a durable trend. If those metrics continue to climb while Circle’s fundamentals hold up, Bernstein’s “next 12 months” bet could look increasingly credible; if they fade, the market may revert to treating stablecoin growth as cyclical rather than structural.
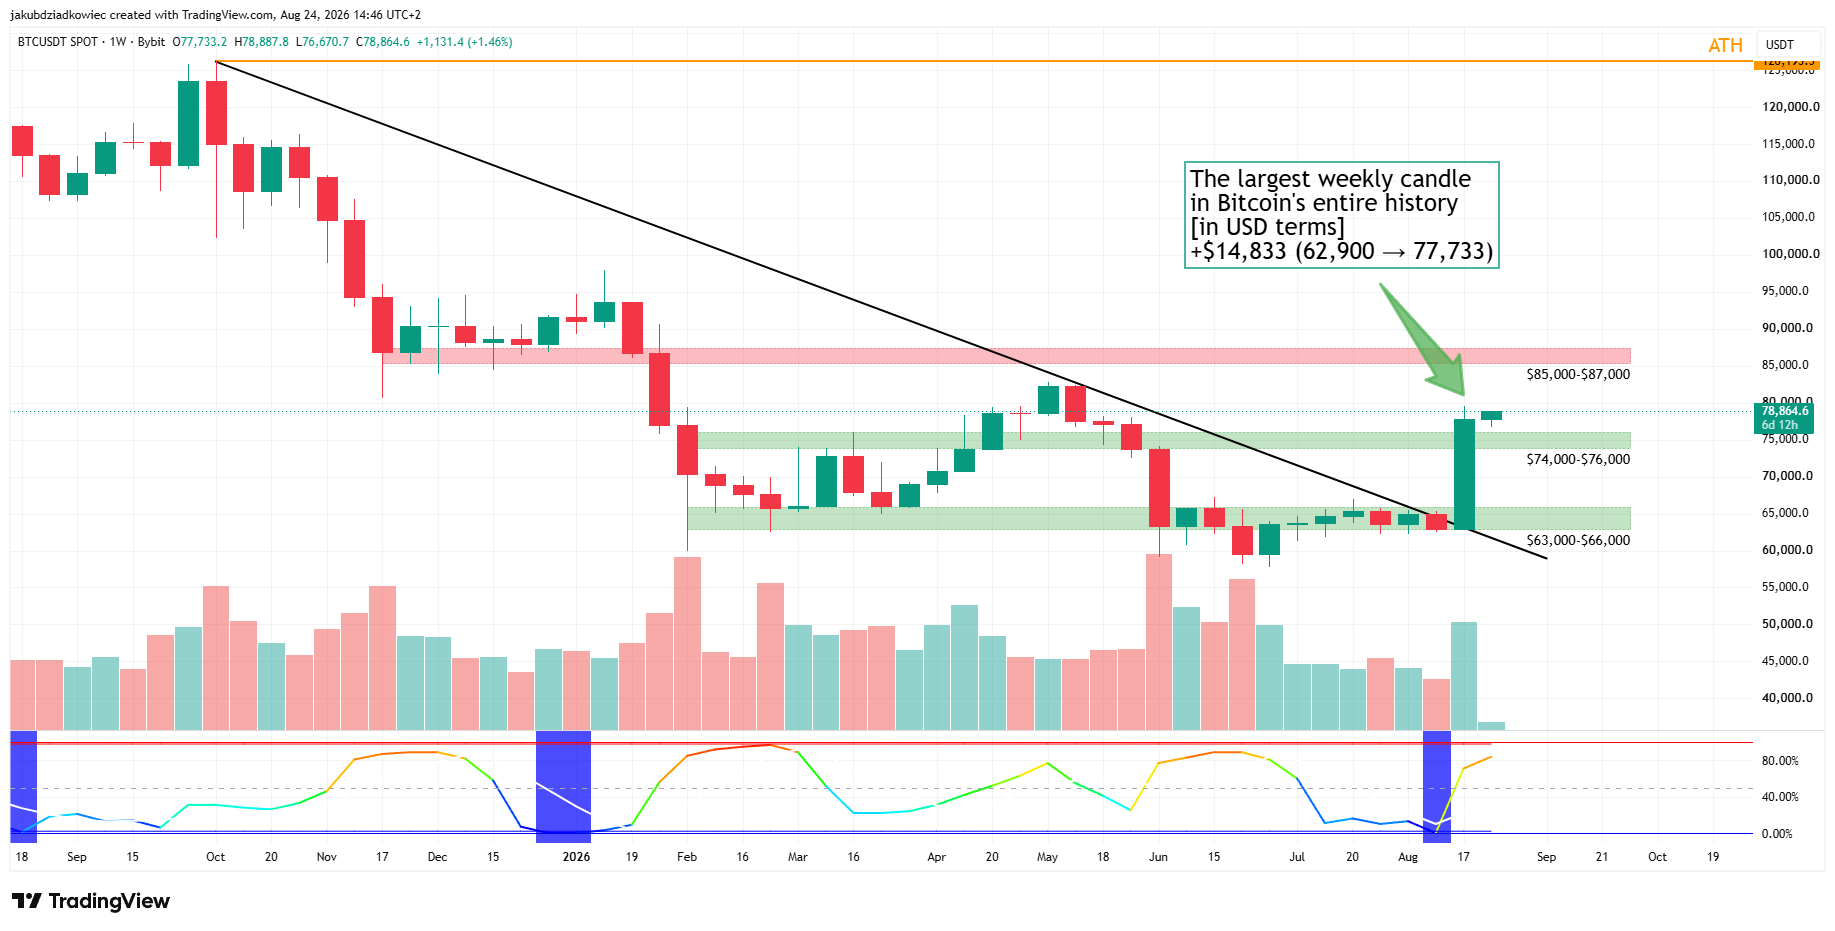
Bitcoin (BTC) rose 23.58% last week, its best week since 2023. The move added $14,833, the largest dollar gain of any week in Bitcoin’s history.
BTC trades near $79,000 at the time of writing, up 1.8% over 24 hours. The weekly candle broke a descending trendline stretching back to the October 2025 record high.
Bitcoin’s Best Week Since 2023 Breaks a 10-Month Downtrend
Structurally, Bitcoin’s price bounced from the $63,000 to $66,000 support zone. It then cleared the descending resistance line drawn from the record high of $126,195. Price also pushed through the $74,000-$76,000 band, which should now serve as support.
Weekly volume expanded alongside the move, though it stayed below June’s peak. The BBWP indicator expanded from an extreme low to near-maximum volatility, and it continues to rise. Historically, such squeezes signal a large move without indicating its direction.

The daily chart carries the more durable signal. BTC reclaimed its 200-day moving average near $69,000. That level had capped every advance of the downtrend since last October.
Daily RSI now reads 82, its highest since 2024. However, momentum has stretched rather than reversed on its two most recent occurrences.
The nearest resistance sits at the $82,215 swing high, followed by the $85,000 to $87,000 zone. BTC remains roughly 38% below its record high.

Funding Rates Hit a 2026 High While Open Interest Lags
Derivatives data complicates the bullish read. Roughly $2.7 billion of shorts liquidated on August 19, when the US Treasury doubled its long-dated bond buybacks.
Glassnode data shows aggregate perpetual funding reaching its highest level in 2026 during the squeeze. In contrast, April’s advance toward $79,000 was accompanied by persistently negative funding.
Traders paid to stay short then. They now pay to stay long, which suggests positioning has flipped rather than moderated.

Open interest tells a different story. CoinGlass data puts exchange open interest near $57.5 billion, up from roughly $46.5 billion before the breakout.
That total still sits below the January peak near $65.3 billion and the May peak near $64 billion. Both readings preceded sharp corrections this year.
Leverage has therefore returned without reaching saturation. A climb toward $64 billion would indicate a crowded market again.

Meanwhile, a weekly hold above $74,000 keeps the breakout structure intact. Losing that band would shift the burden back to the $63,000 to $66,000 range.
The post Bitcoin Books Best Week Since 2023 and Its Largest Dollar Gain Ever appeared first on BeInCrypto.
Solana (SOL) is trading around $95 as of late August 2026, roughly a third of its January 2025 all-time high near $296. After a brutal six-month losing streak that dragged the token down to the $60–$70 range earlier this year, SOL has stabilized in the $80–$100 range. Stick around until the end to see what price AI predicts Solana will be trading at by the end of 2026, after crunching all of the data and potential catalysts over the next few months.
The question now is whether it can break out, and the evidence from ETF flows, prediction markets, and trader sentiment points to a market that’s cautiously constructive but far from convinced.
SOL has been one of the top performers as the market rallied over the past week, led by Bitcoin soaring back toward $80,000. Solana surged +25% in the past week, with daily trading volume hitting $3.72Bn.
Spot Solana ETF Flows: Steady, Not Spectacular
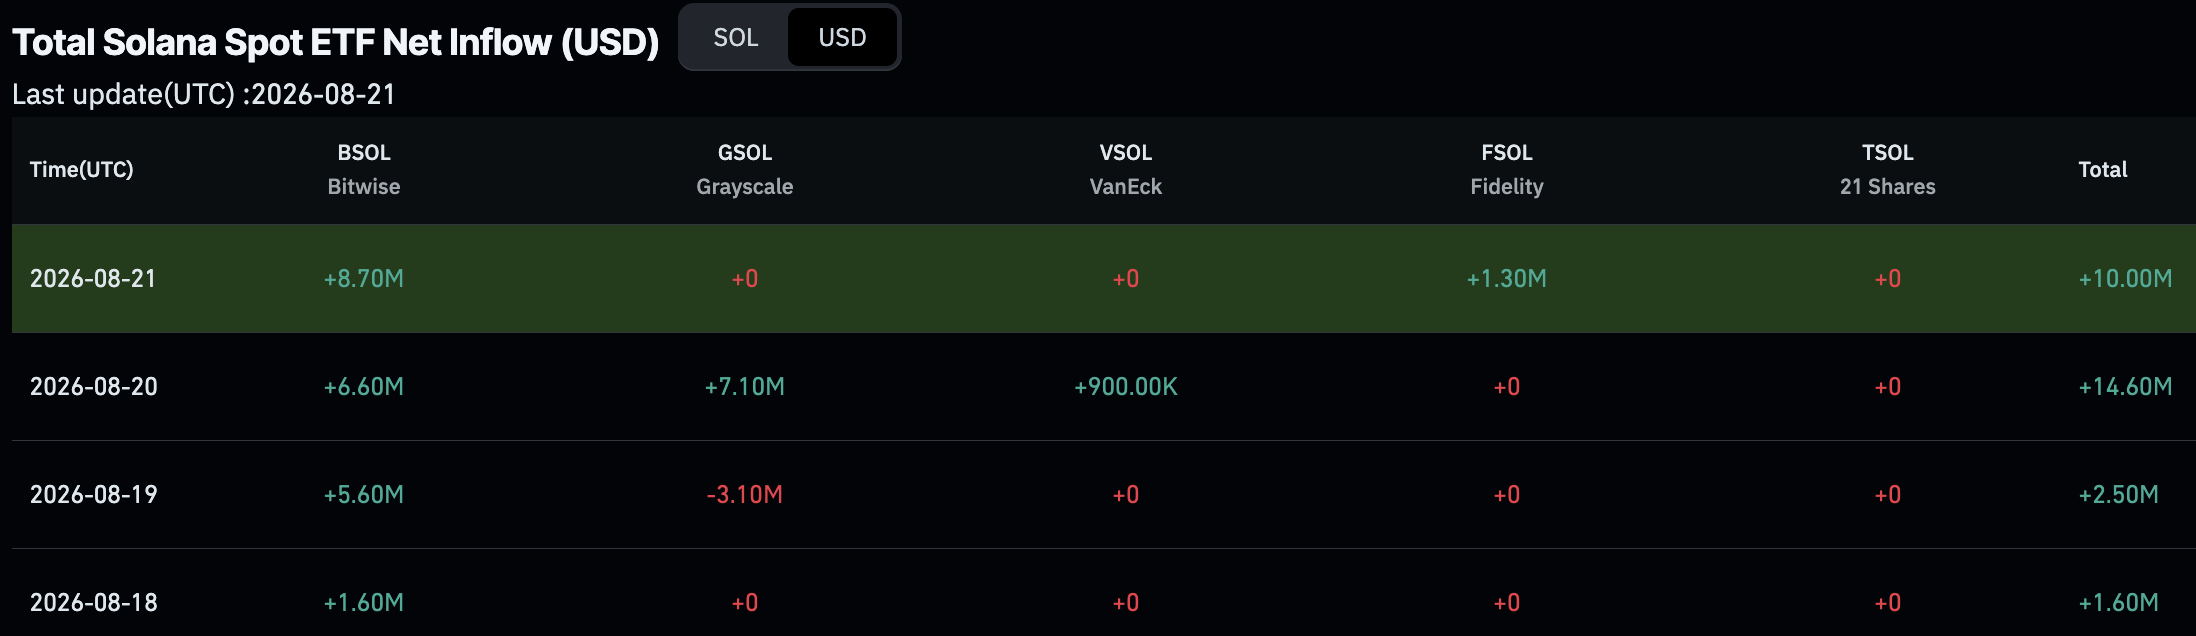
Spot Solana ETFs have pulled in roughly $1.4–1.5Bn in cumulative inflows since launch, a meaningful amount but a fraction of the inflows Bitcoin and Ethereum funds attracted after their own approvals.
Flows have kept trickling in even during price weakness, a sign of some sticky institutional demand, but they’ve clearly not been strong enough to offset broader risk-off selling.
Notably, Goldman Sachs reportedly exited its SOL ETF positions in Q1 2026, while SEC 13F filings show investment advisers now control roughly half of US spot SOL ETF assets, suggesting the buyer base is becoming more institutional even as the dollar amounts remain modest relative to SOL’s market cap.
Discover: The Best Crypto to Diversify Your Portfolio
What Kalshi Prediction Markets Say as AI Predicts Solana
Kalshi’s “Price of Solana by the end of 2026” contract is one of the more useful real-time gauges here. As of the most recent data, the market prices roughly a 42% chance SOL finishes the year at $100 or above, about 21% for $150+, and only single-digit odds for $250+ or $500+.
That’s a meaningfully more conservative view than many published analyst targets, and it has been range-bound and news-reactive, swinging on catalysts like stablecoin launches (Circle minting USDC on Solana, Coinbase/Flipcash’s USDF) rather than trending steadily in one direction.
Polymarket data has told a similar story, assigning relatively low odds to a run past $160. In short, the “smart money” aggregated in these markets is betting on modest upside, not a moonshot. AI predicts Solana
Make Your Prediction Count With $25 For Free on Kalshi
What Traders and Analysts Are Saying
Published forecasts span an enormous range, from bearish models seeing SOL stuck near $60–$90 to bullish outfits like Standard Chartered anchoring a $250 target for 2026.
The more measured consensus, the kind you see repeated across multiple independent trackers, clusters year-end estimates in the $120–$160 area, with bull cases stretching to $250–$350 contingent on two specific catalysts.
These include the Alpenglow consensus upgrade (targeting ~150-millisecond finality, down from 12.8 seconds, expected Q3 2026) and wider Firedancer validator adoption (aimed at pushing validator client diversity past 50%, up from roughly 20–26%).
Traders on social platforms and crypto-news sites tend to frame 2026 as a “show me” year: Solana’s on-chain fundamentals, which briefly outpaced Ethereum in weekly revenue, lead in real-world-asset lending market share, and continue attracting stablecoin issuers, haven’t translated into price the way bulls expected, and that adoption-price disconnect is the dominant theme in trader commentary right now.
Now, let’s take a look at what AI predicts Solana could be trading at by the end of 2026 and how it compares with the data points discussed throughout this article.
AI Predicts Solana: The Verdict
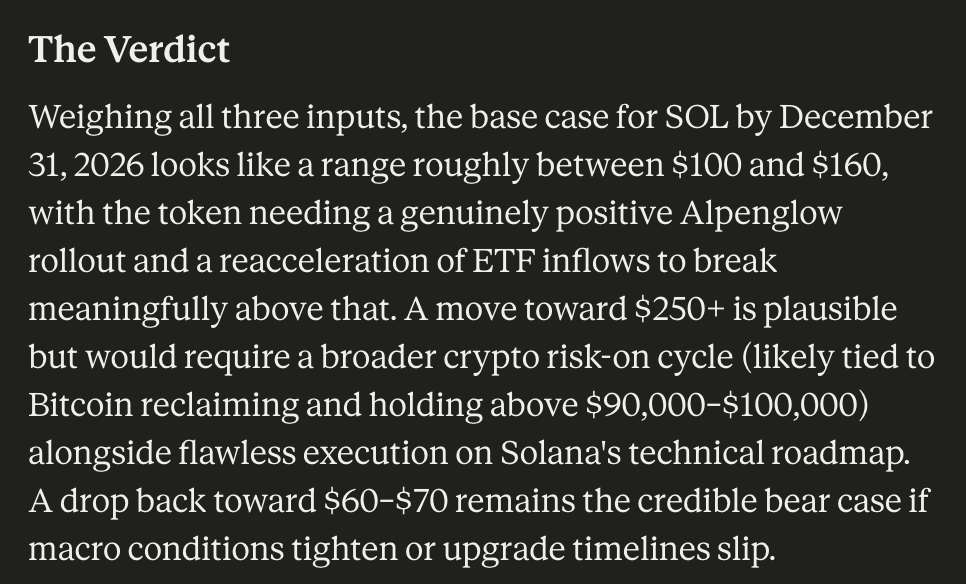
Weighing all three inputs, the base case for SOL by December 31, 2026 looks like a range of roughly $100 to $160, with the token needing a genuinely positive Alpenglow rollout and a reacceleration of ETF inflows to break meaningfully above that level.
A move toward $250+ is plausible but would require a broader crypto risk-on cycle (likely tied to Bitcoin reclaiming and holding above $90,000–$100,000) alongside flawless execution on Solana’s technical roadmap. A drop back toward $60–$70 remains the credible bear case if macro conditions tighten or upgrade timelines slip.
Never Miss a Swing Again: Use AI Copy Trading Bots From CryptoHopper
Discover: The Best Token Presales
The post AI Predicts Solana Price at the End of 2026 appeared first on Cryptonews.
Crypto World
Dario Amodei Claude AI Predicts Ethereum Needs to Do One Thing Before $4,000 Is Back on the Table
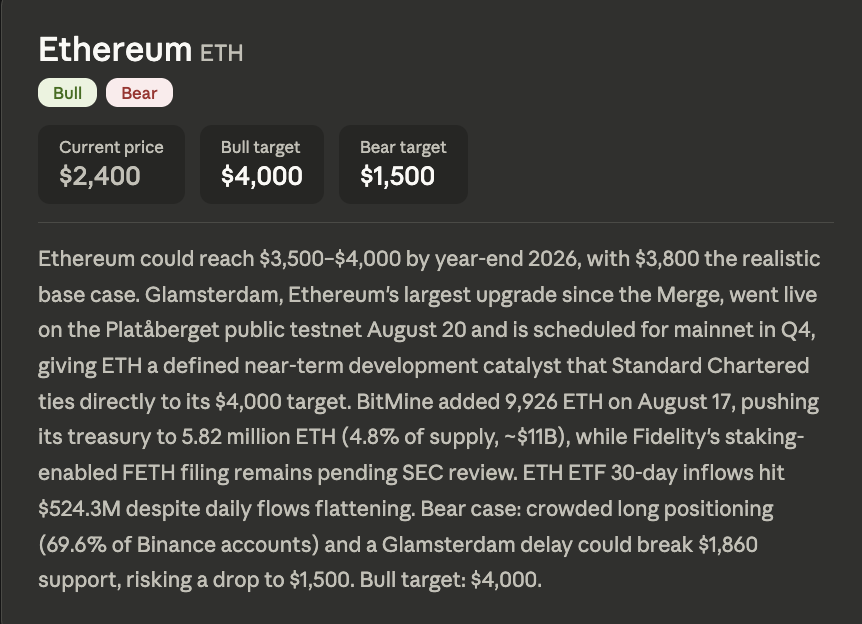
Can a single upgrade close a gap of more than 50%? That is the question behind the latest Claude AI price prediction, where the model predicts Ethereum (ETH) reaching $3,500 to $4,000 by year’s end 2026, with $3,800 as the realistic base case.
The chart already moved first. Ethereum price spent July and August pinned near $1,900 before ripping vertically to $2,448 in a matter of days.
That pump reset the entire conversation. A market that looked forgotten is suddenly trading 25% above where it sat two weeks ago.
The catalyst behind the forecast is Glamsterdam. It is the largest Ethereum upgrade since the Merge, and it went live on the Platåberget public testnet on August 20.

Mainnet is scheduled for Q4. Standard Chartered ties its own $4,000 target directly to that timeline.
Treasury demand is building alongside it. BitMine added 9,926 ETH on August 17, pushing its holdings to 5.82 million ETH, roughly 4.8% of supply and around $11 billion.
The regulatory piece is still open. Fidelity’s staking-enabled FETH filing remains pending SEC review.
Flows have held up better than sentiment suggested. ETH ETF inflows over 30 days reached $524.3 million even as daily flows flattened.
The bear case is about positioning. Long exposure is crowded at 69.6% of Binance accounts, and a Glamsterdam delay could break $1,860 support.
That break risks a slide to $1,500.

Make Your Prediction Count With $25 For Free on Kalshi
Ethereum Price Prediction: Dario Amodei Claude AI Predicts Glamsterdam Reopens the Ceiling
The damage here has been severe and slow. Ethereum peaked near $4,860 in September 2025, then spent five months grinding down through every support it built.
February 2026 broke everything at once, dumping price to $1,740. March through May offered a weak recovery toward $2,450 that failed, and June sent Ethereum back to $1,500.
July and August built a quiet floor near $1,900. That base is exactly what made this week’s candle possible.
Ethereum closed at $2,448.0, up $25.2 for a gain of 1.04%, with a session range from $2,356.3 to $2,483.6. The modest change tells you the vertical leg is already done, and ETH price is holding its gains.
Resistance sits at $2,483.6, then the May swing near $2,450, which is now cleared, then $2,800. Support runs through $2,356 and $2,100, with the $1,860 line being the one that actually matters.
RSI reads 78.70 against a signal line at 62.88. The 16-point gap is elevated without being extreme.
That is a healthier picture than a runaway spike. Momentum is strong, and the rising signal line beneath suggests the move has structural support rather than pure reflex.
Q4 is where this gets settled. Deliver Glamsterdam on schedule, and $3,800 stops looking distant.
Supercharge Your Trading in 2026 With BloFin AI Trading Bots
Ethereum Is Betting One Upgrade Can Reopen the Ceiling. LiquidChain Is Betting the Bigger Constraint Is Between Chains.
Glamsterdam is designed to make Ethereum itself faster, cheaper, and more capable. LiquidChain is targeting a different bottleneck: the fact that even upgraded networks still operate as isolated liquidity islands.
Bitcoin, Ethereum, and Solana each have deep pools of capital, but moving between them still means bridges, duplicated deployments, added fees, and fragmented user flows.
LiquidChain is building a single execution layer that connects all 3, enabling a single deployment to reach multiple ecosystems without rebuilding the same application chain by chain.
That gives LiquidChain a thesis that does not depend on one network winning. It benefits from activity existing across several major ecosystems at once.
The presale is currently priced at $0.01493 with just over $948,000 raised. If the next DeFi cycle is driven by capital moving more freely between chains, LiquidChain is still being valued at the stage where relatively modest inflows can matter.
Unlock Liquidchain Layer 3 Access Here
The post Dario Amodei Claude AI Predicts Ethereum Needs to Do One Thing Before $4,000 Is Back on the Table appeared first on Cryptonews.


Bitcoin has climbed above Strategy’s $75,385 average purchase price after gaining roughly 24% last week, making the company’s next treasury decision a key test for the rally, according to Bitfinex analysts.
Summary
- Bitcoin’s weekly close and retest above $73,500 could confirm the recovery, Bitfinex analysts said.
- Strategy held 840,447 BTC unchanged last week despite raising about $2 billion through MSTR sales.
- Bitfinex placed the next major Bitcoin cost-basis barrier near $86,500.
- Network activity remains near eight-year lows, leaving the rally dependent on sustained spot demand.
Bitfinex analysts told crypto.news that Strategy’s treasury activity has become a key signal after the company stopped selling Bitcoin shortly before BTC broke out of its summer trading range.
The company, which remains the largest publicly disclosed corporate Bitcoin holder, had sold BTC over several weeks to meet obligations connected to its preferred securities. Strategy then reported no purchases or sales for the week ending Aug. 16, removing a source of supply as Bitcoin prepared to move above its range.
Price action has since carried BTC above Strategy’s average acquisition cost for the first time since the company’s recent sales began. Its remaining 840,447 BTC were acquired for approximately $63.36 billion, including fees and expenses, at an average price of $75,385 per coin.
A return to accumulation would support the rally by adding corporate spot demand, according to Bitfinex. Renewed sales at higher prices, however, could place fresh supply above the market and make further gains harder to sustain.
Strategy has remained on the sidelines after raising $2B
Strategy’s latest disclosure has shown that the company remained inactive in the Bitcoin market for another week, even as BTC traded above its average purchase price.
As crypto.news reported from its filing, Strategy sold approximately 18.26 million MSTR shares between Aug. 17 and Aug. 23, raising about $2 billion through its at-the-market offering program. The company made no Bitcoin purchases or sales during the period, keeping its holdings at 840,447 BTC.
Most of the proceeds remained in cash. Strategy transferred $300 million to its existing U.S. dollar reserve, placed about $1.59 billion in a new cash account, and spent $136.4 million repurchasing roughly 1.43 million shares of its STRC perpetual preferred stock.
The transactions increased the company’s dollar reserve to $5.1 billion and took its combined cash position, including the new account, to $6.69 billion. Strategy had disclosed a reserve of about $4.8 billion one week earlier, the figure referenced in the Bitfinex report.
By continuing to raise cash without buying Bitcoin, Strategy has not yet provided the positive spot signal described by Bitfinex. The filing also showed that the company refrained from selling into BTC’s latest strength, avoiding the possible overhead pressure identified by the analysts.
Earlier activity had moved in the opposite direction. Between Aug. 3 and Aug. 9, Strategy sold 1,690 BTC for $108.6 million at an average price of $64,262 and used the proceeds to repurchase about 1.15 million STRC shares.
A week earlier, the company sold another 1,638 BTC for approximately $104.7 million. Proceeds from that transaction funded $52.4 million in STRC dividends and about $52.3 million in preferred-stock repurchases.
Bitcoin needs a $73,500 retest to confirm the recovery
With Strategy’s latest filing showing no transaction, Bitfinex analysts placed greater weight on Bitcoin’s cost-basis levels and the quality of demand supporting the breakout.
“The next few weeks carry two clear signals,” the analysts said. They identified $73,500 as the average purchase price of investors who acquired BTC during the past three to six months.
According to the report, a weekly close above that level followed by a successful retest would confirm that Bitcoin has recovered from its summer range. Holding the zone would also leave recent buyers in profit, reducing the chance that a return toward their cost basis produces immediate selling.
The next important area sits near $86,500, where Bitfinex said investors who bought Bitcoin between 18 months and two years ago would reach their average break-even price. Selling from holders waiting to exit at cost could make the level a source of resistance.
On the downside, the analysts identified $64,500 as the average cost of the newest buyer group. A decline below the level would indicate that Bitcoin’s breakout had gone too far on forced purchases, according to Bitfinex, placing the previous summer range back in focus.
Bitcoin’s rally carried the asset from below $64,000 on Aug. 19 to a three-month high near $79,550. The roughly 24% weekly gain was its strongest advance since March 2023, while the move also reclaimed resistance levels around $65,000, $67,000, $70,000, and $73,500.
ETF demand must replace forced Bitcoin buying
Bitfinex described U.S. spot Bitcoin ETFs and public companies with BTC on their balance sheets as the market’s two main sources of lasting demand. The analysts called the pair the “Two-Complex Spot Bid” because the measure focuses on capital that enters the market and remains invested instead of coins moving between traders.
U.S. spot Bitcoin ETFs recorded approximately $1.9 billion in net inflows during the week ending Aug. 21, including five consecutive inflow sessions. The demand offered evidence that regulated funds were buying alongside traders forced to close bearish positions.
Forced buying still accounted for much of the rally’s speed. As Bitcoin broke through $70,000, a record short-liquidation wave removed nearly $2.7 billion in bearish crypto positions over 24 hours, according to CoinGlass data cited by market analysts.
Short sellers must buy an asset to close liquidated positions, which can accelerate a rally while prices are rising. Bitfinex cautioned that the effect ends once the affected positions have been closed, leaving continued gains dependent on new buyers entering through the spot market.
Onchain participation has not yet supplied clear confirmation. Bitcoin moving across the network remains near its lowest level in eight years, according to the report, indicating that activity among holders has stayed limited despite the price increase.
U.S. investors now face both BTC and MSTR signals
For U.S. investors, Strategy adds a second market signal because its common shares trade on Nasdaq under the MSTR ticker, while spot Bitcoin ETFs provide direct regulated exposure to BTC prices.
Strategy funds parts of their capital structure through U.S. securities markets, including common-stock issuance and several preferred securities. Its weekly Form 8-K disclosures to the U.S. Securities and Exchange Commission allow investors to track Bitcoin transactions, equity sales, cash allocations, and preferred-stock repurchases.
Under a capital framework adopted in June, Strategy’s board authorized a BTC Monetization Program permitting up to $1.25 billion in Bitcoin sales to help fund its dollar reserve. The framework also included separate $1 billion repurchase authorizations for common and preferred securities, as well as provisions for dividend and interest payments.
Strategy’s new $1.59 billion cash account gives management another source of liquidity. According to the Aug. 24 filing, the money may be used for Bitcoin purchases, preferred dividends, debt obligations, or securities repurchases, though the company did not commit the funds to a specific purpose or provide a deployment timetable.
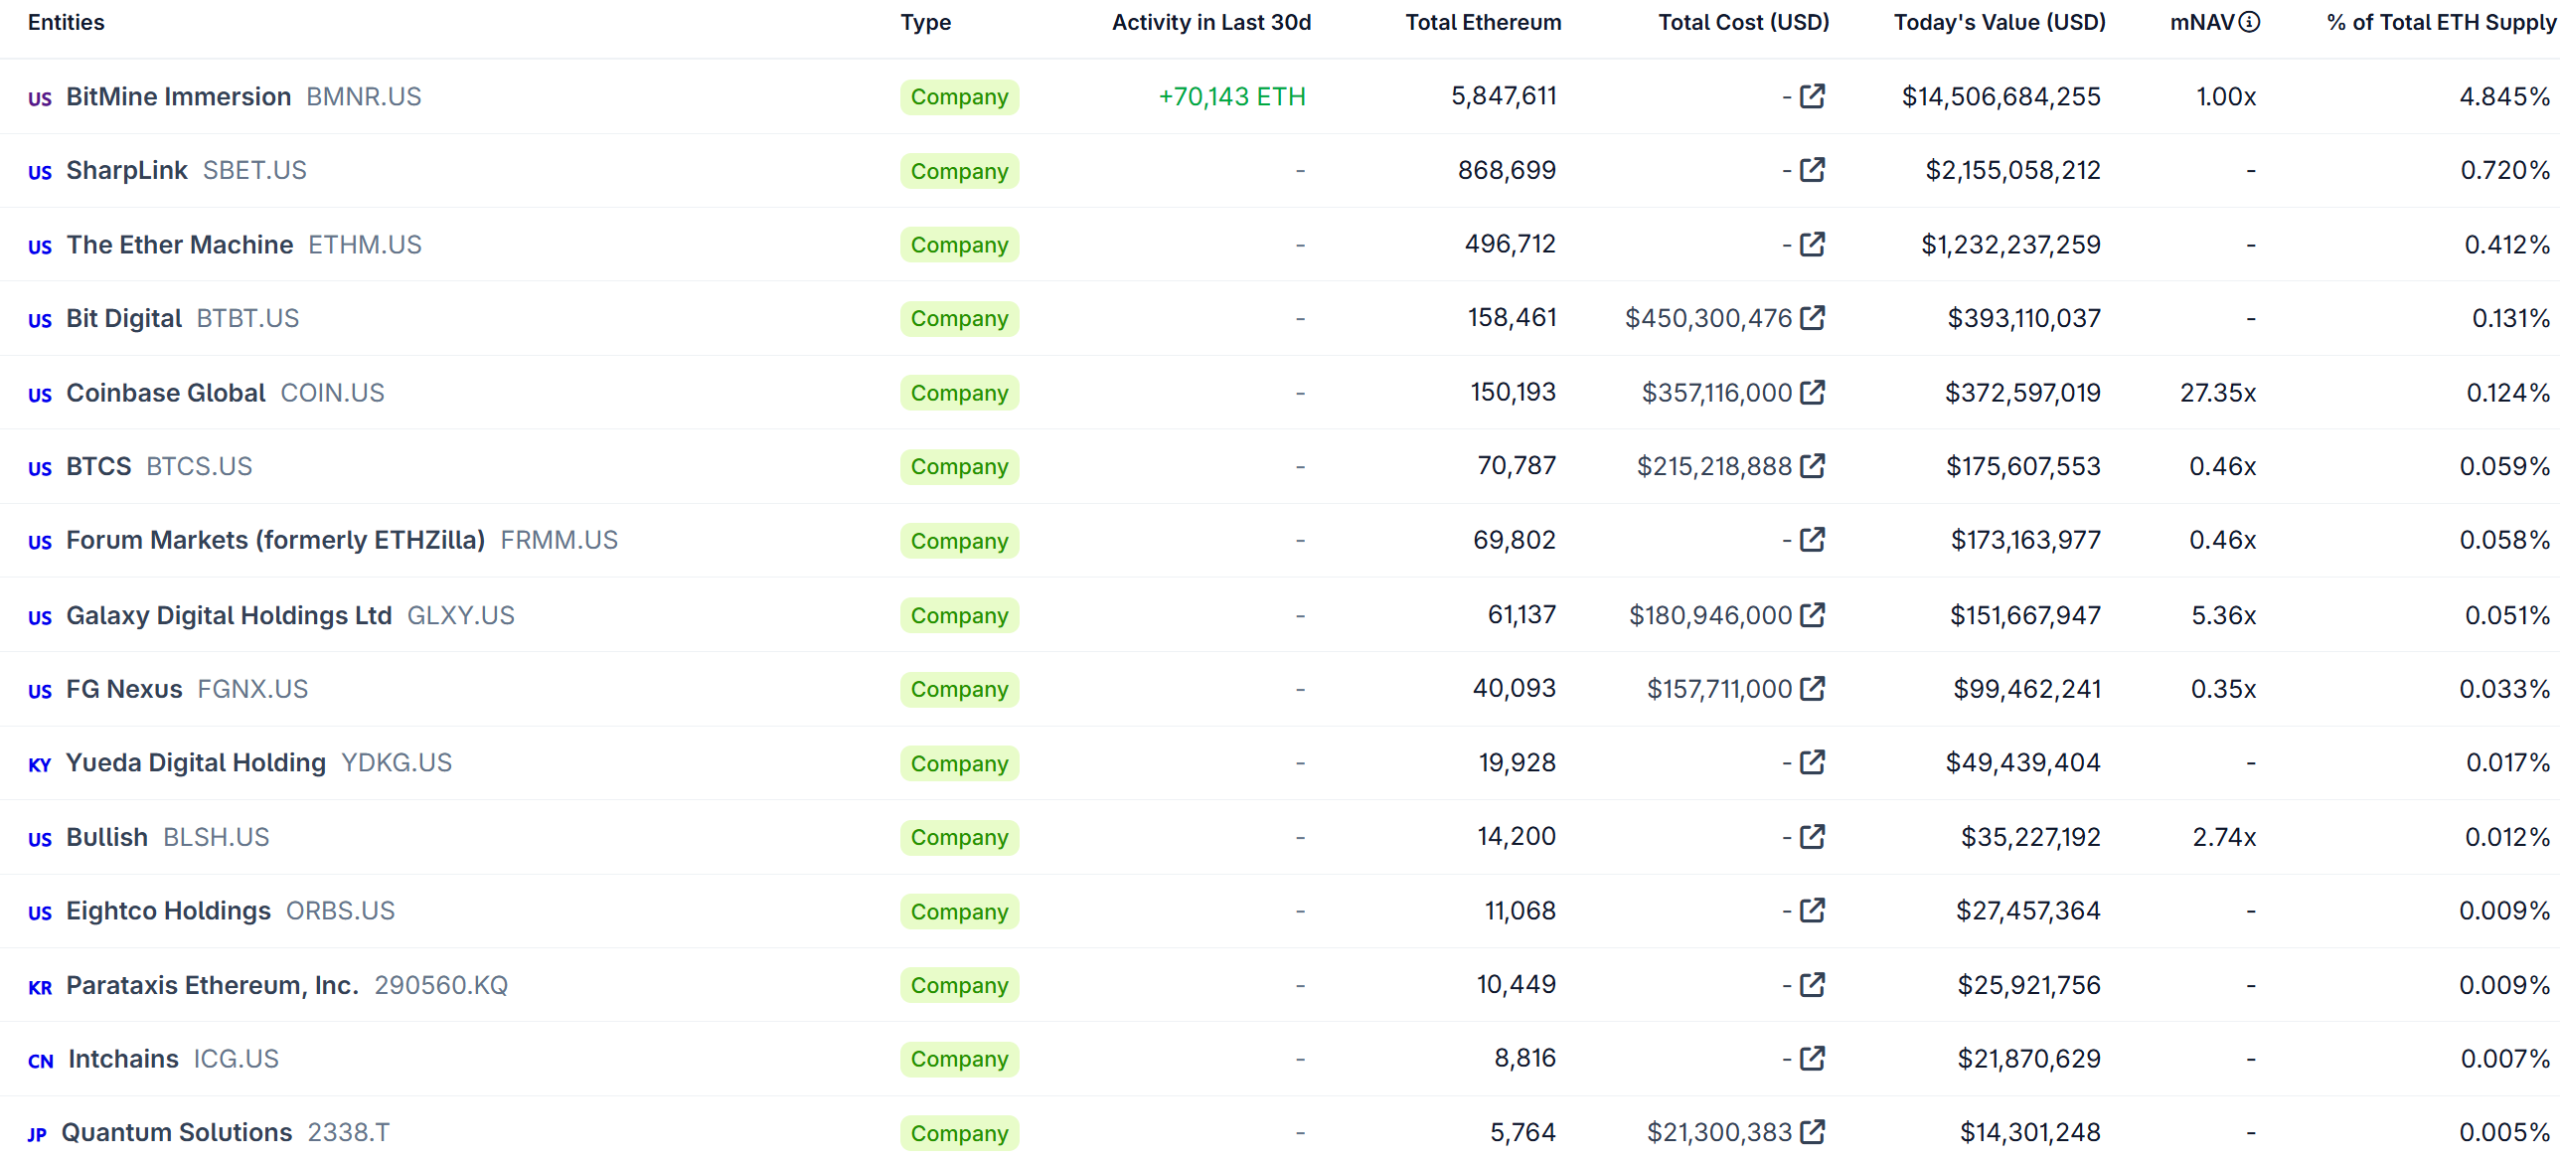
BitMine Immersion Technologies owns 5,847,611 ether. That is 4.79% of every ether in existence, and a tighter grip on Ethereum than Michael Saylor has ever held on Bitcoin.
Chairman Tom Lee told the Bankless podcast the company could reach its 5% goal before the end of 2026. The math is harder than it looks.
BitMine Built Its Ethereum Stack in 14 Months
Saylor’s firm, MicroStrategy, took six years to gather 840,447 Bitcoin. That comes to 4.19% of the coins in circulation.
BitMine passed that share of ether in 14 months. It made its first purchase on June 30, 2025, and has bought every week since. Sixty weeks, no gaps.

Lee credits a plain balance sheet. BitMine paid for the stack with common stock, not loans or convertible notes. Several rival treasuries leaned on those tools and did not survive the downturn.
Ether traded near $2,480 on Monday, up 1% on the day. It rose about 30% last week, its best week since May 2025. BitMine used the rally for its largest weekly ETH purchase since early July.
“It’s about $350 million worth of ETH that we need to acquire to reach 5%… we could reach it by the end of the year,” Tom Lee, chairman of BitMine Immersion Technologies, speaking on Bankless.
Follow us on X to get the latest news as it happens
The 5% Finish Line Keeps Moving
Here is the catch. Ether supply is not fixed, and right now it is growing. The network has added 85,893 ether over the past 30 days.
Total supply now sits at 121.98 million. That is about 1.3 million higher than the figure BitMine’s own disclosures use.

That gap matters because a true 5% means 6.1 million ether. BitMine is about 251,000 tokens short, worth roughly $620 million at Monday’s price. Lee’s $350 million estimate was made before ether’s rally.
What Comes After 5%
Lee rules out selling. BitMine has staked most of its ether, and those 5.07 million tokens generate about $330 million a year. That alone is roughly 12% of all staked ether on the network.
The yield covers the dividend on BMNP. That is a 9.5% preferred stock BitMine sold in June at $80, against a $100 liquidation value. Lee calls it a cheap three-year call option on ether.
The company is also turning into an Ethereum operator. Its validator arm MAVAN, short for Made in America Validator Network, launched in March.
BitMine then helped anchor three groups spun out of the Ethereum Foundation, alongside SharpLink and Ethereum co-founder Joe Lubin.
Lee ties the long-term case to tokenization and artificial intelligence rather than stablecoins. On that Wall Street adoption thesis, he named a number.
“I think Ethereum could easily be over 10,000 in that time frame.”
No listed rival is close. SharpLink, the next largest ether treasury, holds 888,938 tokens, about one-seventh of BitMine’s pile. The real contest is not with them. It is with a supply schedule that keeps printing.
The post BitMine Is About to Own 5% of Ethereum, Tom Lee Reveals What Comes Next appeared first on BeInCrypto.
Crypto World
We Told Microsoft Copilot AI to Be Brutally Realistic About XRP Predicts, This Was Its Target
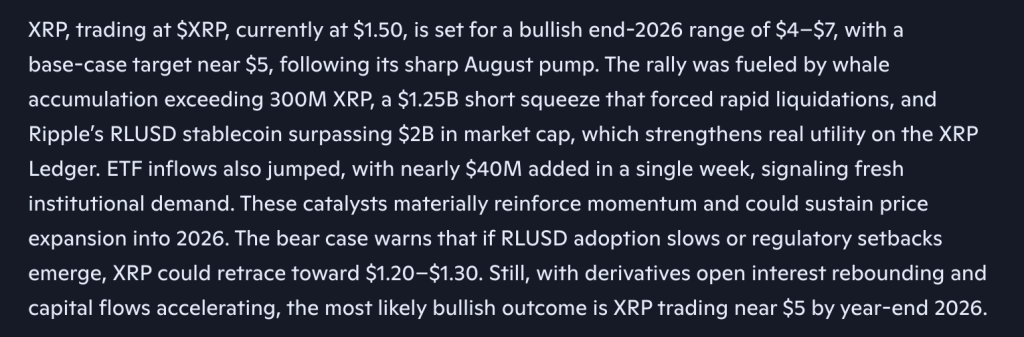
A rally of a few days has repriced an entire year of drift. The latest Microsoft Copilot AI price prediction leans into that, and the model predicts Ripple (XRP) reaching $4 to $7 by the end of 2026, with a base case near $5.
XRP price trades at $1.50 as that call gets made. The August pump is what changed the math.
Whales moved first. Accumulation exceeded 300 million XRP, tightening available supply before the move even registered on most screens.
Then the leverage broke. A $1.25 billion short squeeze forced rapid liquidations and turned a quiet bid into a vertical repricing.
Underneath the speculation, there is real usage. Ripple’s RLUSD stablecoin has surpassed $2 billion in market cap, which strengthens genuine utility on the XRP Ledger.

Institutions are showing up too. ETF inflows jumped by nearly $40 million in a single week, a clear signal of fresh demand rather than retail churn.
Copilot reads these catalysts as materially reinforcing momentum. Together, they could sustain price expansion well into 2026.
The bear case has two triggers. If RLUSD adoption slows or regulatory setbacks emerge, XRP retraces toward $1.20-$1.30.
Neither is guaranteed. With derivatives open interest rebounding and capital flows accelerating, Copilot still frames $5 by year-end 2026 as the most likely bullish outcome.

Make Your Prediction Count With $25 For Free on Kalshi
XRP Price Prediction: Microsoft Copilot AI Predicts the Pump Becomes a Trend
Context makes this breakout look larger than it is. XRP traded above $3.40 last September and spent the following eleven months bleeding value in stages.
February 2026 was the capitulation, with the price flushing to $1.13. What followed was a six-month range roughly between $1.30 and $1.60, then a June breakdown that parked XRP flat at $1.00.
That $1.00 shelf held through July and most of August. Last week it snapped, with price spiking to $1.68 before pulling back.
Now comes the digestion phase. XRP closed at $1.50054, up $0.03841 for a gain of 2.63%, with a session range from $1.43474 to $1.55082.
Resistance sits at $1.55082 first, then the $1.68 spike high, then the old $1.80 shelf. Support runs through $1.43474 and $1.30, with $1.00 as the structural base.
RSI reads 86.45 against a signal line at 51.64. That gap of nearly 35 points is the widest reading on this entire chart.
Nothing about that is sustainable at face value. Buyers are in full control, but the indicator has outrun its own average by a distance that usually demands rest.
Where XRP rests decides everything. Consolidate above $1.43, and the path toward $5 stays credible into next year.
Never Miss a Swing Again: Use AI Copy Trading Bots From CryptoHopper
XRP Has Already Made the First Move. Kalshi Lets Traders Position for What Decides the Second.
A short squeeze can ignite a rally, but it cannot decide whether XRP reaches $5. That depends on what happens next: stablecoin adoption, ETF flows, regulatory developments, and whether fresh demand continues to absorb supply.
Kalshi gives traders another way to express those views before XRP itself prices them in.
(Source: Kalshi XRP)
The platform lets users trade directly on real-world outcomes across crypto, regulation, politics, economic data, Fed decisions, and other events that can move markets. Instead of taking another position in XRP after a vertical rally, traders can isolate the catalyst they believe matters most and trade the outcome itself.
That becomes especially relevant with RSI already above 86. XRP may need time to cool, but the events shaping the longer-term thesis will keep moving while price consolidates.
Eligible new users who join Kalshi through CryptoNews can also receive $25 through our referral link.
The post We Told Microsoft Copilot AI to Be Brutally Realistic About XRP Predicts, This Was Its Target appeared first on Cryptonews.

Belfast City Airport unveils next steps in major extension plan and is seeking the public’s views

Investors’ equity rush helps SIP assets triple in five years

Trump Media CEO Defends Truth API: Will Scrutiny Slow Sign-Ups?





-

 Fashion3 days ago
Weekend Open Thread: Madewell – Corporette.com
-

 Business2 days ago
Musk’s Tesla, SpaceX Confirm $16.8 Billion ‘Terafab’ Chip Plant as World’s Largest Building in Texas
-

 Crypto World3 days ago
anatomy of crypto’s biggest liquidation event since 2021
-

 Business7 days ago
SMA Solar Technology AG (SMTGY) Q2 2026 Earnings Call Transcript
-

 Tech7 days ago
Qwen3.8-27B runs frontier-class coding agents and reasoning locally, no cloud API required
-

 Politics3 days ago
6 months on, Irish renters crushed by effects of government housing bill
-
 NewsBeat3 days ago
The ‘Lucky Dip Gang’ causing carnage for clicks: After five thugs were killed speeding in the wrong direction on a motorway, GUY ADAMS investigates a sick new trend… and why police aren’t even allowed to pursue them
-

 Tech6 days ago
GLM-5.3 hits the API at $1.4/$4.4 per million tokens
-

 News Videos5 days ago
Don’t Leave Your Financial Future To Chance | August 19, 2026
-

 Business2 days ago
Mystery AI Model ‘Ox Alpha’ Draws Developers With Free Access as Chinese Lab Origins Remain Debated
-
Tech7 days ago
5 Of The Most Reliable Car Brands To Consider If You’re Buying A Used SUV
-

 Tech7 days ago
Keychron K8 Ultra 8K review: a great value keyboard with comfort issues
-

 Business6 days ago
Stock Market Today: Tech Futures Slide As Treasury Yields Jump; Nvidia, Micron, Sandisk Sell Off
-

 Business5 days ago
Marvell Shares Jump 7% as Google Chip Deal Confirms Custom AI Silicon Partnership, Analysts
-

 Business4 days ago
Five Below: Kids Discount Retailer Reaps Rich Rewards
-
Business7 days ago
Fabrinet (FN) Q4 2026 Earnings Call Transcript
-

 Tech6 days ago
Ken Okuyama’s Kode89 Supercar Features Three Pedals and a Choice of V12s
-

 Fashion7 days ago
The Dressier Side of Shorts
-

 Politics6 days ago
The House Opinion Article | Security means more than military spending
-

 Business7 days ago
Nasdaq Ticks Higher as Wall Street Awaits Retail Earnings and Weighs Fed’s Next Move at Jackson Hole Meeting
You must be logged in to post a comment Login