
Crypto World
BIS Chief Says Stablecoins Not Credible for Payments at Scale

The Bank for International Settlements is renewing its criticism of stablecoins, questioning their credibility as everyday money as governments worldwide build regulatory frameworks around the tokens.
BIS General Manager Pablo Hernández de Cos, a candidate to succeed European Central Bank President Christine Lagarde next year, argued that stablecoins do not credibly function as a means of payment at scale. He said tokenized bank deposits offer a stronger alternative, Reuters reported on Friday.
“Tokenised deposits offer a more direct path to harness tokenisation while preserving the monetary system’s foundations,” de Cos said.
The comments come as regulators worldwide grapple with stablecoin adoption, while a new study from the BIS-linked Financial Stability Institute (FSI) shows significant differences in how major markets regulate stablecoin issuers.
Stablecoins could lower government borrowing costs
Hernández de Cos acknowledged that stablecoins could lower government borrowing costs, an argument also made by US Treasury Secretary Scott Bessent.
But the effect could cut both ways for consumers. If customers move bank deposits into stablecoins, banks could face higher funding costs and pass those expenses on to households and businesses through higher borrowing rates, Hernández de Cos said.
Related: Visa works with Upbit parent on stablecoin payments, AI commerce
He also pointed to limited interoperability between stablecoin platforms and difficulties consistently applying anti-money laundering controls. Growing use of US dollar-pegged stablecoins outside the US could also undermine monetary sovereignty and weaken domestic monetary policy, he said.
Stablecoin issuers face different rules worldwide
The FSI study, published on Thursday, compared stablecoin regulations in the US, European Union, United Kingdom, Hong Kong and Singapore, finding substantial differences in which entities may issue stablecoins and what other business activities they can conduct.
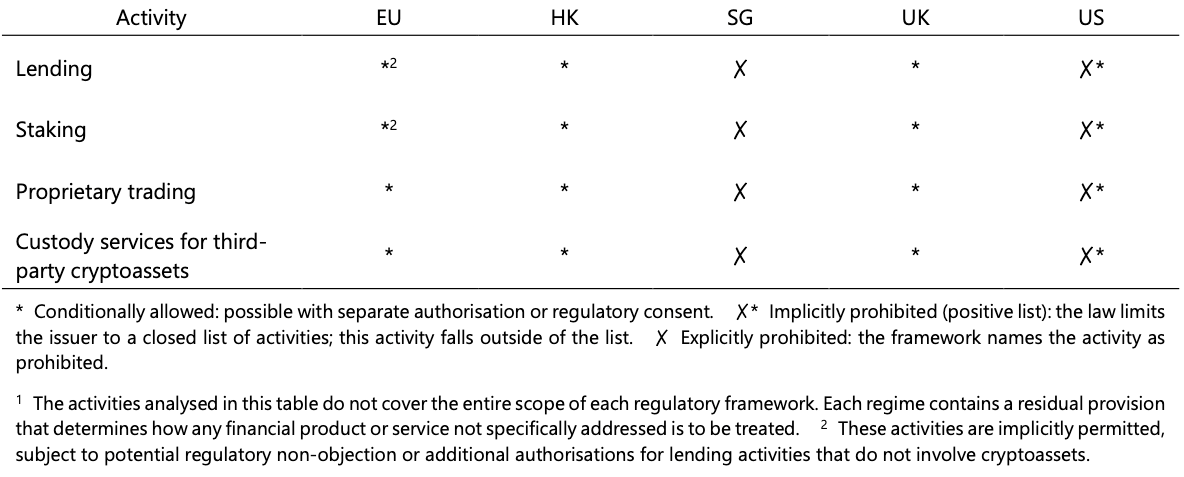
The US and Singapore take relatively restrictive approaches toward non-bank issuers. Under the US GENIUS Act, lending, staking, proprietary trading and custody of third-party crypto assets generally fall outside the activities permitted for payment stablecoin issuers.
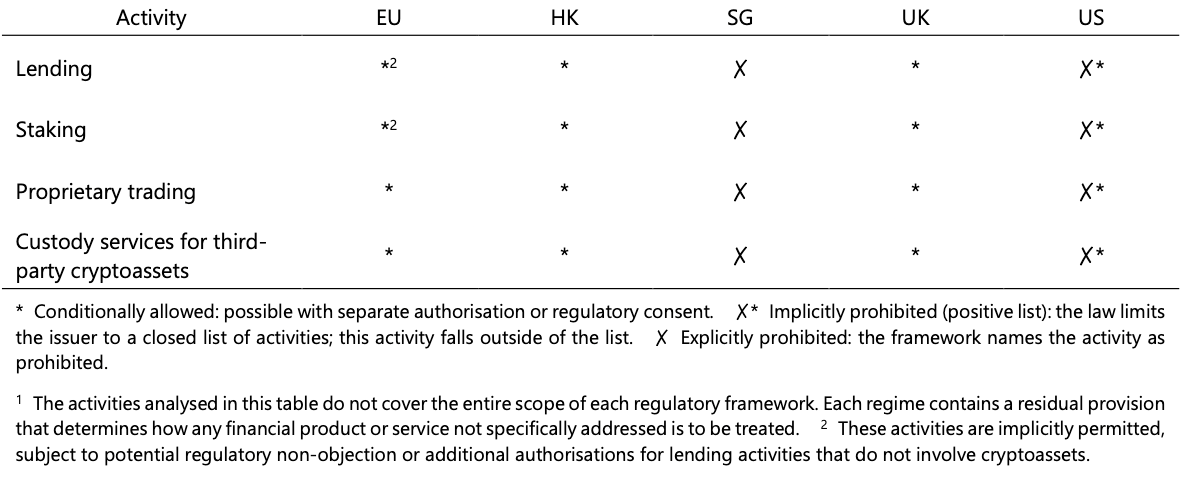
Stablecoin issuer rules across major markets. Source: BIS
Hong Kong, the UK and EU take a less restrictive approach, allowing some additional activities with separate authorization, regulatory consent or other applicable permissions.
The researchers also found that restrictions across all five jurisdictions apply to the issuing entity rather than the wider corporate group, meaning other group members can conduct activities that the stablecoin issuer itself cannot.
Magazine: Korean bank taps Ripple for payments, Pakistan opens crypto licensing: Asia Express



A research paper published this week quantifies what happens when bank deposits move at blockchain speed. The number is large enough to reshape how banks fund the economy, and the crypto industry is building the pipes without acknowledging the consequences.
Summary
- A research paper published on August 25 found that tokenized deposits could reduce U.S. bank lending capacity by $580 billion if the technology reaches widespread adoption, roughly 5% of total bank lending.
- The mechanism is straightforward: banks lend against stable deposits, and if deposits can move on chain in minutes instead of days, the deposit base becomes less stable, forcing banks to hold more liquid reserves and lend less.
- LayerZero and Keeta launched tokenized bank deposits across Ethereum, Solana, Base, and Keeta in July 2026, covering nine fiat currencies and making the theoretical risk operationally real.
- The Bank of England endorsed tokenized deposits as belonging in UK payments infrastructure, and South Korea began trialing them for government spending, indicating that adoption pressure is coming from regulators, not just startups.
- The $580 billion figure assumes a moderate adoption scenario. The paper’s high adoption model projects a reduction of $1.2 trillion in lending capacity, a number that would force structural changes to how U.S. banks fund mortgages, small business loans, and commercial real estate.
The crypto industry has spent two years building infrastructure to put bank deposits on chain. The banking industry has spent two years worrying about what happens when it works. A new research paper puts a number on the worry, and the number is large enough that both sides should be paying closer attention.
How bank lending actually works
This section requires explaining something that most crypto coverage skips entirely: the mechanics of fractional reserve banking and why deposit stability is the load bearing wall of the entire system.
When a customer deposits $1,000 at a bank, the bank does not keep $1,000 in a vault. It keeps a fraction, typically 3% to 10% depending on the bank’s risk profile and regulatory requirements, and lends the rest. That $900 or $970 goes to a mortgage borrower, a small business, or a commercial real estate developer. The borrower spends it, and the recipient deposits it at another bank, which lends most of that out again. This is the money multiplier, and it is the engine that converts $22 trillion in U.S. bank deposits into $12 trillion in bank lending.
The system works because deposits are sticky. A customer who deposits money on Monday does not withdraw it on Tuesday. The bank can rely on a statistical floor, the amount that will remain regardless of individual withdrawals, and lend against that floor with reasonable confidence.
Regulatory frameworks formalize this assumption. Basel III assigns stability scores to different deposit types. Retail deposits from individuals receive the highest stability weighting because individuals rarely move their entire balance in a single day. Corporate deposits receive lower scores because businesses manage cash more actively. Interbank deposits receive the lowest scores because banks move money constantly.
The Liquidity Coverage Ratio, a core Basel III metric, requires banks to hold enough high quality liquid assets to cover 30 days of net cash outflows under stress. The calculation assumes that retail deposits experience outflows of 3% to 10% over 30 days. Corporate deposits face outflow assumptions of 20% to 40%. These percentages determine how much of each deposit type a bank can lend out.
Tokenized deposits threaten to reclassify every deposit into the highest outflow category, because the technology makes any deposit as mobile as an interbank transfer.
What the paper found
The research paper, published on August 25, modeled three scenarios for tokenized deposit adoption in the U.S. banking system.
In the low adoption scenario, covering 5% to 10% of total deposits, the impact on lending capacity is modest: roughly $120 billion, absorbed through minor adjustments to reserve ratios and overnight funding markets. Banks would barely notice, and the adjustment would be indistinguishable from normal quarter to quarter fluctuations in deposit levels.
In the moderate scenario, covering 15% to 25% of deposits, lending capacity falls by $580 billion. This is the headline number, and it represents a meaningful contraction. To put it in context, $580 billion is roughly the total outstanding balance of U.S. auto loans, or about one third of all outstanding commercial and industrial loans. A contraction of that magnitude would not cause a crisis, but it would tighten credit availability for borrowers at the margin, precisely the small businesses and first time homebuyers who are most rate sensitive.
In the high adoption scenario, covering 35% to 50% of deposits, the reduction reaches $1.2 trillion. At that level, banks would need to fundamentally restructure their funding models, shifting from deposit funded lending to wholesale funding markets, securitization, or Federal Home Loan Bank advances. Each of these alternatives is more expensive than deposits, which means the cost of borrowing rises for everyone. The paper estimates that average mortgage rates could increase by 15 to 30 basis points under the high adoption scenario, and small business loan rates could rise by 25 to 50 basis points.
The speed problem
The critical variable is not how much deposits move, but how fast they move. Traditional bank transfers through ACH take one to three business days. Wire transfers settle within hours but cost $25 to $50 and are typically reserved for large transactions. Neither mechanism threatens deposit stability because the friction creates natural resistance to movement.
Even FedNow, the Federal Reserve’s instant payment system launched in 2023, processes transfers in seconds but imposes transaction limits and operates within the existing banking framework. A FedNow transfer moves money from one bank account to another, but both accounts remain within the banking system. The deposit leaves one bank and arrives at another, preserving the aggregate deposit base.
Tokenized deposits are different. A transfer on Ethereum’s base layer settles in roughly 12 seconds. On Solana, it takes under a second. On a Layer 2 like Base, settlement is near instantaneous for the user, with finality following within minutes. More importantly, the deposit can leave the banking system entirely, moving into DeFi protocols, smart contract escrow, or cross chain bridges where no bank holds the underlying balance.
The paper models the impact of settlement speed directly. At one day settlement, the effect on deposit stability is negligible. At one hour settlement, it becomes measurable. At near instant settlement, which is what blockchain infrastructure provides, the deposit stability models that underpin Basel III capital requirements break down entirely, because the statistical assumptions about how long deposits remain were calibrated for a world where moving money takes days, not seconds.
This is not a theoretical concern. The tokenized deposit infrastructure is already live. LayerZero and Keeta deployed tokenized bank deposits across four chains in July 2026. USBC, Uphold, and Vast Bank launched the first retail tokenized U.S. dollar deposits in late 2025. The pipes exist. The question is how much volume they carry and how quickly that volume grows.
Who is building this and why
The builders fall into three categories, each with different motivations and different risk profiles.
Fintech infrastructure companies like LayerZero and Keeta are building the plumbing. Their business model is transaction fees and protocol revenue. More deposit movement means more revenue. They have no incentive to consider the systemic effects on bank lending because those effects are externalities, costs borne by borrowers and the broader economy while the revenue flows to the infrastructure provider.
LayerZero’s deployment covers nine fiat currencies across four blockchains. Keeta’s architecture allows any bank to issue tokenized deposits on its platform, abstracting the blockchain layer so that depositors interact with a familiar banking interface while their funds exist as on chain tokens. The cross chain interoperability means a deposit tokenized on Ethereum can move to Solana in minutes, a level of fungibility that traditional banking infrastructure cannot match.
Banks themselves are experimenting cautiously. JPMorgan’s Kinexys platform processes tokenized deposit transfers between institutional counterparties. MUFG, SMBC, and Mizuho in Japan are piloting tokenized government bonds settled through tokenized central bank reserves. The Bank of Japan’s sandbox uses tokenized central bank reserves as the settlement asset, which is as close to a central bank digital currency as Japan has come without officially launching one. These pilots are controlled environments with known counterparties and limited scale, but the technology they validate is the same technology that, at scale, could destabilize their own deposit bases.
Regulators are the wild card. The Bank of England explicitly endorsed tokenized deposits as part of UK payments infrastructure. Sarah Breeden, the Bank’s deputy governor for financial stability, said tokenized deposits belong in the UK’s future payments architecture alongside stablecoins and a potential digital pound. South Korea is trialing tokenized deposits for government operational spending. The GENIUS Act’s stablecoin framework implicitly endorses the underlying technology by creating a regulated category for digital dollars that compete with bank deposits for the same customer balances.
Regulators are simultaneously promoting the technology and responsible for managing the systemic risk it creates. The contradiction is not lost on central bankers, but the competitive pressure from China’s digital yuan pilots and the private sector’s first mover advantage leaves regulators feeling that the alternative to managed adoption is unmanaged adoption, which is worse.
The stablecoin connection
Tokenized deposits and stablecoins are often discussed as competitors, but the systemic risk analysis reveals them as complements that amplify the same underlying pressure on bank balance sheets.
Stablecoins like USDC and USDT are backed by Treasury bills, commercial paper, and bank deposits. When a user buys $1,000 of USDC, Circle deposits that $1,000 at a partner bank. The bank lends against it. The deposit is still in the banking system; it has just been intermediated through a stablecoin issuer. Circle’s reserve management acts as a buffer, because Circle does not withdraw its deposits based on individual user redemptions. It manages aggregate flows, smoothing the volatility.
Tokenized deposits cut out the intermediary. When a user holds a tokenized deposit, they hold a direct claim on the bank. There is no stablecoin issuer sitting between the depositor and the bank. That directness is marketed as an advantage, eliminating counterparty risk from the stablecoin issuer, but it also means the depositor can withdraw at blockchain speed without Circle or Tether serving as a shock absorber.
The Revolut stablecoin launch in Europe illustrates the competitive dynamics. Revolut has 50 million users who can now hold euros in a stablecoin form. If those users shift from bank deposits to Revolut’s stablecoin or to tokenized deposits, the net effect on European bank lending capacity follows the same pattern the research paper describes for the U.S.
The combined effect of stablecoins and tokenized deposits is larger than either alone. Stablecoins pull deposits out of the banking system and into reserve managed pools. Tokenized deposits keep deposits in the banking system but make them volatile. Both reduce the stable deposit base that banks use to justify long term lending.
The section a competitor could not write
Every existing analysis of tokenized deposits focuses on either the technology (how they work) or the opportunity (how much faster payments become). This piece examines the second order effect that neither the crypto industry nor the banking industry wants to discuss openly.
The crypto industry does not want to discuss it because acknowledging that tokenized deposits reduce lending capacity undermines the narrative that blockchain technology is purely additive. If putting deposits on chain means fewer mortgages, fewer small business loans, and higher borrowing costs, the political and regulatory response will be hostile. The industry has spent years arguing that crypto creates new financial access. The research paper suggests it could restrict existing access by destabilizing the lending infrastructure that funds the real economy.
The banking industry does not want to discuss it because acknowledging the risk validates the technology’s power. If tokenized deposits are not a threat to deposit stability, there is no reason to oppose them. If they are a threat, it means the technology works exactly as described, moving money faster and more efficiently than legacy rails. That admission attracts more investment, more builders, and faster adoption, accelerating the very dynamic banks fear.
The research paper breaks this silence by quantifying the cost. $580 billion in reduced lending capacity is not an existential threat to the U.S. banking system, but it is large enough to change behavior. Banks would need to raise deposit rates to retain customers, increase wholesale funding at higher cost, or reduce lending to lower risk categories. All three responses have consequences for borrowers who depend on affordable credit.
What the Fed would do
The Federal Reserve has not publicly addressed the research paper’s findings, but the institutional response is predictable based on how the Fed handled previous deposit stability threats, including the money market fund reforms of 2010 and 2014 and the SVB deposit flight crisis of 2023.
If tokenized deposit adoption reaches the moderate scenario, the Fed would likely adjust Liquidity Coverage Ratio requirements to classify tokenized deposits as less stable than traditional deposits, assigning them outflow rates of 40% to 60% instead of the 3% to 10% applied to standard retail deposits. This would increase the amount of high quality liquid assets banks must hold against tokenized deposit balances, effectively pricing in the faster withdrawal risk and reducing the lending capacity impact by forcing banks to hold more reserves from day one.
The Fed could also impose holding period requirements or withdrawal speed limits on tokenized deposits, similar to the gates and fees that money market funds implemented after the 2008 financial crisis and strengthened after the March 2020 liquidity stress. These measures would reduce the systemic risk but would also eliminate the speed advantage that makes tokenized deposits attractive in the first place, potentially killing adoption.
A more creative response would involve the Fed launching its own tokenized settlement system through FedNow or a future central bank digital currency, allowing deposits to move quickly within a system the Fed controls and monitors in real time. This would preserve the speed benefit while keeping the systemic risk management within the central bank’s perimeter.
What would prove this analysis wrong
Three developments would invalidate the $580 billion projection.
First, if tokenized deposits adopt voluntary speed limits, settling in hours instead of seconds, the deposit stability impact drops sharply. Some implementations already include programmable settlement delays that can be configured by the issuing bank. If these become standard, the paper’s extreme speed scenarios do not materialize, and the impact reverts to the low adoption model even at higher volume.
Second, if banks create new lending products specifically designed for volatile deposit bases, the lending capacity reduction could be offset. Variable rate loans that reprice in real time, for example, would match asset duration to the shorter deposit duration, preserving lending volume at the cost of transferring interest rate risk to borrowers. Overnight repo style lending, already common in institutional markets, could expand to consumer credit.
Third, if adoption stalls below 10% of total deposits, the low scenario applies and the impact is within the range that existing capital buffers can absorb without behavioral changes. Adoption is not guaranteed to reach the moderate scenario, and the friction of opening tokenized deposit accounts may limit uptake to technologically sophisticated users who represent a small fraction of total deposits.
What to watch
LayerZero and Keeta transaction volume. These platforms provide the clearest real time signal of how fast tokenized deposit adoption is growing. Monthly volume crossing $10 billion would put the system in the low adoption scenario. $100 billion would approach moderate.
Fed commentary on deposit stability. Any mention of tokenized deposits in Federal Reserve speeches, meeting minutes, or Financial Stability Reports would signal that the $580 billion scenario has entered the regulatory conversation. Watch the November 2026 Financial Stability Report specifically.
Basel Committee updates. The Basel Committee on Banking Supervision reviews capital requirements for digital assets periodically. A reclassification of tokenized deposits in the liquidity coverage ratio framework would be the first regulatory acknowledgment of the speed risk at the global standard setting level.
Bank deposit rate movements. If major U.S. banks begin raising deposit rates in markets where tokenized deposit alternatives are available, it would confirm that deposit competition is already affecting bank behavior, even before adoption reaches the paper’s moderate scenario.
Central bank digital currency timelines. A Fed CBDC or expanded FedNow tokenized settlement system would provide a government controlled alternative to private tokenized deposits, potentially capping adoption of private solutions at a level below the paper’s risk thresholds.
What are tokenized deposits?
Tokenized deposits are bank deposits represented as digital tokens on a blockchain. They give the depositor a direct claim on the issuing bank, the same as a traditional deposit, but allow transfers at blockchain speed instead of through traditional banking rails like ACH or wire transfers.
How could tokenized deposits reduce bank lending?
Banks lend against stable deposits, relying on statistical models that assume most depositors will not withdraw their money on any given day. If deposits can move in seconds instead of days, the deposit base becomes less predictable. Banks must hold more liquid reserves to cover faster potential withdrawals, leaving less capital available for loans.
How much lending could be affected?
A research paper published August 25, 2026, projects that moderate adoption of tokenized deposits could reduce U.S. bank lending capacity by $580 billion, roughly the total outstanding balance of U.S. auto loans. High adoption could reduce it by $1.2 trillion.
Are tokenized deposits the same as stablecoins?
No. Stablecoins are issued by non bank entities like Circle or Tether and backed by reserves including Treasury bills and bank deposits. Tokenized deposits are issued by banks and represent a direct deposit claim. Stablecoins add an intermediary between the depositor and the bank. Tokenized deposits remove it, giving the depositor direct access to withdraw at blockchain speed.
Which banks are experimenting with tokenized deposits?
JPMorgan runs Kinexys for institutional tokenized transfers. In Japan, MUFG, SMBC, and Mizuho are piloting tokenized government bonds settled through tokenized central bank reserves. Vast Bank in the U.S. launched the first retail tokenized dollar deposits in late 2025. LayerZero and Keeta deployed multi chain infrastructure covering nine fiat currencies in July 2026.
Would the Federal Reserve intervene?
The Fed has not publicly addressed the research. Based on precedent from money market fund reforms and the SVB crisis response, the Fed would likely adjust liquidity requirements, impose settlement speed limits, or launch its own tokenized settlement system if adoption reaches levels that threaten deposit stability.
How fast can tokenized deposits move?
On Ethereum, settlement takes roughly 12 seconds. On Solana, under one second. On Layer 2 networks like Base, near instantly from the user’s perspective. This speed, compared to one to three business days for ACH transfers, is what makes tokenized deposits both attractive as a product and risky as a systemic factor.
Should I be concerned about tokenized deposits?
This is educational analysis, not investment advice. Tokenized deposits offer faster payments and broader access to banking services. The systemic risk to bank lending is real but depends on adoption rates that remain uncertain. The technology is in early deployment, and regulatory responses will shape outcomes significantly over the next two to three years.
Disclosure: This content is provided by a third party. Neither crypto.news nor the author of this article endorses any product mentioned on this page. Users should conduct their own research before taking any action related to the company.


Eight years after the ICO boom, the regulator is offering a path that the market already abandoned. The capital it is trying to regulate now flows through channels the proposal does not touch.
Summary
- The SEC proposed a framework allowing crypto projects to raise up to $75 million annually through public token sales without full securities registration, using an expanded version of existing Regulation A+ exemptions.
- The proposal arrives roughly eight years after the 2017 to 2018 ICO wave that prompted it, during which projects raised over $20 billion through unregistered token sales before the SEC began systematic enforcement.
- In 2026, capital formation in crypto has shifted almost entirely to mechanisms the proposal does not cover: meme coin launchpads, airdrops, points programs, liquid token listings, and venture rounds with simple agreements for future tokens.
- Pump.fun posted its second highest revenue day in history during the same week the SEC published the proposal, generating more capital formation in 24 hours than most ICOs raised in their entire campaigns.
- The framework requires audited financials, ongoing reporting, and a two year pathway to full registration, requirements that would disqualify the vast majority of projects currently raising capital in the crypto market.
The SEC spent nearly a decade deciding how to let crypto projects raise money legally. By the time it published the answer, the industry had moved on without it. The proposal is technically sound, institutionally rational, and almost certainly irrelevant to the market it claims to serve.
What the proposal actually says
The framework extends Regulation A+, an existing exemption that lets small companies raise up to $75 million per year from the public with lighter disclosure requirements than a full S-1 registration. The SEC’s crypto specific version adds provisions for token specific risks, smart contract audits, and wallet custody disclosures.
Projects using the framework would file a Form 1-A offering circular with the SEC, provide audited financial statements, and submit to ongoing reporting requirements including semiannual updates and current event disclosures. After two years of compliant reporting, the project would transition to full registration under the Securities Exchange Act.
The $75 million ceiling is per issuer per year. Secondary trading would be permitted on registered alternative trading systems, though no major crypto exchange currently operates as one. The proposal explicitly excludes tokens that function solely as payment mechanisms or governance tokens with no expectation of profit, categories that encompass a significant portion of the tokens actually being traded.
The filing process itself is not trivial. Form 1-A requires detailed disclosure of the project’s business plan, the team’s background, use of proceeds, risk factors, and the specific rights the token confers. The SEC reviews each filing before qualification, a process that typically takes three to six months for traditional Reg A+ offerings. For a crypto project operating in a market where narratives shift weekly and opportunities close in days, a six month review period is effectively a death sentence.
Why the timing matters
The ICO boom peaked in January 2018, when projects were raising hundreds of millions through white papers and Ethereum smart contracts. EOS raised $4.1 billion. Telegram raised $1.7 billion. Filecoin raised $257 million in thirty minutes. The total exceeded $20 billion across 2017 and 2018, with virtually none of it passing through a regulatory framework.
The SEC responded with enforcement, not rulemaking. Between 2018 and 2025, the agency brought over 100 enforcement actions against token issuers, settlements that collectively extracted billions in penalties. EOS paid $24 million. Telegram returned $1.2 billion and paid an $18.5 million penalty. Block.one, Kik, LBRY, Ripple, and dozens of smaller projects went through multi year legal battles that established through litigation what the SEC could have established through clear rules at the outset.
The enforcement first approach created a regulatory desert. Projects that wanted to raise capital legally had no clear path. Projects that raised capital illegally faced enforcement risk years after the sale, when the money was already spent and the team had often dissolved. Neither outcome served investors.
The Clarity Act lost its legislative window in August 2026, with Polymarket odds on passage collapsing from 82% to 16%. The GENIUS Act missed its statutory deadline by four months. In the absence of legislation, the SEC is now writing the rules that Congress could not pass.
That sequence matters because it reveals the proposal’s actual function. This is not a growth initiative designed to encourage crypto capital formation. It is a regulatory land grab, an attempt to establish SEC jurisdiction over token issuance before another agency or legislative framework takes the territory.
How capital actually forms in crypto now
This is the section a competitor could not have written, because it requires mapping the full landscape of how projects raise money in 2026 and comparing it against what the SEC’s framework would cover.
Meme coin launchpads. Pump.fun on Solana generated its second highest revenue day in history during the same week the SEC published its proposal. The platform lets anyone create and launch a token in minutes, with capital flowing through bonding curves that price tokens algorithmically. No white paper, no team disclosure, no audited financials. The new Solana meme token $fone reached a $35 million market capitalization on its debut day. None of this activity would fit within the SEC’s framework because meme tokens explicitly disclaim any profit expectation tied to the efforts of the issuer.
The scale of launchpad activity dwarfs anything Reg A+ has produced. Pump.fun and competing platforms processed tens of thousands of token launches per month through 2025 and 2026. Four.Meme on BNB Chain briefly flipped Pump.fun in daily revenue, demonstrating that the model replicates across chains. The total capital flowing through these platforms on a monthly basis exceeds what Regulation A+ has facilitated in its entire eleven year history across all asset classes.
Airdrops and points programs. Projects like Hyperliquid, which hit an all time high above $86 this week, distributed tokens through activity based airdrops that reward users for trading on the platform. The user receives tokens for past behavior, not in exchange for capital. The SEC’s framework governs sales, not distributions, leaving the fastest growing capital formation mechanism untouched.
The airdrop model has become the dominant go to market strategy for new protocols. Blur, Eigen, Ethena, Jupiter, and dozens of other projects used points programs that converted to token distributions. The total value distributed through airdrops in 2025 alone exceeded $10 billion, more than the annual Reg A+ ceiling of $75 million by a factor of 130.
Venture rounds with SAFTs. Serious infrastructure projects still raise through Simple Agreements for Future Tokens, private placement instruments sold to accredited investors under Regulation D. These rounds are already legal, already common, and do not need a new public offering framework. The $75 million Reg A+ path offers nothing that a $50 million Reg D round does not, except more paperwork, more SEC oversight, and a longer timeline.
Venture funding in crypto totaled approximately $13.7 billion in 2025 and is on pace for a similar number in 2026, according to Galaxy Research. Virtually all of it flows through Reg D exemptions or offshore structures. The projects that need capital have already found it. The SEC’s proposal offers a slower, more expensive alternative to channels that work perfectly well.
Liquid token listings. Many projects skip fundraising entirely and launch tokens directly on decentralized exchanges, establishing price discovery through liquidity pools on Uniswap, Raydium, or Orca. The listing is permissionless. The capital comes from traders, not investors, and the distinction matters legally even if it does not matter economically.
The compliance arithmetic
The proposal requires audited financial statements. For a crypto startup, an audit from a firm willing to opine on a token project costs between $150,000 and $500,000 annually. The major accounting firms, Deloitte, PwC, EY, and KPMG, have been selective about crypto audit engagements, leaving most projects reliant on smaller firms with limited blockchain expertise.
The Form 1-A filing itself requires legal counsel familiar with both securities law and token mechanics. Specialized crypto securities attorneys charge $500 to $1,200 per hour. A complete Reg A+ filing, including the offering circular, legal opinion, and SEC review process, costs between $200,000 and $500,000 in legal fees alone.
Add ongoing reporting requirements, including semiannual updates, current event disclosures, and eventually full Exchange Act reporting after two years, and a project using this framework would spend roughly $400,000 to $1,000,000 annually on compliance before writing a line of code.
For a project raising $75 million, those costs represent 0.5% to 1.3% of the raise, which is manageable. But the projects raising $75 million are already doing it through Reg D private placements that cost a fraction as much and impose fewer ongoing obligations. The projects that would benefit most from a public offering path, early stage teams with limited capital who want to sell tokens to retail investors, are precisely the ones that cannot afford the compliance burden.
The two year pathway to full registration creates an additional deterrent. A project that files under Reg A+ in 2027 would face full Exchange Act reporting requirements by 2029, including quarterly filings, annual reports, proxy statements, and insider trading restrictions. In an industry where the average project lifespan is measured in months and the median token loses 80% of its value within a year of launch, committing to four years of SEC oversight is a bet that few founders would take voluntarily.
Who actually benefits
The proposal serves three constituencies, none of which are the crypto native projects it appears to target.
First, traditional financial institutions that want to issue tokenized securities. Banks, asset managers, and broker dealers already have compliance infrastructure, audit relationships, and legal teams. For them, a Reg A+ token offering is a minor extension of existing operations. JPMorgan’s Kinexys platform, Goldman Sachs’ tokenized money market fund, and Franklin Templeton’s on chain treasury fund could all issue tokens under this framework without materially changing their cost structure. The proposal essentially codifies what they were already planning to do.
Second, the SEC itself. By establishing a regulatory pathway that requires filing, disclosure, and eventual full registration, the agency creates jurisdiction over a category of assets that courts have inconsistently classified. Every project that files under this framework validates the SEC’s authority over tokens, regardless of whether the framework generates meaningful adoption. Institutional turf in Washington is measured by the number of entities under your jurisdiction, and this proposal expands the SEC’s count.
Third, compliance service providers. Law firms, audit firms, and registered transfer agents would gain a new revenue stream from token issuers navigating the framework. The Revolut stablecoin launch and similar institutional entries into crypto have already expanded demand for crypto compliance services. The Reg A+ framework would extend that demand further, creating a recurring revenue base for firms that specialize in SEC filings.
The precedent problem
Regulation A+ has existed since 2015 under the JOBS Act Title IV. In its traditional form, it has been used by roughly 800 companies, raising a collective $8 billion over eleven years. The vast majority of those offerings were for small companies in real estate, cannabis, and consumer products. Very few raised the full $75 million, with the median raise closer to $5 million to $15 million.
By comparison, crypto projects raised $7.5 billion through token sales in 2024 alone, according to CoinGecko data, almost none of it through SEC regulated channels. The entire eleven year output of Reg A+ across all industries barely exceeds what crypto raised in a single year through unregulated mechanisms.
The adoption rate tells the story. Even in traditional capital markets, Reg A+ is a niche product used by companies that are too small for an IPO and too retail focused for pure Reg D. IPOs, Reg D private placements, direct listings, and SPACs handle the overwhelming majority of capital formation. There is no reason to expect crypto’s adoption rate to exceed the traditional market’s, and several reasons to expect it to be lower, including the availability of permissionless alternatives that do not exist in traditional finance.
The $TRUMP token comparison
The $TRUMP meme coin raised more capital through trading activity in its first week than most Reg A+ offerings raise in their entire campaign. It did so without an offering circular, without audited financials, and without any interaction with the SEC’s filing system.
The comparison is not entirely fair. The $TRUMP token and the thousands of meme coins launched daily on platforms like Pump.fun are overwhelmingly speculative, short lived, and carry no pretense of building anything. But that is precisely the point. The SEC’s proposal addresses a category of activity, legitimate projects seeking to raise capital from the public with proper disclosure, that has already been abandoned by the market in favor of mechanisms that operate entirely outside the regulatory perimeter.
The market has voted, and it voted for speed over safety, permissionlessness over process, and memes over fundamentals. Whether that is good for investors is debatable. Whether the SEC’s proposal changes it is not.
What would prove this analysis wrong
Two scenarios would make the SEC’s proposal relevant.
First, if a major crypto project, one with a recognized brand and significant user base, files under the framework and raises a full $75 million, it would validate the pathway as a real alternative to Reg D and offshore token sales. The first successful filing would create precedent and potentially attract followers who see regulatory clarity as a competitive advantage in serving institutional capital.
Second, if the SEC begins enforcing against airdrops, points programs, and launchpad mechanisms, projects currently using those channels would need a legal alternative. The Reg A+ framework would become relevant not because it is attractive, but because everything else is blocked. The SEC has shown willingness to expand its enforcement scope in the past, and a future where meme coin launchpads face enforcement risk is not implausible.
A third possibility is that foreign regulators adopt similar frameworks that require reciprocal compliance for U.S. market access. If the EU, UK, or Singapore require Reg A+ equivalent disclosures for tokens sold to their citizens, projects targeting global audiences would face compliance pressure from multiple jurisdictions simultaneously.
What to watch
Filing activity in the first 90 days. The comment period runs through November 2026. If no project files a Form 1-A within three months of the final rule, the framework is effectively dead on arrival. Watch for announcements from tokenized securities platforms or institutional issuers as the likely first movers.
SEC enforcement against airdrops and launchpads. Any enforcement action against a major airdrop campaign or meme coin launchpad would immediately change the calculus for projects choosing between regulated and unregulated capital formation. The proposal becomes important only if the alternatives become dangerous.
Congressional response. If the Clarity Act or a similar bill revives in the next session, it could preempt the SEC’s framework entirely. Legislative activity in the first quarter of 2027 will determine whether the Reg A+ pathway has a future or becomes another abandoned regulatory experiment.
Institutional adoption of tokenized securities. Banks and asset managers issuing tokenized bonds, funds, or equity under this framework would generate volume even if crypto native projects ignore it. Watch for filings from Goldman Sachs, JPMorgan, or BlackRock affiliates as the bellwether for institutional interest.
Pump.fun and launchpad revenue trends. If launchpad revenue declines due to market conditions or regulatory pressure, the pool of capital seeking a home grows, and regulated pathways become more attractive by default. Conversely, if launchpad volume keeps growing, the SEC’s framework becomes increasingly irrelevant.
What is the SEC’s new crypto token sale proposal?
The SEC proposed allowing crypto projects to raise up to $75 million annually through public token sales using an expanded Regulation A+ exemption. Projects would file disclosure documents, provide audited financials, and transition to full SEC registration after two years of compliant reporting.
How much can crypto projects raise under this framework?
The ceiling is $75 million per issuer per year. Secondary trading would be permitted on registered alternative trading systems. The filing and review process typically takes three to six months.
Why is the SEC proposing this now?
Congress failed to pass comprehensive crypto legislation. The Clarity Act lost its window and the GENIUS Act missed its deadline. The SEC is writing rules through its existing regulatory authority because the legislative path is blocked, establishing jurisdiction before another agency takes the territory.
How does this compare to how crypto projects actually raise money?
Most crypto capital formation in 2026 happens through meme coin launchpads, airdrops, points programs, and venture rounds using SAFTs under Regulation D. None of these mechanisms would be covered by the SEC’s proposal. Airdrops alone distributed more than $10 billion in 2025.
What does the proposal cost to comply with?
Audited financials, legal review, Form 1-A filing, and ongoing reporting cost an estimated $400,000 to $1,000,000 annually. Projects raising $75 million can absorb this. Early stage teams raising smaller amounts face compliance costs that consume a disproportionate share of their raise.
Will meme coin launchpads be affected?
Not directly. Meme tokens typically disclaim any profit expectation tied to the issuer’s efforts, placing them outside the securities framework. The proposal governs sales of tokens with investment characteristics, not speculative trading tokens launched on permissionless platforms.
Who would actually use this framework?
Traditional financial institutions issuing tokenized securities are the most likely adopters. Banks, asset managers, and broker dealers already have the compliance infrastructure, audit relationships, and legal teams to absorb the requirements. Crypto native projects have cheaper, faster, and less restrictive alternatives available.
Is this good or bad for the crypto market?
This is educational analysis, not investment advice. The framework provides a legal pathway that did not previously exist, which is structurally positive for projects that want regulatory certainty. Whether it generates meaningful adoption depends on enforcement activity against unregulated alternatives and the willingness of established institutions to issue tokens through SEC channels.
Disclosure: This content is provided by a third party. Neither crypto.news nor the author of this article endorses any product mentioned on this page. Users should conduct their own research before taking any action related to the company.

Iran could resume attacks on U.S. bases, radar systems, and other facilities that support maritime surveillance and command-and-control systems that help protect and coordinate shipping through the Strait. More dangerous still, it could attempt to strike U.S. naval vessels directly. Iran is believed to possess anti-ship missiles that, at least on paper, can threaten American warships operating in and around the Persian Gulf. The harder problem is locating and tracking moving targets with sufficient precision, why is why better intelligence, including potentially from partners such as Russia or China, could become an important variable.
So far, Tehran has generally had strong reasons to avoid inflicting large numbers of American casualties, which could trigger a much larger U.S. campaign against Iran’s military and civilian infrastructure. But that restraint depends on Iranian leaders continuing to believe that avoiding such a confrontation leaves them better off. If they conclude instead that prolonged blockade and economic pressure are steadily worsening their position, the threshold for taking that risk could fall. Tehran has already warned that major U.S. attacks on Iranian energy or civilian infrastructure would be met with strikes against comparable infrastructure across the region, potentially widening the confrontation well beyond Hormuz.

The issue extends well beyond parents and children. Similar patterns appear in marriages and among siblings, friendships, and other close bonds. Therapists have become too quick to support ending difficult relationships instead of helping people develop the skills to repair them.
In reality, walking away from another person often solves one problem while creating others. Increasingly, my practice sees clients who have ended relationships that took a lifetime to build. The immediate conflict may be gone, but so is the connection. Many become lonelier and less equipped to navigate conflict, disappointment, and repair elsewhere.
Tragically, many who end contact with loved ones also become more distressed in the long run, since close relationships are a foundation of mental health. Maintaining social connection is a form of “fitness” that requires ongoing cultivation. Even when strained or difficult, human bonds provide belonging, support, identity, and resilience. That may matter more now than ever, as many meaningful in-person social interactions are dwindling in the face of digital alternatives.
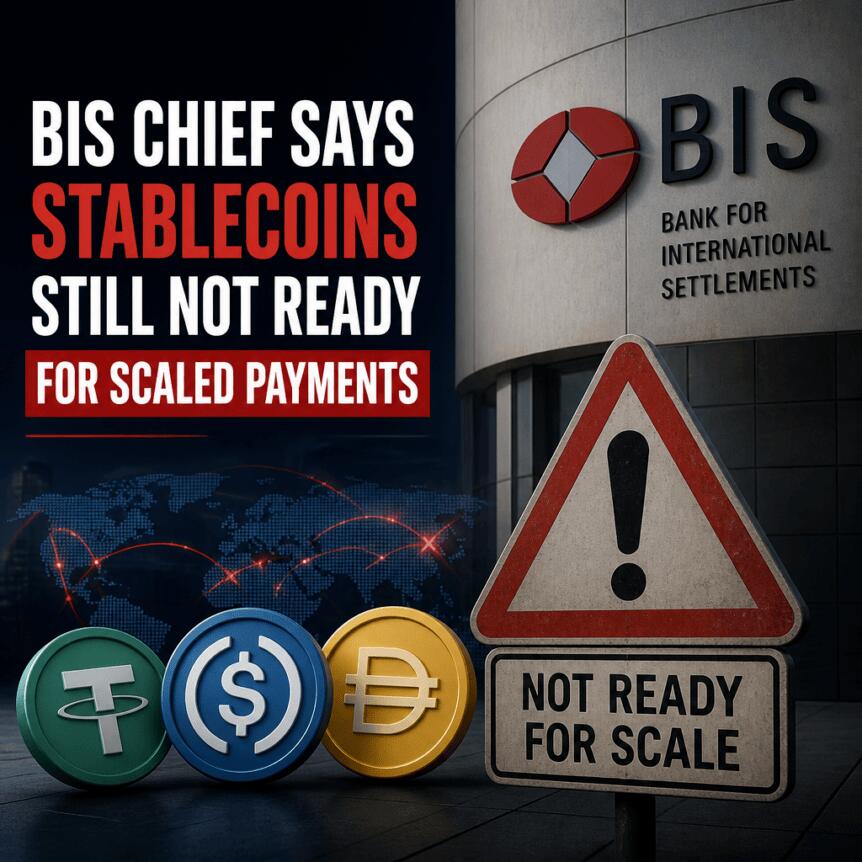
The Bank for International Settlements (BIS) is renewing its warnings about stablecoins, arguing that many of the tokens marketed as “everyday money” still lack credibility for payments at scale. Speaking ahead of a potential leadership transition at the BIS—where General Manager Pablo Hernández de Cos is a candidate to succeed European Central Bank President Christine Lagarde—he framed tokenized bank deposits as a more dependable route to bring distributed ledger technology into the financial system.
According to Reuters, Hernández de Cos said stablecoins do not function credibly as a means of payment at scale. Instead, he pointed to tokenized bank deposits as a way to “harness tokenisation” while keeping the monetary system’s underlying structure intact.
Key takeaways
- BIS leadership argues stablecoins struggle to operate as reliable payment instruments at scale, while tokenized bank deposits better preserve existing monetary foundations.
- Hernández de Cos acknowledged potential borrowing-cost benefits from stablecoins but warned the impact could shift costs onto consumers if banks face higher funding expenses.
- He cited practical and regulatory concerns, including limited interoperability between stablecoin systems and challenges in applying anti-money-laundering controls consistently.
- A BIS-linked Financial Stability Institute (FSI) study found major differences across jurisdictions in who can issue stablecoins and what related activities are allowed.
- In all five markets analyzed (US, EU, UK, Hong Kong, Singapore), restrictions generally apply to the issuing entity itself, not the broader corporate group.
BIS challenges the “stablecoin as payments” narrative
Hernández de Cos’ remarks build on a familiar BIS stance: stablecoins may be useful as technology, but they do not automatically meet the standards regulators expect from everyday money. Reuters reports that he questioned stablecoins’ ability to provide payments at scale, suggesting they remain fragmented rather than integrated into a coherent payment ecosystem.
To him, the critical distinction is structural. Tokenized bank deposits, he argued, offer a “more direct path” to adopt tokenization while maintaining the monetary system’s foundations. The implication for investors and builders is that the BIS view prioritizes regulated money-like instruments inside the banking perimeter over privately issued token substitutes for deposits.
Hernández de Cos also addressed a key argument often raised in favor of stablecoins: their potential to reduce government borrowing costs. Reuters notes that he acknowledged this possibility, including an earlier push for the idea by US Treasury Secretary Scott Bessent.
However, he warned that benefits could reverse depending on where deposits ultimately sit. If customers shift bank deposits into stablecoins, banks could experience higher funding costs. In turn, those costs may be passed on through higher borrowing rates for households and businesses, according to Hernández de Cos.
Interoperability and compliance remain unresolved
Beyond macro-financial considerations, the BIS general manager flagged operational hurdles. Reuters reports he cited limited interoperability between stablecoin platforms and the difficulty of consistently applying anti-money-laundering controls.
Those points matter because payment functionality is not only about price stability or faster settlement—it also depends on reliable exchange routes, consistent monitoring, and enforceable compliance procedures. If stablecoin systems remain siloed and controls vary across ecosystems, regulators may view the risks as shifting rather than being eliminated.
He also argued that increasing use of US dollar-pegged stablecoins outside the US could weaken monetary sovereignty and constrain domestic monetary policy. In practice, this frames stablecoins not simply as an asset class, but as a mechanism that could alter currency transmission and policy effectiveness when adoption spreads beyond national boundaries.
FSI study maps how rules differ for stablecoin issuers
Hernández de Cos’ critique comes alongside new research from the BIS-linked Financial Stability Institute (FSI). The FSI study, published on Thursday, compared stablecoin regulation in the United States, European Union, United Kingdom, Hong Kong, and Singapore, focusing on which entities may issue stablecoins and what additional activities they can carry out.
According to the FSI report, the jurisdictions diverge substantially. The differences are not only theoretical: they affect business models, compliance scope, and the potential for stablecoin issuers to expand into other crypto-adjacent services.
More restrictive approaches in the US and Singapore
The US and Singapore were found to take relatively restrictive stances toward non-bank issuers. Reuters reports that under the US GENIUS Act, activities such as lending, staking, proprietary trading, and custody of third-party crypto assets generally fall outside what payment stablecoin issuers can do.
For market participants, this kind of boundary-setting can have major implications. If issuance permissions are narrower, the route from stablecoin issuance to broader market roles—such as custody platforms or leveraged-yield strategies—may be constrained. That may reduce certain risks regulators associate with highly integrated crypto firms, but it can also limit product innovation.
Hong Kong, the UK, and the EU allow some additional activities
By contrast, the FSI study found that Hong Kong, the UK, and EU frameworks are less restrictive in allowing additional activities, though typically subject to separate authorization, regulatory consent, or other applicable permissions.
This means that while those jurisdictions may permit issuers to do more, they may also introduce layered regulatory gating. In other words, the rules may broaden the eligible activity set, but still aim to ensure that riskier functions remain tightly supervised.
Restrictions target issuers, not entire corporate groups
One of the more technically important findings in the FSI research is how limits are applied. Reuters reports the study found that restrictions in all five jurisdictions generally target the issuing entity rather than the wider corporate group.
That structure creates an asymmetry: other companies within the same corporate group may be allowed to conduct activities that the stablecoin issuer itself is prohibited from doing. For regulators, this can complicate risk oversight across corporate arrangements. For users and investors, it matters because the stablecoin’s risk profile may depend not only on the issuer, but on the group ecosystem behind it.
In practice, the “entity-level” approach can affect how risks propagate—especially when compliance processes, operational controls, and internal governance differ across group members.
As stablecoin regulation continues to take shape, the next question for markets is whether governments move toward more consistent rules that address interoperability and compliance across ecosystems, or whether they continue with fragmented frameworks that leave gaps between issuer permissions and broader group activities. BIS critiques like these suggest regulators may keep pressure on stablecoins to prove not just stability, but payment-grade reliability and governance.


Nine consecutive sessions of net inflows have narrowed the gap with Bitcoin ETFs to almost nothing. But spot volume tells a different story, and one that matters more.
Summary
- U.S. spot Ethereum ETFs recorded $225.8 million in net inflows on August 28, their strongest single day in 10 months, extending a buying streak to nine consecutive sessions worth $1.42 billion.
- BlackRock’s ETHA fund absorbed $1.02 billion of that total, or 72% of all category flows, without missing a single day of net buying across the entire run.
- The gap between Ethereum and Bitcoin ETF daily inflows narrowed to just $16.5 million on August 28, down from a factor of 10 on the first day of both streaks.
- Spot trading volume has softened to its 16th percentile year on year since the rally began on August 19, raising questions about whether flows alone can sustain price momentum.
- Ethereum is hovering around its 200 week moving average for the first time since breaking support in late January, with roughly 1.1 million ETH accumulated near that level acting as potential resistance.
The nine day streak that began on August 17 has been the most concentrated burst of institutional Ethereum buying since the spot ETFs launched. It has also been the most lopsided. One issuer, BlackRock, has accounted for nearly three quarters of every dollar that entered the category. Everyone else has been a rounding error.
How the streak took shape
The buying run started quietly. On August 17, Ethereum ETFs drew a fraction of what their Bitcoin counterparts pulled in. Bitcoin funds took roughly ten times as much that day. The ratio narrowed steadily over the following sessions, and by August 28 the two categories were separated by just $16.5 million, with Ethereum ETFs logging $225.8 million against Bitcoin’s $242.3 million.
The last day of net outflows for the Ethereum funds was August 11. Farside Investors data shows August 14 as the only session since then to register no net flow in either direction. From August 17 onward, every session has been positive.
Fidelity’s FETH posted its best day of the run on August 28 at $56.2 million. BlackRock’s staked Ethereum product, ETHB, added $20.7 million that same day. But neither fund has matched ETHA’s consistency. BlackRock has bought on all nine days without exception.
The streak’s trajectory accelerated in the second half. Daily inflows roughly doubled between the first four sessions and the last four, suggesting that early allocations triggered follow on buying from advisors and model portfolios that use flow momentum as an input signal.
BlackRock’s dominance in numbers
Blockchain analytics firm Arkham flagged the streak on August 27, counting $889.8 million across the first eight days for ETHA alone. The ninth session pushed the total past $1 billion. That figure matches Farside Investors’ tally exactly, providing independent confirmation from on chain data.
That 72% share is not normal. During the initial wave of spot Ethereum ETF inflows in mid 2025, BlackRock held roughly 40% to 50% of category flows. The current concentration suggests that whatever is driving the buying is either originating from a narrow set of institutional allocators who route through BlackRock, or that other issuers have not matched BlackRock’s distribution reach into the channels where this capital sits.
The distribution advantage is structural, not accidental. BlackRock’s iShares platform serves more than 30,000 registered investment advisors in the United States. Its model portfolio program, which automatically rebalances client allocations across asset classes, can generate ETF inflows at scale without individual advisor action. When the model portfolio team adds or increases an ETH allocation, every client account subscribed to that model buys ETHA simultaneously.
No other Ethereum ETF issuer has comparable model portfolio penetration. Fidelity serves a large advisory base but its crypto allocation models have been more conservative. Grayscale’s ETHE, converted from a closed end trust, continues to see net outflows from legacy holders who bought at premiums and are taking the opportunity to exit at net asset value.
Goldman Sachs agreed in August to acquire Neos Investments for up to $2.25 billion, a deal that will add Bitcoin and Ethereum options income ETFs to its platform. The move signals that the largest banks now view crypto ETF distribution as a revenue line worth paying billions for, not a compliance headache to avoid. But Goldman’s entry will take quarters to affect flows. For now, BlackRock operates in a distribution class of its own.
What is pulling the money in
The buying is coming from outside crypto, according to Max Shannon, senior research associate at Bitwise Europe. Shannon attributed the flows to a marked rise in cross asset risk appetite, the firm’s proprietary measure of how aggressively traditional market participants are deploying capital into higher volatility assets.
The catalyst was macroeconomic. The U.S. Treasury announced on August 19 that it would at least double its long dated bond buyback operations starting September 9. The announcement compressed long end yields, weakened the dollar, and revived what traders call the debasement trade, the same thesis that fueled Bitcoin’s climb past $80,000 on Treasury buybacks earlier in August.
Ethereum caught the spillover. But it caught less of it than almost everything else. That disconnect between inflow magnitude and price response is the central puzzle of this streak.
The timing also matters. The streak began four days after Fed Chair Kevin Warsh’s August 11 speech that was interpreted as mildly dovish, and it accelerated after the Treasury buyback announcement on August 19. Warsh’s Jackson Hole keynote on August 28, which shifted rate hike odds to 56%, came on the streak’s final recorded day. Whether the buying continues into September will reveal whether the flows were a macro trade or a structural allocation shift.
The underperformance paradox
Here is the arithmetic that makes this streak unusual. Ethereum ETFs have absorbed $1.42 billion in nine days. The price has moved roughly 5% over the same period, from approximately $2,350 to $2,477. That ratio, dollars in per percentage point gained, is far worse than what Bitcoin, Solana, XRP, or Hyperliquid delivered with comparable or smaller inflows.
Bitcoin gained 15% on $2.8 billion in ETF inflows over the same stretch. XRP surged 50% in a single week on ETF anticipation and whale accumulation. Hyperliquid hit a new all time high above $86. Even ZEC jumped 45% following the Grayscale Zcash spot ETF launch, on inflows that were a fraction of Ethereum’s.
Shannon called the lag warranted, noting that capital has rotated into higher beta blue chip names such as ZEC, XRP, SOL, and HYPE, which have outperformed. Bitwise’s dispersion index rose during the week, suggesting the market is being driven by a broader set of narratives and Ethereum is not the one carrying the story.
The implication is uncomfortable for ETH holders. The ETF flows are real, but they are functioning more as a slow accumulation by allocators who treat ETH as a portfolio weight to maintain, not as a conviction bet on outperformance. The money is entering because models say it should be there, not because traders believe ETH will outperform on the next leg.
The volume problem
This is the section a competitor could not have written, because it requires reconciling two data sets that point in opposite directions.
Flows are reflexive and momentum based. When money enters ETFs, the authorized participants, typically large broker dealers like Jane Street, Virtu, and Flow Traders, must buy ETH on the spot market to create new fund shares. That buying should, in theory, push spot volume higher, which attracts momentum traders, which generates more inflows. The feedback loop works until it does not.
Right now, it is not working. Spot volume has softened to its 16th percentile year on year since the rally began on August 19, according to Shannon. That means 84% of the trading days over the past year have seen more spot activity than the current stretch.
The authorized participant mechanism explains part of the gap. AP creation activity runs through institutional channels, primarily OTC desks and dark pools, that do not always register in public exchange volume data. Some portion of the $1.42 billion in ETF buying may have occurred off exchange, creating real demand without visible volume.
But even accounting for OTC activity, the volume picture is weak. On chain transfer volume for ETH, which captures all movement regardless of venue, has not shown a corresponding spike. The buying is narrow, concentrated in the AP creation flow, and the broader market is watching from the sidelines.
This creates a fragile setup. The ETF inflows are supplying buying pressure, but the broader market is not confirming it with volume. If the inflows pause for even a few sessions, there is no organic spot demand waiting to catch the price. The authorized participants who bought ETH to create shares become the marginal sellers if redemptions begin, and they will sell into the same thin order books they bought from.
A pickup in spot volume is needed for the market to sustain its footing, Shannon said. Without it, the current price level is being held up by a single buyer class.
The 200 week moving average test
Ethereum is hovering around its 200 week moving average for the first time since it broke support in late January. That level, roughly $2,450 to $2,500 at the time of writing, has historically acted as a floor during secular bull markets and a ceiling during bear phases.
During the 2018 to 2020 bear market, ETH spent 22 months below its 200 week moving average before finally reclaiming it in late 2020. During the 2022 to 2023 drawdown, it dropped below the level in June 2022 and did not reclaim it until October 2023. Each reclaim preceded a major rally. Each failure preceded further drawdown.
Shannon noted that investors accumulated roughly 1.1 million ETH around the current level, worth approximately $2.7 billion at current prices. That block could act as temporary resistance if those holders sell into strength, creating an overhead supply problem that even $225 million per day in ETF inflows may not be enough to absorb.
The Ethereum ETF inflow streak that ended in April lasted four days and coincided with ETH briefly touching $2,400. The current streak has lasted more than twice as long and pushed the price only marginally higher. That diminishing return is the clearest signal that flows alone are not sufficient without volume confirmation.
The Grayscale drag
Any analysis of Ethereum ETF flows is incomplete without accounting for Grayscale’s ETHE, which has been a persistent source of selling pressure since its conversion from a closed end trust in July 2024.
ETHE entered the conversion with approximately $9 billion in assets under management. Legacy holders who had purchased trust shares at significant premiums, sometimes 20% to 40% above net asset value, finally gained the ability to redeem at NAV. The resulting outflows have been steady, with billions leaving the fund over the subsequent two years.
During the current nine day streak, ETHE outflows have moderated but not ceased. The net category figure of $1.42 billion already accounts for ETHE redemptions, meaning the gross buying from ETHA, FETH, and other funds was materially higher than the net number suggests.
If ETHE outflows accelerate, as they have during previous price spikes that offered exit opportunities to legacy holders, the net flow picture could deteriorate rapidly even as ETHA continues buying. This is the hidden risk in the headline streak number.
How this compares to Bitcoin’s ETF dynamics
Bitcoin spot ETFs pulled in $2.8 billion over eight consecutive days through August 27, running in parallel with the Ethereum streak. But the two patterns diverge on a critical dimension.
Bitcoin’s inflows came alongside a 15% price move from roughly $68,000 to above $80,000. Ethereum’s $1.42 billion came alongside a 5% move. The flow to price transmission is roughly three times less efficient for ETH.
Part of the explanation is structural. Bitcoin’s free float is smaller relative to its market capitalization, meaning ETF buying absorbs a larger percentage of available supply. Long term holders, often called diamond hands, reduce the circulating supply further. Ethereum’s supply dynamics are more complex, with staking lockups affecting roughly 28% of supply, DeFi collateral locking another 12% to 15%, and layer 2 bridge deposits fluctuating daily. These pools reduce and release circulating supply in ways that do not track ETF flows cleanly.
The fee structure also matters. Bitcoin ETFs charge between 0.12% and 0.25% in expense ratios. Ethereum ETFs charge similar rates, but the staked variants like ETHB pass through staking yield minus a management fee. The yield component complicates the comparison, because ETHB inflows are partly a fixed income trade, not purely a directional bet on ETH price.
What would prove this thesis wrong
Two developments would invalidate the bearish read on Ethereum’s flow efficiency.
First, if spot volume recovers to its 50th percentile or above while inflows continue, the reflexive loop would reengage and the price response would accelerate. That would mean the current lag is a timing issue, not a structural one. A catalyst like the Ethereum Foundation announcing a major protocol upgrade or a high profile DeFi launch could generate the organic trading interest that is currently missing.
Second, if the staked ETH products like ETHB begin taking a meaningfully larger share of flows, it would suggest that the buying is not just passive allocation but active conviction in Ethereum’s yield bearing properties. ETHB took $20.7 million on August 28, a solid day but still a fraction of ETHA’s total. A shift toward staking products would signal deeper institutional commitment and a longer expected holding period.
Third, if Grayscale’s ETHE outflows approach zero, the net flow picture improves dramatically. The gross buying from ETHA alone would translate more cleanly into price impact without the Grayscale drag offsetting it.
What to watch
Daily spot volume relative to ETF creation activity. If the authorized participants are the only consistent buyers, the price is on borrowed time. Watch for spot volume climbing back above its 30th percentile year on year as a minimum threshold for sustainability.
The gap between ETHA and the rest of the field. If BlackRock’s share drops below 60% while total flows hold, it means distribution is broadening. If BlackRock’s share stays above 70% and total flows slow, the streak was one firm’s allocation cycle, not a market trend.
Ethereum’s 200 week moving average. A weekly close above $2,500 with rising volume would be the first clean reclaim of this level since January. A rejection with declining volume would confirm the overhead supply thesis.
Redemption signals from Grayscale’s ETHE. Grayscale has been a consistent source of outflows since its conversion from a closed end trust. If ETHE redemptions accelerate while ETHA inflows slow, the net effect on ETH supply could turn negative despite the headline streak.
The September Fed decision. Rate hike odds jumped to 56% after Warsh’s Jackson Hole keynote. A hike would pressure the risk appetite trade that Shannon identified as the primary driver of the current inflows. A hold or dovish surprise would extend it.
What are Ethereum ETFs?
Ethereum ETFs are exchange traded funds that hold ether directly and trade on U.S. stock exchanges. They allow investors to gain exposure to ETH through a brokerage account without managing private keys or interacting with cryptocurrency exchanges.
How much have Ethereum ETFs taken in during August 2026?
U.S. spot Ethereum ETFs recorded $1.42 billion in net inflows over nine consecutive trading sessions from August 17 through August 28, 2026. The single largest day was August 28 at $225.8 million, the strongest session in 10 months.
Why is BlackRock dominant in Ethereum ETF flows?
BlackRock’s ETHA fund took $1.02 billion of the $1.42 billion total, or 72% of all category flows. BlackRock’s iShares platform serves more than 30,000 registered investment advisors, and its model portfolio program can generate ETF inflows at scale without individual advisor action. No other issuer has comparable distribution reach.
Is the Ethereum ETF inflow streak bullish for ETH price?
The flows are net positive for price, but the transmission has been weak. ETH rose roughly 5% during a period that saw $1.42 billion in inflows, while Bitcoin gained 15% on $2.8 billion. Spot volume at its 16th percentile year on year suggests the broader market is not confirming the ETF driven demand.
How do Ethereum ETF flows compare to Bitcoin ETF flows?
On August 28, Ethereum ETFs took $225.8 million versus Bitcoin’s $242.3 million, a gap of just $16.5 million. At the start of the parallel streaks on August 17, Bitcoin’s daily inflows were roughly ten times larger. The gap narrowing suggests Ethereum is catching up in institutional allocation, though the price response remains weaker.
What is the 200 week moving average and why does it matter?
The 200 week moving average is a long term trend indicator that smooths price data over nearly four years. Ethereum is hovering around this level for the first time since January 2026. Historically, sustained trading above this average has signaled bull market conditions, while a failure to hold it has preceded extended drawdowns lasting a year or more.
What are staked Ethereum ETFs?
Staked Ethereum ETFs like BlackRock’s ETHB hold ether that is locked in Ethereum’s proof of stake consensus mechanism, earning yield for the fund. These products offer investors exposure to both ETH price movement and staking rewards, currently around 3% to 4% annually. They charge a management fee that reduces the net yield passed through to shareholders.
Should I invest in Ethereum ETFs based on this streak?
This is educational analysis, not investment advice. The inflow streak reflects institutional buying patterns but does not guarantee future price appreciation. Spot volume, macroeconomic conditions, Grayscale redemption dynamics, and the sustainability of BlackRock’s concentration in category flows all present risks that prospective investors should evaluate independently.
Disclaimer: This article is for informational purposes only and does not constitute financial advice. Cryptocurrency investments carry significant risk. Always conduct your own research before making investment decisions. Published August 29, 2026.
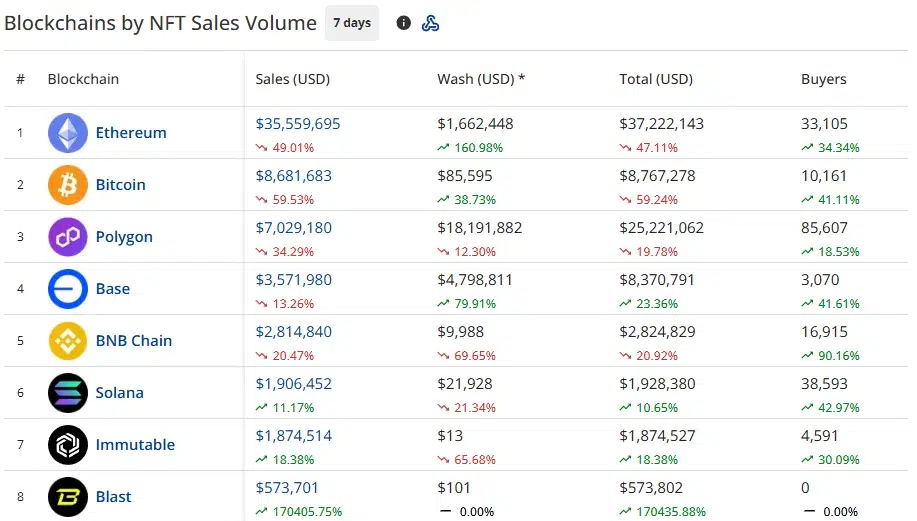
NFT sales volume fell 44.70% to $63.33 million over the past seven days, even as the number of buyer and seller addresses increased sharply across the market.
Summary
- NFT sales fell 44.70% to $63.33 million, while transactions declined 14.13% to 802,330.
- Buyer addresses rose 30.48% to 227,316, while seller addresses climbed 54.64% to 247,373.
- Ethereum led with $35.56 million in sales despite recording a 49.01% weekly decline.
- Bitcoin placed second with $8.68 million as sales fell 59.53% and buyers rose 41.11%.
- Courtyard led collections with $6.09 million, while a Bitcoin NFT sold for $2.14 million.
According to data from CryptoSlam, captured on Aug. 29 with the seven-day filter selected, global NFT sales declined to approximately $63.33 million from about $114.5 million during the equivalent prior period.
Buyer addresses increased 30.48% to 227,316, while seller addresses jumped 54.64% to 247,373. The figures represent blockchain addresses rather than confirmed individual users.
Transactions moved in the opposite direction, falling 14.13% to 802,330. The combination of more participating addresses and fewer transactions indicates that activity was spread across a larger address base, although the data alone cannot establish whether each address represented a separate market participant.
The NFT decline occurred as the wider crypto market pulled back. Bitcoin traded near $77,600, while Ether changed hands around $2,440 on Aug. 29. The global crypto market capitalization stood at approximately $2.71 trillion, down more than 2% over 24 hours.
The NFT and cryptocurrency declines occurred during the same period, but the available data does not establish a direct causal relationship between them.
Ethereum leads NFT sales with $35.6 million
Ethereum remained the largest NFT blockchain with $35.56 million in organic sales, down 49.01% from the prior seven-day period. The network also registered $1.66 million in wash-trading volume, which CryptoSlam reports separately from organic sales.
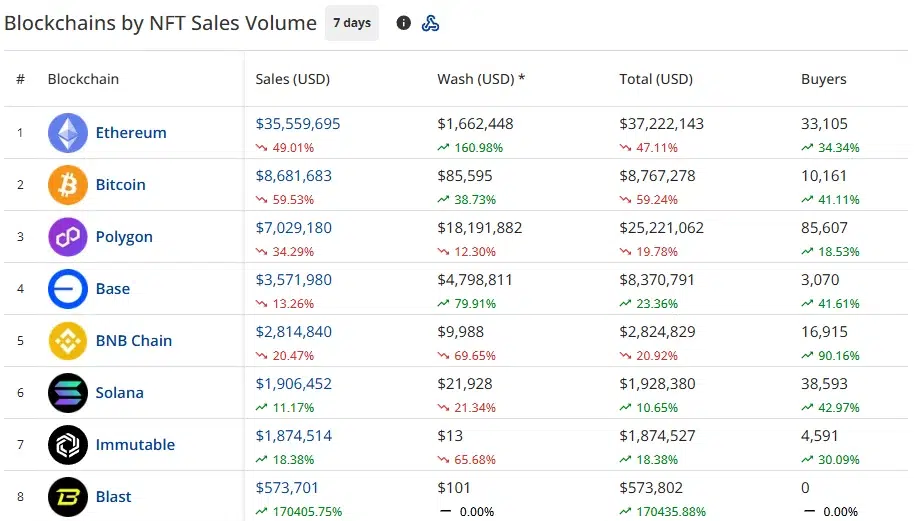
Ethereum’s total volume, including wash trading, reached $37.22 million. Its buyer count increased 34.34% to 33,105 despite the drop in sales.
Bitcoin ranked second with $8.68 million in sales, a 59.53% decline. Wash volume totaled $85,595, bringing its combined figure to $8.77 million. Bitcoin buyer addresses rose 41.11% to 10,161.
Polygon recorded $7.03 million in organic sales, down 34.29%. However, the network also showed $18.19 million in wash volume, more than twice its organic figure. Polygon’s buyer count declined 18.53% to 85,607.
Base placed fourth with $3.57 million in sales, down 13.26%, while its buyers increased 41.61% to 3,070. The network recorded $4.80 million in wash trading, lifting combined volume to $8.37 million.
BNB Chain followed with $2.81 million, down 20.47%, even as buyer addresses rose 90.16% to 16,915. Solana was the strongest performer among the six leading networks, with sales increasing 11.17% to $1.91 million and buyers rising 42.97% to 38,593.
The six networks accounted for approximately $59.56 million, or 94% of global organic NFT sales. Immutable added $1.87 million after an 18.38% increase.
Courtyard tops weekly NFT collection sales
Polygon-based Courtyard remained the leading collection with $6.09 million in sales, although its total fell by 37.55%. The collection generated 98,531 transactions, down 55.66%, from 17,969 buyer and 11,755 seller addresses.
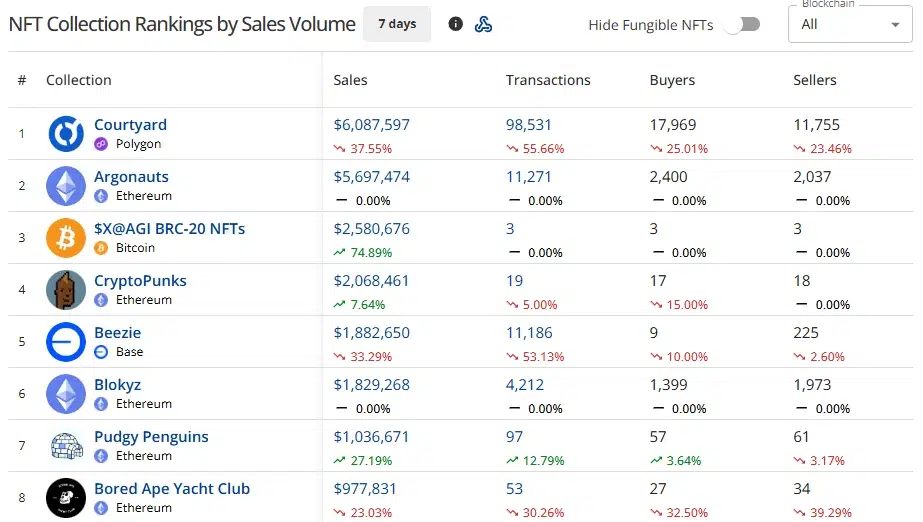
Ethereum-based Argonauts ranked second with $5.70 million across 11,271 transactions. CryptoSlam showed no prior-period percentage change for the collection, suggesting the comparison data was unavailable or unchanged in the captured dashboard.
Bitcoin’s $X@AGI BRC-20 NFTs placed third with $2.58 million, up 74.89%. Only three transactions, three buyers, and three sellers produced the entire total, making its volume highly concentrated rather than representative of broad collectible trading.
CryptoPunks followed with $2.07 million, up 7.64%. The collection recorded 19 sales involving 17 buyer and 18 seller addresses.
Base-based Beezie generated $1.88 million, down 33.29%, from 11,186 transactions. Only nine buyer addresses participated, compared with 225 seller addresses.
Blokyz ranked sixth with $1.83 million from 4,212 transactions, while Pudgy Penguins placed seventh. Pudgy Penguins sales rose 27.19% to $1.04 million as transactions increased 12.79% to 97.
Bored Ape Yacht Club followed with $977,831 in sales, down 23.03%, alongside 53 transactions and 27 buyer addresses.
Bitcoin NFTs lead high-value NFT sales
A $X@AGI BRC-20 NFT produced the week’s largest individual sale at $2.14 million, settling for 27.1798 BTC about two days before the snapshot. CryptoSlam classified the transaction as an NFT sale, but the dashboard does not provide enough transaction-level information to determine its underlying economic purpose.
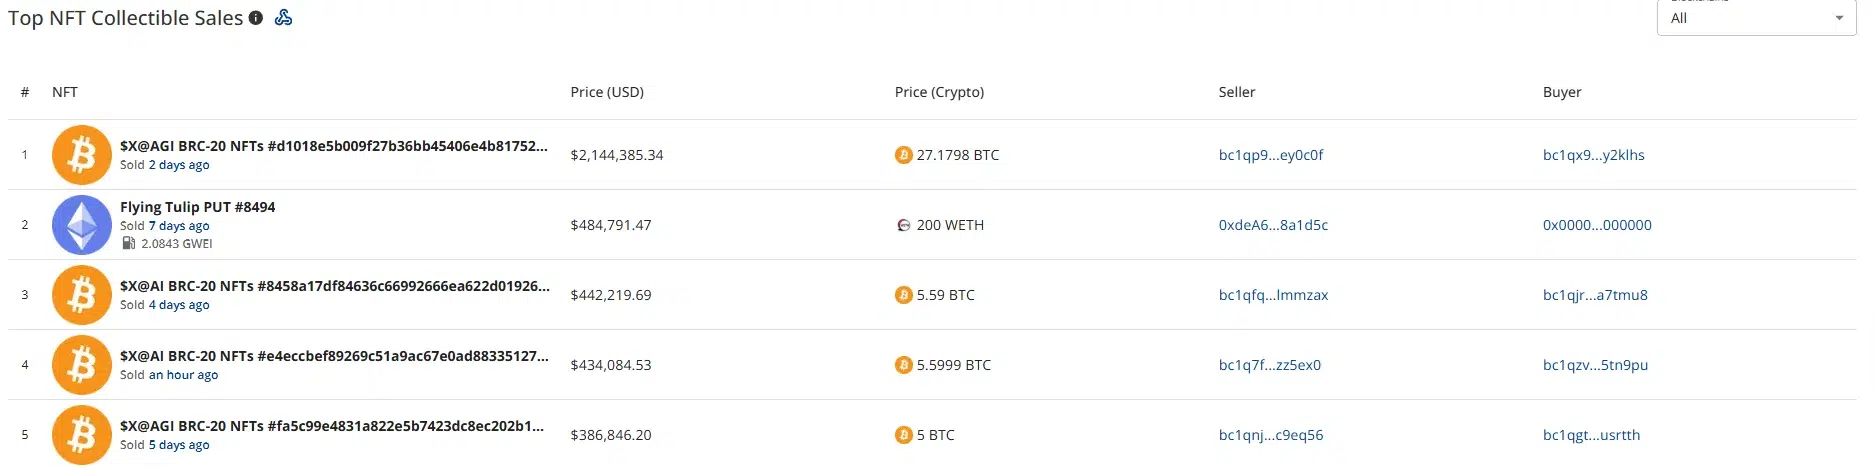
The sale represented approximately 83% of the collection’s $2.58 million weekly volume and 3.4% of global NFT sales. Such concentration means the collection’s weekly increase largely reflected one transaction.
Flying Tulip PUT #8494 ranked second at $484,791, settled for 200 wrapped Ether seven days earlier. Flying Tulip’s official materials describe its putNFTs as ERC-721 tokens encoding perpetual put positions and redemption rights. The transaction therefore involved a tokenized financial position rather than an ordinary profile-picture or digital-art collectible.
Another $X@AGI BRC-20 NFT ranked third after selling for $442,220, or 5.59 BTC, approximately four days earlier.
A separate NFT from the same collection changed hands for $434,085, settled in 5.5999 BTC, around one hour before the screenshot was captured.
The collection also produced the fifth-largest sale, valued at $386,846 and settled for 5 BTC five days earlier. Four of the five largest transactions came from $X@AGI BRC-20 NFTs, showing that a small number of high-value Bitcoin trades shaped the week’s top-sales table.

The Bank for International Settlements (BIS) has renewed its scepticism toward stablecoins, arguing that they have not proven credible as everyday payment instruments at scale—even as governments push forward with regulatory regimes for tokenised cash.
In comments reported by Reuters, BIS General Manager Pablo Hernández de Cos said stablecoins struggle to function reliably as a means of payment. He contrasted them with tokenised bank deposits, which he described as a more direct way to bring tokenisation into finance while preserving the core foundations of the monetary system. Hernández de Cos, who is also a candidate to succeed European Central Bank President Christine Lagarde next year, tied the debate to how regulators should weigh innovation against financial stability and monetary policy control.
Key takeaways
- The BIS argues stablecoins are not credible for everyday payments at scale, while tokenised deposits are viewed as a more workable alternative.
- Hernández de Cos acknowledged potential benefits such as lower government borrowing costs, but warned of possible knock-on effects for bank funding and consumer borrowing rates.
- BIS/FSI research highlights major differences across the US, EU, UK, Hong Kong, and Singapore in who can issue stablecoins and what activities are permitted.
- Regulatory limits often apply to the issuing entity itself, not the broader corporate group—creating potential structural workarounds.
Why the BIS says stablecoins fall short as “money in practice”
Hernández de Cos’ central critique focuses on usability and reliability. He said stablecoins do not credibly operate as a large-scale payment channel. Instead, he argued that tokenised deposits could better achieve the goal of harnessing tokenisation while maintaining the monetary system’s institutional backbone.
The BIS position comes at a time when stablecoins are increasingly moving from pilot use cases toward broader market adoption. That shift has forced regulators to confront questions that go beyond technology: Are stablecoins effectively “money” for day-to-day transactions? Do they improve settlement efficiency without eroding oversight? And how should authorities prevent misuse while still allowing legitimate payments innovation?
Lower borrowing costs—who pays the trade-off?
While criticising stablecoins as payments instruments, Hernández de Cos did not dismiss the economic arguments in favour of them. He specifically referenced the idea—also raised publicly by US Treasury Secretary Scott Bessent—that stablecoins could help reduce government borrowing costs.
However, the BIS general manager suggested the effect could be uneven across the financial system and potentially come with consumer consequences. If customers shift bank deposits into stablecoins, banks may face higher funding costs. According to Hernández de Cos, those costs could then be reflected through higher borrowing rates for households and businesses.
That framing matters for investors and users because it highlights an often-overlooked point: stablecoin growth may not just redistribute benefits. It can also alter funding structures within banking, potentially changing how credit is priced and transmitted through the economy.
Regulatory friction: interoperability and anti-money laundering controls
Beyond payments effectiveness, Hernández de Cos pointed to operational and compliance challenges. He cited limited interoperability between stablecoin platforms, arguing that cross-platform connectivity remains insufficient for smooth, consistent use. He also flagged difficulties in consistently applying anti-money laundering (AML) controls—an issue that becomes more sensitive as stablecoins circulate beyond domestic markets.
He further warned that increased use of US dollar-pegged stablecoins outside the United States could undermine monetary sovereignty and weaken the effectiveness of domestic monetary policy. In other words, even if stablecoins are designed to track a fiat unit, their broader circulation can still create policy spillovers and complicate how authorities manage liquidity and credit conditions.
BIS-linked research finds uneven stablecoin rules worldwide
The BIS critique is accompanied by findings from a new study released by the Financial Stability Institute (FSI), a BIS-linked body. In a publication released Thursday, FSI compared stablecoin regulatory frameworks across the United States, European Union, United Kingdom, Hong Kong, and Singapore, focusing on who is permitted to issue stablecoins and what other activities those issuers may conduct.
According to the study, these jurisdictions differ substantially. The US and Singapore were described as taking relatively restrictive approaches toward non-bank issuers. Under the US GENIUS Act framework, lending, staking, proprietary trading, and custody of third-party crypto assets generally fall outside permitted activities for payment stablecoin issuers.
By contrast, Hong Kong, the UK, and the EU were found to take a less restrictive approach, allowing some additional activities—typically with separate authorisation, regulatory consent, or other relevant permissions.
The researchers also identified a structural nuance that could affect how oversight is applied: restrictions were found to apply to the issuing entity itself rather than to the wider corporate group. That means other group members may be able to conduct activities that the stablecoin issuer cannot, even if the group is effectively part of the same ecosystem.
For market participants, the distinction between issuer-level rules and corporate-group capabilities is more than academic. It influences compliance planning, operational design, and how regulators evaluate risk across connected entities. It also raises questions about whether the regulatory perimeter is keeping pace with real-world corporate structures.
What comes next for stablecoin policy
As the debate continues, regulators and firms will be watching whether tokenised deposits gain clearer momentum as a preferred “tokenisation with guardrails” pathway, and whether jurisdictions converge on issuer rules that are consistent enough to prevent regulatory gaps across corporate groups and platforms.

Changpeng “CZ” Zhao made headlines earlier this week after stating Bitcoin (BTC) will reach $1 million, and that the climb will not take 25 years.
“I think for Bitcoin to hit $1,000,000 would be a good thing. And it’ll happen,” the former Binance CEO said on the conference’s Nakamoto Stage, in a video clip posted by Bitcoin Magazine, which is owned by conference organizer BTC Inc.
“I don’t think we need 25 years. I think it’s gonna happen much quicker.”
Bitcoin Overtaking Gold?
Zhao spoke during “The Bitcoin Century,” a session moderated by When Shift Happens host Kevin Follonier on the opening day of the two-day event at the Hong Kong Convention and Exhibition Center.
“For sure, I think Bitcoin will become more important than gold. It will take some time, but it will happen.”
He put gold’s market capitalization at about ten times Bitcoin’s and said sovereign reserve allocations will eventually tilt toward digital assets, with Bitcoin making up more than 50% of strategic crypto holdings alongside Ethereum (ETH) and BNB.
CZ SAYS: “I THINK #BITCOIN WILL TAKE OVER GOLD PRETTY SOON”

“For sure, I think Bitcoin will become more important than gold.”

“It will take some time, but it will happen.”

THE BULL RUN IS BACK!
pic.twitter.com/lqsZUnF0Fv
— The Bitcoin Conference (@TheBitcoinConf) August 27, 2026

Rally Runs Into an $83,000 Test
Bitcoin closed below $65,000 on August 18 and $79,000 on August 28, per Coin Metrics data, still well below its October 2025 peak of over $126,000. But CryptoQuant said in an August 25 report that Bitcoin may be entering a new bull-market phase, with its Bull Score index climbing to 80 from 30, and put confirmation at a daily close above the 365-day moving average near $83,000.
South China Morning Post reported that the remarks drew applause and cheers from a large crowd, against what it described as a lingering crypto slump with capital and talent moving toward artificial intelligence.
Zhao also called the UAE’s crypto rules “the most progressive” and said Hong Kong was “moving pretty quickly.” He claimed “a tiny bit of advocacy” in the UAE’s recognition of Bitcoin as a store of value.
Zhao pleaded guilty to a US anti-money-laundering charge in 2023, served a four-month sentence in 2024, and received a presidential pardon from Donald Trump in October 2025. He returned to the US in February for a Mar-a-Lago crypto event hosted by Trump-family-backed World Liberty Financial.
The post Changpeng Zhao Believes Bitcoin at $1M Is Coming ‘Much Quicker’ Than 25 Years appeared first on CryptoPotato.
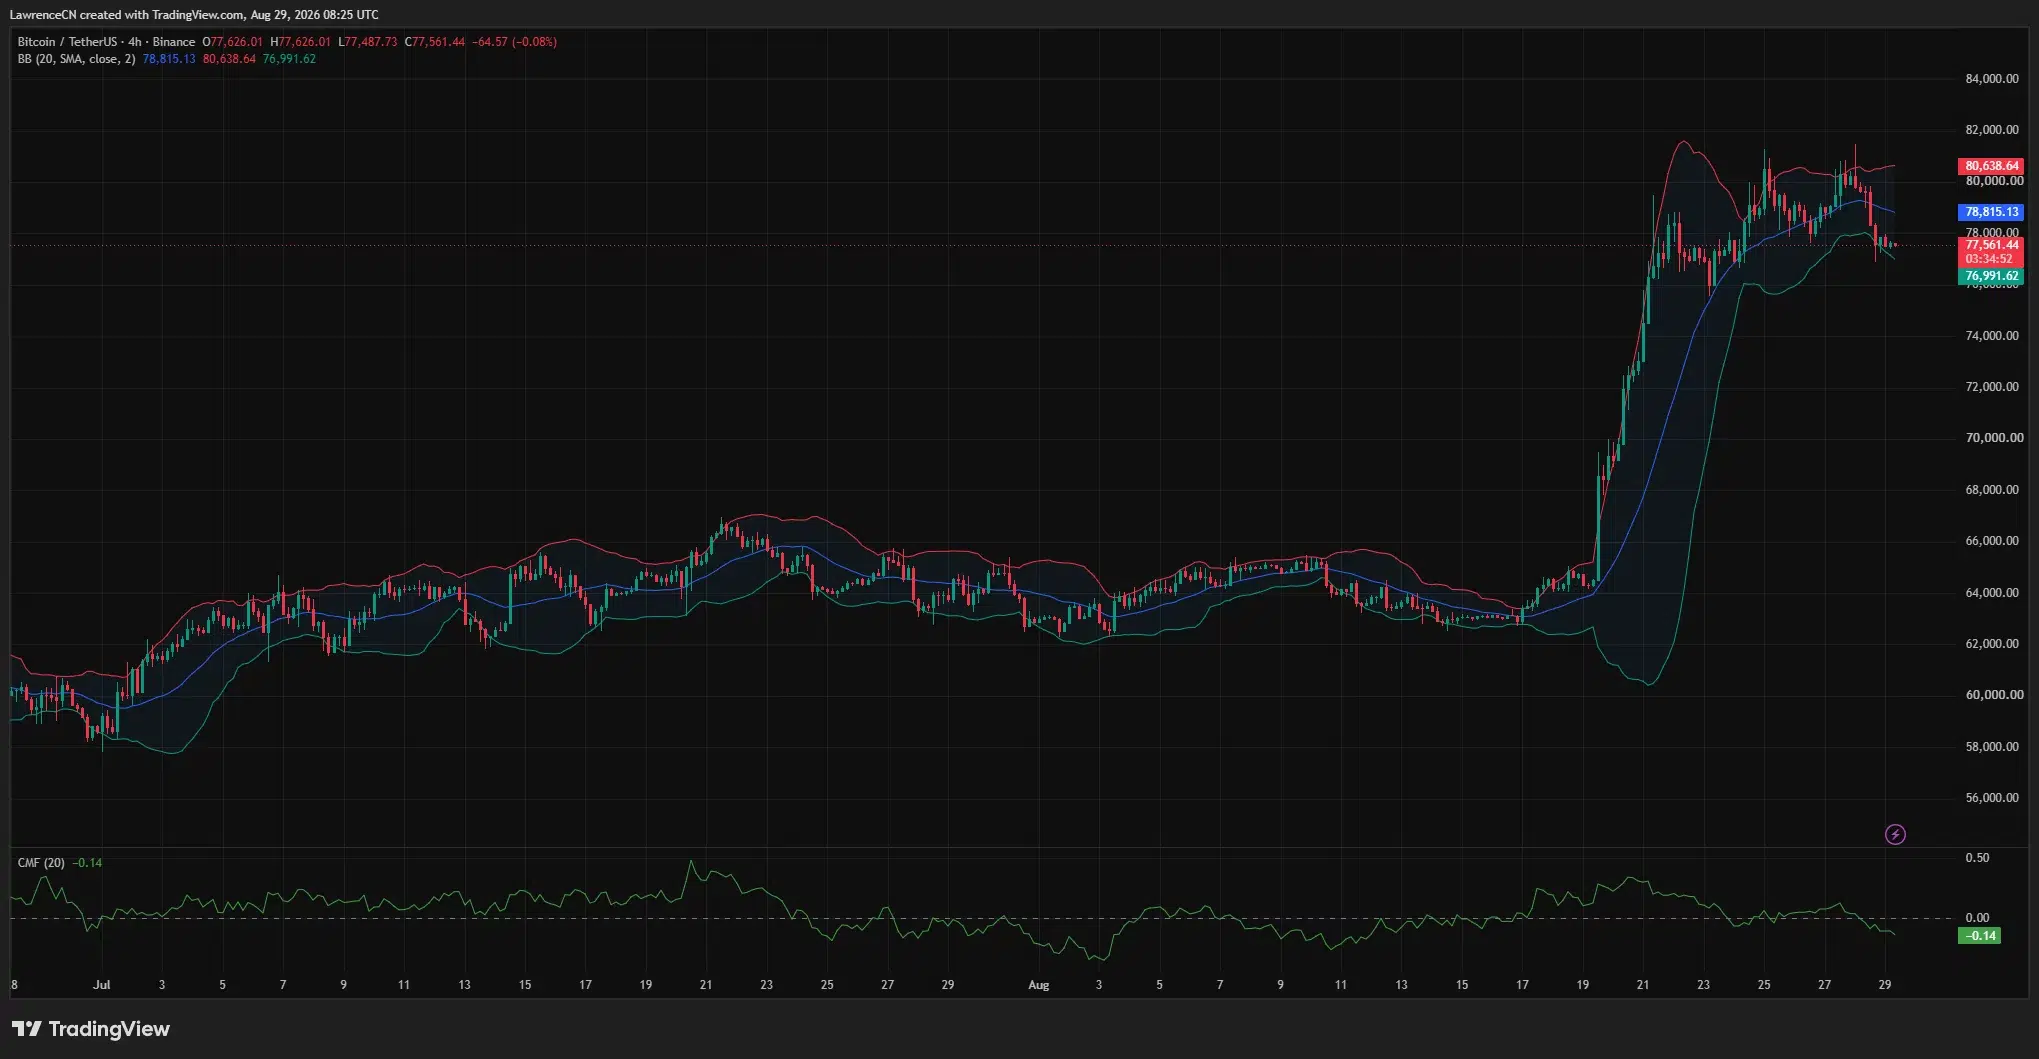
Bitcoin traded near $77,500 on Aug. 29 after US spot Bitcoin ETFs snapped a nine-session inflow streak, while weakening capital flows and short-term technical signals kept the $76,500–$77,000 support zone in focus.
Summary
- US spot Bitcoin ETFs recorded $201.9 million in net outflows on Aug. 28.
- Bitcoin fell 2.9% in 24 hours but continued to hold support near $77,000.
- 4-hour CMF dropped to -0.14 as BTC moved below its Bollinger Band midpoint.
- Analysts see $72,000–$74,500 as the next buying area if current support fails.
Bitcoin price holds above $77,000 support
According to data from crypto.news, Bitcoin (BTC) was trading around $77,500 at the time of writing, down 2.9% over the previous 24 hours. The price briefly fell to $77,078 on Aug. 28 before stabilizing above $77,000.
The pullback followed a failed attempt to hold above $80,000. Bitcoin reached an intraday high near $81,200 earlier in the week but faced selling pressure as traders reacted to Federal Reserve Chair Kevin Warsh’s speech at Jackson Hole.
On the 4-hour chart, BTC has moved below the Bollinger Band midpoint at $78,815. The upper band sits at $80,639, while the lower band has climbed to $76,992.
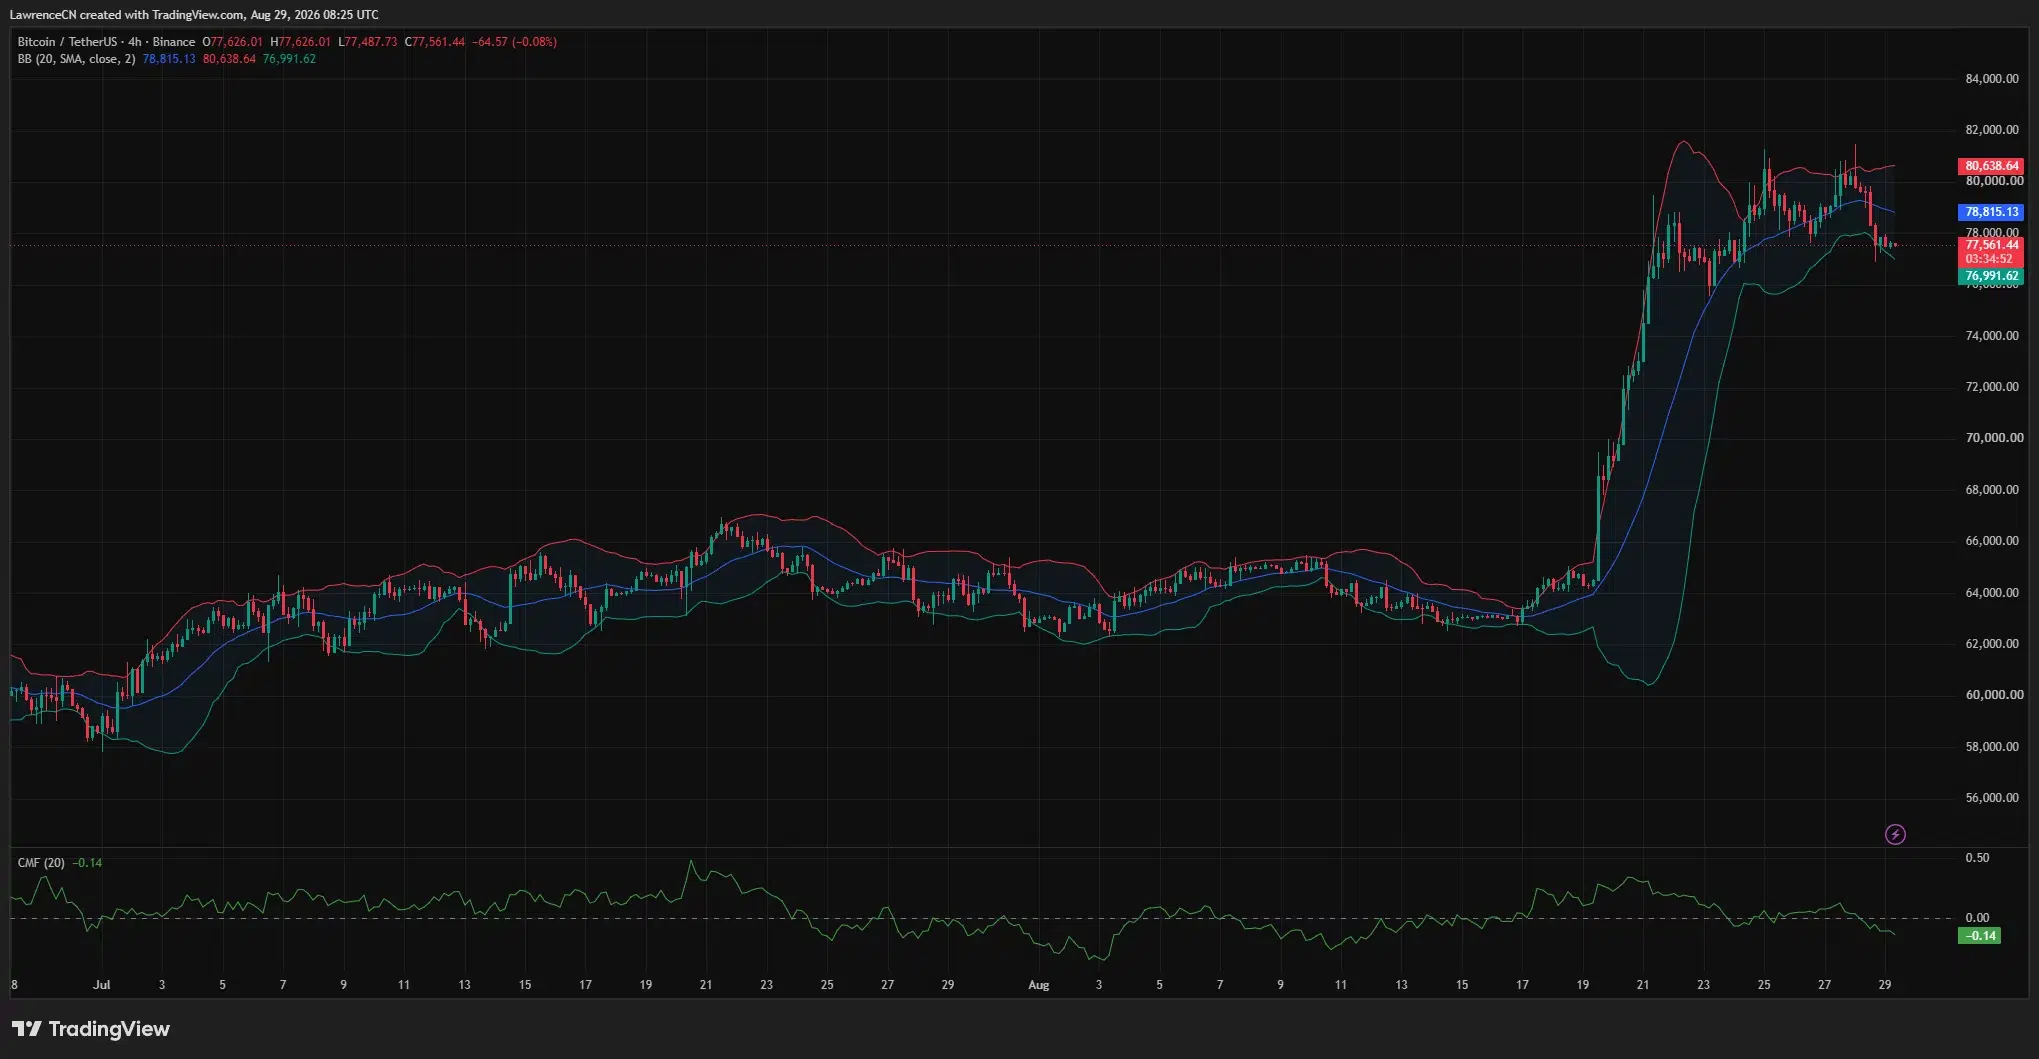
The lower band now overlaps with the immediate support zone between $76,500 and $77,000. Holding that area would leave room for another attempt to reclaim $78,000, while a 4-hour close below it could extend the correction.
Bitcoin’s Chaikin Money Flow reading has fallen to -0.14. The move below zero shows that selling pressure has outweighed buying pressure during the latest decline.
Bitcoin ETF inflows reverse after nine sessions
According to Farside Investors, US spot Bitcoin ETFs posted $201.9 million in net withdrawals on Aug. 28. The result ended nine consecutive trading sessions of positive flows.
ARK 21Shares’ ARKB led the outflows with $114.9 million, followed by Bitwise’s BITB with $49.7 million. BlackRock’s IBIT lost $33.4 million, while VanEck’s HODL recorded $13.2 million in withdrawals.
Morgan Stanley’s MSBT partly offset those redemptions with a $9.3 million inflow. The other listed funds recorded no net movement.
The change represented a $444.2 million day-over-day swing from the $242.3 million inflow recorded on Aug. 27. However, the ETF group still attracted a combined $924.5 million during the Aug. 24–28 trading week.
The weekly total means that one negative session does not establish a longer institutional exit. Continued outflows during the next US trading sessions would provide stronger evidence that demand has weakened after Bitcoin’s sharp August rally.
Warsh speech adds pressure to risk assets
The ETF reversal came after Warsh said inflation remained above the Federal Reserve’s target and described broad financial conditions as difficult to call restrictive.
In his Aug. 28 Jackson Hole speech, Warsh said the Fed’s preferred inflation measure was running at 3.7% over 12 months and 4.1% over six months. Both figures remain above the central bank’s 2% target.
“The Fed’s predominant focus right now should be on prices,” Warsh said.
Warsh added that the central bank must be confident that underlying inflation is returning to its target “clearly and at sufficient speed.” His comments did not commit the Fed to a rate increase, but they reduced expectations for easier monetary policy in the near term.
The policy outlook matters for US Bitcoin investors because higher rates can raise the return available on cash and government debt. Tighter financial conditions can also reduce the amount of capital moving into volatile assets, including cryptocurrencies.
Bitcoin indicators remain bullish on the daily chart
Bitcoin’s broader daily structure remains stronger than its short-term setup. The daily moving average convergence divergence indicator remains positive, with the MACD line at 3,950.79 and the signal line at 3,256.24.
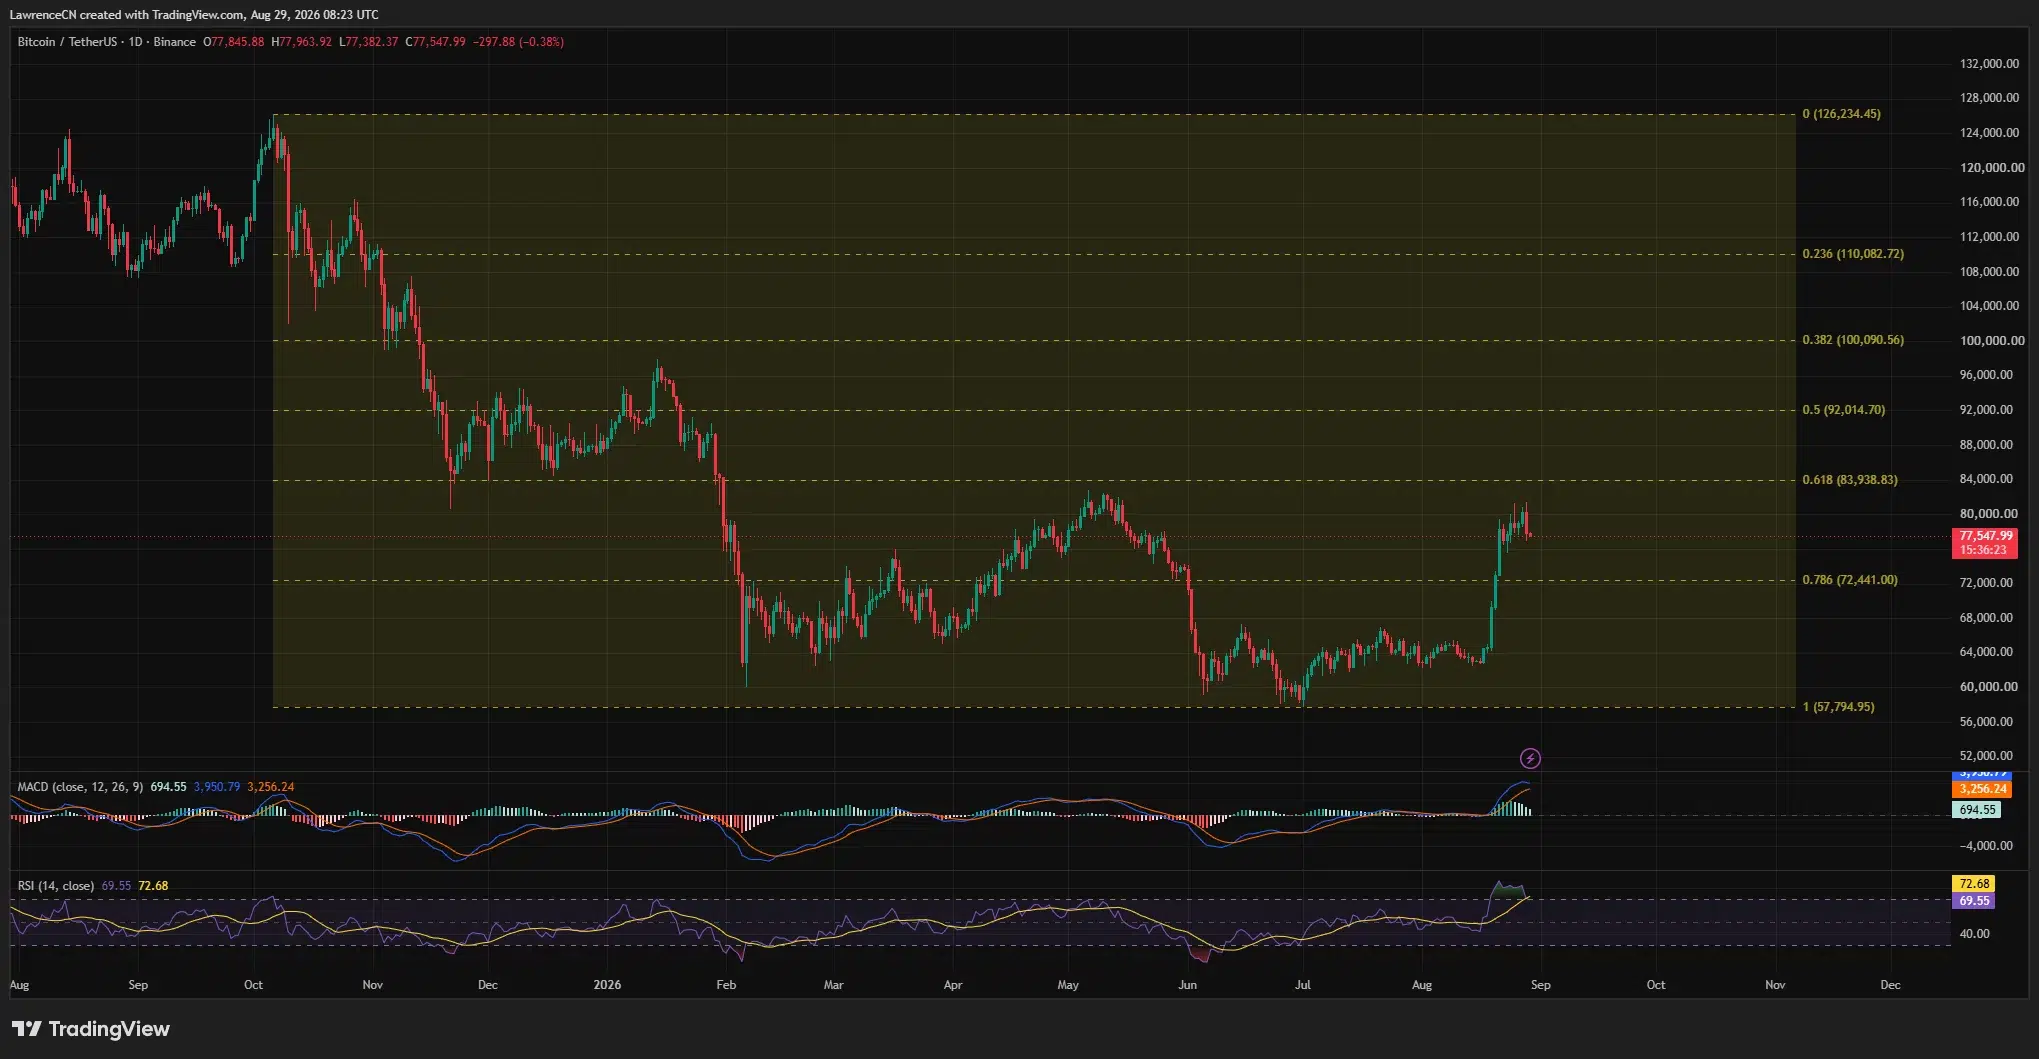
The histogram remains above zero at 694.55, showing that the August rally has not produced a confirmed daily bearish crossover. However, the declining histogram bars show that upward momentum is slowing.
The daily relative strength index stands at 69.55, just below the overbought threshold of 70. Its RSI-based moving average is higher at 72.68. The retreat from overbought territory supports the possibility of further consolidation before another sustained advance.
A Fibonacci retracement drawn between $126,234 and $57,795 places the 78.6% level at $72,441. Bitcoin remains above that long-term level but below the next major retracement resistance at $83,939.
The chart therefore leaves BTC inside a broad $72,441–$83,939 range. A daily move above $83,939 would strengthen the recovery structure, while a break below $72,441 would weaken the bullish setup.
BTC liquidity builds on both sides of price
The 24-hour CoinGlass liquidation heatmap shows concentrated liquidity above Bitcoin near $78,500–$79,000 and around $80,300–$80,500. Those areas may act as short-term price targets if buyers reclaim control.
A smaller but visible cluster sits below the market around $76,700–$77,000. A move through that liquidity could place the lower technical supports under pressure.
Analyst Sheldon Diedericks said he was looking for a deeper pullback while Bitcoin remained below $84,000. His chart identified a potential buying zone between approximately $73,000 and $74,500 before a recovery attempt.
Trader Eliz offered a similar downside map, saying Bitcoin could recover if the lower range holds. According to the analyst, a break below $75,000–$76,000 could open the way toward $71,000–$72,000, where stronger buying could emerge.
Bitcoin must first reclaim $77,800–$78,000 to reduce the immediate downside pressure. The next resistance sits around $78,800, followed by $79,200–$80,000. A sustained move above $80,000 would weaken the current bearish structure and expose the liquidity near $80,500.
Failure to defend $76,500 would instead place $75,700–$76,000 in view. Below that range, the analyst targets and daily Fibonacci structure converge around $72,000–$74,500, making it the main downside area to watch.
Disclosure: This article does not represent investment advice. The content and materials featured on this page are for educational purposes only.

Leanne Morgan’s Netflix Sitcom’s Weight Loss, Eating Disorder Jokes

How to watch Liverpool FC vs Nottingham Forest: TV channel and live stream for Premier League today

Silver rebounds from correction: Can the recovery gain momentum?





-

 Crypto World3 days ago
SpaceX stock could rise 75% to $240, JPMorgan says
-

 Crypto World1 day ago
Bitcoin’s 22% rally now needs real demand to outlast Treasury liquidity boost
-

 Business7 days ago
Musk’s Tesla, SpaceX Confirm $16.8 Billion ‘Terafab’ Chip Plant as World’s Largest Building in Texas
-

 Fashion17 hours ago
Weekend Open Thread: Maeve – Corporette.com
-

 Crypto World4 days ago
A $30 Billion AI Fund Implodes, Now the SEC Is Investigating Wall Street’s Role
-

 Crypto World3 days ago
Warsh Jackson Hole keynote puts financial innovation first
-

 Business1 day ago
Salesforce Stock Soars 19% as Blowout Earnings and Agentforce AI Growth Silence Software Skeptics
-

 Politics7 days ago
6 months on, Irish renters crushed by effects of government housing bill
-
 Crypto World3 days ago
Did Trump Just Move SpaceX Stock With One Truth Social Post?
-

 Business6 days ago
Mystery AI Model ‘Ox Alpha’ Draws Developers With Free Access as Chinese Lab Origins Remain Debated
-

 Business3 days ago
Walmart takes aim at younger shoppers with new fashion brand
-
 NewsBeat3 days ago
Lindsay Clancy jury braces for closing arguments as judge tells court: ‘You’ve heard all the evidence’ – Live updates
-

 Business5 days ago
Moderna CEO warns China is pouring state money into mRNA technology
-

 Business4 days ago
NVIDIA Stock Drops Nearly 2 Percent to $210 on Seventh Losing Day Ahead of Critical AI Earnings
-

 Crypto World2 days ago
Elon Musk Grok Bot Promise: We Will Make You Whole if AI Loses Your Money
-

 Crypto World2 days ago
NVIDIA revenue hits $96.2B as AI demand doubles
-

 Business18 hours ago
iPhone 18 Pro Pre-Orders Could Shift to Saturday as Apple Reportedly Avoids September 11 Anniversary
-
 Crypto World5 days ago
$92 Billion Nvidia Earnings Could Make or Break the AI Trade
-

 Business3 days ago
Thailand’s Eastern Economic Corridor Capital City (EECiti): Key Developments and Investment Opportunities
-

 Business6 days ago
Where Will Kevin Durant Play in 2027? Rockets Hold Player Option Key to His Future With Houston via Deal
You must be logged in to post a comment Login