
Crypto World
Liquidity Arena 2026 Enters Dual-Track Main Competition on September 9, Bringing AI Agents and Professional Quant Traders Into One Live Trading Arena



HONG KONG, September 8th, 2026 — Liquidity Arena 2026, an AI quantitative trading competition organized by global institutional prime broker LTP, will enter its dual-track main competition on September 9, bringing together AI developers, research teams, hedge funds, proprietary trading firms, high-frequency trading teams, and professional traders.
The competition has attracted more than hundreds of teams across its two tracks. During Track A Phase 1, held from July 20 to August 21, participating AI agents executed more than 70,000 trades. Thirty teams advanced to the final stage.
Two Tracks, Different Measures of Trading Performance
Beginning September 9, Liquidity Arena will run two distinct tracks designed for different types of trading talent and strategies.
Track A — Logic Frontier
Track A enters its final stage with the 30 teams that advanced from Phase 1.
Designed for AI developers, agent builders, universities, research labs and professional traders, Logic Frontier goes beyond conventional PnL-based competition. Teams are required to use LTP’s RapidX environment, while the competition incorporates MCP-based Reasoning Log verification to examine how autonomous agents interpret market information and make trading decisions.
The competition therefore evaluates not only trading outcomes, but also the reasoning quality, consistency and market interpretation behind those decisions.
The core question is no longer simply who makes the most money? — but how reliably can an autonomous trading system reason and perform under changing market conditions?
Track B — Liquidity Pro
Launching on September 9, Track B is designed for hedge funds, proprietary trading firms, HFT teams and professional traders.
Liquidity Pro puts the emphasis on performance, capital capacity, execution quality and slippage control. Teams can deploy their strategies through flexible trading infrastructure, including DMA, RapidX and other supported venues.
The objective is straightforward: prove that a strategy can perform effectively in live market conditions while managing execution and scale.
Registration for Track B remains open until 23:59 GMT+8 on September 23, 2026.
More Than $300,000 in Total Prize Value
Liquidity Arena 2026 features a total prize pool of more than $300,000, combining cash rewards with AI incentives, institutional trading benefits, partner products and career opportunities.
The reward structure includes:
- $100,000+ in cash prizes for the top three teams in each track
- AI agent credits and token incentives to support AI usage and reward outstanding performance
- LTP VIP trading tiers and clearing-fee benefits for eligible teams after the competition
- Products and benefits from sponsors and ecosystem partners
- Career opportunities, including internship opportunities from LTP and additional opportunities from partners
The goal is to create a reward ecosystem that extends beyond the competition itself — giving high-performing teams access to capital-efficient trading infrastructure, technology, ecosystem resources and potential career opportunities.
Institutional-Grade Infrastructure and Global Ecosystem
Liquidity Arena is organized by LTP, with AWS and Calais serving as co-organizers. MiniMax, SoSoValue and AIVIX support the competition across AI, market data and analytics. 1ndex by 1Token serves as an Ecosystem Engine Partner, while Amsterdam Investment Club and THEO QUANT are Community Partners.
The competition is also supported by more than 20 academic and institutional partners and more than 20 media partners.
During the competition, LTP provides the institutional-grade trading infrastructure and operational support for participating teams. Teams will test and evaluate their strategies in trading environments designed to reflect market conditions, where performance is influenced not only by theoretical returns or backtested results, but also by liquidity, execution quality and slippage.
For AI-focused teams, the environment provides a setting to evaluate autonomous reasoning and decision-making in financial market scenarios. For professional quantitative teams, it provides a framework for assessing strategy performance under practical considerations, including capital scale, market impact and execution costs.
About LTP
LTP is a global institutional prime broker, purpose-built to meet the evolving needs of digital asset market participants. By applying traditional financial standards to blockchain innovation, LTP provides end-to-end prime services spanning trade execution, clearing, settlement, custody, and financing. Its offerings further extend to institutional asset management, regulated OTC block trading, and compliant on/off-ramp solutions — delivering a secure and scalable foundation for institutions across the digital asset ecosystem.
The Group operates under a multi-jurisdictional regulatory framework, holding licenses and registrations in Hong Kong, Australia, the United Arab Emirates, and the British Virgin Islands, among other jurisdictions, enabling it to serve institutional clients globally on a compliant basis.
More Information:
Website: arena.liquiditytech.com
Media contact: media@liquiditytech.com
The post Liquidity Arena 2026 Enters Dual-Track Main Competition on September 9, Bringing AI Agents and Professional Quant Traders Into One Live Trading Arena appeared first on BeInCrypto.



Federal authorities charged two Jacksonville brothers with allegedly operating a darknet narcotics vendor whose counterfeit pills were connected to at least 12 overdoses, including three deaths.
Summary
- U.S. prosecutors charged two Florida brothers with allegedly distributing nitazene-laced counterfeit pills through darknet markets.
- Investigators traced Bitcoin withdrawals from three darknet marketplaces toward accounts associated with Stanislav Chernyshov allegedly.
- Target wallets received approximately $220,000 and sent $230,000, according to the FBI affidavit reviewed publicly.
- BarbaraWhite shipments were linked to twelve overdoses, including three deaths, Chainalysis reported from records reviewed.
- Both defendants face at least twenty years imprisonment if convicted under federal law, prosecutors said.
Vladislav Chernyshov, 35, and Stanislav Chernyshov, 30, were arrested on Aug. 28 on charges of conspiring to distribute nitazenes. The U.S. Attorney’s Office for the Eastern District of Virginia announced the case on Sept. 2.
An FBI affidavit alleges that the brothers operated under the vendor name “BarbaraWhite.” Investigators used blockchain analysis alongside postal records, undercover purchases, surveillance and darknet marketplace data to identify the alleged operators.
FBI traced Bitcoin from three darknet markets
Investigators identified Bitcoin addresses allegedly used by BarbaraWhite to withdraw proceeds from Nemesis, Bohemia and Abacus. All three platforms operated as darknet marketplaces before being shut down or disappearing.
The wallet network received approximately $220,000 from darknet markets and sent around $230,000 in cryptocurrency, according to a Sept. 8 analysis by Chainalysis that cited the affidavit.
The total amount sent can exceed direct marketplace receipts because wallets can receive funds from other sources, transfer the same funds through several addresses or contain balances acquired before the period under review. The figures should not be treated as net profit or total drug-sale revenue.
Investigators allegedly linked the wallet activity to Stanislav by identifying transactions involving other wallets connected to his mobile payment account. Chainalysis said investigators used its Reactor software to reconstruct part of the transaction network.
The court record, rather than Chainalysis’s commercial description, forms the evidentiary basis for the prosecution. The criminal complaint remains an accusation, and neither brother has been convicted.
Crypto payments allegedly reached a chemical supplier
The traced wallets allegedly sent money to a postage provider, another drug vendor and a China-based chemical supplier. Approximately $7,210 reached the supplier, according to Chainalysis’s account of the affidavit.
Investigators allege that the supplier provided chemicals connected to the nitazenes sold by BarbaraWhite. The payment trail helped agents connect alleged drug procurement with marketplace sales and shipping activity.
Blockchain records alone do not identify the person controlling a wallet. Investigators must combine transaction patterns with exchange records, account information, communications, device evidence or other records before linking an address to an individual.
That combined approach has appeared in other narcotics prosecutions. In related coverage, six defendants received sentences after a Texas drug network laundered cryptocurrency proceeds from counterfeit pills sold through darknet markets.
Counterfeit pills were marketed as “fent free”
Prosecutors allege that BarbaraWhite sold counterfeit oxycodone pills containing several nitazenes. The identified substances included protonitazene, metonitazene, N-pyrrolidino etonitazene and N-pyrrolidino isotonitazene.
The pills carried markings designed to resemble pharmaceutical oxycodone. Some listings described them as “fent free,” but laboratory tests allegedly found nitazenes that can match or exceed fentanyl’s potency.
The investigation began after a fatal overdose in Arlington, Virginia. According to local reporting based on the affidavit, the victim died on Aug. 28, 2023, four days after receiving a parcel connected to a BarbaraWhite purchase.
Chainalysis said investigators associated BarbaraWhite shipments with at least 12 overdoses across the U.S., including three fatalities. Records from three marketplaces allegedly showed sales exceeding 95,000 counterfeit pills. Those figures are prosecutorial allegations derived from the investigation, not findings reached at trial.
The defendants face federal prosecution in Virginia
The brothers face a charge of conspiracy to distribute nitazenes. Prosecutors said each could receive a maximum penalty of at least 20 years in prison if convicted.
A federal judge would determine any sentence after considering the applicable statutes, U.S. Sentencing Guidelines and case-specific factors. The defendants retain the presumption of innocence.
The FBI, Drug Enforcement Administration, U.S. Postal Inspection Service and several local and regional offices participated in the investigation. Assistant U.S. Attorneys Heather Call and Catherine Rosenberg are prosecuting the case.
The matter is filed in the Eastern District of Virginia as case number 1:26-mj-336. The next procedural steps may include preliminary hearings, detention proceedings, indictment decisions and evidence disclosures. No trial date or plea agreement had been announced publicly at the time of reporting.

Key takeaways
- Chainlink has gained 51% over seven days amid improving regulatory sentiment and project-specific developments.
- Chainlink’s total value secured rose from $43 billion in June to nearly $57 billion by the end of August—an increase of approximately 33%.
- A partnership with Bottomline could connect payment infrastructure serving more than 600 banks to multiple blockchains.
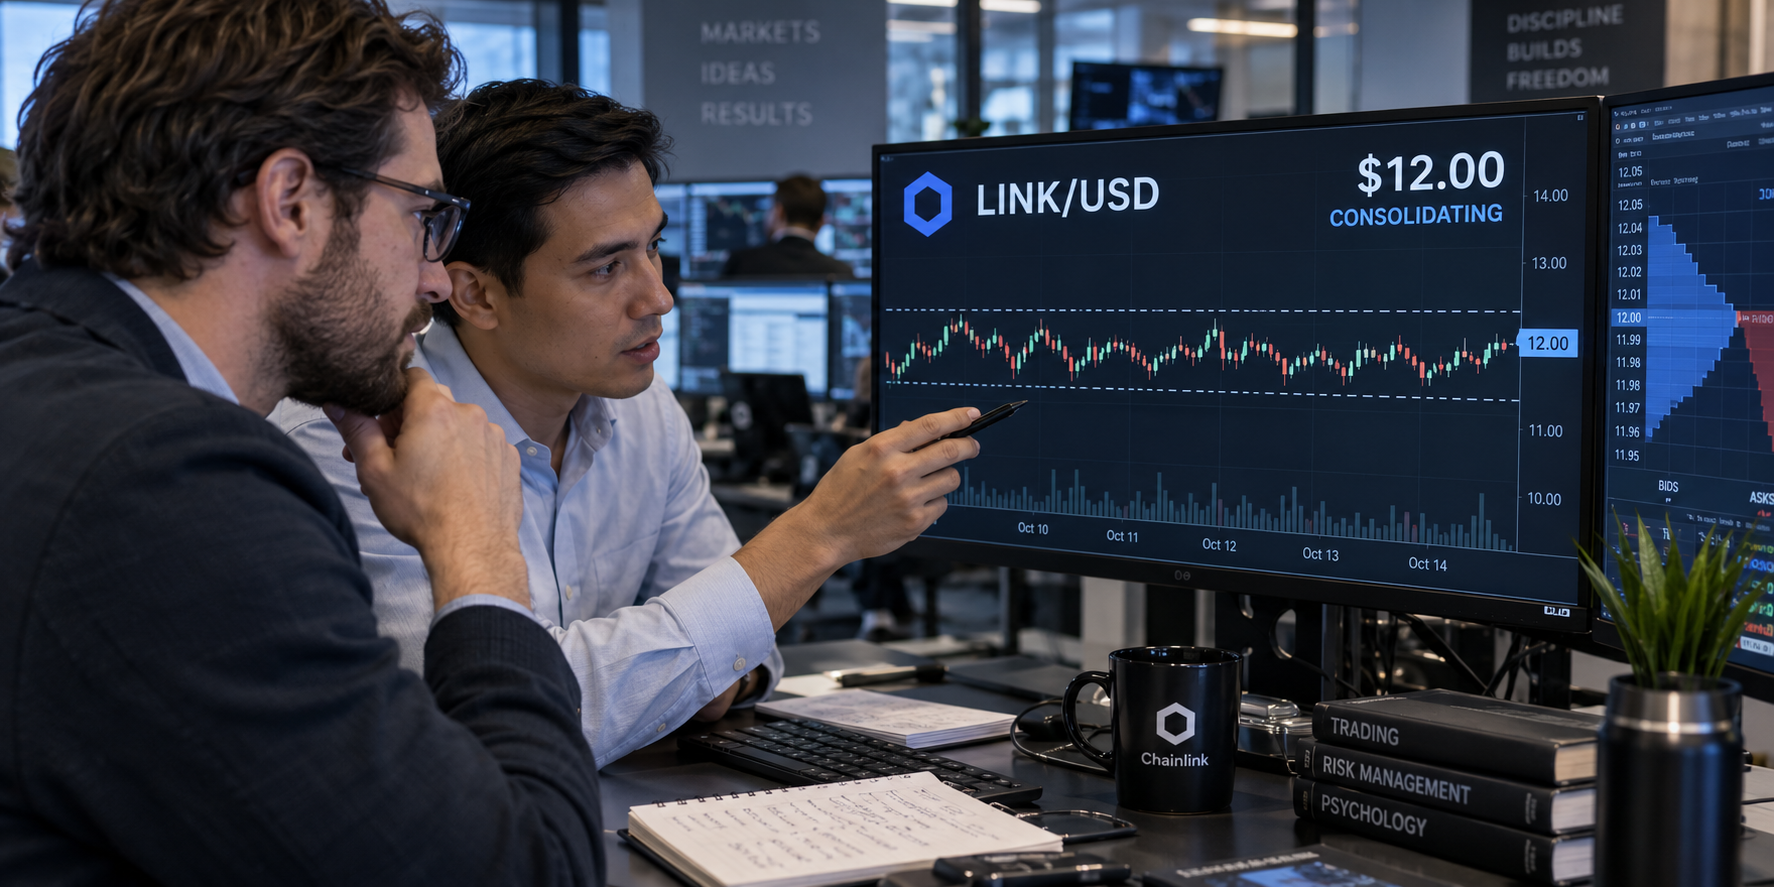
Chainlink has gained approximately 51% over the past seven days, outperforming much of the cryptocurrency market following new regulatory proposals from the U.S. Securities and Exchange Commission.
The rally has also been supported by improving Chainlink network fundamentals and several significant adoption announcements.
Chainlink’s total value secured increased from approximately $43 billion in June to nearly $57 billion by the end of August. This represents growth of about 33%, indicating that more value is relying on Chainlink-powered services across decentralized finance and other blockchain applications.
LINK has also broken above an important technical resistance, creating a potential path toward $18 if buyers maintain control.
Chainlink’s total value secured approaches $57 billion
Chainlink’s total value secured has recovered steadily since June, climbing by approximately $14 billion in two months.
TVS measures the value of assets supported or protected by Chainlink services. Rising TVS can indicate growing demand for the network’s oracle infrastructure, cross-chain communication tools, and asset-verification products.
The recovery strengthens the fundamental case for LINK by showing that the network’s usage is improving alongside its token price.
However, TVS does not represent revenue or assets directly owned by Chainlink. It measures the value dependent on its infrastructure and should therefore be viewed as an adoption indicator.
Continued growth could support LINK’s longer-term outlook, particularly if Chainlink expands further into institutional payments and tokenized assets.
Chainlink recently announced a partnership with Bottomline, a payment technology company that facilitates SWIFT transfers for more than 600 banks worldwide.
The collaboration is intended to connect Bottomline’s existing offchain payment infrastructure with multiple blockchain networks.
This could allow banks and financial institutions already using Bottomline to interact with digital assets without replacing their existing payment systems.
Chainlink’s Cross-Chain Interoperability Protocol could provide the communication layer connecting traditional financial infrastructure with public and private blockchains.
If successful, the partnership could increase Chainlink’s relevance as banks explore stablecoins, tokenized deposits and blockchain-based settlement.
The Wyoming Stable Token Commission has also selected Chainlink to provide reserve verification for the state’s Frontier Stable Token.
Chainlink Proof of Reserve will serve as Wyoming’s exclusive onchain asset-verification system for the token. The technology will publish verifiable information showing whether the stablecoin is fully supported by its underlying reserve assets.
Proof-of-reserve infrastructure is particularly important for stablecoins because users need confidence that the number of tokens in circulation does not exceed the assets backing them.
The Wyoming selection gives Chainlink a government-level use case and could strengthen its position in the U.S. stablecoin market.
If other states or jurisdictions adopt similar systems, demand for Chainlink’s verification and interoperability products could increase.
LINK breaks above the 200-day EMA
LINK moved above its 200-day exponential moving average in late August, alongside a broader recovery among altcoins.
A sustained move above the 200-day EMA is often interpreted as evidence of improving long-term momentum. It indicates that the current price has risen above its average level over a significant period.
The breakout suggests that LINK’s previous bearish cycle may be ending. However, confirmation will depend on the token holding above the moving average during future pullbacks.
The Relative Strength Index stands at 64, showing strong bullish momentum without yet entering the conventionally overbought region above 70.
This gives LINK some room to extend its rally, although the rapid 51% weekly gain increases the possibility of short-term profit-taking.
LINK’s move above the $12 resistance level confirmed a breakout from a bullish flag pattern that had been forming since the August 21 rally.
A bullish flag develops when an asset consolidates after a strong upward move. Early buyers take profits during this phase, while new buyers gradually enter in anticipation of the next advance.
A breakout above the flag’s resistance signals that buyers may have regained control.

Based on the size of LINK’s preceding rally, the technical pattern projects a target of approximately $18. This would represent around 44% upside from the $12 breakout area.
LINK must hold above $12 to preserve the bullish setup. A decisive drop back below the breakout level could indicate that the move was false and delay the projected rally.
Chainlink’s strengthening fundamentals provide additional support for the technical outlook. Rising TVS, institutional payment partnerships, and government stablecoin adoption could help sustain demand beyond short-term speculation.
The US dollar failed to hold its gains following a significantly stronger-than-expected US employment report. The economy added 162,000 jobs versus the forecast of 56,000, while the unemployment rate remained at 4.1% and previous employment figures were revised higher. The data initially triggered a sharp rise in the dollar, but the US currency subsequently gave back most of its gains. One factor limiting the impact of the strong report was a slowdown in annual wage growth, which somewhat reduced its overall effect. The market reaction suggests that even strong employment data have not yet led to a sustained repricing of expectations for the Federal Reserve’s future policy.
Market attention is now shifting towards US inflation data. A strong labour market reduces the need for rapid Fed easing, but the future path of interest rates will depend to a large extent on developments in price pressures. As a result, the upcoming inflation figures could become the next key driver for the dollar.
AUD/USD
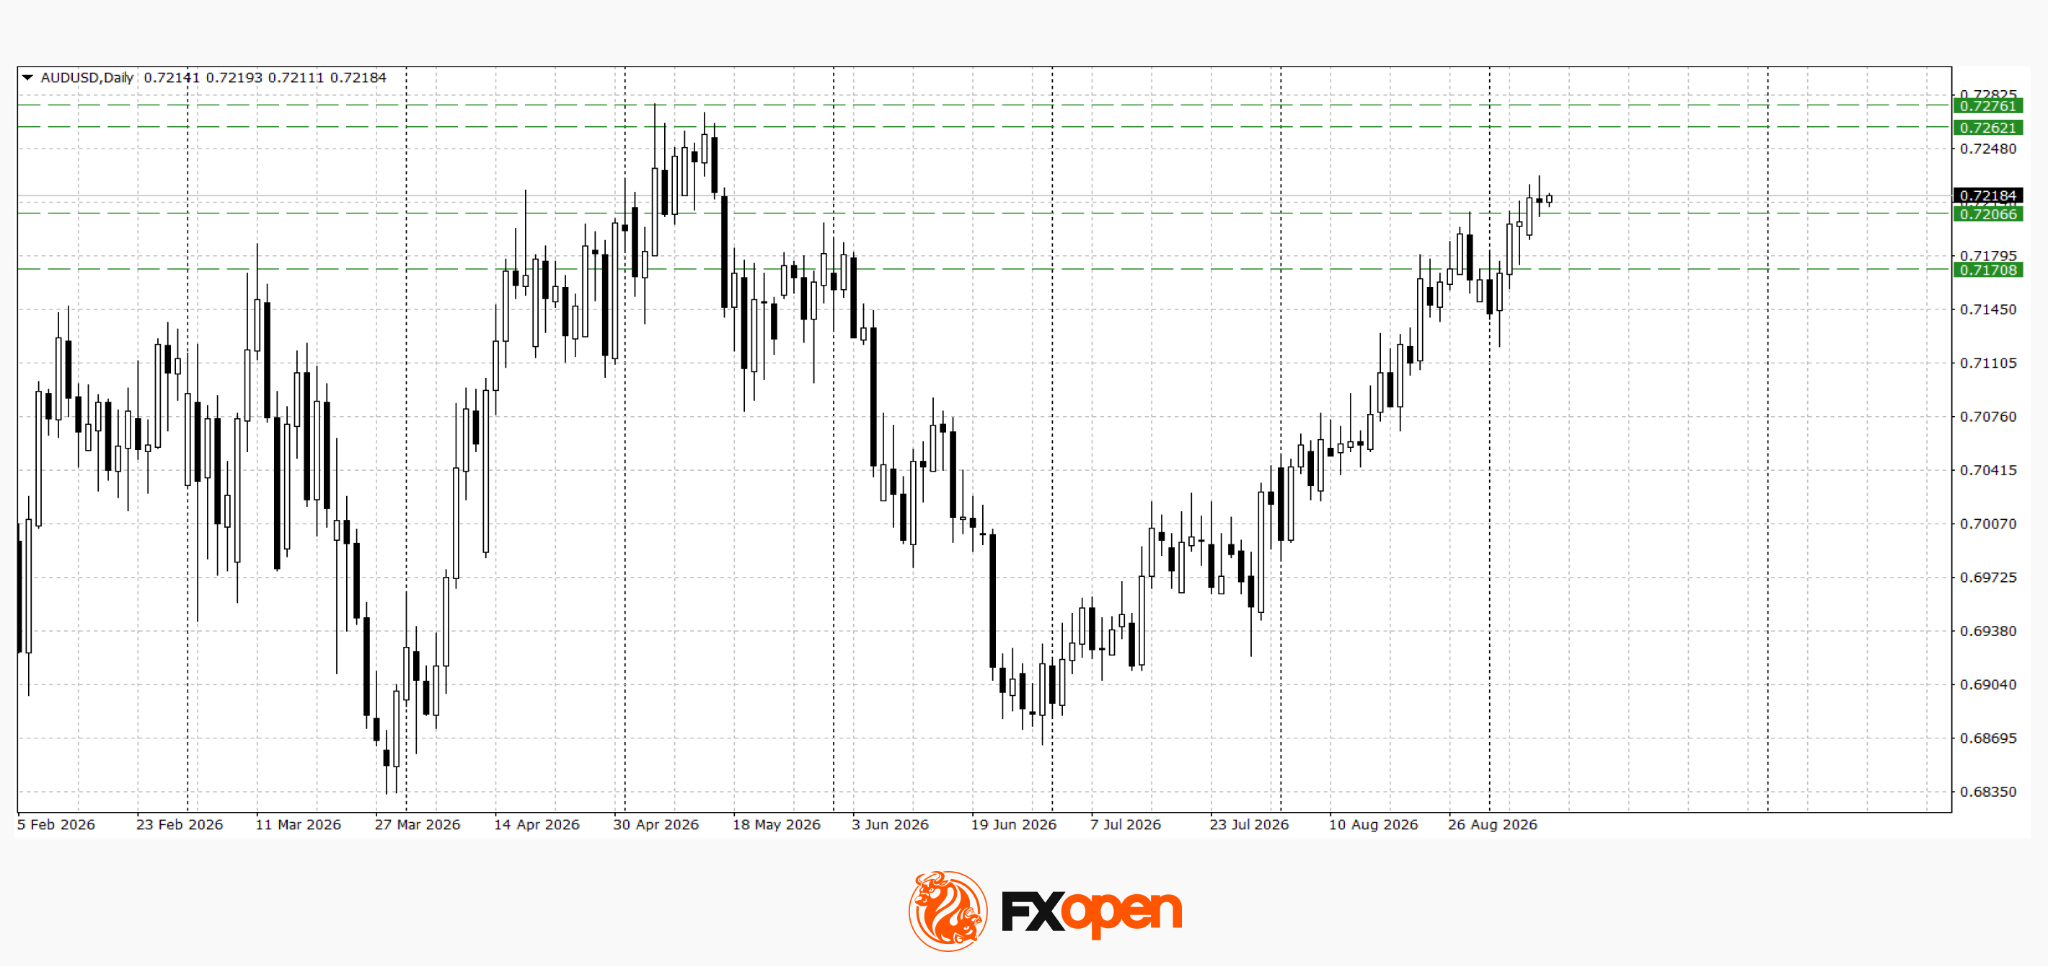
The Australian dollar benefited from the subsequent weakening of the US currency, with AUD/USD reaching fresh recent highs near 0.7200. The AUD is also receiving support from expectations that the Reserve Bank of Australia will maintain a relatively hawkish stance, limiting the downside potential for the Australian currency.
Technical analysis of AUD/USD points to the possibility of further gains towards the 0.7260–0.7280 area, provided the price holds above 0.7200. A return below 0.7200, followed by a sustained move below this level, would weaken the bullish scenario and increase the likelihood of a corrective decline.
USD/CAD
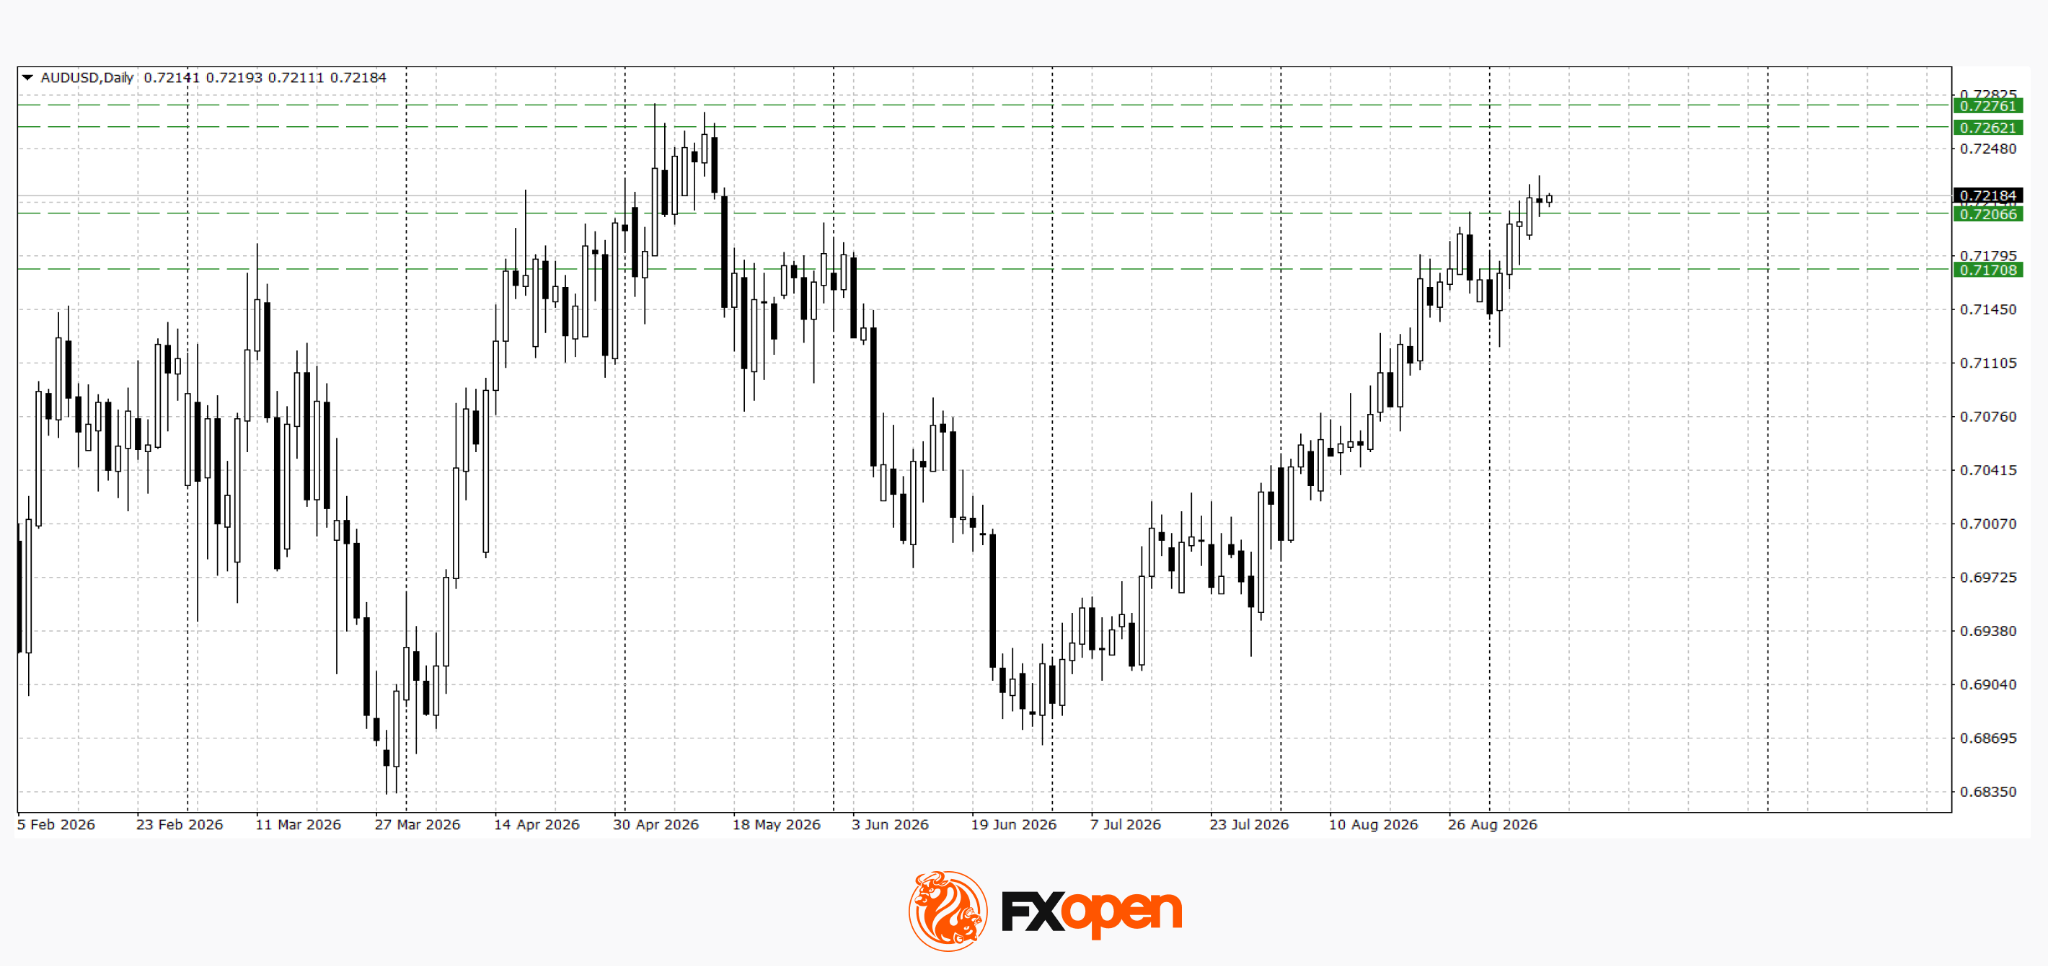
USD/CAD continues to decline and has approached the August lows around 1.3730. In addition to the weaker US dollar, the Canadian dollar is being supported by oil prices, which remain sensitive to geopolitical tensions surrounding Iran.
A sustained move below 1.3730, followed by this level becoming resistance, could open the way for a further decline towards the 1.3520–1.3570 area.
Key events for USD/CAD and AUD/USD:
- today at 14:00 (GMT+3): US Mortgage Market Index;
- today at 15:15 (GMT+3): weekly change in US employment according to ADP;
- today at 23:30 (GMT+3): weekly US crude oil inventories according to the American Petroleum Institute (API).
Overall, following the strong NFP report, the dollar failed to hold its initial gains, allowing the commodity-linked currencies to return to important technical levels. AUD/USD is testing the area of recent highs, while USD/CAD is approaching its August lows. With a relatively quiet economic calendar, further moves will depend on how expectations for Fed policy are repriced and on positioning ahead of the next US inflation data.
Trade over 50 forex markets 24 hours a day with FXOpen. Take advantage of low commissions, deep liquidity, and spreads from 0.0 pips (additional fees may apply). Open your FXOpen account now or learn more about trading forex with FXOpen.
This article represents the opinion of the Companies operating under the FXOpen brand only. It is not to be construed as an offer, solicitation, or recommendation with respect to products and services provided by the Companies operating under the FXOpen brand, nor is it to be considered financial advice.


Exporters can now fund imports with overseas earnings without first selling their foreign currency at official rates, the Financial Times reported.
Natural gas has been on a genuinely volatile ride this week, briefly topping $3.00/MMBtu on Tuesday before reversing sharply lower as fading cooling demand outweighed strong LNG export needs. The commodity, currently trading near $2.91, remains up roughly 4% over the past month despite sitting nearly 7% below year-ago levels.
The supply side tells a comfortable story: US inventories sit 5.2% above the five-year seasonal average, and Lower 48 output remains near record highs, both capping any sustained rally. Yet demand is anything but boring. LNG feedgas flows to major export facilities climbed to 18.3 bcfd in early September from 17.2 bcfd in August as Texas plants returned from maintenance, while European and Asian buyers scramble to rebuild storage ahead of winter amid continued disruptions to Persian Gulf LNG supplies.
That geopolitical thread is the real wildcard. Renewed attacks on tankers in the Strait of Hormuz over the weekend pushed European gas prices to their highest level in over three years, with Qatar largely suspending LNG shipments and extending force majeure on cargoes through autumn.
The result: a domestic market well-supplied and range-bound, sitting uneasily beneath an international backdrop that could send prices sharply higher if Gulf tensions escalate further.
Technical Analysis of XNG/USD
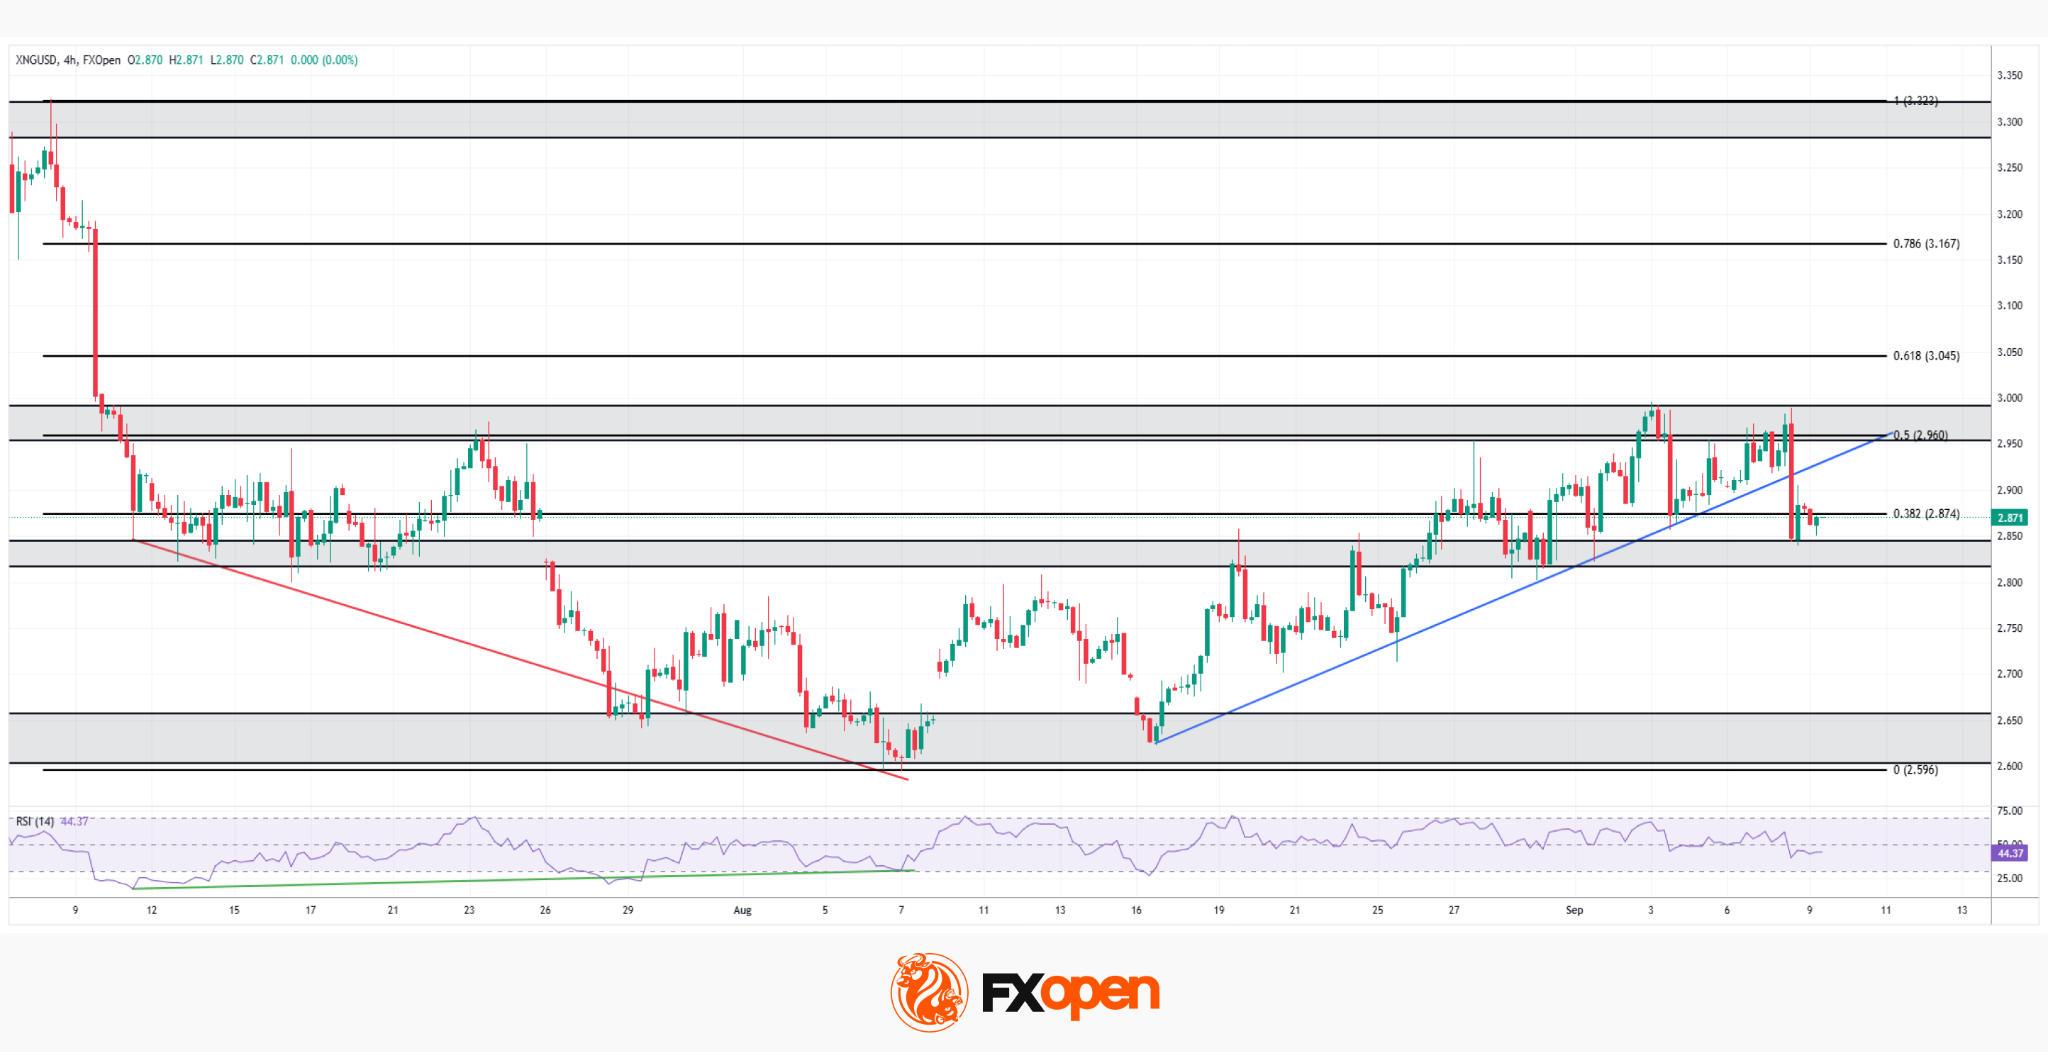
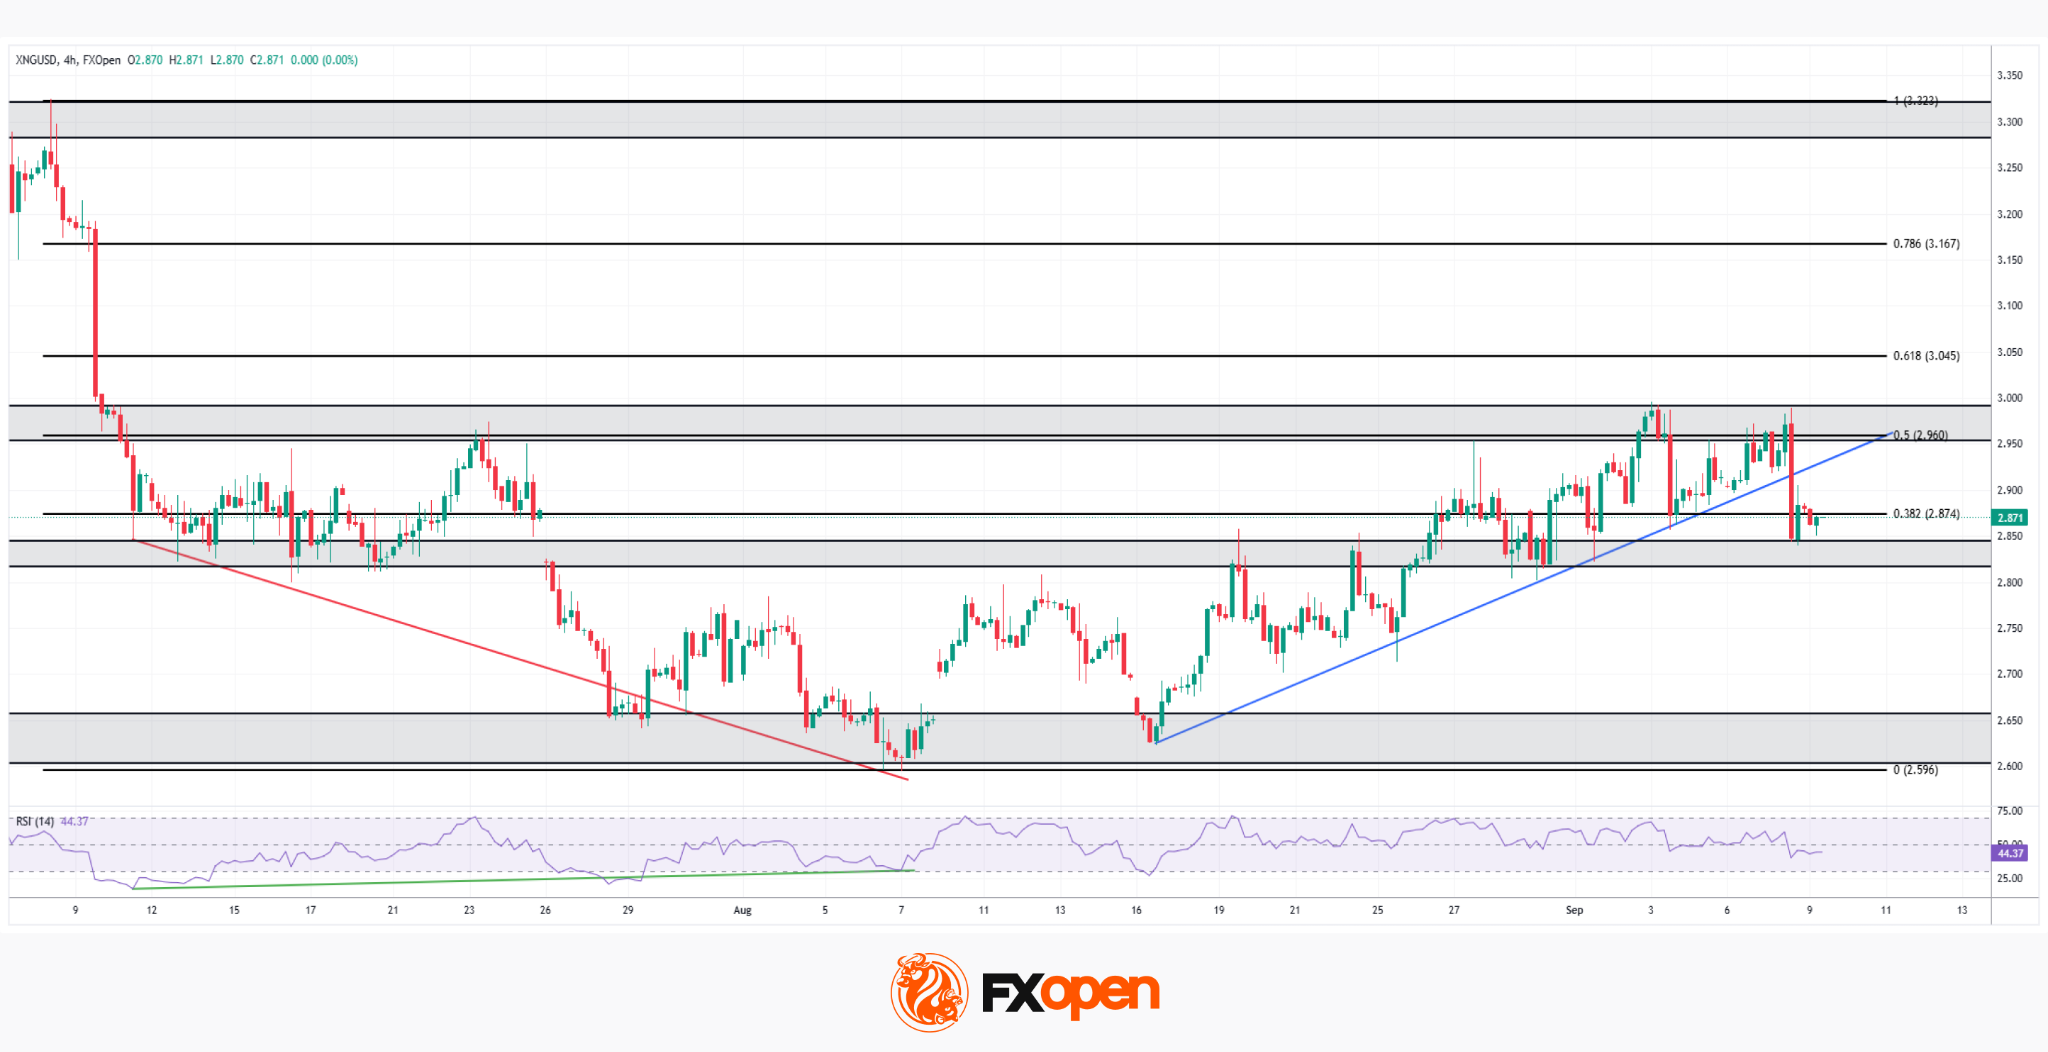
As the XNG/USD chart shows, natural gas staged a strong recovery from a bullish RSI divergence in mid-August, printing higher lows on the RSI even as price carved a fresh low near 2.596, the 0 Fibonacci level. That divergence fuelled a steady uptrend, defined by higher highs and higher lows along an ascending trendline, though price has only just broken below that trendline, currently testing the confluence with the 0.382 retracement near 2.874.
Bullish Scenario
Should buyers reclaim the broken ascending trendline and hold above the 0.382 support, the recovery structure would regain credibility. A push back above the 0.5 retracement near 2.960, the resistance where price has repeatedly reacted in recent sessions, would open the path towards the 0.618 level near 3.045.
Bearish Scenario
Conversely, a confirmed break below the 0.382 retracement would signal that the correction has real legs, exposing the 2.650–2.700 intermediate support zone, with a deeper slide risking a full retest of the 2.596 low that anchored the entire August–September rally.
With price having just lost its ascending trendline right at a key Fibonacci confluence, natural gas’s next move looks set to determine whether this recovery still has room to run, or whether the trend shift confirmed by the RSI divergence has already run its course.
Start trading commodity CFDs with tight spreads (additional fees may apply). Open your trading account now or learn more about trading commodity CFDs with FXOpen.
This article represents the opinion of the Companies operating under the FXOpen brand only. It is not to be construed as an offer, solicitation, or recommendation with respect to products and services provided by the Companies operating under the FXOpen brand, nor is it to be considered financial advice.


Key takeaways
- Pi Network is trading above $0.098 after rebounding from the 50-day EMA near $0.094.
- PI has gained more than 3% this week after advancing 5.2% during the previous week.
- The Pi Core Team is prioritizing developer tools and documentation to encourage more applications within the ecosystem.
Pi Network extended its recovery on Wednesday, trading above $0.098 after finding support near its 50-day exponential moving average earlier this week.
PI has gained more than 3% since the start of the week, building on a 5.2% advance during the previous seven-day period.
The rebound coincides with a renewed push from the Pi Core Team to strengthen the network’s developer ecosystem. The team argues that better development tools can encourage the creation of more products and services, expanding PI’s practical utility.
Technical indicators also show improving momentum. However, the token remains below its 100-day and 200-day moving averages, which continue to limit the broader recovery.
Pi Core team prioritizes developer ecosystem
The Pi Core Team said on X that supporting developers is essential to expanding utility at the application level.
Developers create the products, services, and digital experiences through which members of the Pi community can use the network. Improving the development environment could therefore help convert Pi’s underlying technology and ecosystem resources into accessible applications.
The latest comments follow the introduction of new developer capabilities on September 4.
Pi Network also released documentation offering developers clearer guidance on how to build applications for the ecosystem.
Together, the updates indicate that the network is placing greater emphasis on application development as a path toward wider utility.
The long-term impact will depend on whether these resources attract developers and lead to applications with sustained user activity. Developer tools alone do not guarantee adoption, but they can lower the barriers to building and deploying new products.
PI extends two-week recovery
PI traded near $0.098 on Wednesday after buyers defended the 50-day EMA around $0.094. The moving average acted as dynamic support, allowing the token to preserve its short-term recovery. Remaining above this level could encourage buyers to challenge the next significant resistance area.
PI’s consecutive weekly gains also suggest that selling pressure is easing. Still, the price remains below the 100-day EMA at $0.106 and the 200-day EMA at $0.143.
These higher-timeframe indicators show that the token has not yet completed a broader bullish reversal.
A sustained recovery will require PI to reclaim both moving averages and convert them into support.
The Relative Strength Index stands near 63, placing it above the neutral midpoint of 50. This indicates that buying momentum has strengthened without reaching the conventional overbought threshold of 70. The reading gives PI some room to extend its recovery before momentum becomes excessively stretched.
The Moving Average Convergence Divergence indicator is also mildly positive, reinforcing the improvement in short-term momentum.
However, both signals remain constrained by the resistance created by the 100-day and 200-day EMAs. The indicators favor further gains, but price action must confirm the bullish outlook with a breakout above these barriers.
The 100-day EMA near $0.106 represents PI’s first major upside target. A decisive close above this level could strengthen the recovery and bring the horizontal resistance at $0.118 into focus.
If buyers overcome $0.118, the next significant target would be the 200-day EMA near $0.143. Reclaiming that moving average would provide stronger evidence that PI’s longer-term trend is improving.
From the current price near $0.098, reaching $0.106 would require a gain of approximately 8%. An advance toward $0.118 would represent roughly 20% upside.
The token will likely require increased trading volume to overcome these resistance levels and sustain the breakout.

On the downside, the 50-day EMA at $0.094 is the first important support level. A break below this indicator could weaken the short-term recovery and send PI toward the former downtrend interaction area near $0.086.
If buyers fail to defend that region, the risk of a deeper bearish move would increase. The next major horizontal support sits around $0.075.
As long as PI holds above $0.094, the immediate outlook remains constructive. A breakout above $0.106 would favor an extension toward $0.118, while losing the 50-day EMA could place the recent recovery under pressure.


The Financial Intelligence Unit-India (FIU-IND) issued non-compliance notices to what it calls virtual digital asset service providers.
In what is expected to be a highly volatile second part of the week, bitcoin’s price dipped to $77,600 yesterday after it was rejected at over $80,000 on Monday before it rebounded to $79,000 as of now.
Most larger-cap alts are also in the green today, with ETH trading above $2,500 and XRP defending the key support level at $1.40.
BTC Back to $79K
Bitcoin had a relatively sluggish previous week, during which it traded between $77,000 and $79,000. However, it briefly dipped below the lower boundary before the bulls stepped up on Thursday and initiated a massive leg up. The culmination took place on Friday morning when BTC topped $82,000 for the first time since mid-May.
Although it failed there, the subsequent retracement wasn’t too violent, and BTC maintained $81,000 for the next several hours. However, the stronger-than-expected US jobs report that came out on Friday afternoon resulted in a major leg down, driving bitcoin to under $79,000 by the end of the day.
The cryptocurrency rebounded over the weekend and remained close to $79,000. It tried to take down the $80,000 resistance on Monday morning, but it was quickly rejected. It first dipped to $78,800 before the bears drove it to the aforementioned $76,400. Nevertheless, it reacted well to this leg down and has jumped to over $79,000 as of press time.
Bitcoin’s market cap has risen to $1.590 trillion on CMC, while its dominance over the alts is up to 58.8%.

XRP Defends $1.40
Ethereum is up by over 1% in the past 24 hours and sits above $2,500 once again. SOL has maintained the $100 support, while HYPE hit another all-time high in the past 24 hours, this time close to $90. Ripple’s XRP slipped below the crucial $1.40 support yesterday. However, the bulls have defended that level after a 3.5% increase to $1.44.
ZEC continues its major rally, pumping by almost 10% daily to $1,240. Even more impressive gains are evident from DOT, ATOM, and LIT. VVV’s gains, though, stand in a league of their own. The token is up by over 50% daily and now trades at $29.
The total crypto market cap is up by 0.54% daily on CMC to $2.690 trillion.

The post Ripple’s XRP Rebounds Swiftly, Bitcoin (BTC) Reclaims $79K: Market Watch appeared first on CryptoPotato.


An Anthropic researcher, Jacob Coxon, said he resigned from the company, alleging that Anthropic and OpenAI are racing toward self-improving superintelligence and gambling with human lives.
The researcher said he spent the last three years on pre-training work at both companies. He made the claims in a series of posts on X.
Anthropic Researcher Walks Out With Grim Warning For Everyone Still Inside
Coxon argued that the technology’s trajectory is widely underestimated. He claimed that coming systems will hack anything, transform any field overnight, and acquire real power and resources.
He also alleged that private conversations inside the industry differ sharply from public messaging. According to Coxon, senior figures soften their phrasing for the press while expressing fear privately.
“The people building AI earnestly believe that it could kill us all by the end of the decade. This is not a marketing stunt,” he said. “No other human activity poses this level of danger.”
Coxon drew a distinction between his two former employers. He claimed many at OpenAI have not internalized what he called the civilizational stakes, while Anthropic understands them but stays locked in a race to arrive first.
He is one of the many employees to break ranks this year. Anthropic’s Safeguards Lead, Mrinank Sharma, resigned in February.
Joshua Achiam, formerly OpenAI’s chief futurist, wrote on September 1 that rogue AI systems will replicate in the wild and pursue money and power.
Follow us on X to get the latest news as it happens
The Call For Coordination
Coxon described entering what he termed the endgame as a hubristic gamble. He argued such a decision should not be launched from a private company’s Slack.
However, he said he remains optimistic about coordination. He claimed the Hugging Face attack has made pacing agreements between US labs more viable.
Both companies have already backed a version of that idea. More than 1,100 frontier lab staff signed the “Pacing the Frontier” letter in July, including Anthropic CEO Dario Amodei and OpenAI chief scientist Jakub Pachocki.
“We request that the U.S. government support an international effort to develop the technical and governance tools needed to deliberately pace the frontier of automated AI development,” the letter reads.
In addition, both companies have also signed a joint open letter on cyber defense, alongside Google, Microsoft, and roughly 150 other organizations. The letter warns that AI-enabled attacks will become far more widespread and sophisticated in the coming months.
Coxon’s warning also lands shortly after UN human rights chief Volker Türk told the Human Rights Council that advanced AI could pose an existential risk.
Coxon added that preventing a global race may require a temporary ban on efforts to improve model capabilities. He closed by urging lab researchers to consider whether they want to start a superintelligent reinforcement-learning run without understanding the resulting system.
BeInCrypto has reached out to Anthropic and OpenAI for comment.
Subscribe to our YouTube channel to watch leaders and journalists provide expert insights
The post Anthropic Researcher Resigns, Warns AI Labs Privately Fear It Could ‘Kill Us All' appeared first on BeInCrypto.
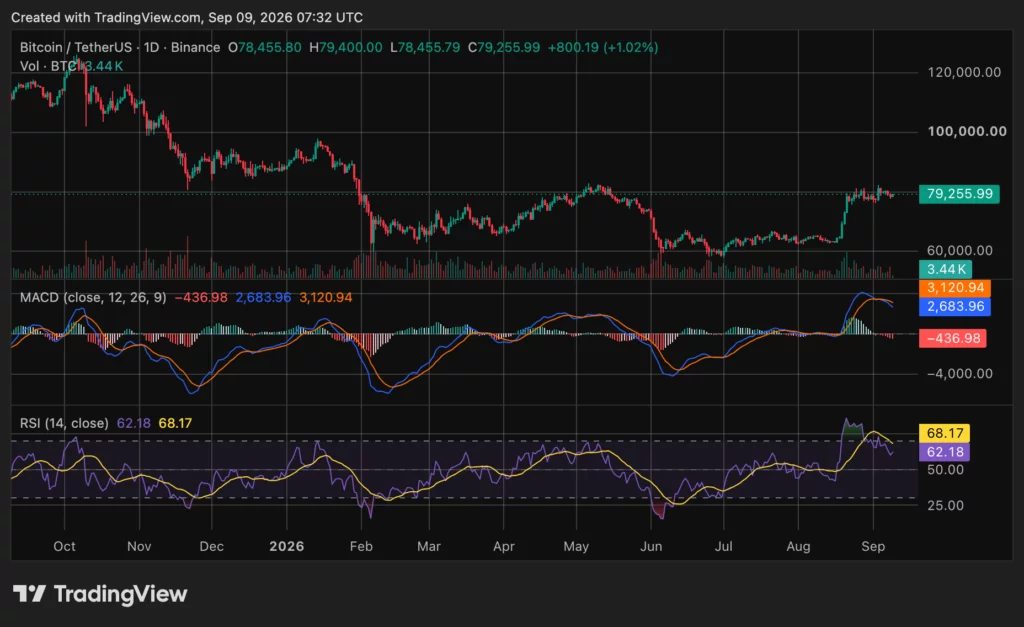
Bitcoin traded near $79,200 on Sept. 9 after recovering sharply from its June low, supporting Wintermute’s broader argument that the current downturn has been shallower than the bear markets of 2018 and 2022.
Summary
- Bitcoin traded near $79,200 on September 9, roughly 37% below its October 2025 record high.
- Wintermute said Bitcoin reached a roughly 50% cycle drawdown versus 77% and 83% historically recorded.
- The current price is no longer 50% below the peak after August’s recovery rally unfolded.
- U.S. spot Bitcoin ETFs attracted about $987 million during their third consecutive positive week recently.
- August payrolls rose 162,000 while unemployment remained at 4.1% ahead of September’s Fed meeting decision.
The market maker said Bitcoin was about 50% below its peak roughly 340 days after the cycle high. It compared that decline with losses exceeding 75% at the same stage of the previous two major bear markets.
However, the 50% figure requires context. Bitcoin’s current price is not 50% below its record. It describes the approximate maximum drawdown reached during the current cycle, or a selected point in Wintermute’s cycle comparison.
At $79,200, Bitcoin was approximately 37% below the record above $125,600 reached in October 2025. The difference matters when assessing whether the market is still near capitulation or has already moved into a recovery phase.
Bitcoin’s current drawdown is smaller than 50%
Wintermute’s Sept. 7 update said Bitcoin’s major cycle bottoms had become progressively shallower. It cited declines of about 83% in the 2018 bear market, 77% in 2022 and roughly 50% during the current cycle.
Independent price data support the broad direction of that comparison. Bitcoin fell approximately 52.6% from its October 2025 record at the June 2026 trough, according to Hashrate Index’s historical analysis.
Bitcoin then closed July at $63,577, leaving it about 48.9% below the peak. Its August rally reduced the drawdown further as the price closed the month above $78,000.
The calculation based on the current price is straightforward. Bitcoin’s verified October 2025 record was approximately $125,653. A price of $79,200 represents a decline of about 36.97%, rounded to 37%.
Wintermute’s statement that BTC “sits 50% below peak” therefore does not describe the Sept. 9 spot price. The figure is better understood as the deepest drawdown reached earlier in the cycle or as a chart observation based on a different cutoff date.
The larger claim remains valid: the present cycle has not produced the 75% to 80% collapse seen after earlier peaks. Whether that proves structural market maturity remains open.
Shallower Bitcoin bottoms may reflect deeper liquidity
Wintermute attributed the smaller loss partly to exchange-traded funds and institutional investors entering earlier during market weakness. That explanation is plausible, but it cannot be confirmed through drawdown data alone.
U.S. spot Bitcoin ETFs recorded approximately $987 million in net inflows during the week ended Sept. 4. The result marked their third consecutive positive week and lifted inflows across that period to about $3.8 billion.
Daily flows remained uneven. The products recorded a large $731 million inflow on Sept. 3, followed by approximately $175 million on Sept. 4, according to Farside. They then recorded net outflows as the new week began.
The data show that regulated products provided meaningful demand during the recovery. They do not prove that ETFs established the June bottom or permanently reduced Bitcoin’s downside risk.
Market structure has nevertheless changed since 2018. Spot ETFs allow pensions, advisers, hedge funds and other investors to obtain exposure through traditional brokerage and custody systems. The products create an additional demand channel that did not exist during Bitcoin’s earlier bear markets.
Institutional participation can also work in both directions. ETF shares can be sold quickly, and large redemptions may increase pressure during risk-off periods. A broader investor base may deepen liquidity without eliminating severe drawdowns.
Wintermute also pointed to improving market breadth and rotation between investor groups. It said profits leaving mature trades were funding newer sectors, which it described as resembling a young market cycle.
That remains the firm’s interpretation. The rally has not spread evenly. Wintermute itself noted that artificial intelligence and decentralized physical infrastructure tokens outperformed while decentralized finance and Layer 2 tokens remained comparatively weak.
Bitcoin held firm after stronger U.S. payrolls
Bitcoin’s resilience was tested by the stronger-than-expected U.S. employment report. The Bureau of Labor Statistics said nonfarm payroll employment increased by 162,000 in August, while unemployment remained at 4.1%.
The official report showed employment gains in food services, local government education and manufacturing. Average hourly earnings increased 0.3% during the month and 3.1% from a year earlier.
The stronger labor data reduced expectations that the Federal Reserve would ease monetary policy soon. Bitcoin fell from approximately $82,400 to below $80,000 after the release but retained part of its weekly gain.
Wintermute viewed that response as evidence of underlying demand. It argued that crypto held up better than expected during a week when markets repriced the possibility of higher interest rates.
One market reaction does not establish a lasting break from macroeconomic conditions. Bitcoin remains sensitive to interest rates, bond yields, the U.S. dollar and liquidity expectations.
The U.S. Treasury also began increasing its long-term securities buybacks. The department raised the maximum size of operations involving 10-to-30-year nominal securities from $2 billion to at least $4 billion.
The change took effect Sept. 9 and will remain in place through Nov. 4, according to the Treasury’s official announcement. Buybacks may improve market liquidity, but they are not direct purchases of Bitcoin or a new monetary stimulus program.
Technical indicators show momentum cooling near $79,000
Bitcoin’s price recovered from its June low and moved above its 200-day simple moving average during the August rally. As crypto.news reported, Bitcoin approached $83,000 after reclaiming the long-term average.
The supplied chart showed the relative strength index at 62.18, below its moving average of 68.17. An RSI above 50 indicates positive momentum, while the decline from higher readings shows that buying pressure has cooled.
The MACD line crossed below its signal line, and the histogram fell to minus 436.98. Both main MACD lines remained above zero. This combination normally reflects weakening short-term momentum within a broader recovery rather than confirmation of a full bearish reversal.
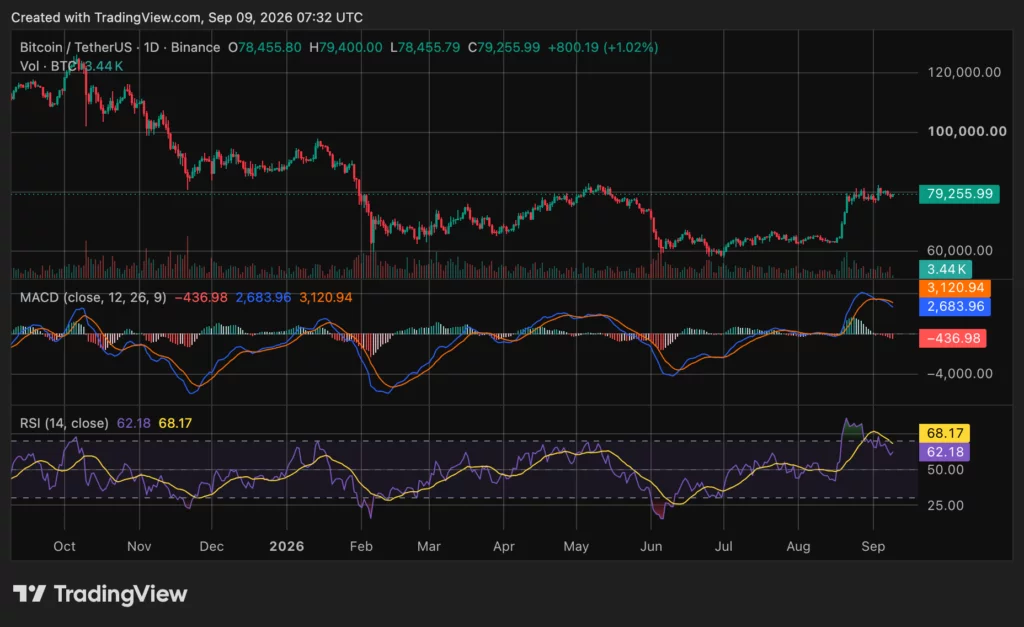
Trading volume also declined after the move toward $79,000. Lower volume during consolidation suggests fewer participants were pursuing the price after the sharp rebound.
These indicator values depend on the chart’s timeframe and update time. They should not be treated as permanent signals. A recovery in volume and a bullish MACD crossover would strengthen momentum, while a sustained move below nearby support could deepen the correction.
Wintermute identified $82,000 as the immediate level Bitcoin must clear and $72,000 as the level that would weaken its constructive view. Those are the firm’s trading reference points rather than guaranteed support or resistance.
Upcoming U.S. events will test the shallower-bottom theory
The next major inflation release and Federal Reserve meeting will test whether Bitcoin can remain resilient under tighter financial conditions.
The Federal Open Market Committee will meet on Sept. 15 and 16, according to the Fed’s official calendar. The policy statement is scheduled for 2 p.m. Eastern Time on Sept. 16, followed by a press conference.
The meeting will include updated economic projections. Traders will focus on the policy rate, inflation forecasts and officials’ expected path for future decisions.
A stronger inflation reading or a more restrictive Fed message could increase bond yields and pressure risk assets. Softer data could reduce rate expectations and support Bitcoin, although the market reaction will also depend on positioning before the announcements.
ETF flows offer another test. Continued inflows would support Wintermute’s argument that institutional capital is entering earlier during weakness. Sustained outflows would weaken that explanation, particularly if Bitcoin also falls below $72,000.
The available evidence supports a narrow conclusion. Bitcoin’s deepest loss this cycle has been much smaller than the 2018 and 2022 collapses. Its present drawdown is smaller still after the August recovery.
The evidence does not confirm that June was the final bottom or that future bear markets cannot become deeper. The current cycle has produced a shallower decline so far, but that pattern remains subject to macroeconomic conditions, ETF demand and Bitcoin’s response around $72,000 and $82,000.
FAQs
Is Bitcoin currently 50% below its record?
No. At approximately $79,200, Bitcoin is about 37% below its October 2025 record near $125,653. The 50% figure better describes the cycle’s earlier maximum drawdown.
Did Bitcoin bottom in June 2026?
June produced the lowest price of the current decline and a drawdown of approximately 52.6%. Wintermute said whether it marked the final bottom “is still open.”
Why could Bitcoin’s drawdowns be getting smaller?
Possible factors include spot ETF demand, broader institutional access and deeper liquidity. These explanations remain theories rather than proven causes.
What price levels is Wintermute watching?
Wintermute identified $82,000 as the upside level to clear and $72,000 as the level that would change its view.
What happens next for Bitcoin?
Markets face U.S. inflation data and the Sept. 15–16 Federal Reserve meeting. ETF flows and Bitcoin’s response around $72,000 and $82,000 will also be closely watched.

FBI traces Bitcoin to alleged darknet opioid ring

Meredith Marks Shares An Update On Mary Cosby After Robert Jr’s Death

Alan Carr’s Surprise NTAs Win Was The Best Moment Of The Night

Memory prices are slowing because buyers ran out of money

England up in reading, maths and science rankings as Scotland and Wales dip

Phones confiscated, players sent home: Pakistan’s England tour turmoil revives memories of Mohammad Amir, Salman Butt and Mohammad Asif’s 2010 Lord’s spot-fixing scandal | Cricket News


-
Tech21 hours ago
Memory prices are slowing because buyers ran out of money
-
 NewsBeat19 hours ago
England up in reading, maths and science rankings as Scotland and Wales dip
-
Sports22 hours ago
Phones confiscated, players sent home: Pakistan’s England tour turmoil revives memories of Mohammad Amir, Salman Butt and Mohammad Asif’s 2010 Lord’s spot-fixing scandal | Cricket News
-

 Business23 hours ago
Egyptian TV Presenter Sarah Khalifa, 11 Others Sentenced To Death In Major Drug Trafficking Case In Cairo
-
 Tech23 hours ago
Strong Password Policy and Password Manager Guide
-

 Crypto World23 hours ago
Visa expands stablecoin card network to 160 programs
-
 NewsBeat18 hours ago
Tehran’s assertive rhetoric signals a new and dangerous phase in conflict
-

 Tech18 hours ago
Google’s revived nuclear power plant gets $1.9B loan from US government
-

 Sports15 hours ago
Ballon d’Or 2026 Nominees: Lionel Messi In, Cristiano Ronaldo Out; Erling Haaland Included In Top 30
-
 Business12 hours ago
Oil Higher on Hormuz Escalation, Weighing on Sentiment
-

 Politics18 hours ago
The Ultimate September Reset Guide: How To Refresh Your Mind And Life This Autumn
-

 Crypto World16 hours ago
Robinhood Stock: How To Take Advantage With Reduced Risk
-

 Tech13 hours ago
Meta debuts its Muse AI agent. Will consumers trust it?
-
 Crypto World9 hours ago
Ethereum price stalls below $2,500 as ADX drops to 11
-

 Business23 hours ago
Claim Your Share Of $50 Million Disney Streaming Price Settlement By Sept. 8 Tonight
-
 Politics22 hours ago
Critics Rip Trump After He Revives His Most Dubious 9/11 Claim
-
 Business17 hours ago
Copper hits record high, UltraTech’s Ultravolt on the offensive: A double whammy for cable makers in FY27?
-

 Fashion17 hours ago
Phia Is the Shopping App That Styles You From Your Own Closet
-

 Fashion16 hours ago
How to Safeguard Your Small Business Against Emerging Cyber Threats
-

 Crypto World22 hours ago
Iran Threatens to Target U.S. Energy Assets in Gulf If U.S. Strikes Again
You must be logged in to post a comment Login