

Business
Bearish move or buying opportunity? Geojit’s Anand James on Nifty levels and top stocks to watch

The sell-off seen in the last 30 minutes on Friday has scared traders as to what could be in the offing on Monday morning. What do you think?
IMD’s below-normal monsoon forecast and uncertainty over US-Iran talks in the backdrop gave an ominous feel to the drop that unfolded towards Friday’s close. However, the steepness of the fall is apparently due to MSCI rebalancing, with futures and options segment appearing reluctant to match such move. Nevertheless the large red candle registered on Nifty’s chart needs to be acknowledged, and we will start the new week on a cautious note. That 23500 was defended, gives us reason to be optimistic, but slippage past the same, or inability to reclaim the 10 day SMA near 23750 will confirm bearishness calling for 22800.
Nifty has been seeing profit booking at higher levels in last few weeks. What does the rollover data indicate for the June series?
The rollover data for June series suggests a cautious to mildly negative undertone despite selective strength. Nifty’s rollover dropped to 69.98% in May, below the 3-month average of 73.05%, indicating reduced willingness to carry forward positions, likely reflecting profit booking at higher levels. Similarly, Bank Nifty rollover moderation points to some cooling in conviction within the heavyweight banking segment.

Market breadth has weakened as well, with only 52% of stocks closing positive vs 91% in April, highlighting broader profit-taking pressure. While strong rollovers in select sectors like Oil & Gas, Metals, Power and Infra signal pockets of resilience, weakness in Pharma, Healthcare, and Transportation suggests lack of uniform participation.
Although long buildup was visible in Telecom, Capital Goods, and Pharma, the early trend in June appears cautious. Importantly, banks-despite prior long build-up-have started the June series on a weak footing, with heavyweights like SBI and HDFC Bank under pressure, which could weigh on Nifty due to their high index weight.
Nifty IT is showing signs of resilience even during sell-off. What are the charts indicating at?
The Nifty IT index is showing early signs of a trend reversal after a prolonged corrective phase. On the daily chart, the formation of an inverted head and shoulders pattern suggests a base-building process, with prices currently hovering near the neckline zone around the 29,500-29,600 region. A sustained move above this level could confirm a breakout and trigger momentum towards higher resistances.
On the higher timeframe, the weekly MACD is on the verge of a bullish crossover, indicating a potential shift from bearish to positive momentum. This aligns with improving price structure and supports the medium-term recovery thesis.
From a longer-term perspective, the monthly candlestick is forming a pin bar Doji, typically seen near inflection points, highlighting rejection of lower levels around the 27,000-28,000 zone and signaling demand absorption.
However, confirmation is key. Immediate support lies near 28,000, while a decisive breakout above the neckline could open upside towards 31,000-32,000. Failure to sustain above key resistance may keep the index range bound.
HFCL was among the top gainers of the week. Do you see signs of the momentum continuing in the week ahead?
Long wicked candle on Friday, with a close above upper bollinger band point to a mix of strong trending nature and emerging cautiousness. Oscillators appear reluctant, but are yet to confirm an impending collapse. With these in the backdrop, longs may be held on to, but ideally with a stop loss placed near 168.
Natco Pharma fell 14% on Friday after weak Q4 results. Do you see signs of bottom-fishing emerging in the coming week?
Yes. The single day red candle which has resulted in a break of structure, is likely to be followed by bottom fishing and a pull back rally that could extend 3-4%. However, we do not see enough signs to indicate that such pull back attempt could sustain.
Give us your top ideas of the week.
INDIANB (LTP: 833)
View: Buy
Target: 930
SL: 790
Indian Bank continues to maintain a structurally strong uptrend on the weekly chart, characterised by a series of higher highs and higher lows since early 2024. The recent profit booking since April seems to have found a support near 800 healthy consolidation after a sharp rally, with the stock holding firmly above the 780-750 support zone, which now acts as a strong demand base.
Despite the recent pullback from near 1000 levels, the correction appears time-wise rather than price-destructive, suggesting profit booking rather than trend reversal. The presence of a rising support trendline reinforces the bullish structure.
Momentum indicators are cooling off from overbought levels, which is constructive in a trending market. The RSI is stabilising near the mid-zone, providing room for a fresh upside leg, while MACD is approaching levels where a potential bullish crossover on lower drawdown could emerge.
SHYAMMETL (LTP: 973)
View: Buy
Target: 1080
SL: 930
Shyam Metalics is exhibiting a strong bullish breakout from a descending trendline on the weekly chart, indicating a potential resumption of the broader uptrend after a period of consolidation. Price has decisively moved above the 950-960 resistance zone, which also coincided with prior swing highs, adding conviction to the breakout.
The structure reflects higher lows formation, suggesting steady accumulation. Momentum indicators are turning supportive with RSI trending upward above the mid-zone, while MACD has delivered a bullish crossover with rising histogram, reinforcing improving momentum. Weekly Supertrend breakout adds to positivity. Volume expansion near the breakout area further validates buyer participation and strengthens the breakout reliability. Additionally, price holding above short-term supports near 930 indicates a favorable risk-reward setup.
As long as the stock sustains above the breakout zone, it is well-positioned to extend its upward move towards the 1080 target.

Business
Cynata Therapeutics Limited (CYYNF) Discusses Phase II Acute Graft Versus Host Disease and Phase III Osteoarthritis Trial Results Transcript

Lauren Nowak
All right. Good morning, and thank you for joining Cynata’s Clinical Trial Results Webinar. Hosting this morning is Chair, Geoff Brooke; CEO, Dr. Kilian Kelly; and Chief Business Officer, Dr. Mathias Kroll, who will take you through the Phase II acute graft-versus-host disease and Phase III osteoarthritis trial results. Then I’ll take questions at the end of the presentation. [Operator Instructions] And lastly, as a reminder, this call is being recorded and will be available on the investor hub very shortly.
I’ll now hand over to Geoff to formally commence.
Geoff Brooke
Thank you, Lauren. Geoff Brooke here, I’m the Chairman of Cynata. And as Lauren said, we have the CEO, Kilian, with us as well as the Chief Business Officer, Mathias. I’m sure like everybody else, we’re quite — more than quite, we’re very disappointed and quite shocked by the results that we’ve seen last week. And then we thought the best thing to do would be following the press release is to do a webinar and lay it all out and allow people to ask questions.
So I’m glad we’ve had so many people take up the offer. And again, I just can’t tell you how disappointed we are. Everybody has put their heart and soul into this for numbers of years, let alone shareholders’ investment in cash, hard-earned cash. So we completely understand that. We’ve in fact, put cash ourselves. So we understand the disappointment, not only from an employee point of view, a clinician point of view, but also a shareholder point of view.

Vasily Zyryanov is an individual investor and writer.He uses various techniques to find both relatively underpriced equities with strong upside potential and relatively overappreciated companies that have inflated valuation for a reason.In his research, he pays much attention to the energy sector (oil & gas supermajors, mid-cap, and small-cap exploration & production companies, the oilfield services firms), while he also covers a plethora of other industries from mining and chemicals to luxury bellwethers.He firmly believes that apart from simple profit and sales analysis, a meticulous investor must assess Free Cash Flow and Return on Capital to gain deeper insights and avoid sophomoric conclusions.While he favors underappreciated and misunderstood equities, he also acknowledges that some growth stocks do deserve their premium valuation, and its an investor’s primary goal to delve deeper and uncover if the market’s current opinion is correct or not.
Analyst’s Disclosure: I/we have no stock, option or similar derivative position in any of the companies mentioned, and no plans to initiate any such positions within the next 72 hours. I wrote this article myself, and it expresses my own opinions. I am not receiving compensation for it (other than from Seeking Alpha). I have no business relationship with any company whose stock is mentioned in this article.
Seeking Alpha’s Disclosure: Past performance is no guarantee of future results. No recommendation or advice is being given as to whether any investment is suitable for a particular investor. Any views or opinions expressed above may not reflect those of Seeking Alpha as a whole. Seeking Alpha is not a licensed securities dealer, broker or US investment adviser or investment bank. Our analysts are third party authors that include both professional investors and individual investors who may not be licensed or certified by any institute or regulatory body.

FUNDAMENTALS
Spot gold was up 1.2% at $4,209.03 per ounce, as of 0112 GMT. U.S. gold futures for August delivery fell 0.5% to $4,225.80.
An Iranian foreign ministry spokesperson said good progress has been made during the quadrilateral talks in Switzerland, according to Iran’s Press TV.
Iran-U.S. peace talks in Switzerland stretched into their second day on Monday, after a tense opening marked by Tehran’s announcement it had again closed the Strait of Hormuz and U.S. President Donald Trump repeating his threats to resume attacks on Iran.
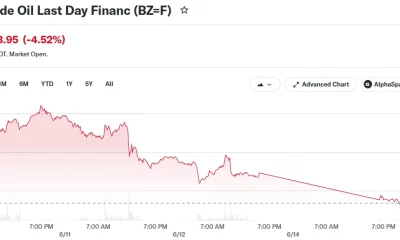
Brent crude futures fell 0.5% after Iran claimed progress in peace talks, easing fears of elevated inflation and higher-for-longer global interest rates.
Federal Reserve Chair Kevin Warsh’s emphasis on inflation in last week’s press conference, without any more-nuanced commentary about what might clear the bar for a rate hike, led investors to conclude an increase was coming soon and begin bidding up bond yields.
Most global brokerages are betting on the Fed to hold interest rates steady for the rest of 2026, reversing from expectations of two interest rate cuts at the start of the year, as policymakers navigate elevated inflation risks and a resilient labor market.
Gold demand was modest in India last week as prices fell to their lowest level in two-and-a-half months and remained volatile, while top consumer China flipped to a discount.
Swiss gold exports fell 9% in May from the previous month as lower shipments to India and Hong Kong offset higher deliveries to Britain and China, Swiss customs data showed.
Spot silver rose 2.6% to $66.60 per ounce, platinum gained 1.3% to $1,684.85, and palladium was up 1.5% at $1,276.88.
DATA/EVENTS (GMT)
0100 China Loan Prime Rate 1Y,
5Y Jun 1400 EU Consumer Confid Flash Jun

Despite rising tensions, U.S.-Iran peace talks stretched into their second day in Switzerland under the terms of a memorandum of understanding reached last week to extend a ceasefire from April for at least another 60 days.
Chris Weston, head of research at Pepperstone, said it was not surprising how quickly adherence to the terms of the deal had broken down. “Ultimately, what matters to markets is the flow of cargo through the Strait of Hormuz.”
Shipping data showed the number of ships that passed through the waterway fell sharply on Sunday after Tehran said it had closed the strait. That lifted oil prices with Brent crude futures climbing 1.30% to $81.62 a barrel. [O/R]
“The physical market remains tight and that should provide some support, but flows in FX and commodities, particularly gold, will continue to be heavily influenced by developments in the energy complex,” Weston said.
Sterling eased in early trading as traders assessed the political tumult in Britain, where Prime Minister Keir Starmer was considering his political future after rival Andy Burnham’s decisive election victory to parliament.
The pound was 0.24% weaker at $1.32055, while the euro softened 0.1% to $1.1462. The Australian dollar was last down 0.19% at $0.70035, while the New Zealand dollar last bought $0.573. Markets will be focused on Burnham’s views on fiscal policy and whether there will be any relaxation of the current fiscal rules, Commonwealth Bank of Australia strategists said.
“A loosening in fiscal rules would likely be poorly received by the UK bond market and weigh on pound,” they said in a note.
The Japanese yen slipped to 161.53 per dollar, hovering near a two-year low reached last week. A break beyond 161.96 would take the yen to its weakest level since 1986.
Japanese Finance Minister Satsuki Katayama said on Monday that authorities were prepared to respond appropriately to currency moves at any time, reiterating their previous stance.
“The MOF may be getting sore necks watching USD/JPY surge into the 2024 high,” said Matt Simpson, senior market analyst at StoneX. “Yet they may also feel powerless to do anything about it – as intervening against the tide of a hawkish Fed and strong U.S. fundamentals could prove costly and futile.”
The yen has erased gains made after a round of interventions from April 30, as a hawkish tilt by the Federal Reserve has led traders to ramp up bets on rate increases this year.
Treasuries remained under pressure on Monday with yields on 2-year notes rising to their highest since early 2025 at 4.2276%. Traders are anticipating 43 basis points of hikes this year with a 25 bp increase fully priced in by September.

The sector regulator has recalled refinancing support worth nearly Rs 500 crore —a punitive action that has set off a sweeping leadership overhaul at the company. ET was the first to report on April 13 that managing director and CEO Sachinder Bhinder was being asked to step down, with Manu Singh — former home loans head at Kotak Mahindra Bank — set to take over. A week later, on April 20, the company confirmed Bhinder’s resignation and Singh’s appointment as the new CEO.
The NHB’s investigation found that concessional refinance meant for SC/ST borrowers had been availed against loans where the borrowers did not belong to these categories.
Aavas Financiers sees top-level churn: CFO and CRO to exit, interim replacements named
Loans were also classified as disbursed in hilly areas even though the underlying properties were not located in such regions, and non-home loans had been misclassified as home loans to access preferential funding — a trifecta of classification failures that triggered the regulator’s action, sources said.
Aavas Financiers confirmed the NHB investigation, though it stopped short of acknowledging the specific findings.
“The NHB, in the ordinary course, conducts periodic audits and inspections of housing finance companies, including Aavas Financiers, and one such inspection is presently underway and has not yet been concluded,” the company said in a statement.The company added that it has not received any direction from NHB requiring it to repay any funding lines.
Sources, however, said the scale of the irregularities went well beyond what might be expected in a routine inspection.
Singapore-based fintech company Aleta aims to expand operations into India
“The regulator’s concerns were not limited to isolated instances. The inspection identified multiple cases where loans were categorised under refinance schemes that they were not eligible for, resulting in the withdrawal of refinance support and prompting a wider review of internal controls,” said a person aware of the development.
TOP EXECUTIVES TOLD TO RESIGN
CVC Capital Partners, which holds a majority stake of over 50% in Aavas Financiers, has shown the door to chief financial officer Ghanshyam Rawat and chief risk officer Ashutosh Atre in the wake of the NHB’s findings. Sources said both officials were asked to resign on June 15, though the disclosures were made only after a hastily called board meeting on June 21.
The company subsequently informed stock exchanges that it had appointed Ghanshyam Gupta as interim chief financial officer and Punit Purushottam Agarwal as interim chief risk officer, with effect from June 22.
The exits are the latest in a series of senior management departures that paint a troubling picture of how the company was conducting its business.
In the span of barely two months, Aavas Financiers has replaced its MD and CEO, CFO and CRO — an unprecedented churn at the top that reflects the depth of the crisis the company is navigating. Markets have also taken note of the turbulence. With a market capitalisation of approximately Rs 11,673 crore, the stock has declined nearly 32% from its 52-week high of Rs 2,152, trading at around Rs 1,472 — reflecting deepening investor concerns around governance, growth visibility and execution amid the ongoing management churn, according toexchange data.


Stocks rally in Asia as Iran cites progress in talks
Controversial changes to both the tax system and the NDIS are under negotiation as Labor tries to land a deal with the Greens before parliament breaks.

Motorists will benefit as a cut to fuel taxes is extended for another month, although at half the previous discount.

The combined market cap of the two companies of the RIL group is expected to be around ₹32 trillion. It will nearly match the current combined market value of ₹33 trillion for HDFC Bank, Bharti Airtel, and ICICI Bank.
At present, the market cap of the companies listed on the BSE is nearly ₹478 trillion. For the Nifty 50 set of companies, the market cap is ₹194 trillion, which implies that the RIL group’s market cap will be over 16% of the benchmark index’s market value.
Group share of BSE’s m-cap to rise to nearly 7%, and almost match combined value of HDFC Bank, Bharti Airtel & ICICI Bank
Globally, Elon Musk promoted Tesla and SpaceX together account for nearly 5% of the total market cap of the US companies. After a strong debut on Nasdaq on June 12, SpaceX commands a market cap of $2.4 trillion, while Tesla’s is $1.3 trillion. The market cap of listed companies in the US is over $77 trillion, according to the data from Bloomberg.
Internationally, technology led companies have been driving overall market valuations to record levels. For instance, Samsung Electronics and SK Hynix, the top South Korean companies based on market value, account for nearly 50% of the country’s market cap. In the case of Taiwan, chip maker TSMC contributes over 40% to the country’s market cap.
With crude oil prices falling, would growth be better than the central bank forecast? If yes, then do you think that the need to hike rates is lesser?
Yes, RBI growth and inflation forecasts were based, among other assumptions, on crude oil prices averaging $95 / barrel, which, based on oil futures, now appear likely to be lower. However, disruptions in supply chains could persist for some time, and hence it is difficult to predict the extent of growth recovery in FY27.
The MPC minutes have said that second-order input cost transmission getting embedded in retail inflation will have to be monitored. What would be the first signs visible via data that would suggest visible impact?
Second order effects are likely to manifest in core (non-food and fuel) CPI components, particularly in underlying components (excluding precious metals), indicating the extent of higher input cost pass through to retail inflation. However, it is difficult to forecast second order effects of higher input costs, which will depend on demand elasticities, input substitution and other pass through variables.The RBI Governor’s statement noted a revised FY27 core inflation at 4.7%, up from 4.4% at the April review, and headline at 5.1%, up from 4.6%. Factoring in price trends in other components, it might be possible to estimate specific inflation components.
Are current financial conditions already restrictive enough that a rate hike is unnecessary?
Although the policy repo rate is currently only 15 basis points above the FY27 forecast CPI inflation, money market and short term interest rates remain higher. RBI has also maintained system liquidity at appropriate levels. In addition, the gap between the repo rate and longer term bond yields have also risen much beyond steady state levels. Although MPC quarter wise forecasts of CPI inflation peaks in Q3 FY27, close to the upper band of the target, underlying inflation remains much lower and there are little signs of the economy overheating.
Have conditions eased after the FCNR(B) and ECB packages? Would strong inflows from these schemes reduce the need for any future monetary tightening?
Prima facie, the expected foreign currency inflows will add to autonomous domestic liquidity if even some of the inflows are absorbed by the central bank to replenish its foreign currency reserves. However, financial conditions will depend on RBI’s system liquidity management.Can it be said that growth is a bigger concern for the RBI in the current scenario, especially since inflation is projected at 5.1% and the repo rate is at 5.25%?
At the time of the MPC review, there were risks to both inflation and growth. While high frequency indicators suggested continuing resilience, they indicated a loss of momentum. This was the reason FY27 GDP forecast was a lower 6.6%, compared to the then FY26 estimate of 7.6%.

Cynata Therapeutics Limited (CYYNF) Discusses Phase II Acute Graft Versus Host Disease and Phase III Osteoarthritis Trial Results Transcript

FedEx, Micron Earnings and PCE Data Set to Shape Markets This Week
Unpacking Wyndham Clark’s U.S. Open win at Shinnecock


-
 Crypto World7 days ago
Crude Oil Plunges Over 4% as US-Iran Agreement Reopens Hormuz Strait
-

 Fashion2 days ago
Weekend Open Thread: Miami – Corporette.com
-
 Tech5 days ago
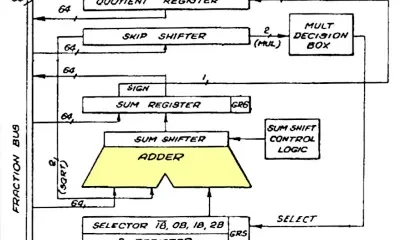
The Adder At The Heart Of Intel’s 8087 FPU
-
 Business2 days ago
Wall Street Week Ahead: Investors see Micron earnings as pulse check of AI rally momentum
-

 Crypto World2 days ago
HIVE shares jump as $220M AI deal speeds Bitcoin mining pivot
-

 Sports3 days ago
FIFA World Cup 2026: Canada beat 9-men Qatar 6-0 to register first ever win | FIFA World Cup 2026
-
 Business1 day ago
MHP SE 2026 Q1 – Results – Earnings Call Presentation (OTCMKTS:MHPSY) 2026-06-20
-

 Business3 days ago
Brexit cost 6% of UK economy, Bank of England company data suggests
-

 Business1 day ago
Soccer-U.S. defends Iran World Cup travel restrictions, says discussions ongoing
-

 Crypto World2 days ago
Jake Chervinsky accuses CME of protecting derivatives monopoly
-

 Crypto World4 days ago
Anthropic’s Dario Amodei Urged AI Unity at G7, Even as US Banned His Models
-

 Tech4 days ago
Weeks Of In-The-Field Testing And A Verdict
-

 Tech4 days ago
Adobe adds its AI assistant to Premiere, Illustrator and InDesign
-

 Entertainment1 day ago
Renter of Home in Anne Heche Crash Denies Settlement With Son
-

 Politics2 days ago
Andy Burnham and the meaning of Makerfield
-
 Crypto World2 days ago
Can Charles Hoskinson Really Rescue Cardano?
-
 Crypto World3 days ago
Iren (IREN) Stock Surges on Jefferies Buy Rating: AI Infrastructure Play Gains Momentum
-

 Politics3 days ago
BBC Reporter Discusses Cross Party Criticism Of Trumps Iran Deal
-

 Tech3 days ago
Instagram Now Lets You Add A Unique Caption To Each Carousel Slide
-

 News Videos3 days ago
IMPACT ON BITCOIN IF NO GOLD IS FOUND IN FORT KNOX
You must be logged in to post a comment Login