Here we go again, repeating our mantra that the markets are too high and vulnerable to declines. Adding to our argument, interest rates are now on the rise around the world. Stock prices have ignored this, increasing risk, especially if rates continue to rise, which appears likely in the near term.
Interest rates impact everything from valuations (as discount rates adjust) to borrowing costs. The bloated U.S. federal government deficit has been further exacerbated by defense spending and escalating interest rates, since interest expense—the debt burden—was already a disproportionate amount of the federal budget. A vicious cycle could follow if the Treasury is forced to post even higher rates to attract buyers to its continuous bond offerings.
Bond yields are primarily rising because of inflation. Core PCE, the U.S. inflation rate excluding food and energy, is running at 3.3% annually. Producer prices have leaped materially and have yet to be passed on to consumers. As a result, it’s ironic that the new Fed chair will likely need to boost administered short-term rates despite the President’s insistence otherwise. Either way, the bond market is doing its job by increasing rates, requiring a higher yield to offset risks.
Advertisement
Investors aren’t being compensated sufficiently given current market levels. Real yields (net of inflation) for short-term bonds are negative. Credit spreads between government bonds and corporates are tight, so reaching for yield is also generally unattractive. And based on several valuation metrics that have accurately forecast subsequent returns historically, forward annualized returns for the S&P 500 over the next several years are negative.
Record Low Consumer Sentiment
Consumer sentiment, which is normally high when the economy and stock markets are buoyant, is making new record lows, likely attributable to rising inflation expectations, polarized politics, falling home prices, AI-related layoffs, and the war with Iran. It’s not just a U.S. phenomenon; UK confidence is also at an all-time low. Credit card delinquencies in the U.S. are at their highest levels since 2008, car loan defaults are at multi-decade highs, and student loan delinquencies are at record-high levels. Consumers are clearly feeling pinched. Walmart (WMT) noted that their customers are fueling up less than 10 gallons per fill-up, topping off tanks since gas prices are so high. Inflation impinging upon real income growth and savings rates have also diminished.
Despite this, stock markets have powered higher. AI-related capital spending has been a significant driver of GDP growth—in Q1, all growth was attributable to AI and federal government spending. It’s propelled corporate earnings higher too.
Only time will tell whether we’ve been in a period of irrational exuberance or that the markets have been forecasting a period ahead of unusual prosperity.
Advertisement
While market bottoms tend to occur in a flash, tops are usually longer drawn-out processes. Since the U.S. stock markets now appear to be priced for perfection, right at TRAC™ ceilings, with a current seasonal headwind and rising interest rates, we suspect a rollover is imminent.
Too Many Record Highs
Primarily because of rising inflation, yields on 30-year bonds have increased to 15 to 20-year highs in the U.S., UK, France, and Japan. While the correlation between stocks and bonds has been quite low historically, they’ve moved much more in tandem since 2022. If rates keep rising, bonds should fall and, in turn, share prices too.
Since Producer Price increases are running so high, record-high profit margins are vulnerable, especially since companies may be unlikely to pass price increases along. Net profit margins (now nearly 14%) are cyclical, having fallen to 8% or below on 5 separate occasions in the last 25 years. Free cash flows are already under pressure because capital spending on AI projects has surged.
Earnings expectations appear too high. Long-term growth estimates are about 19%. Previous peaks in expectations occurred in 2000, 2018, and 2021, and each subsequently led to substantial market declines.
Advertisement
The stock market is overly concentrated. Nvidia (NVDA) and Apple (AAPL) alone are over 15% of the S&P 500. The top 10 stocks now exceed a record high 40% of the index value. Nvidia’s market cap alone has surpassed the entire Russell 2000 small cap index. Concentration may be masking the broader picture. During several recent record high days, more stocks declined than rose.
Allocations to stocks remain at record highs, which has also corresponded with market tops.
Asset managers remain overweight equities and individual investors have been using disproportionate amounts of leverage. Buying on margin and call option buying are at record highs, as is exposure to leveraged ETFs. The Market Vane Bullish Percentage index (an indicator that measures trader sentiment) is as high as it ever gets. An abundance of market optimism usually does not auger well for future returns.
The Cypress Capital Market Risk Index, that gauges vulnerability to major market drawdowns, hit 100%, its most elevated level, a mark that was only achieved near the market peaks in 1973, 2000, 2007, and 2021. In each of those instances, a much more attractive market risk level, below 40%, presented itself withing 24 months.
Advertisement
Furthermore, the seasonal period just ahead typically provides poor stock market performance. May to November has underperformed historically, but it’s much worse during a midterm election year. There’s only been one up May-to-November period for the S&P 500 in a midterm election year since the early 1960s. And the average decline from intra-year highs is 18%. Though the period that follows, through the following April, has had double-digit annualized returns with no down periods since 1950.
For the Record
With a GDP growth rate of -0.1% for Q1, Canada just triggered a technical recession—two consecutive quarter of negative GDP growth. The Purchasing Managers Index, based on surveys of executives, is showing contraction for the eurozone, though it’s still above 50, indicating expansion, in the U.S.
Economic weakness should ultimately act to suppress inflation. Because major economies, such as China, Japan, and Europe rely so heavily on oil and gas imports, this alone should quell growth thereby suppressing inflation—high prices are the cure for high prices.
As such, we continue to hedge, holding short positions (where authorized) or inverse long ETFs.
Advertisement
We have been anticipating a recession because the yield curve previously inverted, monetary growth has been weak, and unemployment is likely to rise. Our economic composite, TEC™, alerted us to a U.S. recession some time ago, though one has yet to occur.
While the current bout of inflation may carry forward for several months, it should dissipate. Ultimately, secular forces from high debt levels, poor demographics, and AI-related job losses and competitive threats should lower growth and result in disinflation. Though, if governments excessively print money to cover high budget deficits, inflation could remain problematic.
Our Model Portfolios
Our managed accounts are invested based on one or more of our Models (particular investment strategies with notional allocations of securities). A managed account’s holdings will generally be similar to its applicable Model’s, but may not hold all of them based on client-specific factors (income requirements, tax-related considerations, requests/restrictions, and cash available for purchases) and/or market forces which impact specific investment decisions from time to time.
The following descriptions of the holdings in our managed accounts are intended only to explain the reasons that we have made, and continue to hold, these investments in the accounts we manage for you and are not intended as advice or recommendations with respect to purchasing, selling or holding the securities described. Below, we discuss each of our new holdings and updates on key holdings if there have been material developments.
Advertisement
All Cap Model
The All Cap Model combines selections from our large cap strategy (Global Insight) with our small and medium cap ideas. We generally prefer large cap companies for their superior liquidity and lower volatility. The smaller cap positions tend to be less liquid and more volatile; however, we may hold these positions where they are cheaper, trading at relatively greater discounts to our Fair Market Value (FMV) estimates, making their risk/reward profiles favourable.
Orca Energy Group (ORXIF) recently announced that it entered into an agreement to divest its Tanzanian business, along with its associated commitments and liabilities. Should the transaction be completed, the company would be positioned to distribute a significant portion of its cash holdings to shareholders.
Our large cap positions are summarized in the Global Insight section.
Global Insight (Large Cap) Model
Global Insight portfolios hold large cap stocks (typically with market caps over $5 billion at the time of purchase but may include those in the $2-5 billion range) where portfolios are managed Long/Short or Long only. At an average of less than 70 cents-on-the-dollar versus our FMV estimates, our Global Insight holdings appear much cheaper, in aggregate, than the overall market.
Advertisement
In the last few months, we have made several changes in our large-cap positions. We bought Keurig Dr Pepper (KDP), Eli Lilly and Company (LLY), United Health Services (UHS),and WSP Global (WSPOF). We sold Cenovus Energy (CVE), Diamondback Energy (FANG), Grupo Aeroportuario del Sureste (ASR), Veolia Environement (VEOEY), and ServiceNow (NOW) (after buying it recently), after each ran up TRAC™ceilings near our FMV estimates and Henkel (HENKY) after it inflected down from a TRAC™ceiling.
Keurig Dr Pepper is one of the largest beverage companies in the U.S. Its portfolio includes Dr Pepper, A&W root beer, Snapple, Ghost energy drinks, Mott’s, and the Keurig coffee brewer. Last August, the company announced the acquisition of Peet’s Coffee. Investors reacted negatively. However, the acquisition appears to be a smart addition to the portfolio, especially in a post-GLP world where calorie-light coffee and energy drinks have become preferred indulgences. Though integration risk remains as with any substantial acquisition. The company now plans to split into two companies, Global Coffee Co. and Beverage Co., focused on its iconic non-coffee beverage brands. Investors have started to see the vision. Our FMV estimate is $38.
Eli Lilly and Company’s recent results have been astounding: Q1 revenue rose 56% on strong sales of key products such as Mounjaro, Zepbound, Ebglyss, and Jaypirca. Free cash flow was nearly $12 billion for the last twelve months. The company’s “key products” group, which is driving growth, generated over $13 billion of revenue, up from just $1 billion at the start of 2023. Lilly has a 60% U.S. market share in incretin analogues, and just surpassed Novo Nordisk (NVO)’s international market share. Volatility in the company’s share price has picked up around results relating to its and its key competitor’s GLP-1 efficacy. The price has risen to our $1,100 FMV estimate, but with over 30 therapies in Phase 3 and exciting technology such as VERVE-102 gene editing therapy, we are likely to raise our estimated value.
United Health Services provides acute care through hospitals and outpatient facilities and behavioural health services, primarily through inpatient centres. First quarter results were weak due to weather, a soft flu season, and volatility in state directed payments, health insurance exchange mix, and supplemental Medicaid. Medicaid-related operations accounted for 29% of 2025 revenue; however, looking at the core business model, there’s steady demand for acute and behavioural health care which should translate to mid-single-digit top-line growth and high-single-digit earnings growth. The move into virtual care, with the recent acquisition of Talkspace (TALK), a leader in virtual outpatient behavioural health care with over 6,000 licensed professionals, is underappreciated. The transaction should be accretive in the first 12 months post-close. Our FMV estimate is $240.
Advertisement
WSP Global is one of the world’s largest engineering consulting firms. The share price has been highly correlated to the software sector, investors seemingly believing that AI poses an existential threat. This appears misguided since AI should be additive for WSP. First, AI enables better design, boosts productivity, and enhances customer relationships. Second, WSP is winning data centre business, from site due diligence to data centre design, with contract win rates of 75%. Data centre power demand has exposed outdated infrastructure around the world; WSP is seeing solid growth in the U.S. and was recently appointed to the Northern Powergrid’s Engineering Services Framework to support the delivery of power to 8 million UK residents across design, planning, engineering, and commissioning. Top-line growth should be mid-single-digits and free cash flow should hit $2 billion by 2030. Our FMV estimate is $250.
Multifaceted Diversification
We can construct portfolios with multiple unique return drivers—strategies that differ in style and approach—based on bottom-up fundamentals, macro tools, or pure quantitative analysis. This can provide exposure to different styles and asset classes beyond just stock and bond indexes. The approach aims to limit volatility and drawdowns by combining investment strategies, especially where returns are less correlated. The goal is to outperform through economic cycles with low correlation, therefore less susceptibility to market index declines.
The benefits of multifaceted diversification are not only from different ways to perform but also from a portfolio comprised of strategies that are less correlated. So that when a strategy underperforms, it’s less likely to occur at the same time as another strategy, which softens the volatility and drawdowns of the overall investment portfolio.
If you wish to discuss whether our multifaceted diversification approach might apply to your personal situation and investment accounts(s), please contact your investment representative.
Advertisement
Global Tactical Allocation Model
Our Global Tactical Allocation Model (GTAM) investment process combines macroeconomic analysis with valuation and momentum. ETFs (exchange traded funds) are used to gain exposure to 4 broad asset classes: Equities—major markets, emerging markets, sectors, styles, private equity; Fixed Income—bonds issued by governments, investment grade corporations, high-yield issuers, as well as mortgages, and bond indexes; Real Assets—real estate, infrastructure, renewable energy; and Commodities—Precious Metals or Oil. GTAM emphasizes ETFs that should outperform based on the macro environment, are selling at attractive absolute and relative valuations, possess good relative price momentum, and are at TRAC™ floors.
Current exposures are: Equities (83%); Real Asets (17%), Fixed Income (7%); and Commodities (none). Its current broad themes are international equities, software, consumer staples, insurance, healthcare, and forestry.
Quantitative Investment Models
Quantitative equity strategies commonly select securities based on systematic, rules-based decisions, using technology to uncover and exploit historical statistically significant anomalies. Our quantitative equity strategies employ proprietary and systematic processes that rank large cap stocks based on factors such as relative valuation, operating metrics (quality), financial strength, and price momentum. The two models noted below select approximately 30-40 holdings from the top-ranked stocks in the model’s respective universe. TRAC™ is utilized to optimize entry and exit points.
The Quantitative Global Value Model (QGVM) invests in large-cap equities from around the world. The U.S., Canada, and Japan currently represent the top 3 countries. The top 3 sectors are Financials (25%), Information Technology (20%), and Consumer Staples (15%). The companies held in QGVM currently have the following characteristics: median forward P/E of 17.1x, ROE and ROIC of 23% and 13%, respectively, and dividend yield of 1.8%.
Advertisement
The Quantitative Canadian Value Model (QCVM) restricts its universe to Canada’s S&P/TSX Composite. The top 3 sectors are currently Information Technology (22%), Materials (21%), and Financials (19%). The companies held in QCVM currently have the following characteristics: median forward P/E of 13.2x, ROE 15%, and dividend yield of 1.5%.
Income Model
Our high-yield investment strategy has an average current annual yield (income we receive as a percent of current market value of income securities held) of about 5.0%, and most of our holdings—corporate bonds/debentures, preferred shares, REITs, and high-yielding common shares—trade below our FMV estimates.
U.S. high-yield corporate bonds ((ICE BofA Index)) yield 6.9%. The spread versus government bonds appears too narrow, less than half the historical average of 5.5%. A widening to the average implies a yield closer to 10%. If the economy weakens and corporate delinquencies increase, spreads could expand even further. As such, we continue to carry cash in most of our income accounts, awaiting better entry points.
We sold Diversified Royalty (DIVRF) when it inflected down from a TRAC™ ceiling in line with our FMV estimate.
Advertisement
Investment Grade Income Model
Our investment grade strategy utilizes a systematic process to rank Canadian investment-grade rated corporate bonds based on their duration, yield, financial strength, and momentum.
Currently, positioning has emphasized longer-dated bonds—duration is 10.3 years, 4.7 years more than the S&P Canada Investment Grade Corporate Bond Index. The average yield-to-maturity is 4.8% versus 4.1% for the index.
Records Were Made to be Broken
Markets should rise over time, achieving ever-higher record levels. Earnings rise as the economy grows and assuming fair valuation levels are maintained, new highs ought to be expected. However, market rises don’t normally occur in an up-and-to-the-right straight line. Ebbs and flows are the norm, frequently sizeable ones.
When profit margins, optimism, and exposure to stocks are all at record-high levels, near-term record highs in the markets shouldn’t be anticipated, especially when valuations are so high and the prospect of a peak in the economic cycle is elevated.
Advertisement
The markets appear ready for a timeout.
Randall Abramson, CFA
References
In this letter, ROE, ROIC, dividend yield, yield, and yield to maturity, are calculated for the respective Model portfolio based on the holdings as at the date of this letter of an actual representative account managed in accordance with such Model. These figures are neither a measure of results achieved nor projected future performance. The Model’s holdings, and therefore ROE, ROIC, and yields, are subject to change at any time and may differ among accounts managed based on the same Model.
All investments involve risk, including loss of principal. This document provides information not intended to meet objectives or suitability requirements of any specific individual. This information is provided for educational or discussion purposes only and should not be considered investment advice or a solicitation to buy or sell securities. The information contained herein has been drawn from sources which we believe to be reliable; however, its accuracy or completeness is not guaranteed. This report is not to be construed as an offer, solicitation or recommendation to buy or sell any of the securities herein named. We may or may not continue to hold any of the securities mentioned. Generation PMCA Corp., its affiliates and/or their respective officers, directors, employees or shareholders may from time to time acquire, hold or sell securities named in this report. It should not be assumed that any of the securities transactions or holdings discussed were or will prove to be profitable, or that the investment decisions we make in the future will be profitable or will equal the investment performance of the securities discussed herein. E.&O.E.
Oklo CEO Jacob DeWitte joins Mornings with Maria to discuss the rising AI energy demand, a major Meta partnership and President Donald Trump’s nuclear agenda are accelerating America’s nuclear future.
The Department of Energy on Tuesday announced $17.5 billion in conditional loans for utilities and energy companies to buy parts that will strengthen the commercial supply chain for nuclear reactors.
Energy Secretary Chris Wright said that the announcement supports President Donald Trump‘s executive order by boosting the nuclear industrial base, helping to “unleash the next American nuclear renaissance.”
Advertisement
“To accomplish that mission, these conditional loans will play an important role in reviving the supply chain needed for America to once again build large-scale commercial reactors,” Wright explained.
“They will also help accelerate the timeline of building those large-scale reactors by up to three years, lowering construction costs and ensuring the United States is able to deliver on President Trump’s bold and ambitious energy addition agenda,” he added.
The Energy Department is hoping to speed up the development of new commercial nuclear reactors through the conditional loan program. (Fox News)
The conditional loans were provided by the Energy Department‘s Office of Energy Dominance Financing (EDF). The loans aim to help achieve the goal laid out in the president’s executive order, which is to have 10 new large nuclear reactors with complete designs under construction by 2030.
Advertisement
The $17.5 billion in conditional loans will help finance five eligible projects that are sponsored by utilities and energy companies to speed up the deployment of 10 large-scale commercial nuclear reactors across the U.S. by up to three years. Each of the five loans will support two reactors at a project site.
Westinghouse, which makes the API1000 units that are the only licensed large-scale commercial reactors operating in the U.S. today, will partner with the eligible utilities and energy companies on the procurement of long-lead items at a fixed price.
Energy Secretary Chris Wright speaking during a panel, said that more than half a dozen utilities and energy companies have expressed interest in the program. (Anna Moneymaker/Getty Images, File)
Long-lead items are complex components of a nuclear power plant that require the most time to manufacture and deliver, such as reactor vessels and steam generators.
Advertisement
Each of the projects will be jointly owned by Westinghouse and the utility or energy company partner, with both required to fully commit project equity of $500 million each, for a total of $1 billion, up front before they can access the Energy Department’s loan funds.
The U.S. industry has struggled to attract investment because nuclear projects are capital-intensive, prone to cost overruns and face complex regulations – creating a riskier proposition for investors than relatively cheaper, quicker energy projects involving natural gas and renewables.
The Three Mile Island nuclear power plant is due to return to operation in the next few years. (Heather Khalifa/Bloomberg via Getty Images, File)
Wright told reporters that the loans have attracted strong interest from data center hyperscalers, which are tech giants that run cloud and computing infrastructure, as well as energy companies amid the rising demand for electricity due to the buildout of data centers that power artificial intelligence (AI) systems.
Advertisement
“We are confident that these projects will be economic for utility shareholders, ratepayers and hyperscalers,” Wright said. He added that seven utilities expressed interest, but wouldn’t disclose their names or the location of their projects.
Trump’s goal is to quadruple U.S. nuclear power capacity to 400 gigawatts by 2050, which is an aggressive target given that the last reactors built in the U.S. were delayed by seven years and faced billions of dollars in cost overruns.
Three shuttered nuclear power plants are on track to resume operations in the coming years, including Palisades in Michigan, Three Mile Island in Pennsylvania and Duane Arnold in Iowa.
Advertisement
During Trump’s first term, he used what was then known as the Loan Programs Office to help finance reactors for the Vogtle nuclear power plant in Georgia.
Wright said that the Energy Department expects the plants’ timing and cost to “well outperform what was done on Vogtle.”
NEW YORK — Exxon Mobil Corp. shares rose modestly Tuesday as the energy giant pressed ahead with plans to redomicile to Texas and highlighted its long-term growth strategy in a market buoyed by relatively stable oil prices.
The stock traded at $139.16, up 0.53 percent or 73 cents, in morning trading on the New York Stock Exchange. The move came as broader energy markets reflected ongoing attention to global supply dynamics and corporate restructuring efforts by major producers.
Exxon Mobil announced last week that its planned redomiciliation from New Jersey to Texas will take effect July 1. The shift, approved by shareholders in May, aims to align the company’s legal home with its operational heartland and potentially streamline regulatory and tax considerations.
The company has emphasized that the move supports its focus on delivering long-term value. In its first-quarter 2026 earnings release, Exxon Mobil reported earnings of $4.2 billion, or $1.00 per share. Excluding certain items and timing effects, earnings reached $8.8 billion, or $2.09 per share. Cash flow from operations stood at $8.7 billion.
Advertisement
Chairman and CEO Darren Woods has repeatedly stressed disciplined capital allocation and investment in high-return projects. The company continues advancing developments in the Permian Basin and Guyana, where production is ramping up toward significant milestones.
Analysts maintain a generally positive outlook. Bank of America recently upgraded the stock to “Buy,” citing attractive valuation and strong fundamentals. Consensus price targets hover around $163 to $170, implying upside from current levels.
Exxon Mobil’s forward dividend yield stands near 3 percent, supported by 43 consecutive years of increases. The company returned $9.2 billion to shareholders in the first quarter through dividends and buybacks.
The energy sector faces a complex backdrop. Oil prices have stabilized following earlier volatility tied to geopolitical developments and demand concerns. Exxon Mobil and peers continue navigating the energy transition while investing in conventional resources to meet near-term needs.
Advertisement
Strategic Investments and Operational Focus
Exxon Mobil’s strategy centers on leveraging its scale in upstream production, downstream refining, and chemical manufacturing. The company targets annual production growth of approximately 1.8 million oil-equivalent barrels per day by 2026, grounded in value rather than pure volume.
Key projects include expansions in Guyana, where output is expected to exceed 700,000 barrels per day over time. Permian operations also remain a priority, with efficiency gains helping offset cost pressures.
The redomiciliation to Texas aligns with these operational realities. Texas hosts significant portions of Exxon Mobil’s U.S. assets and workforce. Company officials have framed the change as enhancing long-term competitiveness without disrupting day-to-day business.
Advertisement
Analysts note Exxon Mobil’s balance sheet strength and free cash flow generation as key differentiators. Trailing twelve-month free cash flow exceeded $23 billion, providing flexibility for investments, dividends, and share repurchases.
Market Context and Challenges
Global oil markets remain sensitive to supply shifts from OPEC+ producers and demand signals from major economies. Recent reports of potential U.S.-Iran diplomatic progress added some downward pressure on prices earlier in the month, though benchmarks have since steadied.
Exxon Mobil’s diversified portfolio helps buffer such volatility. Its chemical and refining segments provide counterbalance to upstream swings. First-quarter results showed resilience despite timing effects that pressured reported figures.
Advertisement
Environmental and regulatory pressures persist. Shareholder proposals on climate and governance issues featured prominently at the May annual meeting, though management maintained strong support for its board and strategy.
The company continues reporting progress on lower-carbon initiatives while prioritizing core hydrocarbon developments. Woods has described the approach as pragmatic, balancing energy security with emission-reduction goals.
Analyst Views and Valuation
Wall Street largely views Exxon Mobil as undervalued relative to its cash flow potential and asset base. Discounted cash flow models suggest intrinsic value well above current trading levels, with some estimates exceeding $270 per share under conservative assumptions.
Advertisement
Earnings estimates for full-year 2026 reflect optimism around production ramps and efficiency. The stock trades at a forward price-to-earnings multiple in the low 20s, below historical peaks for the sector.
Risks include prolonged low oil prices, execution challenges on major projects, and evolving energy policies. Exxon Mobil’s size and integrated model provide advantages in navigating these uncertainties.
Outlook
As the second quarter progresses, investors will watch for updates on operational milestones and any further details on the Texas transition. Exxon Mobil’s next earnings report is anticipated in late July.
Advertisement
The company maintains its commitment to disciplined investment and shareholder returns. With shares showing modest gains amid broader market rotation, Exxon Mobil continues positioning itself as a reliable energy supplier capable of adapting to changing conditions.
The idea is part of a 10-year strategy aiming to better connect the region
Amy Woodward, Local Democracy Reporter
05:00, 24 Jun 2026
MetroLink tram from Manchester(Image: Local Democracy Reporting Service / NQ)
A tram network could soon be set to revolutionise transport across Bournemouth, Christchurch and Poole.
Advertisement
The proposal forms part of the BCP Growth Plan, a decade-long vision designed to transform Bournemouth, Christchurch and Poole into a better-connected, more environmentally friendly and inclusive area by 2036.
The blueprint was examined by BCP Council’s Overview and Scrutiny Board on June 15.
A central element of the plan involves enhancing transport links and reducing congestion through environmentally sustainable alternatives such as ultra-light rail.
Councillor Lesley Dedman said: “It is a wonderful wishlist and it does push all the right buttons. We all want these things, for example the advanced manufacturing hub and industrial parks, with these three towns we are short of space so it is those things I am interested in how we are going to work that out.
Advertisement
“Another thing I am not quite sure on is ultra light railway, what a fantastic idea, I am not to sure what it is but I think again those things have been tried year after year and I really hope we can get something going this time as there has always been a problem.”
Councillor Richard Herrett said: “Not a single post-war tram system has been delivered without central government funding. Which means for a tram system we are likely to need some government funding. As the devolution agenda moves forward there is potential in that, but I think where we are in that scheme remains to be seen.
“Trams are universally loved but they do take up a lot of space and that is another challenge we have in out area. I think we would love a tram system but that government funding can’t come too soon.”
The blueprint also puts forward reopening the Hamworthy branch line and implementing additional improvements to ease congestion, support commerce and enhance travel choices.
Advertisement
Redevelopment of key locations including Wessex Fields, Bournemouth Airport and Holes Bay also features prominently.
The broader strategy seeks to stimulate job creation, increase affordable housing provision, rejuvenate town centres and strengthen local communities.
It focuses on long-term expansion in established sectors such as financial services, advanced manufacturing and the creative industries.
While councillors generally back the vision, uncertainties persist around practical implementation, funding streams and the plan’s resilience to future challenges.
Advertisement
A comprehensive report on the growth plan will be considered by cabinet and council at a subsequent meeting.
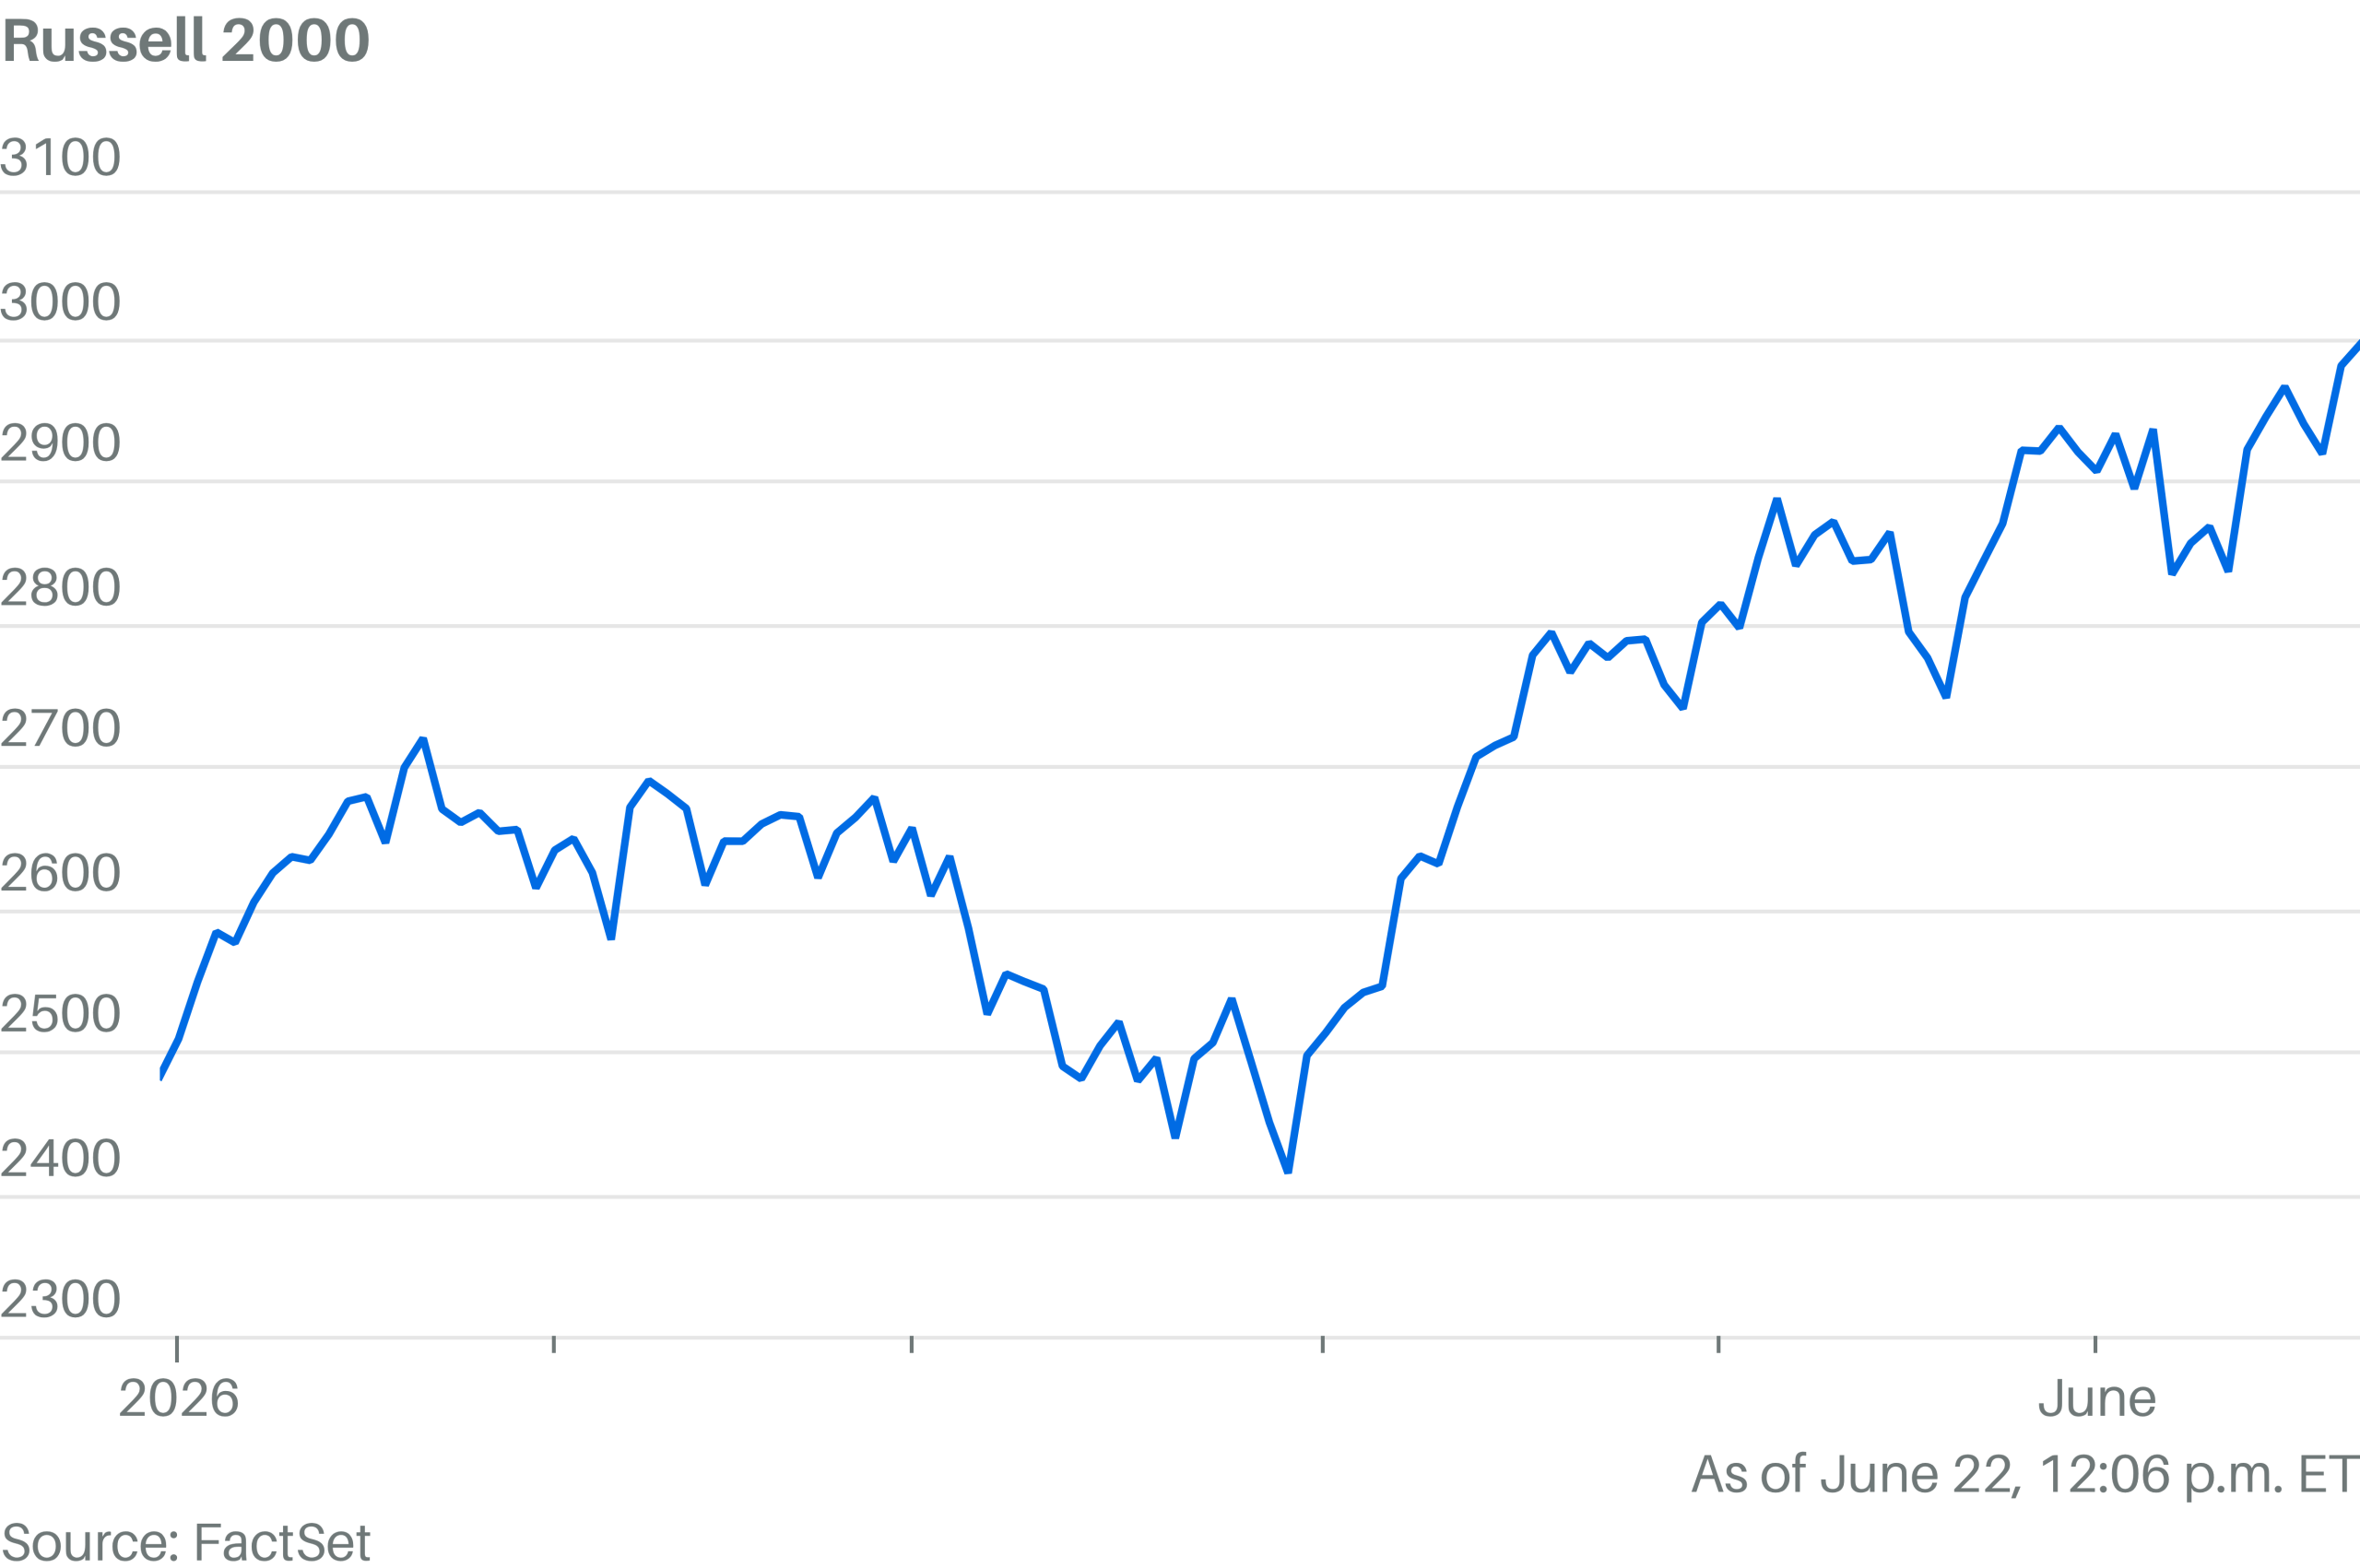
Don’t look now, but the Russell 2000 just hit 3000.
The small-cap index was up 0.7% and trading slightly above the 3000 mark. It first closed above 2000 on Dec. 23, 2020, according to Dow Jones Market Data. It first closed above 1000 on July 5, 2013.
Smaller stocks have been riding a bit of a resurgence this year. The index is up 42% in the past 12 months and 21% this year.
MorningStar Farms is voluntarily recalling two plant-based food products sold in the U.S., Puerto Rico and Costa Rica because they may contain plastic pieces, according to a notice published by the Food and Drug Administration (FDA).
The recall affects MorningStar Farms Buffalo Chik’n Nuggets and MorningStar Farms Hot & Spicy Sausage Patties. The company announced the recall on June 18, and the FDA published the notice Monday.
Advertisement
Consumers who purchased the affected products should not consume them and should instead discard the items and contact the company for a full refund, MorningStar Farms said.
No other MorningStar Farms products are included in the recall.
MorningStar Farms Buffalo Chik’n Nuggets are among the products included in a voluntary recall. (MorningStar Farms / Unknown)
The recalled Buffalo Chik’n Nuggets were sold in 10.5-ounce packages with UPC code 00028989101105 and “Better if Used Before” dates of July 7, 2027, and July 8, 2027.
Advertisement
The recalled Hot & Spicy Sausage Patties were sold in 8-ounce packages with UPC code 00028989100948 and “Better if Used Before” dates of July 5, July 6 and July 7, 2027.
The Chicago-based company said it initiated the recall because of the possible presence of plastic pieces in the food. The products were distributed in the United States, Puerto Rico and Costa Rica, according to the recall notice.
Food recalls involving foreign materials such as plastic can pose a choking hazard or risk of injury if consumed. The FDA classifies recalls involving potential foreign-material contamination among the more common food-related recalls issued each year.
MorningStar Farms Hot & Spicy Sausage Patties are being recalled over possible plastic contamination. (MorningStar Farms / Unknown)
The announcement did not indicate whether any injuries had been reported in connection with the issue or how the possible contamination was discovered.
“At MORNINGSTAR FARMS, our highest priority is protecting the safety and wellbeing of our consumers,” a Mars spokesperson said in a statement to FOX Business. “On June 18, we announced a voluntary recall of two varieties of MORNINGSTAR FARMS products in the U.S., Puerto Rico and Costa Rica because of possible plastic pieces in the food.”
The FDA classifies recalls involving potential foreign-material contamination among the more common food-related recalls issued each year. (Sarah Silbiger/Getty Images, File / Getty Images)
The spokesperson added that the recalled varieties are MORNINGSTAR FARMS Buffalo Chik’n Nuggets and MORNINGSTAR FARMS Hot & Spicy Sausage Patties, and that no other products are affected by the recall.
Consumers seeking additional information can contact MorningStar Farms Consumer Affairs Monday through Friday from 9 a.m. to 6 p.m. ET by calling 800-962-0120 or texting 877-453-5837.
Florida Attorney General James Uthmeier joins ‘Varney & Co.’ to discuss the state’s lawsuit against TikTok, alleging the platform violated Florida’s child social media law and endangered minors.
Google’s YouTube has settled a social media addiction case brought by a 15-year-old in Florida who accused the platform of causing mental health harms to children, according to the plaintiff’s lawyers.
The terms of the settlement in the state court lawsuit against the social media giant were confidential, the lawyers said on Tuesday.
Advertisement
“YouTube’s decision to resolve this case before having to face a jury speaks for itself. We will continue fighting on behalf of all those affected by social media addiction to bring these companies to justice and compel them to prioritize the safety of their young users over their bottom lines,” the plaintiff’s lawyers said in a statement, according to Reuters.
“We will continue fighting on behalf of all those affected by social media addiction to bring these companies to justice and compel them to prioritize the safety of their young users over their bottom lines.”
Google’s YouTube has settled a social media addiction case brought by a 15-year-old in Florida. (Anna Barclay/Getty Images, File / Getty Images)
Google spokesperson José Castañeda said in a statement to FOX Business that the lawsuit had been amicably resolved and that the company’s focus “remains on building age-appropriate products and parental controls that deliver on that promise.”
Advertisement
“For more than a decade, we’ve built YouTube responsibly — working with families to give young people safer, more helpful experiences online,” Castañeda said.
The teenager, who used the initials R.K.C. in court documents, argued that YouTube and other social media companies had designed their platforms to be addictive.
He said he started using social media when he was about 8 years of age and allegedly became addicted, losing sleep and suffering from depression and anxiety.
The teenager argued that YouTube and other social media companies had designed their platforms to be addictive. (Smith Collection/Gado/Getty Images, File / Getty Images)
R.K.C. is also suing Meta, TikTok and Snapchat in a trial set to begin next month in Los Angeles.
More than 3,300 lawsuits involving addiction claims against social media companies are pending in California state court, while another 2,600 cases brought by people, school districts, municipalities and states are pending in California federal court.
The first trial ended in March after a woman claimed she became addicted to YouTube and Instagram at a young age because of their attention-grabbing design. She had accused the companies of intentionally making their platforms addicting to child users.
A jury in that case found the companies negligent, ordering Meta to pay her $4.2 million in damages and Google to pay $1.8 million. Earlier this month, the judge rejected the companies’ effort to overturn the verdict.
Google, Meta, Snapchat and TikTok also settled a case last month that was heading to trial in which a Kentucky school district accused the platforms of creating a mental health crisis for its students.
The platforms paid a collective $27 million to settle that case.
Meta will also face a trial in a lawsuit brought by Tennessee next month. In August, a trial in federal court over the combined claims of multiple states will go forward against the social media giant.
63% of explainer videos don’t generate the conversion outcomes they were commissioned to produce. They get made, look polished, and end up sitting on landing pages with little measurable impact.
The reasons are usually that the video leads with the brand or product rather than the buyer’s problem; the animation style is chosen as a creative default; the explainer isn’t treated as a specific stage of the buying journey.
The studio you choose has a direct impact on which side of that statistic you end up on.
The 5 best animated explainer video production companies below were selected for their verified work, transparent processes, and ability to connect animation to business outcomes. Each one fits a different need, from full-pipeline 2D and 3D production to premium brand-led work and high-volume B2B output. After the profiles, you will also find practical sections on how to measure whether your explainer video is working and what to expect once the final file is delivered.
Best Animated Explainer Video Production Companies: Strengths and Use Cases
Here is how the five companies compare at a glance. Use the table to shortlist by specialty, budget, and rating, then read the full profiles below for the details behind each pick.
Advertisement
Studio
Founded
HQ
Clutch
Hourly rate
Specialties
Best for
Wow-How Studio
2009
San Francisco and London
4.9/5 (166)
$25–$49
Full-pipeline 2D and 3D explainers, motion graphics, product demos
Products needing 3D, or one vendor across many formats
Webdew
2016
Surrey, Canada
4.9/5 (197)
$50–$99
Whiteboard, 2D, character animation, kinetic typography, product demos; plus HubSpot and inbound marketing
A dependable, scalable partner, especially alongside wider marketing
MyPromoVideos
2009
Coimbatore, India
Not listed
Undisclosed
2D and 3D animated explainers; process and product explanation; sales, corporate, case-study videos
B2B and technical companies explaining complex processes
Cartoon Media
2012
Canterbury, England
4.9/5 (8)
$50–$99
Custom whiteboard, doodle, and explainer or training videos
Premium, fully custom whiteboard work with blue-chip polish
Ydraw
2011
Saint George, Utah, USA
5.0/5 (10)
$150–$199
Whiteboard and video scribing; also 2D/3D, motion graphics, demo videos
Whiteboard projects where hand-drawn craft and flexibility matter
1. Wow-How Studio
Wow-How Studio is one of the best animated explainer video production companies, as it keeps every stage in-house, from concept development, scripting, and storyboarding through 2D animation, 3D modeling, motion graphics, voice-over, and post-production. It delivers more than 500 projects a year for clients ranging from early-stage startups to Fortune 500 companies.
Explainers has been Wow-How’s core service since 2011, with the full pipeline run in-house from discovery call to final delivery, including black-and-white storyboard sketches, full-color style frames, character and background illustration, animation, voice-over, sound design, and delivery of final files with source assets.
On the 2D side, the team offers character animation, whiteboard, kinetic typography, infographic, cut-out, shape, and frame-by-frame styles, while the 3D team models, textures, lights, renders, and composites from scratch or from client CAD files for hardware, industrial equipment, and medical devices. A 90-second 2D video takes 6 to 8 weeks; a 3D video adds 1 to 2 weeks, and 2 free revision rounds are included at every stage.
Quick facts
Advertisement
Founded: 2009
Based in: San Francisco and London
Clutch: 4.9/5 (166 reviews)
Specialties: full-pipeline 2D and 3D explainers, motion graphics, product demos
Standout work: A UK-based industrial automation company supplied a CAD model and received a complete robotics explainer covering the full process from storyboard through post-production, delivered on time and within budget. In a separate engagement, a sustainable building materials manufacturer commissioned seven installation explainers, each running 1 to 2 minutes.
Best for: products needing 3D, or one vendor across many formats. Keep in mind: the breadth suits multi-format programs more than a single quick video.
2. Webdew
Webdew has grown from a single person into a global team of more than 50, with its base in Seattle and offices in India, the UK, and Canada. Animation sits inside a broader B2B SaaS growth offering that also spans HubSpot, web development, and inbound marketing, but video is a deep competency in its own right: nearly 200 Clutch reviews praise its animation quality, clear script-to-storyboard-to-animation process, and on-time delivery, especially across tech, education, and healthcare. It produces whiteboard, 2D, character animation, kinetic typography, line art, and product demo videos. Some clients note that the update frequency during delays could be tighter.
Quick facts
Founded: 2016
Based in: Surrey, Canada
Clutch: 4.9/5 (197 reviews)
Specialties: whiteboard, 2D, character animation, kinetic typography, product demos; plus HubSpot and inbound marketing
Notable sectors: tech, education, healthcare
Hourly rate: $50 – $99
Standout work: Webdew produced an animated explainer for a hospitality and leisure company, writing the script and refining it in response to the client’s suggestions. The client featured the video at two trade shows and has since reused it across other marketing activities, noting that the team stayed easy to reach and consistently available to answer questions and hit deadlines despite an anticipated language barrier.
Best for: companies seeking a dependable, scalable partner, especially alongside broader marketing efforts. Keep in mind: it is a broad agency, so confirm the video team fits your scope.
Advertisement
3. MyPromoVideos
MyPromoVideos is a boutique Indian studio that has focused on animated explainers since 2009, producing more than 2,000 videos that clearly explain business processes. It works in both 2D and 3D, running the full pipeline from script and storyboard to animation, graphics, voice-over, music, and revisions, and also handles sales, corporate, and case-study videos.
Its 21 Clutch reviews lean toward technical and B2B clients, from software firms to logistics-automation companies, and reviewers consistently note competitive pricing, on-time delivery, and clear communication.
Quick facts
Founded: 2009
Based in: Coimbatore, India (serves clients worldwide)
Specialties: 2D and 3D animated explainers; process and product explanation; sales, corporate, and case-study videos
Notable focus: technical and B2B sectors, including software and logistics automation
Hourly rate: Undisclosed
Standout work: A 90-second explainer for a software development firm building a test-automation tool for the automotive domain. MyPromoVideos handled the script, storyboard, animation, graphics, voice-over, and music, delivering a video that measurably improved users’ understanding of the product.
Best for: B2B and technical companies that need complex processes explained clearly in 2D or 3D. Keep in mind: it is a boutique team, so plan timelines around larger volumes.
Advertisement
4. Cartoon Media
Cartoon Media is a UK studio that produces fully custom animated marketing and training videos, including explainer, doodle, and whiteboard styles, and is trusted by blue-chip names well beyond its size, including Siemens, Hilton, Allianz, and the NHS.
The team never uses clip art or templates, assigns a dedicated professional to every stage from script and storyboard through custom illustration, native-accent voice-over, and music, and works on an unlimited-corrections basis. Reviewers, including international clients, repeatedly highlight strong value for the cost and responsiveness.
Quick facts
Founded: 2012
Based in: Canterbury, England (delivers internationally)
Clutch: 4.9 / 5 (8 reviews)
Specialties: custom whiteboard, doodle, and explainer or training videos; full custom illustration, native-accent voice
Notable clients: Siemens, Hilton, Allianz, NHS
Hourly rate: $50 – $99
Standout work: Multiple whiteboard explainers for the affordable-housing company Eden Housing, one breaking down an employee reward program and another explaining the tax-credit system, helping onboard current and new employees.
Best for: brands wanting premium, fully custom whiteboard work with blue-chip polish. Keep in mind: a small team and light review count, so confirm capacity for larger programs.
Advertisement
5. Ydraw
Ydraw is one of the most established whiteboard studios in the US, founded in 2011 in Saint George, Utah, with a team spread across three continents. It was an early experimenter with style variations, including watercolor, colored, and hybrid versions, and its hand-drawn sketching detail is widely regarded as among the best in the category.
Beyond whiteboards, it handles motion graphics, 2D and 3D animation, demo videos, and video ads, with custom artwork, scripts, voice-over, and music, and turnaround times of 1 to 5 weeks. Reviewers single out its clear, well-structured process and the value of the finished work.
Quick facts
Founded: 2011
Based in: Saint George, Utah, USA (team across three continents)
Clutch: 5 / 5 (10 reviews)
Specialties: whiteboard and video scribing (watercolor, colored, hybrid styles); also 2D/3D, motion graphics, demo videos
Standout work: Ydraw produced five hand-drawn whiteboard videos, each running 1 to 2 minutes, to illustrate a set of business concepts, managing all sound effects and editing. Reviewers called the production high quality and clear, with the value of the deliverables far exceeding the project’s cost.
Best for: whiteboard projects where hand-drawn craft and flexibility matter. Keep in mind: whiteboard is the core, so it is less suited to high-end 3D or cinematic work.
Advertisement
What Happens After Your Explainer Video Goes Live
The final file is a milestone, not the finish line. Knowing what comes next keeps expectations realistic and protects the value of the work.
Revisions wrap up first. Most studios include a set number of revision rounds at each stage, and those should be resolved before final delivery. Confirm what counts as a revision versus a new request, since changes after sign-off are usually billed separately.
Format variants for different channels. A single explainer rarely fits every placement as-is. Plan versions tailored to where it will run, such as a web cut, a shorter social edit, and a silent, captioned version for feeds where most videos play without sound.
Vertical cuts for social. Square and vertical 9:16 versions are now essential for mobile and social platforms. Ask whether these are included or quoted separately, since reframing animation for vertical can require real rework rather than a simple crop.
Source files and ownership. Confirm receipt of the final files and decide whether you also need the editable source assets. Having the source makes future edits far easier and is worth settling in the contract.
Future updates. Products, pricing, and branding change, so most explainers need a tweak within a year or two. Ask how the studio handles later edits, including cost and turnaround for swapping a logo, updating a figure, or producing a localized version.
Performance check-ins. Build in a point a few weeks after launch to review the metrics from the chapter above. If the video underperforms, a small recut or a stronger thumbnail and intro often lifts results without a full reshoot.
How to Measure the ROI of an Explainer Video
Before launch, set a baseline. Without it, you can’t tell whether post-launch movement is a lift or a normal fluctuation. Record the current number for the metric you want the video to affect (e.g., conversion rate, support ticket volume, or time to activation). That is the number you measure against.
Conversion rate on the page. Landing pages with an embedded explainer video can convert at up to 86% higher rates than text-only pages, and controlled tests on B2B SaaS pages have shown lifts of 100%+. Run an A/B test for 2 to 4 weeks, keeping the video as the only variable. If sign-ups or demo requests rise on that page, you have a direct signal of impact.
Watch time and drop-off point. Videos under 1 minute achieve a 65% completion rate among B2B viewers. For videos over 20 minutes, that number falls to 20%. If viewers drop off before the call to action, the issue is often pacing or a script that takes too long to get to the point. The drop-off timestamp shows exactly where the cut needs work.
Support and onboarding load. Track the support ticket categories that the explainer was designed to reduce. If repeat questions on a specific topic declines, that is a measurable outcome. If the goal was onboarding, pair that data with time-to-first-value to see whether new users are reaching value faster.
Sales influence. B2B companies report that video influences 40%+ of the sales pipeline on average. Ask sales to log when the explainer was shared with a prospect, then compare these deals with agreements where it wasn’t used. Look for faster progression, higher close rates, or fewer repeated objections.
Timeline for ROI. ROI for explainer videos is usually measurable within 3 to 6 months, not in the first few weeks. That matters when reporting internally, especially if the video supports top-of-funnel education or a longer B2B buying cycle.
Reuse value. One 90-second explainer can be repurposed into a 30-second paid ad, a 60-second LinkedIn version, and an email teaser from the same production. Track how often those assets are reused across channels over 12 months. As usage increases, cost per use drops, which can materially improve ROI by year-end.
Final Thoughts
Treat your explainer like the investment it is. Pick the studio whose specialty and budget match your project, define the one outcome you want it to move, and set a baseline before launch so you can prove the return later. The five studios here all do strong, verifiable work; the right one for you is simply the one built for your format and goal.


You must be logged in to post a comment Login