For most small businesses, inventory is the second-largest use of cash after payroll and rent. Yet it rarely gets managed with the same discipline. Payroll runs on a schedule. Rent is a fixed line item. Inventory, by contrast, is often tracked in a spreadsheet that someone updates when they remember to, or not tracked in any structured way at all until a bestseller runs out mid-season or a storage unit fills up with stock that stopped moving a year ago.
That gap matters more for a small business than a large one. A national retailer that misjudges demand on one product line barely notices. A small business that ties up a third of its working capital in the wrong stock can spend months recovering.
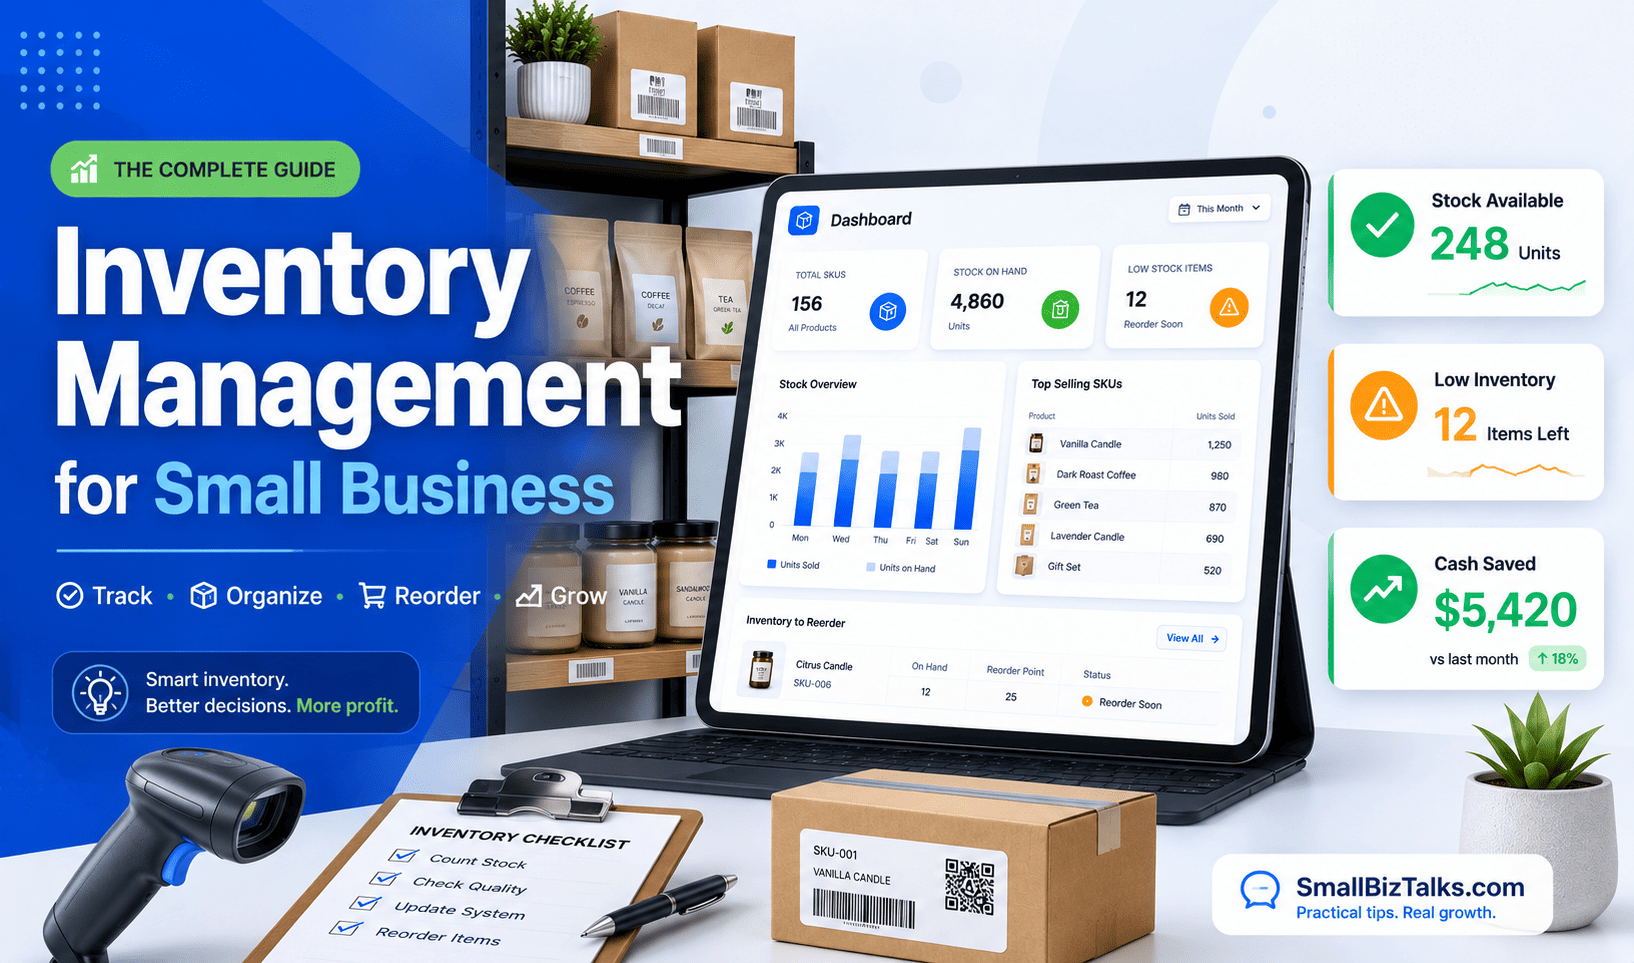
This guide covers what inventory management actually involves, the core methods worth knowing, how to build a working system from scratch, and where a spreadsheet stops being enough.
What Inventory Management Means for a Small Business
Inventory management is the process of tracking, ordering, and controlling the stock a business buys and sells, so it has the right amount of product on hand without tying up more cash than necessary.
Advertisement
At a large company, that process is usually a dedicated function with its own software and staff. At a small business, it’s typically one person, often the owner, doing it alongside sales, hiring, and everything else.
That difference shapes the whole approach. A small business can’t absorb the cost of overstock the way a larger one can, and it usually can’t negotiate the supplier terms that make just-in-time ordering low-risk. The goal isn’t to copy enterprise inventory practices at a smaller scale. It’s to run a version built for thin margins, limited storage, and one or two people managing it.
Why Small Businesses Struggle With It
The challenges are fairly consistent across industries, even though the products differ.
Knowing how much to buy. Order too much and cash sits on a shelf instead of in the business. Order too little and a customer walks out empty-handed or worse, buys from a competitor and doesn’t come back.
Advertisement
Limited space. Most small businesses don’t have a warehouse to absorb excess stock. A storage closet or a corner of the shop floor has to do double duty, which makes overbuying a physical problem as much as a financial one.
Manual tracking errors. Spreadsheets and handwritten logs drift from reality fast. A miscount here, a forgotten update there, and the numbers on paper stop matching what’s actually on the shelf.
Supplier leverage. Small businesses generally don’t have the order volume to negotiate the pricing or flexible terms that larger buyers get, which makes lead times and minimum order quantities harder constraints to work around.
Seasonal and demand swings. A slow month can look like healthy inventory levels right up until a rush hits and reveals how thin the buffer actually was.
Advertisement
None of these are solved by one trick. They’re solved by picking a method that fits the business and applying it consistently, which is the next section.
Core Inventory Management Methods
A handful of methods cover most of what a small business needs. Few businesses use just one; most combine two or three.
ABC Analysis
ABC analysis sorts inventory into three tiers based on value and sales impact, not just volume:
A items : a small share of SKUs that drive the largest share of revenue or cost. These get the closest attention: frequent counts, tighter reorder rules, stronger supplier relationships.
B items : moderate value, moderate attention. Monthly reviews are usually enough.
C items : the bulk of the catalog by count, but a small share of value. Quarterly review is often sufficient, and some businesses move slow C items to special-order only.
The practical benefit is focus. A business with 500 SKUs doesn’t need to watch all 500 with equal intensity, it needs to watch the 50 or so that actually move the needle.
A quick example: a boutique candle shop carries 120 SKUs. Ranking them by annual revenue shows that 18 scented candles account for roughly 70% of sales – those become A items, checked weekly. The next 30 or so items (seasonal scents, gift sets) make up another 20% of revenue and become B items, reviewed monthly. The remaining 70-plus SKUs – one-off colors, discontinued scents still on the shelf – generate the last 10% and become C items, counted quarterly and candidates for clearance if they don’t move.
Advertisement
FIFO (First In, First Out)
FIFO means the oldest stock sells first. It’s standard for anything perishable or trend-sensitive – food, cosmetics, seasonal apparel – where holding onto older inventory too long turns it into a write-off. Rotating stock physically (older items to the front) makes FIFO easy to enforce without extra software.
Reorder Point (ROP)
The reorder point is the stock level that triggers a new order, calculated as expected demand during the supplier’s lead time, plus a buffer for uncertainty (safety stock):
Reorder point = (average daily sales × lead time in days) + safety stock
Example: a product sells 8 units a day, and the supplier takes 6 days to deliver. Lead-time demand is 48 units. Add a safety stock buffer of 15 units for demand variability, and the reorder point is 63 units – the moment stock hits that number, it’s time to order, not the moment the shelf looks low.
Advertisement
Economic Order Quantity (EOQ)
EOQ estimates the order size that minimizes total cost by balancing ordering costs (placing and receiving an order) against carrying costs (storing it). It’s most useful for A-tier items with steady, predictable demand for volatile or seasonal products, it tends to oversimplify.
Just-in-Time (JIT)
JIT means ordering stock to arrive right when it’s needed, minimizing how much cash sits in storage. It works well when suppliers are fast and reliable. For a small business with a single supplier and a multi-week lead time, it’s a riskier fit – a single delayed shipment can mean empty shelves with no buffer to absorb it.
Building an Inventory System, Step by Step
Most small businesses don’t need a sophisticated system on day one. They need a consistent one.
1. Pick one tracking method and commit to it. Spreadsheet, dedicated software, or a hybrid, the specific tool matters less than using it consistently. Switching methods every few months is what causes the drift that leads to phantom inventory: stock that exists on paper but not on the shelf, or vice versa.
Advertisement
2. Set par levels and reorder points for your top sellers first. Trying to calculate reorder points for an entire catalog on day one is a good way to never finish. Start with the 15–20 SKUs that drive most of the revenue, using the ABC framework above, and expand from there.
3. Build in cycle counting. Instead of one exhausting annual count, count a rotating slice of inventory on a regular schedule – A items weekly or biweekly, B items monthly, C items quarterly. Discrepancies get caught while they’re small, not after they’ve compounded for a year.
4. Connect inventory to your books. If sales, stock counts, and accounting live in three disconnected places, someone is doing manual reconciliation and manual reconciliation is where errors hide the longest. Setting up a solid framework for small business bookkeeping ensures your inventory costs accurately flow into your financial statements.
Spreadsheet or Software? Knowing When to Switch
A spreadsheet is a perfectly reasonable inventory system for a business with a small catalog and one sales channel. The signs it’s time to move on are fairly clear:
Advertisement
Stock counts are wrong often enough that staff double-check before promising a customer availability
The business sells across more than one channel (in-store, online, marketplace) and keeping them in sync manually eats real time each week
Inventory tracking is taking hours a week that could go toward the business itself
The business has outgrown a single location
When those signs show up, a handful of tools cover most small business needs:
Small manufacturers and makers tracking raw materials and production
Paid plans only, no free tier
*Confirm current pricing directly with each vendor, plans and rates change frequently.
None of these is universally “best” – the right one depends on sales channels, whether the business manufactures anything, and what it already uses for point-of-sale or accounting. It’s worth testing free tiers or trials against actual order volume before committing to a paid plan. If the business is also choosing accounting software around the same time, best small business accounting software is worth reading alongside this, since the two decisions often affect each other.
Inventory KPIs Worth Tracking
A few numbers reveal whether an inventory system is actually working, beyond a gut sense of “we seem to be running low on things.”
Inventory Turnover Ratio
How many times inventory is sold and replaced over a period, calculated as COGS [cost of goods sold – the direct cost of the products a business sells, defined in detail in the IRS’s Tax Guide for Small Business] ÷ average inventory value. A low ratio suggests overstocking or slow-moving products; a very high one can mean the business is understocked and risking stockouts.
Advertisement
Carrying Cost
The cost of holding inventory, including storage, insurance, and capital tied up. It typically runs 20–30% of inventory value per year. When working with tight cash margins, cutting unnecessary overhead – whether by avoiding overstocking or using free payroll software for your team, helps keep operating capital free for inventory replenishment.
Stockout Rate
The share of demand that couldn’t be met because an item was out of stock. This one is easy to underestimate, since a stockout often shows up as a customer who simply leaves rather than a complaint that gets logged.
Sell-Through Rate
The percentage of received stock that actually sells within a given period. A consistently low sell-through rate on a product is usually the clearest early signal that it needs to be discounted, bundled, or dropped.
Mistakes That Quietly Cost Small Businesses Money
Buying in bulk without running the carrying-cost math. A supplier discount for ordering 500 units instead of 100 looks like savings on the invoice. If 300 of those units sit unsold for six months, the storage and capital cost can erase the discount entirely.
Advertisement
Counting inventory once a year and trusting the number the rest of the time. A lot can drift in eleven months. Cycle counting catches problems while they’re still small and cheap to fix.
Treating every sales channel as the same pool of stock. A business selling in-store and online without synced inventory will eventually oversell a product on one channel while it sits unsold in the other.
Ignoring supplier lead time until it becomes urgent. Reorder points built on the assumption that a supplier will always deliver on time tend to fail exactly when they’re needed most – during a supplier’s own busy season.
Not distinguishing A items from C items. Applying the same level of attention to a top seller and a slow-moving accessory wastes time on the products that matter least and under-manages the ones that matter most.
Advertisement
Where to Start
A small business doesn’t need every method in this guide running at once. The practical starting point is narrower: pick a tracking system, calculate reorder points for the products that actually drive revenue, and build in a counting rhythm that catches errors before they compound. Everything else – software, KPIs, more advanced methods like EOQ – is worth adding once that foundation is in place, not before.
Reports of violent incidents and harassment on rail services “rose substantially” last year, figures from the rail regulator show.
Reported assaults, including physical and verbal, were up 36% in the year to March 2026 compared with the previous year, according to the Office of Rail and Road (ORR).
In total 13,464 assaults against passengers and members of the public were recorded on Britain’s mainline railway, the highest number recorded since the series began in 2004.
The ORR said the figures were “concerning” and that it was working with the industry to address the problem.
Advertisement
According to the figures, harassment increased by 52% compared with the previous year and common assaults rose by 30%.
The increase comes against a backdrop of five years of rising reports of incidents and industry campaigns to raise awareness.
Assaults on the mainline railway are recorded according to their type. As a result each incident can lead to reports in more than one category, for example if someone is harassed and then physically assaulted.
There were also 11,289 reported assaults against members of the workforce on the mainline railway, up 12% compared with the previous year.
Advertisement
Of those 2,487 were physical assaults, while more than half (6,390 incidents) involved verbal abuse. The rest were threats.
“We’re working with industry and our trade union colleagues to address work-related violence and harassment,” said Richard Hines, the ORR’s chief inspector of railways.
“This includes understanding where the risks are, putting effective controls in place, encouraging staff to report incidents and providing appropriate support afterwards,” he said.
The statistics include mainline rail services in England, Scotland and Wales, but not Northern Ireland. The data release also covers the London Underground, trams, metros and other light rail services.
Advertisement
On the London Underground, recorded assaults increased 20% to 5,534 in the latest year, but reported workforce assaults fell 3% to 3,525.
Transport for London does not record multiple aspects of each incident. Instead it records the most severe aspect reported.
A spokesperson responding on behalf of Network Rail and the train companies said all operators were working to reduce risk and prevent harm by sharing information, improving reporting processes and deploying body-worn cameras.
“Keeping passengers and colleagues safe is at the heart of everything we do,” the spokesperson said.
Advertisement
“Violence, abuse and intimidation directed at passengers or staff are completely unacceptable. The rail industry works closely with British Transport Police to investigate incidents, support victims and bring offenders to justice.”
The RMT union, representing rail industry workers, said the figures corresponded with the union’s own figures indicating two-thirds of its members had experienced violence at work.
RMT general secretary Eddie Dempsey called for an increase in staffing on public transport, including an end to lone working, to combat the problem.
“We also clearly need stronger legal protections for public transport workers against assaults at work,” he said.
Advertisement
He said cuts to British Transport Police funding had been “disastrous” and called for outsourced security and enforcement staff to be brought in-house “as a matter of urgency”.
Other notable figures from the statistical release include that 11 members of the public died at mainline level crossings in the latest year, six more than the previous year. Eight were pedestrians and the others were road vehicle users.
SYDNEY — Australia’s benchmark share index fell 0.76% to 8,699.1 points by mid-afternoon Thursday, down 66.2 points, as a sharp overnight surge in oil prices tied to doubts over a potential U.S.-Iran peace deal outweighed encouraging domestic employment data that had briefly lifted investor sentiment earlier in the session.
The S&P/ASX 200 opened sharply lower Thursday, dropping 1.3% to 8,650 points at the market open, before recovering some ground through the morning and early afternoon to trade closer to flat by 2:58 p.m. local time. The decline followed losses on Wall Street overnight and came alongside a broad-based pullback across the local market, with 148 of the index’s 200 constituent stocks trading lower and all but two of the market’s major sectors posting losses for the session. The metals sector weighed particularly heavily on the broader index, with copper prices retreating from near-record highs.
The primary catalyst behind Thursday’s weakness traced back to a sharp jump in global oil prices. According to Bloomberg data, West Texas Intermediate crude climbed 2.4% to $92.70 a barrel, while Brent crude surged 4.1% to $103.35 a barrel, with the moves attributed to growing doubts over the prospects for a U.S.-Iran peace deal. That renewed uncertainty marked a reversal from the more optimistic tone that had prevailed in markets earlier in the week, following reports that Iran had offered to reopen the Strait of Hormuz if the United States eased military pressure and lifted its blockade on Iranian ports.
The rise in oil prices provided a clear tailwind for Australia’s energy sector, with Woodside Energy Group and Santos both positioned to benefit from higher crude prices heading into Thursday’s session, even as the broader index struggled under the weight of losses elsewhere in the market.
Advertisement
Thursday’s session also carried significant domestic economic news, with Australia’s August labour market data released during the trading day. Betashares chief economist David Bassanese offered a generally reassuring interpretation of the figures despite some mixed underlying signals. “While the August labour market report was somewhat mixed, the overall strength in employment will likely be the final nail in the coffin for a Reserve Bank interest rate increase next week,” Bassanese wrote, noting that the jobless rate had risen alongside stronger workforce participation, a combination he characterized as reflecting genuine underlying employment strength rather than economic weakness.
That reading suggested reduced pressure on the Reserve Bank of Australia to raise interest rates at its upcoming policy meeting, a notable shift from earlier in the week, when the central bank had flagged concerns about inflation risks potentially building amid elevated energy costs and firm domestic demand. Thursday’s employment data appeared to ease at least some of that pressure, even as the day’s broader market action was ultimately dominated by the oil price shock tied to the Middle East.
Thursday also brought a wave of dividend payments across several major ASX 200 constituents. PLS Group, Telstra Group, ResMed, Ramsay Health Care and Rio Tinto were all among the companies distributing dividends to shareholders during the session, with Rio Tinto paying a fully franked interim dividend of $2.96 per share.
Elsewhere on the market, Bell Potter reiterated its Buy rating on agricultural chemicals company Nufarm, raising its price target to $3.90 from $3.75, citing an improved outlook for the stock.
Advertisement
Thursday’s pullback followed a choppy but ultimately mixed stretch of trading earlier in the week. The ASX 200 closed essentially unchanged Wednesday, edging up 0.086% to 8,765.3 points according to one tracking service, though a separate data source measured a slight decline to 8,751 points, a discrepancy reflecting differences in how various providers calculate end-of-day closing levels. That indecisive session followed a stronger performance Tuesday, when the index added 26 points, or 0.3%, to close at 8,758, supported by a rally in U.S. chip stocks tied to optimism around Meta’s newly unveiled artificial intelligence agent, along with hopes for progress in Middle East diplomatic talks held on the sidelines of the United Nations General Assembly and anticipation ahead of a bilateral summit between the United States and China.
That U.S.-China summit was scheduled to take place Thursday, with tariffs, critical minerals and broader economic ties between the two countries expected to be discussed, adding a further source of potential market-moving news for investors to monitor as the session progressed.
Gold mining stocks had been standout performers earlier in the week, with Catalyst Metals surging 6.57% Wednesday to close at $6.16 despite no specific company news, part of a broader rally across gold-related shares that also lifted Northern Star Resources, Evolution Mining, PLS Group and Sandfire Resources.
The ASX 200 remains down roughly 3.87% over the trailing month and has retreated significantly from the all-time high of 9,198.6 points it touched in February, before settling closer to the 8,800 level by July. With the Reserve Bank’s interest rate decision now just over a week away, and the outcome of Thursday’s U.S.-China summit still unfolding, investors are likely to continue weighing the competing signals from domestic employment strength, elevated oil prices tied to Middle East uncertainty, and the broader path of global monetary policy in the sessions ahead.
The Newcastle firm saw a small rise in revenues and profits during 2025 but says it is seeing record spending on its park this year
Parkdean Resorts’ Cresswell Towers site in Northumberland (Image: Dan Prince for Parkdean Resorts)
North East holiday park operator Parkdean Resorts has hailed a “resilient” year which saw a small rise in revenues and profits.
The Gosforth-based firm, which operates 65 caravan parks around the UK, said its revenues for 2025 rose 3.3% to £527.7m. Over the same period, gross profit edged up by £1m to stand at £380.9m
Parkdean said its 2025 performance had come despite “significant inflationary and operating cost pressures”, and that it was seeing performance so far this year. It said that spending on its parks had reached record levels in 2026, with particularly strong performances in its food and drink, activities and leisure divisions.
It also pointed to the success of TV and social media campaigns in increasing its engagement with customers. The company is now planning a £70m capital investment programme for next year to enhance parks, including rolling out its “parks of the future” concept to its Thorness Bay park on the Isle of Wight and Skipsea Sands, at Bridlington.
Advertisement
A spokesperson for Parkdean Resorts, said: “Following a resilient 2025, we have seen trading performance accelerate throughout 2026 and the business has delivered double-digit profit growth. Demand for our quality, affordable UK holidays remains strong and we also delivered record on-park spend during the peak season, including all-time highs across food & beverage, and activities, as guests continue to make the most of our parks.
“Our 2025 results demonstrate the resilience of the business. Maintaining growth and stable profitability was no small achievement given the significant inflationary and operating cost pressures facing the sector. Against a backdrop of continued economic uncertainty and subdued consumer confidence, we delivered a solid performance, underpinned by the strength of our brand, the quality of our parks and the commitment of our teams.
“The momentum we’re seeing in 2026 is the result of a clear long-term strategy. This year we invested £55m across our parks, accommodation, facilities and guest experiences, as well as our technology and digital capabilities, to improve the experience for guests and holiday homeowners. That investment is delivering results, with growing demand, increasing brand awareness, stronger social media engagement and record levels of guest spending across our parks.
“We continue to see opportunities for growth in the UK holiday market. With a portfolio of 65 parks in some of the UK’s most sought-after coastal, lakeside and countryside locations, a highly engaged team and the ongoing support of our shareholders, we are well positioned for the future.”
Advertisement
Parkdean Resorts operates sites around the UK, with locations in the North East including Crimdon Dene, Cresswell Towers, Whitley Bay, Church Point and Sandy Bay.
Fox News host Jimmy Failla discusses Starbucks resolving a Florida DEI lawsuit with a nationwide agreement and Michigan Democratic U.S. Senate nominee Abdul El-Sayed’s seemingly dodging questions about Hasan Piker on ‘The Evening Edit.’
Starbucks announced plans to close roughly 250 stores across North America this week, company COO Mike Grams revealed Thursday.
Grams announced the closure in a public statement, saying that while most of its 18,000 North American stores were profitable, a small portion has been struggling.
Advertisement
“We have carefully reviewed our North America coffeehouse portfolio and identified locations where we do not believe we can consistently deliver the experience we want for customers and partners or where we don’t see a path to acceptable financial performance,” Grams said in the announcement, which was in the form of a letter to “Partners.”
People pass by a Starbucks coffee shop in Manhattan, New York, on Jan. 15, 2025. (Mostafa Bassim/Anadolu via Getty Images / Getty Images)
“As a result, we will close approximately 250 coffeehouses later this week. This represents approximately 1% of our more than 18,000 North America coffeehouses,” he added.
“Closing any coffeehouse is a difficult decision, and we know today’s news will be hard for the partners, customers and communities affected,” the statement said.
The announcement comes just days after Starbucks resolved a DEI lawsuit in Florida last week. The coffee giant will pay Florida $1 million and will not use race- and sex-based goals, quotas and preferences in employment practices companywide under a sweeping settlement.
The new class action lawsuit claims Starbucks is discriminating against lactose-intolerant customers by charging extra for nondairy options. (Photos by Stephen Chernin/Waldo Swiegers/Bloomberg via Getty Images / Getty Images)
Florida Attorney General James Uthmeier’s office confirmed to Fox News Digital that the agreement applies to all Starbucks operations nationwide, not just the company’s locations in Florida.
“Every Floridian deserves to be hired, promoted and compensated based on merit, qualifications and character — not race or sex,” Uthmeier told Fox News Digital. “This resolution ensures that Starbucks’ policies and practices fully comply with Florida’s civil rights laws. DEI can never be an excuse to violate civil rights.”
The negotiated resolution ends the lawsuit Uthmeier filed in December 2025 accusing Starbucks of violating the Florida Civil Rights Act through racial and sex-based goals, quotas and preferences in its workplace policies.
A sign embellished with the Starbucks logo hangs near the entrance to the Starbucks coffee shop in Aspen, Colorado. (Robert Alexander/Getty Images / Getty Images)
Under the agreement, Starbucks committed to complying with the state civil rights law, which prohibits race- and sex-based preferences in hiring, promotions, pay, executive compensation, mentorship programs, supplier selection and board composition.
Advertisement
The company also agreed it will not participate in organizations that require it to increase the racial diversity of its board of directors.
Starbucks’ chief legal officer will be required to submit annual certifications of the company’s continued compliance for four years. The company will also pay $1 million to the Florida Department of Legal Affairs to reimburse the office for the time, expenses and costs of bringing the case.
Fox News’ Stepheny Price contributed to this report.
Deal supports AO World’s expansion into new categories
Simon Hunt www.cityam.com
12:15, 24 Sep 2026Updated 12:16, 24 Sep 2026
A Jessops store in Birmingham after it was relaunched by Dragons’ Den star Peter Jones in 2013(Image: PA)
AO World has sealed a deal with Dragons’ Den star Peter Jones to snap up ailing camera retailer Jessops.
Advertisement
The online retailer kept the acquisition price under wraps but confirmed the purchase was funded from its “existing cash resources.”
AO World said the deal “supports our strategy of expanding into adjacent categories, giving customers and members more reasons to shop with AO and increase our share of wallet. Jessops brings a trusted brand and specialist expertise in cameras and optical technology.”
Established in 1935, the camera retailer was salvaged by Peter Jones following its collapse into administration in 2013.
Jones reopened scores of stores that had been closed down, but by 2019 the business tumbled into administration for a second time, followed by a third collapse in 2021, as reported by City AM.
Advertisement
The business now trades from merely eight stores, having previously operated more than 300 across the country, following a dramatic withdrawal from the high street.
Jessops generated just under £20m in revenues for the year ending September 2025, its latest accounts reveal, marking a 6.5 per cent rise on the previous year, driven by growing online sales.
The firm recorded a loss of £1.1m for the year, marginally down on 2025.
“I am delighted to welcome Jessops into the AO family and look forward to growing the existing business as well as integrating the category into the wider AO business,” said AO World founder and chief executive John Roberts.
AO World announced on Thursday that it anticipated reporting a 5.5 per cent increase in sales and a rise in profit exceeding 20 per cent for the six months ending in September, attributing the growth to enhanced performance in its mobile and handset division.
“There continues to be a lot of uncertainty in the world but we look forward to heading into peak trading with confidence and momentum behind us,” Mr Roberts said.
ASX-listed GenusPlus Group will extend its working relationship with Atmos Renewables, after securing a significant design and construction-based contract.
LOS ANGELES — Actor Jonathan Taylor Thomas, known for his role on the 1990s sitcom “Home Improvement,” was arrested this week on charges of resisting and obstructing a law enforcement officer, according to TMZ, which cited law enforcement sources familiar with the incident.
According to those sources, Thomas was a passenger in a vehicle that was pulled over Monday in Westlake Village, California. Deputies conducting the stop instructed Thomas to remain inside the vehicle, but he exited the car and was described by law enforcement sources as uncooperative. Sources told TMZ that Thomas appeared to be drunk in public at the time and resisted deputies during the encounter.
Thomas was subsequently arrested and booked into the jail at the Malibu/Lost Hills Sheriff’s Station on Monday, according to jail records reviewed by TMZ. He was released from custody a short time after being booked. A representative for Thomas did not provide comment when contacted by TMZ regarding the arrest.
Thomas, now in his 40s, first rose to fame as a child actor playing Randy Taylor, the middle son on the long-running ABC sitcom “Home Improvement,” which aired from 1991 to 1999 and starred Tim Allen as the show’s lead. The role made Thomas one of the most recognizable young television stars of the 1990s, and he went on to lend his voice to Simba in Disney’s animated film “The Lion King” and its sequel, further cementing his profile with audiences during that period.
Advertisement
Following the end of “Home Improvement,” Thomas largely stepped back from the intense public spotlight that had defined his childhood and teenage years in entertainment, taking a deliberate step away from acting to attend college, a decision that was frequently cited at the time as a notable departure from the more typical career trajectory of former child stars. He later returned to acting in more limited capacities, including television guest appearances and directing work, while maintaining a considerably lower public profile than during his peak years of fame on “Home Improvement.”
Monday’s arrest marks a rare instance of Thomas generating significant news coverage in recent years, given how far he has largely retreated from the entertainment industry spotlight since his time as a regular presence on network television in the 1990s. The specific charges of resisting and obstructing an officer are typically treated as misdemeanor offenses under California law, generally involving allegations that a person interfered with or failed to comply with a law enforcement officer’s lawful commands during an encounter, rather than allegations of more serious criminal conduct.
Details about the underlying traffic stop that led to Thomas’s arrest, including why the vehicle he was riding in was initially pulled over, were not included among the information provided by law enforcement sources to TMZ. It also remains unclear whether Thomas was the driver or purely a passenger with no direct involvement in whatever prompted deputies to initiate the stop in the first place, beyond the confirmation that he was riding as a passenger at the time.
Westlake Village, where the traffic stop occurred, sits within an area of California patrolled by the Los Angeles County Sheriff’s Department’s Malibu/Lost Hills station, the same facility where Thomas was booked following his arrest. Booking and release on the same day, as occurred in Thomas’s case, is a common outcome for arrests involving misdemeanor-level charges rather than more serious felony allegations, particularly when the arrested individual does not have other outstanding legal issues that would complicate their release.
Advertisement
As of the most recent available reporting, no additional legal proceedings tied to the arrest, including formal charges, an arraignment date, or a statement addressing the incident directly from Thomas himself, had been publicly disclosed. TMZ noted that a representative for the actor was reached for comment but declined to address the situation when contacted following news of the arrest.
Thomas’s arrest adds to a string of recent celebrity legal and personal news stories that have circulated in entertainment coverage this week, though the relatively minor nature of the charges against him, resisting and obstructing an officer rather than any more serious offense, distinguishes his situation from other more significant legal matters involving public figures reported around the same time.
With Thomas already released from custody and no further public statements issued by his representatives, the incident appears, based on currently available information, to represent a single, isolated legal matter rather than the beginning of a more extended legal process, though that could change if California prosecutors ultimately decide to pursue formal charges connected to Monday’s traffic stop and arrest.
MINNEAPOLIS — Jeffrey Harmening, chairman and chief executive officer of General Mills Inc., said the food company is “off to an encouraging start in fiscal ’27,” as top-line results in the first quarter built on momentum in latter part of fiscal 2026.
“Our ‘remarkability’ playbook is working, driving improved top-line performance by delivering stronger product innovation and renovation focused on the benefits consumers are looking for today,” Harmening said in reporting quarterly results on Sept. 23. “And we have more work to do.”
For the quarter ended Aug. 30, net income fell 67% to $397 million, equal to 74¢ per share on the common stock, from $1.2 billion, or $2.22 per share, a year earlier. General Mills attributed the decrease primarily to lower operating profit.
Excluding a valuation loss on held-for-sale business, transaction and acquisition integration costs, asset impairments, and restructuring and transformation charges, among other items, adjusted net earnings fell 14% to $403.6 million, or 75¢ per share, from $469 million, or 86¢ per share, a year ago. The result topped Wall Street’s average estimate for adjusted earnings per share of 72¢.
Advertisement
Operating profit dropped 63% to $633.6 million and on an adjusted basis was down 11% to $634 million. General Mills said the decrease mainly reflects a year-ago $1 billion gain from the divestiture of its yogurt business a year ago, along with lower gross profit dollars this fiscal year.
“We’re continuing to deliver industry-leading cost savings in a volatile environment,” Harmening noted. “We are on track to deliver $750 million in savings this year between our holistic margin management program, our transformation initiative and other efficiency efforts. This work is about more than cost mitigation and reduction. It’s about making General Mills future-fit, modernizing how we operate, reimagining our supply chain and building the flexibility to innovate faster.”
First-quarter net sales totaled $4.39 billion, down 3% from $4.52 billion a year earlier. General Mills said the decline came primarily from the impact of the US yogurt divestiture, while “organic net sales essentially matched year-ago levels.” Organically, net sales in the 2027 quarter were flat, including a 1% decrease in volume.
“In terms of first-quarter performance, organic net sales were flat to last year, adjusted operating profit was down 11% and adjusted diluted EPS was down 13%,” Harmening said. “These results finished ahead of our expectations, driven largely by improved retail sales trends in North America Retail, North America Foodservice and International, as well as a good start on our cost savings programs.”
Advertisement
Dana McNabb, chief operating officer, noted that General Mills “entered fiscal ’27 with a stronger foundation,” citing “decisive action we took last year to bring more value to consumers by adjusting base prices to address key price cliffs and gaps.”
Brands such as Pillsbury, Cheerios and Annie’s have seen more innovation and renovation this year, General Mills said.
“With that investment behind us, our full focus this year is on accelerating our pace of product innovation and renovation to deliver more of the lasting benefits that consumers are looking for today,” she said. “This includes more protein and fiber, clean labels, bold flavors, fun and indulgence, and pet humanization. And we’ll leverage our strategic revenue management toolkit to strengthen price/mix, with a particular focus on mix. I’m encouraged by the early signs of progress we’re seeing in Q1, driven by our focus on Remarkability, and it is evident in the results we delivered this quarter in North America Retail (NAR).”
For the core NAR unit, first-quarter net sales fell 7% to $2.45 billion from $2.63 billion, reflecting a 4-point headwind from the sale of the US yogurt business. Organic net sales were down 3% on decreases of 2% in volume and 1% in price/mix. Segment operating profit declined 15% to $478.6 million.
Advertisement
General Mills said NAR’s performance included year-over-year net sales decreases of 14% for the Big G Cereal & Canada business unit (reflecting the impact of the yogurt divestitures) and 6% for US Snacks, while sales came in flat for US Meals & Baking Solutions. The company said that, “as expected,” organic sales lagged Nielsen-measured retail sales by about 1 point, pointing to changes in retailer inventory, but noted that dollar share trends strengthened in most of its priority categories.
“NAR retail sales improved by roughly 2 points versus fiscal ’26, as we made our products and brand communications stand out more for consumers,” McNabb said. “We’ve increased the contributions from innovation and renovation in NAR this year, with core brands like Cheerios, Annie’s and Pillsbury and new brands like La Tiara and Wanchai Ferry. We’ve also stepped up our marketing game, bringing in new agency partners, building a next-generation content studio and doubling our use of influencers to maximize our reach and engagement.
“And we have further to go,” she said. “While most of NAR’s priority businesses delivered improved market share trends in Q1, some are not yet back to absolute share growth, and we’re focused on improving this trajectory.”
Quarterly net sales rose 1% to $523.1 million for the North America Foodservice unit and climbed 4% to $794.3 million for International. North America Pet sales were flat at $612.8 million. Operating profit rose 12% for Foodservice and 14% for International but sank 12% for Pet.
Advertisement
“With solid first-quarter results, improving in-market momentum, and our transformation and cost savings work on track, we are reaffirming our full-year fiscal ‘27 guidance,” Harmening said.
For fiscal 2027, General Mills forecasts adjusted EPS of $3 to $3.20, organic net sales of down 1.5% to up 0.5%, and an adjusted operating profit decline of 8% to 13%.
Yes. Corporate subscriptions are available for teams and organisations, with discounted rates as user numbers increase. Pricing starts from $1,625 + GST per user. Get in touch
to discuss the right option for your organisation.
Business News subscriptions are used by executives, investors, consultants and professionals who need to stay informed and make better decisions about the WA market. When you subscribe you’ll get
Unlimited access to WA’s most trusted business journalism
Data & Insights — detailed profiles of WA companies, people, projects and deals
MyBN — a personalised feed based on the companies, people and sectors you follow
Special publications and industry reports
Daily and weekly email newsletters
Data & Insights is a research tool built specifically for the WA market. It draws on more than 30 years of Business News reporting, updated regularly to reflect what’s happening now. Use it to:
Look up detailed profiles of WA companies, including financials, directors and ownership
Find decision-makers and track their career movements
Research live and completed projects across WA industries
Monitor deals, appointments and market activity
Access industry rankings and league tables
Data & Insights is updated daily by our dedicated research team, which uses the latest announcements, ASX filings and editorial coverage to keep our person, company, list and project records up to date.
Business News welcome all opportunities to make our dataset accurate, complete and current, so if you have an update request, please email the team at general@businessnews.com.au, and we’d be happy to assist.
Advertisement
MyBN
is part of every subscription. It’s your personalised view of Business News. You can follow the companies, people, sectors and projects that matter to you, and get a news feed and alerts tailored to your interests. You can save articles to read later and retain only what you need.
Only subscribers have full access to all content on the Business News website.
Advertisement
If staying informed about the WA economy is part of your job, and/or you’re looking for networking opportunities in WA, Business News is built for you.
Business News subscribers are:
Executives and directors tracking competitors, clients and market movements
Investors and advisers researching companies, deals and industry trends
Consultants and professionals staying across sectors relevant to their clients
Business owners looking for leads, context and market intelligence
Most Business News publications cover national or global markets. Business News is focused entirely on Western Australia, which means the journalism, the data and the intelligence are all built around WA companies, people and projects — not adapted from a national feed. Data & Insights, included with every subscription, combines more than 30 years of WA-specific editorial research with live business data. There’s no comparable product for the WA market.
Advertisement
The Morning Digest Email provides a comprehensive wrap of the major headlines, relevant to WA business, and includes with a snapshot of the overnight news covering oil, gold and ASX-listed companies.
The Afternoon Wrap Email focuses on the news covered by our team of journalists during the course of the working day, including exclusive stories and analysis, all of which relates to WA business and the local economy.
The BN Weekender Email contains a wrap of the Business News from the week that was, highlighting the top stories in each area of WA business. Sign up for free.
Advertisement
We’re happy to help. Get in touch
and our team will come back to you.



























































You must be logged in to post a comment Login