

Business
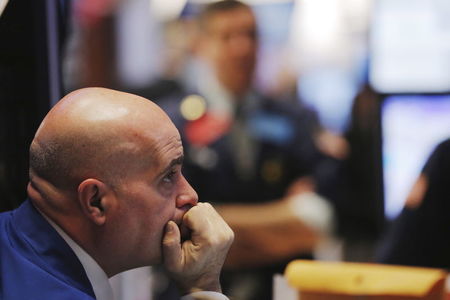
Oil prices to hit $150? How Indian stock markets may react as Iran war rages on

Crude oil prices crossed the key psychological mark of $100 per barrel last week, the first time since Russia’s invasion of Ukraine in 2022. Despite attempts by the US administration to reassure markets, the conflict in the oil-rich Middle East continues to intensify.
Iran has warned that oil prices could surge to as high as $200 per barrel if the conflict escalates further. Mojtaba Khamenei, Iran’s new supreme leader and son of Ayatollah Ali Khamenei, described the Strait of Hormuz as a strategic “tool of pressure” that must remain shut during the conflict. In a message aired on state television, he also warned that US military bases across the region could face attacks as Iran seeks retaliation for casualties from the conflict.
Oil prices have risen amid growing expectations that the Strait of Hormuz may remain shut, disrupting global energy trade. The narrow 33-km waterway connecting the Persian Gulf and the Gulf of Oman carries more than 20% of the world’s oil and gas shipments, making it one of the most critical chokepoints in global energy markets.
What lies ahead for oil prices
Global crude oil prices could rise to $120 per barrel in the near term and potentially reach $150 per barrel if the war continues for over a month and geopolitical tensions remain elevated in West Asia, said Kayanat Chainwala, Assistant Vice President at Kotak Securities.

“Any prolonged disruption to this trade route will be bullish for crude oil and negative for other commodities, as it fuels inflation concerns and could delay interest rate cuts,” Chainwala said.
A report by Nuvama also noted that crude prices could climb to $150 per barrel if the Strait of Hormuz remains closed for four to eight weeks. However, such extreme price levels could eventually lead to demand destruction and trigger alternative supply responses.The report added that Asian economies are likely to bear the brunt of the disruption, as nearly 13 million barrels per day (mbpd) of oil shipments to countries including China, India, Japan and South Korea pass through the Strait of Hormuz.
Meanwhile, Systematix Institutional Equities said global crude markets have entered a phase of heightened volatility over the past two weeks, driven by the destruction of oil and gas assets in West Asia, which has added a strong geopolitical risk premium to prices.
“Tanker freight rates and insurance premiums for vessels passing through high-risk zones have also surged, significantly raising procurement costs,” the brokerage said.
How Indian stock markets may react
The Nifty 50 fell 5.3% last week as the Iran–Israel conflict, a weakening rupee, persistent FII outflows and concerns over fuel supply weighed on sentiment. While Systematix expects near-term volatility to impact valuations, it continues to prefer Reliance Industries, Petronet LNG, Deep Industries and Gulf Oil as long-term bets.
According to Vinod Nair, Head of Research at Geojit Investments, market direction in the coming weeks will largely depend on developments in the Iran conflict and the trajectory of crude prices, given their implications for inflation, corporate margins, the current account deficit and RBI policy flexibility.
“A firm dollar and higher US bond yields may keep FIIs selective and volatility elevated. Selective value opportunities may emerge in fundamentally resilient and domestically driven sectors, while energy-sensitive segments could remain under pressure if crude prices stay elevated,” he said.
He added that domestic institutional buying has provided some cushion, but a sustained market recovery would likely require clear signs of geopolitical de-escalation, stabilisation in crude prices and improved clarity on fuel supply dynamics.
Siddhartha Khemka, Head of Research – Wealth Management at Motilal Oswal Financial Services, said market volatility is likely to persist as geopolitical tensions disrupt the energy market and keep risk sentiment fragile.
“Indian equities have seen a sharp correction in 2026 amid heightened global uncertainty, resulting in significant erosion of market value across segments,” Khemka said.
The Nifty 50 has declined over 11% so far this year, while the Nifty Midcap and Smallcap indices are down around 10% each. In March alone, the Nifty has fallen about 8%, marking its steepest monthly decline since the pandemic-driven crash of March 2020.
On the currency front, the Indian rupee recently hit a record low of Rs 92.45 against the US dollar as rising energy prices and risk-off sentiment heightened concerns about India’s current account deficit, given the country imports nearly 88% of its crude oil requirements.
Elevated oil prices have also intensified concerns around inflationary pressures, widening external balances and pressure on corporate margins, prompting investors to trim equity exposure and shift towards safer assets.
“Rate-sensitive and cyclical sectors such as banking, financial services and automobiles have seen notable selling pressure,” Khemka added.
Looking ahead, markets are expected to remain highly sensitive to developments in the West Asia conflict, movements in crude oil prices and trends in foreign fund flows.
“Persistent foreign outflows and elevated oil prices could keep sentiment cautious, while any signs of easing geopolitical tensions may provide relief to markets,” he said.
(Disclaimer: Recommendations, suggestions, views and opinions given by the experts are their own. These do not represent the views of The Economic Times)

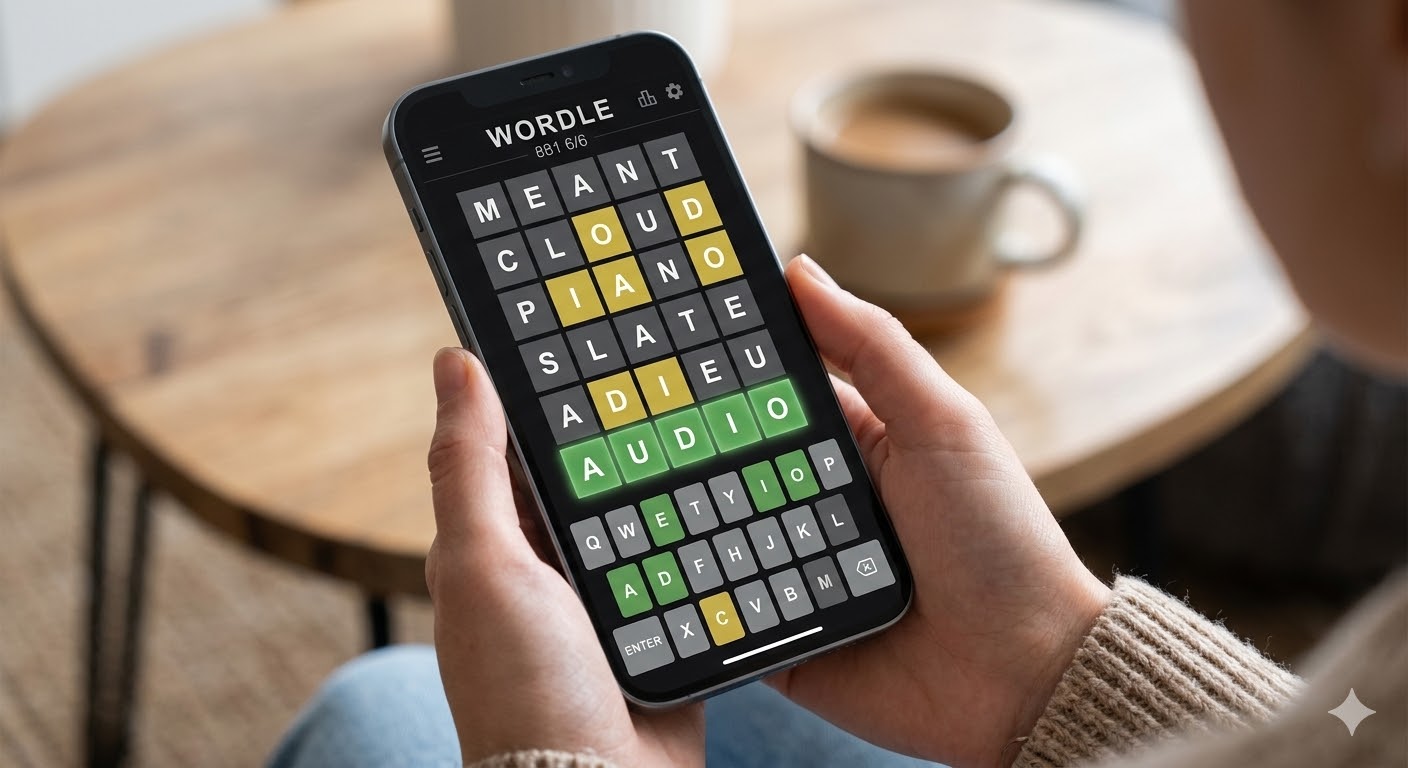
Saturday’s Wordle puzzle sent players guessing through a word with several unrelated everyday meanings, tripping up some solvers who initially leaned toward livestock-related terms before landing on the correct answer. The solution to Wordle #1,855 for July 18, 2026, is BOOTH.
The word functions as a concrete noun describing a small, enclosed or semi-enclosed space designed for a specific purpose, and it carries several distinct meanings depending on context. A voting booth offers privacy for casting a ballot, a restaurant booth refers to a seating arrangement with high-backed benches, and a telephone booth, a glass-and-steel enclosure once common on city streets before the smartphone era, has largely become a relic of the past. The word also serves as a well-known surname, most notably belonging to John Wilkes Booth, the man who assassinated President Abraham Lincoln at Ford’s Theatre on April 14, 1865.
Structurally, BOOTH features two vowels and three consonants, with one repeated letter: the double “O” that sits in the second and third positions of the word. Puzzle trackers noted that the word begins with the letter B, a relatively uncommon starting letter within the broader pool of Wordle answers, a detail that helped narrow the field of viable guesses for players paying close attention to letter frequency.
Hint sites offered a graduated series of clues throughout the day for players seeking assistance without having the answer spoiled outright. Early hints described the word as referring to a small enclosed area or space designed for a specific purpose, something a person might encounter at restaurants, events, fairs or voting locations, often providing separation or privacy from the surrounding area. Later hints noted the word could describe either a temporary shelter for livestock or an enclosure for privacy, a detail some outlets flagged as intentionally broad to avoid giving away the answer too directly. A final round of clues pointed to the word’s connection to Lincoln’s assassin as the most specific hint offered before the full answer was revealed.
Several puzzle trackers flagged specific false trails that players should watch out for when solving a word like BOOTH, given its double-letter structure. Words such as BOOTS, BOONS and BOOZE were cited as plausible near-misses that share the same opening letters and vowel pattern, potentially leading solvers astray in the middle rounds of guessing before the correct word became clear. The doubled “O” in particular was noted as a common trap in Wordle, since players who confirm one instance of a letter sometimes rule out the possibility of that letter appearing again elsewhere in the word, a habit that can slow down solvers when a puzzle features repeated letters, as has also been the case with past Wordle answers like SHEEP and BLOOM.
According to the New York Times’ WordleBot, which tracks daily performance statistics, detailed completion data for Saturday’s puzzle was still being compiled as of publication, following a pattern in which the previous day’s puzzle, Wordle #1,854 and its answer LEGAL, saw players average roughly 4.0 guesses in easy mode and 3.9 in hard mode, according to WordleBot’s tracking. That reflected a moderately challenging solve for Friday’s law-related word, which also featured a repeated letter in its own double “L” structure.
Wordle, the daily five-letter word-guessing game, was originally developed by software engineer Josh Wardle before its public release in 2021. The game’s simple format, a single new puzzle released once each day worldwide alongside a built-in system for sharing color-coded results without spoiling the answer for others, helped fuel its rapid rise in popularity following its debut. The New York Times acquired the game in early 2022 and has continued publishing a new puzzle daily ever since, with Wordle now standing as one of the paper’s most widely played digital features alongside its Connections, Strands and traditional Crossword puzzles.
Puzzle strategists offered several general tips applicable beyond Saturday’s specific solution. Players are commonly advised to use an opening guess capable of testing several commonly used vowels and consonants at once, helping narrow down which letters belong in the final word before committing to more targeted guesses in later rounds. Solvers are also encouraged to remain open to the possibility of repeated letters rather than assuming every letter in the answer is unique, particularly once several rounds of guessing with distinct letters have failed to produce a solution. For players down to their final two guesses, hint sites recommended prioritizing words that fit all previously confirmed letter placements and exclusions over riskier guesses aimed purely at eliminating additional letters, a strategy generally better suited to earlier rounds of the game when more attempts remain available.
Saturday’s puzzle continued a stretch of varied Wordle solutions throughout the week, following Friday’s LEGAL and Thursday’s BUTTE, a geological term describing an isolated hill with steep sides and a flat top that similarly tripped up players who initially guessed the more common landform term MESA. The run of specialized vocabulary across recent days, spanning law, geology and now a multi-purpose noun tied to voting, dining and a notable historical figure, reflected the broad range of subject matter the puzzle draws from in selecting its daily answers.
Alongside Wordle, the Times also published its daily Spelling Bee puzzle for the previous day, July 17, with a center letter of U and a pangram of ALBUMEN, along with the independently operated word-association game Contexto, whose July 17 answer was ICON, according to puzzle trackers monitoring related word games.
For players who came up short on Saturday’s puzzle, hint sites emphasized that a single missed day need not disrupt a broader Wordle habit, encouraging solvers to return the following day for puzzle #1,856. Wordle’s daily reset occurs at midnight in each player’s local time zone, meaning the puzzle refreshes independently around the world rather than at a single fixed global moment, continuing the game’s now-familiar rhythm of one shared puzzle experienced individually across time zones by millions of solvers each day.
Saturday’s edition of The New York Times’ Connections puzzle sent players dribbling through basketball terminology, personal convictions, video game mechanics and a tricky wordplay category built around the word “pop,” offering a moderately challenging board that the game’s own difficulty tracker, Connections Bot, rated 4 out of 5.
Connections challenges players to sort 16 words or phrases into four hidden groups of four, with each group tied to a shared theme. The categories are ranked by difficulty and color-coded accordingly, running from yellow for the most straightforward group to purple for the trickiest, which frequently leans on wordplay, hidden patterns or double meanings. Players are allowed four total mistakes before the puzzle ends, and the daily game, one of the Times’ most popular offerings alongside Wordle, continues to draw a large and devoted following since its 2023 launch.
Saturday’s yellow group, the day’s easiest category, centered on ways to commit a basketball violation: CARRY, DOUBLE DRIBBLE, GOALTEND and TRAVEL. Each term describes a distinct rule infraction in basketball, ranging from illegally palming the ball while dribbling to interfering with a shot on its way toward the basket. Puzzle commentators noted the category was likely to resonate quickly with sports fans, given how commonly these terms are used in broadcasts and casual conversation about the game.
The green group asked players to identify words meaning belief: ATTITUDE, MIND, OPINION and VIEW. Each word can function as a way of describing a person’s outlook or stance on a given topic, though several solvers reported initial confusion over this category, mistaking it for a grouping tied to components of formal debate rather than personal conviction more broadly. That ambiguity reflects a recurring challenge in Connections puzzles, where words carrying multiple plausible meanings can pull players toward incorrect early guesses before the intended theme becomes clear.
Moving into the blue category, the puzzle’s third-hardest group, Saturday’s theme centered on elements commonly tracked during video game play: HEALTH, LIVES, SCORE and TIME. Each of these represents a standard piece of on-screen information players monitor throughout a gaming session, whether tracking remaining health points, extra lives, an accumulating score total, or a countdown clock. Commentators described the category as likely to appeal strongly to gamers, given how universally these tracked elements appear across countless video game genres and eras.
The purple group, traditionally the most difficult and prone to misdirection, asked players to identify words that could each follow the word “pop”: CULTURE, FLY, QUIZ and TART. Adding “pop” in front of each word produces a commonly recognized term or phrase: pop culture, popfly, pop quiz and pop tart. One player detailed their own path through the category in published commentary, describing initial uncertainty over whether “fly” referred to a zip fly on clothing before ultimately recognizing it as a baseball term describing a high, arcing hit, more precisely known as a “pop fly.” That same player noted mistakenly selecting “score” for the purple category instead of “fly,” an error attributed to the word’s plausible fit within the video-game-tracking theme of the blue group, illustrating how the puzzle’s categories are often deliberately constructed to create this kind of overlap and confusion.
Puzzle trackers following Saturday’s board noted several intentional red herrings built into the grid, designed to nudge solvers toward incorrect groupings before the true categories became apparent. Words tied to personal conviction, competitive statistics and multi-meaning phrases have each proven to be recurring sources of confusion in past Connections puzzles, and Saturday’s board leaned into that pattern while adding its own twist through the “pop” wordplay in the purple category.
For players working through the puzzle without hints, general strategy guidance suggests beginning with the most straightforward, tightly defined categories, such as Saturday’s basketball-violation yellow group or its belief-based green group, before moving on to categories requiring lateral thinking or wordplay recognition. Players are also encouraged to watch for words that plausibly fit more than one category, a hallmark of Connections’ design that becomes especially relevant once the two easier groups have already been solved, narrowing the remaining pool of words but often increasing the risk of confusing a blue-category term for a purple one, or vice versa. The game’s “one away” feature, which alerts players when three of their four selected words belong to the same group, can also serve as a useful tool for refining guesses without immediately triggering a mistake.
Saturday’s puzzle continued a run of thematically varied boards throughout the week, following Friday’s grid, which grouped words meaning a grand finale, items commonly seen in an arcade, sets containing four related items, and words ending in hidden car parts. Connections has built a devoted daily following since its 2023 debut by combining accessible mechanics with puzzles that consistently reward pattern recognition and careful reading over quick guessing, a formula that has helped the game rival Wordle in daily engagement even as it demands a different style of reasoning from players.
The complete answers for Saturday, July 18, puzzle number 1,133, are as follows: the yellow group, tied to ways of committing a basketball violation, includes CARRY, DOUBLE DRIBBLE, GOALTEND and TRAVEL; the green group, centered on words meaning belief, includes ATTITUDE, MIND, OPINION and VIEW; the blue group, built around elements tracked in video games, includes HEALTH, LIVES, SCORE and TIME; and the purple group, built around words that follow “pop,” includes CULTURE, FLY, QUIZ and TART.
Connections is available daily alongside the Times’ broader puzzle lineup, including Wordle, Strands, the traditional Crossword, Letter Boxed and Sudoku, with a new Connections board set to go live at midnight local time for players looking to keep their streaks intact heading into Sunday.
Business
Bitcoin rebounds to $64K after AI-led selloff triggers crypto rout. Here’s what experts say

Over the past 24 hours, Bitcoin gained 1.77%, while Ethereum rose 0.93% to trade at $1,843. Among major altcoins, BNB, XRP, Solana, Hyperliquid, Dogecoin, and Cardano advanced up to 4.81%.
Also Read | Samir Arora-backed Helios Mid Cap Fund adds Groww, 4 other stocks; hikes stake in Paytm and 29 more The global crypto market capitalisation went up 1.2% to $2.19 trillion, according to CoinMarketCap.
Piyush Walke, Derivatives Research Analyst, Delta Exchange, said a broad risk-off sentiment pushed Bitcoin below $63K as the AI-driven selloff spread from equities to cryptocurrencies. Bitcoin briefly dropped to $62.5K before recovering to around $64K. However, the rebound lacked strength, with the price failing to form higher highs and slipping back below the 50-day moving average, keeping the broader downtrend intact.
Meanwhile, Bitcoin spot ETFs are on track for modest outflows this week after ending an eight-week streak of heavy outflows last week, Walke further said.
In the past week, Bitcoin was down 0.25% whereas Ethereum was up 2.47%. Among the major altcoins, BNB, XRP, Solana, Tron, Hyperliquid and Cardano fell upto 10.59%.Nischal Shetty, Founder, WazirX said crypto markets experienced a volatile but constructive week, with macroeconomic developments continuing to drive sentiment. Early weakness, triggered by rising geopolitical tensions and higher oil prices, pushed.
“Bitcoin briefly below $62,500 as investors adopted a risk-off approach. However, softer-than-expected U.S. inflation data later in the week eased concerns around further interest rate hikes, helping both Bitcoin and Ethereum recover.”
Despite renewed optimism, markets remain cautious as investors await further clarity on U.S. regulation and upcoming macroeconomic signals, Shetty further said.
Also Read |Sebi introduces standing instructions for SWP, STP in mutual funds in demat holdings
Market perspective
Harish Vatnani, Head of Trade, ZebPay
Bitcoin broke resistance of $64,200 and hit $65,600. Fresh geopolitical tensions and US market sell off triggered profit booking. Ethereum hit a fresh high of $1,946 levels and seen some profit booking in line with the US market sell off. The daily RSI maintained above the 50 marks, reflecting bullish momentum.
(Disclaimer: Recommendations, suggestions, views and opinions given by the experts are their own. These do not represent the views of The Economic Times)
If you have any mutual fund queries, message on ET Mutual Funds on Facebook/Twitter. We will get it answered by our panel of experts. Do share your questions on ETMFqueries@timesinternet.in alongwith your age, risk profile, and Twitter handle.

Mutual funds bought five midcap stocks, including Lenskart, Meesho, JSW Infrastructure, NHPC and Ajanta Pharma, in June. These stocks witnessed net purchases worth over Rs 10,000 crore during the month.

IHS Markit (Nasdaq: INFO) is a world leader in critical information, analytics and solutions for the major industries and markets that drive economies worldwide. The company delivers next-generation information, analytics and solutions to customers in business, finance and government, improving their operational efficiency and providing deep insights that lead to well-informed, confident decisions. IHS Markit has more than 50,000 key business and government customers, including 80 percent of the Fortune Global 500 and the world’s leading financial institutions. Headquartered in London, IHS Markit is committed to sustainable, profitable growth.
Thirteen BSE SmallCap stocks rallied 10-15% after posting gains in each of the last five trading sessions, outperforming the broader market’s modest advance.
Business
China’s DeepSeek to raise fresh capital at $74 billion valuation ahead of onshore IPO, sources say
China’s DeepSeek to raise fresh capital at $74 billion valuation ahead of onshore IPO, sources say
Seven mutual funds, including SBI, HDFC, Kotak and Quant Mutual Fund, trimmed holdings in 21 small-cap stocks in June. Check the complete list of stocks where fund houses reduced exposure.
FIIs and retail investors increased stakes in 88 stocks during Q1FY27. ETMarkets highlights 12 stocks that rallied up to 135% in six months, including five multibaggers.

China smartphone makers turn to agentic AI as device sales slow

I F*cking Hate Them | Financial Audit
All Tesco shoppers to be asked important question at till from August 3

July 18, 2026 Solution and Hints for NYT Puzzle Number 1,855 Are Finally Revealed


-
 NewsBeat2 days ago
London Mayor Sadiq Khan handed a peerage by Keir Starmer alongside 15 other Labour figures… just days before the PM leaves No10
-

 Fashion16 hours ago
Weekend Open Thread – Corporette.com
-

 Crypto World2 days ago
CFTC blocks Kalshi from unwinding Michigan trades after court order
-

 Politics3 days ago
Young campaigners urge incoming PM to act on outdoor junk food ads
-

 Business2 days ago
Nvidia Stock Slips After Big Tuesday Rally as Huang Confirms Vera Rubin Chip Is Now in Production Today
-
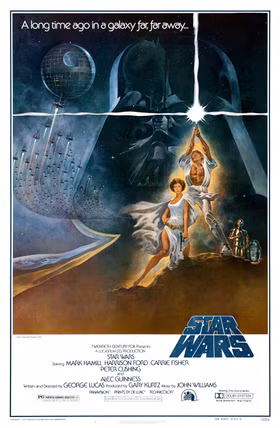 Entertainment3 days ago
Disney’s Most Ambitious Failed Star Wars Attraction Is Coming to SDCC
-

 Crypto World12 hours ago
Ripple wins EU-wide access as ESMA adds it to MiCA register
-

 Crypto World2 days ago
Injective Submits SEC Transfer-Agent Registration to Onchain Ownership Records
-

 News Videos4 days ago
XRP BOMBSHELL… XRP OMBOARDED FOR TRANSACTIONS!!!
-
 Tech4 days ago
Get Your ESP32 Sunny Side Up With This Solar Dev Board
-

 Business2 days ago
Palantir Shares Rise After Expanded Nvidia Partnership and Fresh Analyst Upgrades Ahead of Earnings Day
-

 NewsBeat21 hours ago
Registration is now open for March for Men with Kev 2026
-

 Tech4 days ago
Dark Secrets Emerge When Jailbreaking LLMs
-
 Sports3 days ago
New Cornerback Enters Vikings Trade Rumor Mill
-

 News Videos1 day ago
Money | Class 12 Economics | CBSE Board Exam 2026-27
-

 Business1 day ago
Banco Bilbao Vizcaya Argentaria, S.A. (BBVA) Discusses Global Macro Environment and Economic Outlook for Core Markets Transcript
-
 NewsBeat5 hours ago
Durham County Council to send out electoral registration emails
-
 Tech5 days ago
Cloudflare Precursor Watches Your Mouse and Keyboard To Decide If You Are Human
-
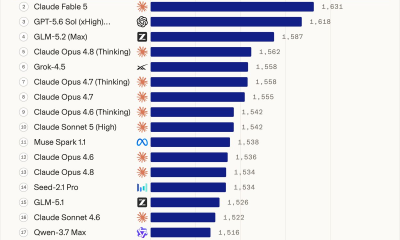
 Crypto World1 day ago
Claude Fable 5 Slips to Second in AI Coding Leaderboard
-
 Business14 hours ago
Airlines warn Sunshine Protection Act could disrupt flight scheduling
You must be logged in to post a comment Login