

Business
Samsung, LG shares rally ahead of Nvidia CEO meetings with Korean executives


The Nifty gained 1.65% last week. However, the long-short ratio of foreign portfolio investors’ positions in Nifty futures-a measure of bullish bets relative to bearish ones-stood at 12.95% on Friday. While the increase in the ratio from 8.1% two weeks earlier shows some reduction in short positions, the reading remains far too high to conclude that foreigners have turned bullish.
In the cash market, foreign investors were net buyers in four of the five trading sessions last week, purchasing shares worth a net ₹7,778 crore.
“The long-short ratio has improved marginally due to some short covering alongside fresh long additions by FIIs following the US-Iran peace deal. However, the benchmark Nifty index has not shown an over-optimistic reaction to the peace deal,” said Vipin Kumar, AVP- derivatives and technical research at Globe Capital Market.
Analysts say equities yet to become attractive relative to Asian peers; weak rupee, Iran deal uncertainty also weigh
Iran said it was once again closing the vital Strait of Hormuz on Saturday over Israeli attacks in Lebanon ahead of the weekend negotiations between Washington and Tehran to end the West Asia conflict, underscoring the fragility of the talks.

Analysts said Indian equities are yet to become compelling enough for overseas investors.
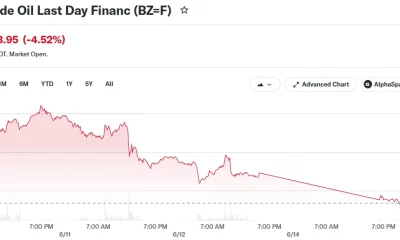
“While crude has been correcting, levels of $80 are still high. A dip to $70 or pre-war levels can be a tailwind driving covering from funds that are running short positions in India,” said Sriram Velayudhan, senior vice president, IIFL Capital Services.Velayudhan also said that other regions like South Korea and Taiwan have not yet seen a meaningful reversal or underperformance.
South Korea’s Kospi is up 110% in 2026 so far, while Taiwan’s Taiex Index has gained 58% this year, compared with the Nifty’s decline of 8.2%.
Kumar said the rupee’s underperformance against the dollar and the risk of higher inflation due to a below-average monsoon forecast remain key concerns.
Where will the markets go?
The Nifty ended the previous week at 24,013.10.
Kumar said the index continues to trade within a range, with positional resistance around the 24,600 level.
“A positive weekly breakout in the Nifty index above the 24600 spot level on a closing basis, alongside improvement in the concerned areas, might trigger significant short covering by FIIs,” he said.
Velayudhan said that while the Nifty has been trading in a broad range of 23,800-24,500 for some time, it could test the upper end of that band in the near term.

The proposed listings are likely by mid-2027, said the people cited above. The automotive platform is expected to be valued at about $2 billion.
The healthcare RCM asset, created through the merger of Knack RCM and EqualizeRCM after their acquisitions by the private equity major, should raise $400-500 million through a combination of primary and secondary share sales, bankers cited above told ET.
Investment bankers have begun pitching for mandates on both offerings. One of the most active private equity investors in India, Carlyle has deployed more than $8 billion in the country across investments including PNB Housing Finance, SBI Cards, VLCC, Hexaware Technologies and Nido Home Finance.
Plans $500-m IPO for Highway Roop at $2b valuation, to also raise $400–500 m at healthcare RCM asset
A Carlyle spokesperson declined to comment.
In February 2025, Carlyle Asia Partners acquired controlling stakes in Highway Industries and Roop Automotives, leading manufacturers of forged and precision-machined components, steering system assemblies, transmission parts and other powertrain applications used in electric, hybrid and internal combustion engine (ICE) vehicles. To lead the combined platform, Carlyle appointed Dharmesh Arora, former Asia-Pacific CEO of Schaeffler Group, as chief executive officer in June 2025.
The founders of Highway Industries and Roop Automotives, Umesh Munjal and Mohit Oswal, respectively, continue to hold a combined 25-30% stake in the merged entity. According to sources, Highway Roop is expected to generate revenue of about ₹3,000 crore and EBITDA of ₹700 crore in FY27.Precision Parts
In India, Highway Roop mainly competes with listed precision engineering and auto-component manufacturers such as Bharat Forge (Market cap of ₹97,652 cr), and Sona BLW Precision Forgings ( Market cap of ₹38,180 cr).
Separately, Carlyle Asia Partners acquired majority stakes in Knack RCM and EqualizeRCM in May 2026 to create a global, multi-specialty healthcare revenue cycle management platform. The combined business posted revenue of approximately $160 million and EBITDA of $65 million in FY26, sources said.


USDA reports three new cases of screwworm, bringing total to 15

US stock futures slide after Trump threatens more Iran strikes despite peace talks


Shipping slows after Iran says it has again shut the Strait of Hormuz
Intel: Levitating On AI Hype

Brazil seizes suspected massive cocaine haul hidden in timber cargo

It had planned to abandon the fuel, but the higher cost of natural gas may make it think again.

Romance and investment fraud is at record levels but what can you do to prevent being caught out.
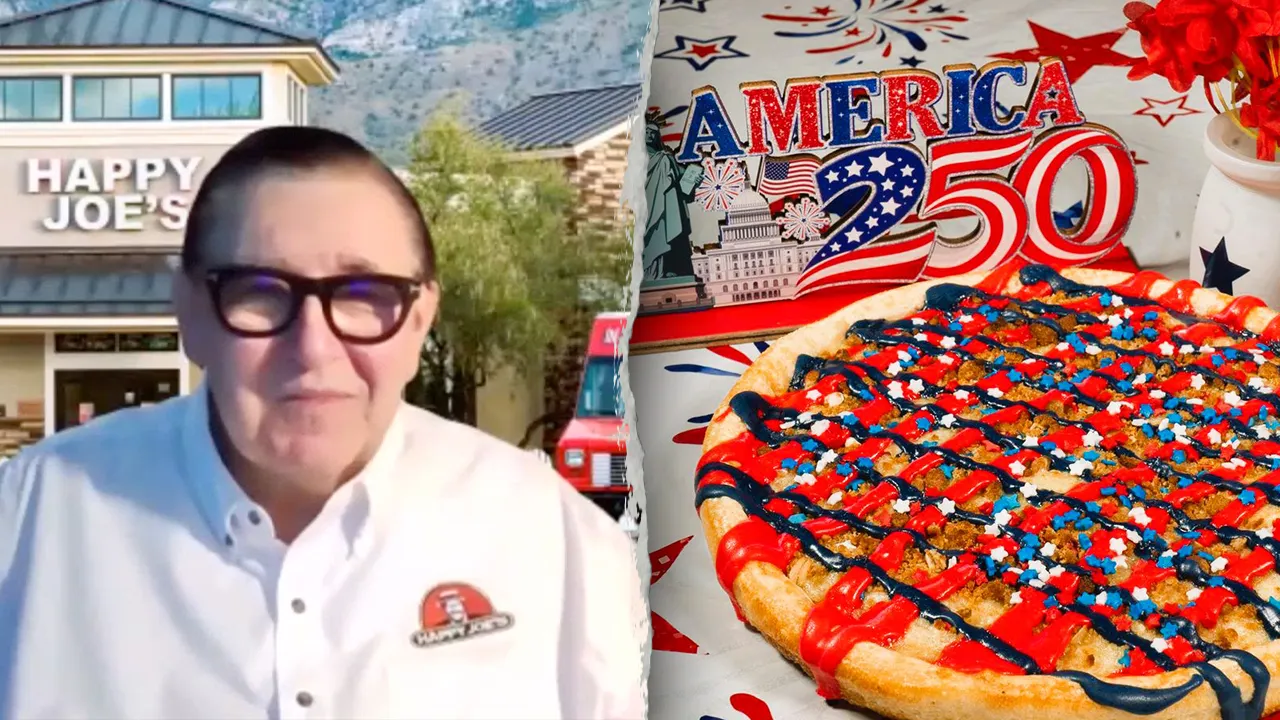
Happy Joe’s CEO Tom Sacco discusses the pizza chain’s America 250 celebration, featuring patriotic menu items, block parties and cash prizes for families.
Happy Joe’s Pizza & Ice Cream is turning America’s 250th birthday into a summer-long celebration.
The Davenport, Iowa-based restaurant chain — which has three company-owned restaurants, 35 domestic franchised locations and nine international locations in Egypt — is rolling out patriotic menu items, family block parties and sweepstakes tied to the nation’s semiquincentennial.
Tom Sacco, Happy Joe’s CEO, president and “chief happiness officer,” said the campaign fits the brand’s roots.
“Who’s better in this country to throw a birthday party for just regular old American folks than Happy Joe’s?” Sacco told FOX Business. “Because that’s who we are.”
From May 15 through Aug. 15, guests who buy a specialty pizza and a Mountain Dew at participating locations can enter the “Freedom Flyaway Sweepstakes” for a chance to win one of three $3,000 trips to Washington, D.C.
BELOVED IOWA PIZZA FRANCHISE SERVES UP ‘MORE THAN PIZZA’ FOR ITS CUSTOMERS

Tom Sacco, Happy Joe’s CEO, president and “chief happiness officer,” said the campaign fits the brand’s roots. (FOX Business / Happy Joe’s)
The sweepstakes was initially solely tied to a Washington, D.C., trip, but Sacco said winners can also take the cash and use it however it best helps their families.
“If celebrating to them is giving… them freedom financially to not be burdened by some of the expensive things that have happened in the last four or five years … If that’s what makes you happy, because mom doesn’t have to stress about how to pay for daycare during the summer or something like that, then that’s a huge win,” Sacco said.
The promotion also includes weekly Mountain Dew prize packs with pickleball paddles, lawn chairs, blankets, Happy Joe’s apparel and gift cards.
Happy Joe’s is also hosting AMERICA250 Block Party events on June 29 from 4 to 8 p.m. with games, trivia, music, giveaways and free slices of its red, white and blue birthday cake pizza.
YUM BRANDS SELLS PIZZA HUT FOR $2.7B, SHARPENS FOCUS ON TACO BELL AND KFC

Through Aug. 15, guests who buy a specialty pizza and a Mountain Dew at participating locations can enter the “Freedom Flyaway Sweepstakes” for a chance to win one of three $3,000 trips to Washington, D.C. (Happy Joe’s)
Sacco said some locations will have activities such as bounce houses, face painting, balloon makers and patriotic trivia tied to both U.S. history and Happy Joe’s history.
“We’re going to just do some fun stuff like that,” Sacco said. “… We can play the game and make it patriotic, but make it tied to Happy Joe’s kind of stuff.”
The limited-time menu includes a BBQ Brisket Pizza with Texas-smoked brisket, pickles, onions and barbecue sauce, a BBQ Chicken Pizza and an AMERICA250 Birthday Cake topped with red, white and blue frosting and sprinkles.
Sacco said Happy Joe’s is leaning into what it has long been known for: birthdays, families and memorable dining experiences.
MCDONALD’S BRINGING BACK FRIED APPLE PIE TO CELEBRATE AMERICA’S 250TH BIRTHDAY

The brand is also hosting AMERICA250 Block Party events on June 29 from 4 to 8 p.m. with games, trivia, music, giveaways and free slices of its red, white and blue birthday cake pizza. (Happy Joe’s)
CLICK HERE TO GET FOX BUSINESS ON THE GO
“We don’t compete on price. We don’t compete on discounting. We compete on experience,” Sacco said. “Pizza gets you in the door. When you leave, we’ve created a memory. And that’s how we go about the business.”
He added that the campaign gives the brand a chance to celebrate the country’s milestone birthday with families across its markets.
“The 250, for me, is like the biggest national celebration I can ever be a part in,” Sacco said. “I have the opportunity, because of Happy Joe’s, to share it with hundreds of thousands of our guests and their families around the country.”

3 Financial Leaks That Are Eating Your Savings
Darwin Nunez nightmare after Liverpool exit continues as Uruguay avoid World Cup humiliation
FPIs temper selling but derivatives bets still signal caution


-

 Fashion2 days ago
Weekend Open Thread: Miami – Corporette.com
-
 Crypto World7 days ago
Crude Oil Plunges Over 4% as US-Iran Agreement Reopens Hormuz Strait
-
 Business2 days ago
Wall Street Week Ahead: Investors see Micron earnings as pulse check of AI rally momentum
-

 Tech5 days ago
The Adder At The Heart Of Intel’s 8087 FPU
-

 Crypto World2 days ago
HIVE shares jump as $220M AI deal speeds Bitcoin mining pivot
-

 Sports3 days ago
FIFA World Cup 2026: Canada beat 9-men Qatar 6-0 to register first ever win | FIFA World Cup 2026
-
 Business3 days ago
Brexit cost 6% of UK economy, Bank of England company data suggests
-

 Crypto World2 days ago
Jake Chervinsky accuses CME of protecting derivatives monopoly
-

 Business1 day ago
Soccer-U.S. defends Iran World Cup travel restrictions, says discussions ongoing
-

 Crypto World4 days ago
Anthropic’s Dario Amodei Urged AI Unity at G7, Even as US Banned His Models
-

 Business1 day ago
MHP SE 2026 Q1 – Results – Earnings Call Presentation (OTCMKTS:MHPSY) 2026-06-20
-

 Tech4 days ago
Weeks Of In-The-Field Testing And A Verdict
-

 Tech3 days ago
Adobe adds its AI assistant to Premiere, Illustrator and InDesign
-

 Entertainment1 day ago
Renter of Home in Anne Heche Crash Denies Settlement With Son
-

 Politics2 days ago
Andy Burnham and the meaning of Makerfield
-
 Crypto World3 days ago
Iren (IREN) Stock Surges on Jefferies Buy Rating: AI Infrastructure Play Gains Momentum
-

 Politics3 days ago
BBC Reporter Discusses Cross Party Criticism Of Trumps Iran Deal
-
 Crypto World2 days ago
Can Charles Hoskinson Really Rescue Cardano?
-

 News Videos3 days ago
IMPACT ON BITCOIN IF NO GOLD IS FOUND IN FORT KNOX
-

 Tech3 days ago
Instagram Now Lets You Add A Unique Caption To Each Carousel Slide
You must be logged in to post a comment Login