

Business
Shifting from Accelerated Growth to Sustainable Development

Southeast Asia’s fintech has evolved, enabling instant, low-cost cross-border transactions. Funding is shifting towards late-stage companies. Payment and lending innovations address inclusion, while regulatory frameworks support growth and cross-border cooperation.
🌏 Evolution of Fintech in Southeast Asia
- Cross-border transactions now settle in seconds at minimal cost, reflecting massive digital economy growth (US$120B funding, 11.2x revenue expansion 2016–2025).
- Shift from “growth-at-all-costs” to governance, cost discipline, and sustainable models.
💰 Funding Trends
- Global fintech funding rebounded in 2025; ASEAN-6 saw US$835M funding, with fewer deals but larger average sizes.
- Late-stage companies dominate (67% of ASEAN funding), while seed-stage activity hit decade lows.
📊 Key Verticals
- Payments: Largest funding share, driven by QR frameworks and financial inclusion; projected US$2.4–2.6T by 2030.
- Alternative Lending: Addresses SME financing gaps; lending book projected to reach US$230B by 2030.
- Investment Tech: Rapid adoption, AUM projected US$410–457B by 2030.
- Embedded Finance: Integrated into apps (BNPL, wallets), projected 40% of digital finance market by 2030.
Cross-border financial transactions in Southeast Asia have transformed over the past decade. A remittance that once consumed days and cost approximately 6% in fees can now settle in under 60 seconds via a mobile number, reflecting the scale of change across the ASEAN digital economy, which absorbed US$120 billion in private funding and expanded aggregate revenue 11.2 times between 2016 and 2025.
The ecosystem’s underlying mechanics have shifted materially. Institutional allocators have shifted focus to companies demonstrating strong governance and cost discipline instead of growth-at-all-costs mandates.
Three interconnected mechanisms explain this maturation: a venture capital trajectory consolidating around proven late-stage models; foundational service verticals closing structural inclusion gaps; and a supranational policy architecture converting fragmented jurisdictions into a unified digital economy.
The Funding Arc: From Boom to Selective Investment
Global fintech funding recovered 13% YoY to US$27.8 billion in the first nine months of 2025, driven primarily by North America and Europe. Across the ASEAN-6 economies, total regional fintech funding reached US$835 million in 9M2025, as the sector entered a phase of measured consolidation following several years of elevated capital deployment.
The regional digital economy continues to expand on durable structural foundations. Mobile-first adoption, a young and growing consumer base, and accelerating integration of artificial intelligence across financial services collectively underpin the long-term investability of the region’s fintech sector. Monetary conditions have also shifted in favor of deployment: central banks across Indonesia, the Philippines, and Thailand implemented rate cuts in 2025, reducing the cost of capital and improving the conditions for both new investment and exit activity across the private landscape.
Capital allocation patterns in 9M2025 reflect a maturing rather than retreating market. While total deal count across ASEAN-6 moderated to 53 transactions, average deal size surged 42% to US$21.4 million, signaling a decisive shift in investor priorities. Late-stage fintechs captured 67% of total ASEAN funding in 9M2025, up 26% YoY, with average per-transaction size rising 40% YoY to US$112 million.
Tracxn’s SEA-wide data confirms the pattern: seed and early-stage funding contracted sharply while late-stage capital rose 13% YoY from 2024. Capital is concentrating in operators with validated models and clear paths to profitability.
Source: FinTech in ASEAN 2025: Navigating the New Realities
The reduction in early-stage activity signals a deeper structural change. Pre-seed and seed deal share fell to its lowest level in a decade, and first-time venture capital fund formation dropped from 42 in 2022 to 4 in 2025. Mature managers have offset this gap: of the 23 private capital funds raised in 2025, 18 were successor vehicles, with the median step-up ratio rising to 2.0x from 1.3x in 2024, showing that established managers are raising materially larger pools.
Key sectors driving financial inclusion include payments, lending, and embedded finance
In recent years, capital allocation consolidated around foundational infrastructure, with investor conviction concentrated in verticals demonstrating scalable, revenue-generating models. Payments re-emerged as the dominant category in 9M2025, attracting the largest share of regional funding and tying with Investment Tech for the highest deal count. Alternative Lending maintained strong transactional momentum with the third-highest deal count across the bloc, serving as the primary vehicle for fintech capital deployment in the Philippines and Vietnam, markets where digital credit continues to address significant structural gaps in formal financial access.
Payments: The Primary Gateway to Financial Inclusion
Payments infrastructure is the critical acquisition funnel for the broader digital economy. Investors continue to back platforms focused on cross-border transactions, real-time settlement, and interoperable QR frameworks, rewarding operators that address the region’s vast unbanked population.
This structural dominance is anchored by the region’s vast unbanked population. In most ASEAN jurisdictions, less than 50% of the population owns an account at a formal financial institution, indicating the significant potential for digital financial services (DFS) growth.
Grassroots adoption of digital payments has also been aggressively driven by the proliferation of standardized QR code frameworks. Indonesia’s QRIS framework incentivises micro-merchant adoption by eliminating processing fees below INR 500,000 (approximately US$30). Similar rollouts across Malaysia, Thailand, the Philippines, and Vietnam have driven a permanent shift away from physical cash. Digital payments gross transaction value across ASEAN-10 reached US$1.41 trillion in 2025 and is projected to reach US$2.4 to US$2.6 trillion by 2030, with digital payments expected to capture 78% of total gross transaction value across Southeast Asia by decade-end.
Alternative Lending: Bridging the SME Funding Divide
Digital payment data provides the transaction history needed to underwrite credit for small and medium enterprises (SMEs) too large for microfinance but too small or informal for commercial bank balance sheets. Across Southeast Asia, up to 60% of micro, small, and medium enterprises (MSMEs) report difficulty obtaining financing.
Fintech lenders bypass such traditional barriers to lending by using real-time data from e-commerce and digital payments to assess creditworthiness and disburse funds without conventional paperwork. Regional operator Funding Societies has disbursed over US$4.38 billion to more than 100,000 SMEs, fulfilling 95% of requests in under five days.
Simultaneously, private credit partnerships are reshaping the sector’s funding architecture. Following the global financial crisis, regulatory requirements pushed traditional banks to lower risk appetite and increase reserves, opening a structural gap that private credit funds now fill by purchasing or funding fintech-originated loans. The global whitespace for private credit deployment into fintech lending is estimated at US$280 billion.
Lending also functions as a high-margin vertical that drives customer stickiness, making it attractive to platforms pivoting from growth to sustainable profitability. The regional digital lending book reached US$91 billion in 2025 and is projected to reach approximately US$230 billion by 2030.
Investment Tech
Investment Tech matched Payments for transaction volume, capturing 21% of all regional fintech deals and expanding its funding share to 11% of the ASEAN total in 9M2025, up from 4% in 2024. Growth was anchored by late-stage capital, most notably Syfe’s US$53 million Series C, the fifth-largest fintech deal in ASEAN-6 for the period.
Consumer adoption is accelerating alongside institutional interest: cumulative app downloads rose 166% from 8.4 million in 2021 to 22.4 million in 2025, and sector revenue grew 25% over the same period as platforms upsell users from basic cash products to higher-margin investment portfolios. The Asia-Pacific region’s expanding middle class is also driving demand for digital-native solutions at a much faster rate than mature markets like the US and EMEA.
Digital wealth assets under management (AUM) across SEA-6 reached US$90 billion in 2025 and is projected to reach US$410 to US$457 billion by 2030. Multiple digital wealth platforms in the region have individually surpassed US$1 billion in AUM, validating the model.
Embedded Finance: Unseen Framework, Tangible Access
Embedded finance integrates financial products directly into non-financial apps and platforms, removing the acquisition costs and infrastructure requirements of standalone financial services. Embedded finance products include buy-now-pay-later (BNPL) facilities, co-branded credit cards, and ewallet payments across food delivery, ecommerce, and travel. The segment is projected to account for 40% of the total digital finance market by 2030, a US$72 billion opportunity growing at 57.7% CAGR from 25% of US$9.5 billion in 2024.
Unbanked and underbanked demographics function as the primary target market for these solutions, allowing platforms to monetize lower-income cohorts by drastically reducing the cost-to-serve through digital rails. Super app ecosystems are the primary distribution channel. Grab Financial reported 50 million monthly transacting users in 2025. E-commerce platforms like Lazada seamlessly embed digital wallets to offer installment products and loyalty redemptions directly within their native interfaces.
Investors are drawn to embedded finance because it creates compounding benefits across the value chain. For financial institutions, embedded distribution lowers customer acquisition costs materially. For commercial users, accepting e-wallets and embedded financing tools raises conversion rates and extends reach to broader consumer bases.
Notes: 1) Gross transaction value (GTV) for digital payments includes the value of credit, debit, prepaid card, account-to-account (A2A), and ewallet transactions. 2) Loan book balance for digital lending includes end-of-year balance for consumer loans (excluding credit card and mortgage) and small/medium enterprise (SME) loans. The previously reported number in 2023 has been revised. 3) Assets under management (AUM) for digital wealth includes end-of-year mutual fund AUM balance. The previously reported number for 2023 has been revised. 4) Annual premium equivalent (APE) and gross written premium (GWP) for digital insurance includes APE for life insurance and health under life insurance policies and GWP for non-life insurance. The previously reported number for 2023 has been revised.
Source: e-Conomy SEA 2025 Report
POLICY AS ARCHITECTURE: HOW ASEAN IS BUILDING REGIONAL INTEROPERABILITY
The Regional Payment Connectivity Initiative
The Regional Payment Connectivity (RPC) initiative links domestic instant payment systems across Southeast Asia to eliminate bilateral friction and compress settlement times. The framework integrates Indonesia’s QRIS, Thailand’s PromptPay, Singapore’s PayNow, Malaysia’s DuitNow, the Philippines’ QR Ph, and Vietnam’s VietQR, enabling retail users to scan foreign QR codes and settle transactions directly from domestic wallets. The mechanism also targets to promote the use of local currencies of regional trade through the Local Currency Transaction framework.
From Bilateral to Multilateral: Project Nexus
Bilateral linkages face acute scalability constraints as the number of required connections grows with each new participant. The Bank for International Settlements (BIS) designed Project Nexus as a multilateral hub-and-spoke gateway to address this constraint, targeting a reduction in average global remittance costs from approximately 6% to below 3% and settling 75% of cross-border transactions within one hour. Nexus Global Payments was established in Singapore in April 2025. Bank Indonesia concurrently upgraded to full Nexus membership, committing to integrate its BI-FAST instant payment system into the platform.
Central Bank Digital Currency Rollouts
ASEAN policymakers favour wholesale digital currency applications over retail deployments, mitigating commercial bank disintermediation risk while targeting cross-border settlement inefficiencies. By 2021, 60% of central banks globally had conducted experimental research on digital currency technology, with 14% at pilot stage.
The Monetary Authority of Singapore (MAS) advanced wholesale connectivity through the Ubin+ initiative, demonstrating atomic settlement of simulated multi-currency payments in under thirty seconds through its Cedar x Ubin+ experiment with the New York Federal Reserve. Thailand is also participating in the mBridge platform to execute real-value corporate transactions using wholesale digital currencies.
Open Finance and Open API Standards
Open Banking allows customers to share payment account data with trusted third-party providers and authorise those providers to initiate payments or transfers. Open Finance extends this framework to loans, savings, investments, mortgages, pensions, and insurance.
Source: The APAC State of Open Banking and Open Finance Report – ADB Institute
Regulatory approaches across ASEAN diverge between mandated and market-driven models. Singapore leads through its Finance-as-a-Service API Playbook and the government-backed SGFinDex data exchange platform. Indonesia’s Standard National Open API for payments has achieved adoption across 16 banks. The Philippines enacted the Bangko Sentral ng Pilipinas Open Finance Framework, while Malaysia introduced open finance policies through Bank Negara. However, cross-border data flow frameworks remain heavily fragmented, complicating seamless cross-border interoperability.
The AEC Strategic Plan 2026–2030
The ASEAN Economic Community Strategic Plan 2026–2030 is a binding five-year framework aligning financial technology expansion with macroeconomic integration. Objective 1.4 mandates deeper financial integration and inclusion, elevating payment connectivity to a sovereign strategic priority. Strategic Goal 3 designates digital and technology transformation as a standalone objective, covering cross-border data flows and interoperable digital identities. The plan’s execution depends on the companion Digital Economy Framework Agreement converting its targets into enforceable cross-border commercial obligations.
ASEAN Digital Economy Framework Agreement
The ASEAN Digital Economy Framework Agreement (DEFA) is the foundational regulatory architecture for the region’s fintech sector. By harmonising digital trade rules, DEFA enables trusted cross-border data flows, secure digital identities, and standardised digital payments, directly lowering transaction costs for operators and streamlining regulations for SMEs. DEFA is projected to double ASEAN’s digital economy to US$2 trillion by 2030.
THE STRUCTURAL CASE
Southeast Asia’s fintech ecosystem has passed the inflection point from growth velocity to durable scale. Capital allocation now demands unit economics over subsidised expansion, targeting inclusion-focused verticals that embed lending and wealth services into the daily transactions of previously underserved populations.
A tightening policy architecture requires platforms to treat compliance and risk management as core competencies. The cross-border infrastructure spanning the RPC initiative, Project Nexus, Local Currency Transaction frameworks, wholesale CBDC deployments, and open finance protocols constitutes the region’s most durable structural advantage, systematically reducing bilateral friction and lowering the cost of cross-border capital deployment. The binding catalyst is DEFA, slated for conclusion in 2026, which holds the potential to double the digital economy to US$2 trillion by 2030.
The era of evaluating ASEAN fintech through top-line growth rates alone has closed. The next decade belongs to governance, operational resilience, and regional architecture.
Source : Fintech and Embedded Finance: From Hyper-Growth to Sustainable Scale
Other People are Reading


Brokerages believe the demerger could unlock significant value for shareholders by allowing investors to directly choose their preferred commodity exposure.
“Apart from simplifying the corporate structure, this will allow investors to invest in their preferred commodities. Furthermore, the company is on the verge of reaping the twin benefits of volume augmentation and cost optimisation across verticals. This will likely be supported by continuous deleveraging and consistent growth capex. This, along with rising commodity prices, could potentially drive upside revisions in our estimates,” ICICI Securities said in a note.
While existing Vedanta shareholders have received shares in all four demerged entities, analysts have begun identifying their preferred bets for investors who missed the demerger opportunity.
Also read: Uday Kotak questions SpaceX valuation, says only time will tell if we’re in ‘mega bubble’
Which post-listing Vedanta demerger stock should you buy?
Sunny Agrawal, Head of Fundamental Research at SBI Securities, believes investors can consider buying Vedanta Aluminium Metal, citing robust aluminium capacity expansion and strong LME aluminium prices.

According to Agrawal, Vedanta Aluminium Metal commands a fair value of Rs 489 per share, making it the most attractive among the demerged entities. He values Vedanta Power at Rs 44 per share, Vedanta Oil & Gas at Rs 42 per share and Vedanta Iron & Steel at Rs 19 per share.
ICICI Securities echoed a similar view, calling aluminium the group’s ‘crown jewel’. The brokerage is most bullish on the aluminium segment, as the ongoing war could lead to a higher-than-expected aluminium supply deficit. This, coupled with better coal integration, presents upside potential to estimates. “Furthermore, we expect debt to maintain a downward trajectory, despite projected annual group-level capex of $1.8-2.0 billion,” the brokerage said.Domestic brokerage ICICI Direct also singled out Vedanta Aluminium as the standout business among the demerged entities. It expects the company to list at a valuation of more than Rs 400 per share, supported by its significant contribution to group revenues and margins, favourable industry dynamics, elevated aluminium prices, tight global supply and ongoing capacity expansion-led volume growth.
Nuvama, meanwhile, expects Vedanta and Vedanta Aluminium to remain large-cap stocks, while Vedanta Power, Vedanta Oil & Gas and Vedanta Iron & Steel are likely to enter the market as small-cap companies. The brokerage highlighted that mutual fund flows are likely to be skewed towards the two large-cap entities, while the smaller demerged businesses may see relatively limited participation.
Also read: Ashish Kacholia’s picks: 12 stocks rally up to 130% in CY26, 3 turned multibaggers; 2 new Q4 bets
What do Vedanta demerged companies do?
Vedanta Aluminium Metal – It is India’s largest aluminium producer, according to the company. In FY25, it produced 2.42 million tonnes of aluminium, accounting for more than half of India’s total aluminium output.
The company operates a 5 MTPA alumina refinery in Odisha’s Kalahandi district and the world’s largest aluminium plant at Jharsuguda, Odisha, with a capacity of 1.85 MTPA. It also operates Bharat Aluminium Company Limited (BALCO) in Chhattisgarh.
Vedanta Power – It has more than 4 GW of installed capacity across four strategic assets located in Punjab, Andhra Pradesh, Chhattisgarh and Odisha. It also has several long-term and medium-term Power Purchase Agreements (PPAs) with state utilities.
Vedanta Power is expected to command a market capitalisation of Rs 17,466 crore at the time of its market debut, according to Nuvama. Domestic brokerage Emkay estimates a value of around Rs 51.7 per share, while Kotak Institutional Equities pegs it at Rs 60 per share. Nuvama’s valuation implies a value of around Rs 47 per share, while CLSA’s estimate corresponds to roughly Rs 35 per share.
Vedanta Oil & Gas – The company claims it is India’s leading private-sector upstream player and aims to scale production to 300,000-500,000 barrels per day through an investment of $5 billion.
Vedanta Iron & Steel – The company has operations spanning India and Africa and is focused on iron ore exploration, mining and processing. The company also produces high-quality steel, wire rods, TMT bars, pig iron, ductile iron (DI) pipes, ferro-silicon, cement and metallurgical coke.
Analysts believe the iron and steel business may attract relatively less investor interest, as larger and more focused players in the sector present a stronger investment case.
The shares of these Vedanta demerged entities will participate in a special pre-open session meant for newly listed companies before regular trading commences. These shares will be in the Trade-to-Trade segment for 10 trading days.
(Disclaimer: Recommendations, suggestions, views and opinions given by the experts are their own. These do not represent the views of The Economic Times)
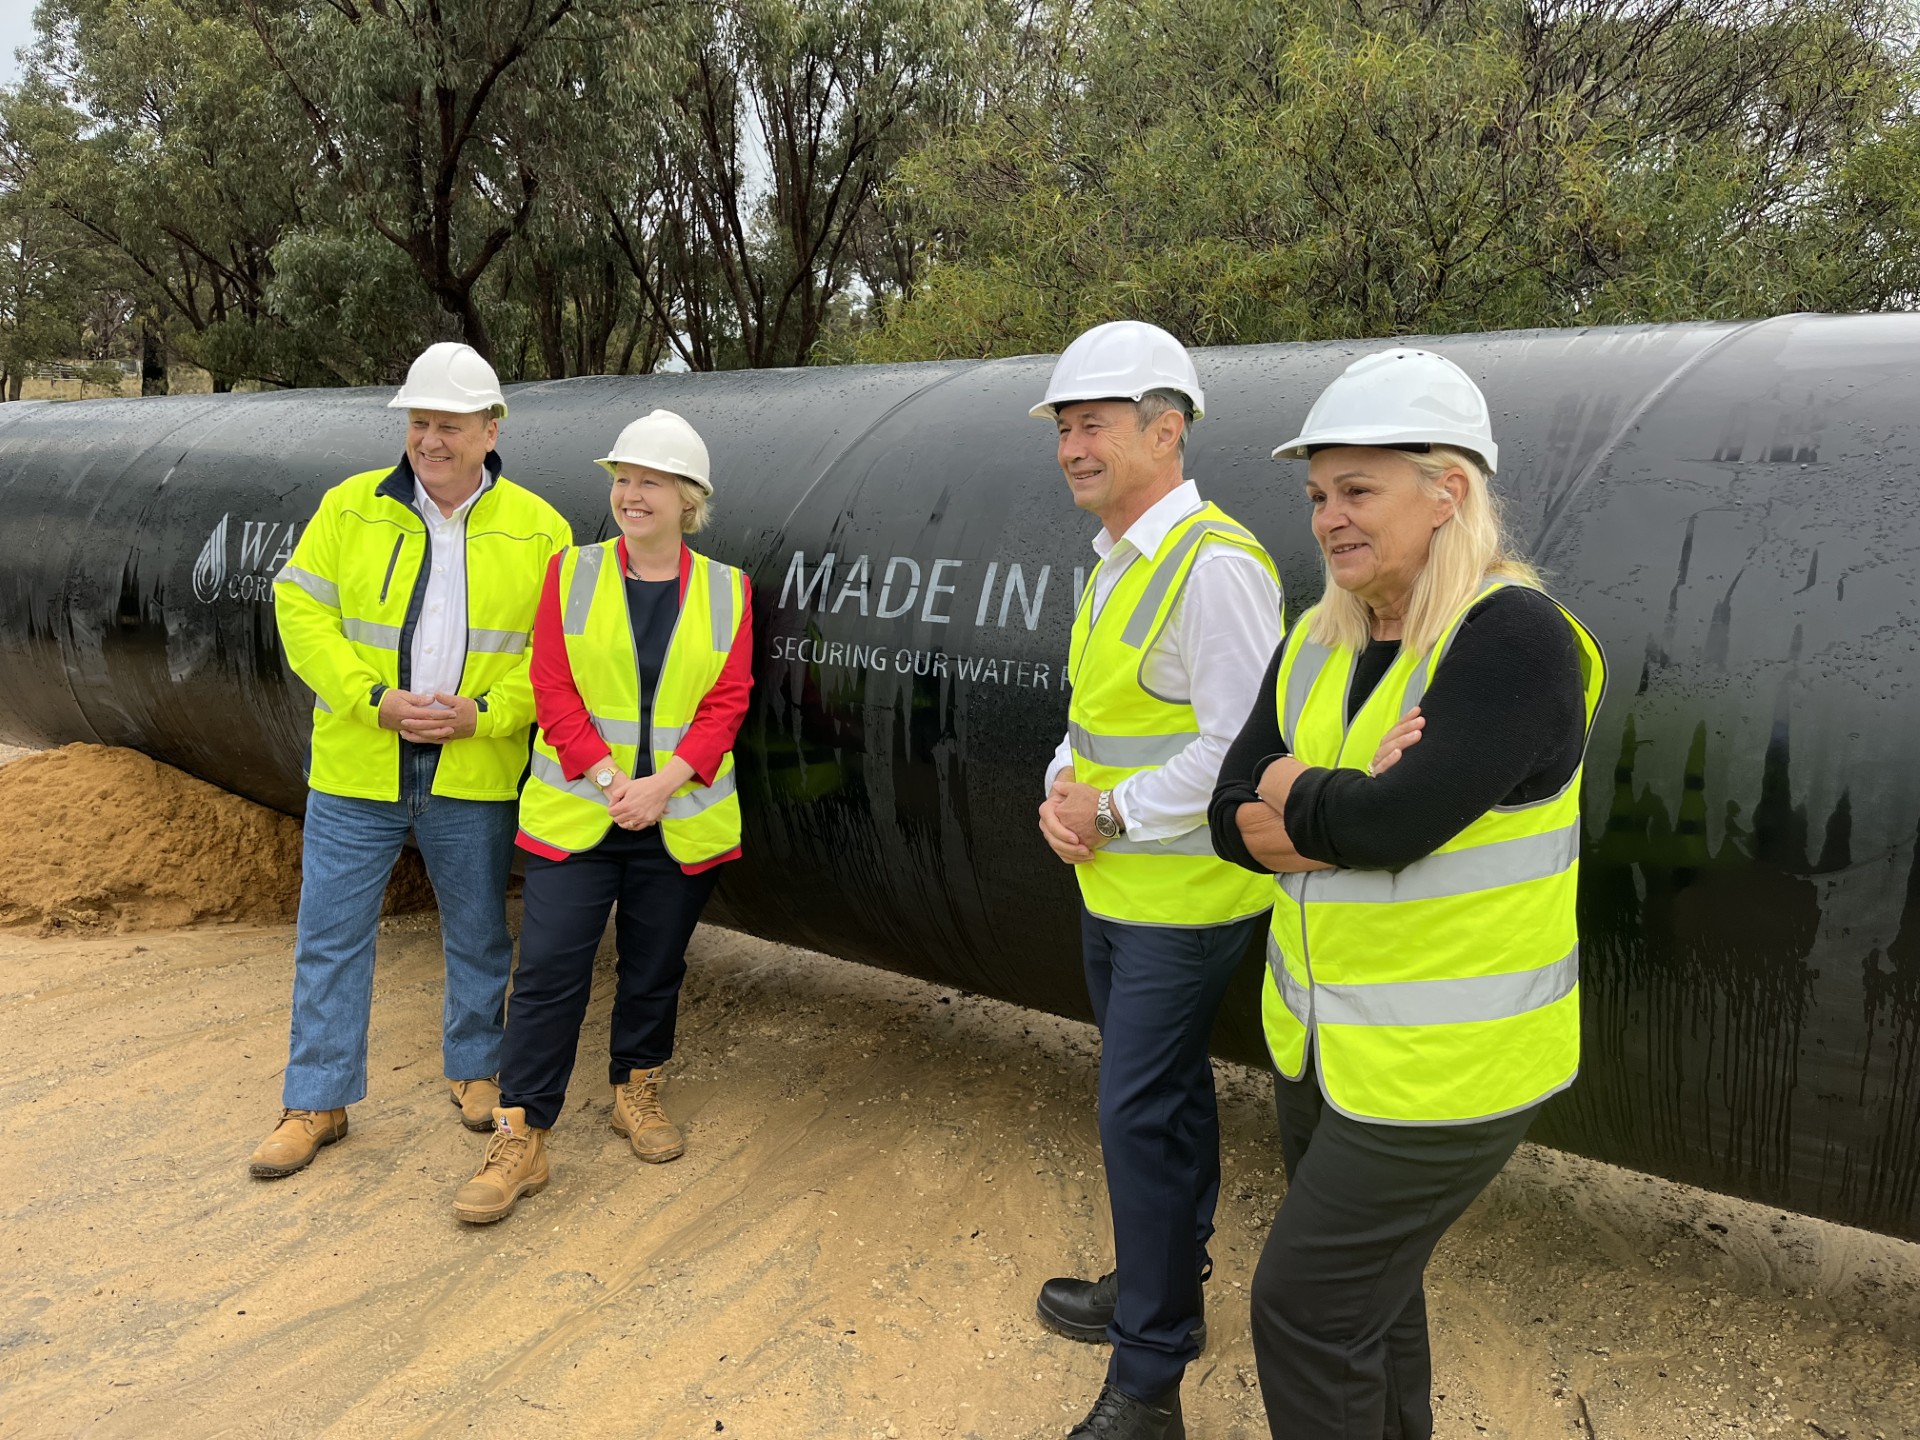
The pipeline for the planned $2.8 billion desalination plant at Alkimos has reached a milestone in its construction from the Water Corporation’s Wanneroo reservoir to the coast.
Business
Texas Tops Fortune 500 List in 2026 with 57 Companies, Dethroning California as Corporate Capital

Texas has claimed the title of the state with the most Fortune 500 companies in 2026, edging out California with 57 headquarters compared to the Golden State’s 56, according to the latest ranking of America’s largest corporations by revenue.
The Lone Star State’s surge reflects years of corporate relocations, business-friendly policies and economic diversification that have attracted major firms seeking lower taxes, lighter regulation and access to growing markets. Combined, Texas companies generated roughly $2.8 trillion in revenue, slightly ahead of California’s $2.7 trillion from its 56 entries, while New York placed third with 53 companies and $2.2 trillion.
This marks the first time in several years that Texas has reclaimed the top spot, highlighting a notable shift in U.S. corporate geography as businesses continue migrating from high-cost coastal states. Houston alone hosts 25 Fortune 500 companies, including energy giants like Chevron, Sysco and Phillips 66, while Dallas and Austin contribute additional headquarters.
Drivers Behind Texas’ Rise
Texas’ appeal stems from multiple factors, including no state income tax, a large and growing workforce, robust infrastructure and energy resources. The state has actively courted relocations through economic development incentives, successfully drawing companies from California and other high-tax jurisdictions.
Major moves in recent years, including expansions by firms in technology, energy and finance, have bolstered its count. Austin’s emergence as a tech hub has added notable names, while traditional strengths in oil, gas and logistics continue to anchor its economy. The addition of three new companies this year pushed Texas to its highest total since 2010.
California, long the leader, saw its dominance challenged by high living costs, regulatory burdens and out-migration of businesses. Despite strengths in technology and entertainment, the state lost ground as several firms relocated or expanded elsewhere. New York maintains a strong presence in finance and media but trails the top two.
Key Sectors and Economic Impact
Texas companies span diverse industries, with heavy representation in energy, retail, logistics and technology. The state’s Fortune 500 roster contributes significantly to employment and tax revenue, supporting local economies across major metros.
The shift underscores broader trends in corporate America, where quality-of-life considerations, tax structures and operational costs increasingly influence headquarters decisions. States like Florida and Tennessee have also gained ground in recent years, though Texas leads the pack.
Analysts note that Texas’ energy sector provides stability amid global transitions, while its growing tech and manufacturing base diversifies risk. The state’s pro-business environment has fostered innovation and job creation, attracting talent from across the country.
Broader Fortune 500 Trends
The 2026 Fortune 500 list reflects a resilient U.S. economy, with aggregate revenue reaching record levels despite inflationary pressures and geopolitical uncertainties. Technology and healthcare giants continue to dominate the upper ranks, but traditional industries like manufacturing and energy maintain strong representation.
Women now lead a record 55 companies on the list, the highest share in its history. The ranking also highlights consolidation in certain sectors and the rise of firms benefiting from artificial intelligence and renewable energy transitions.
Regional distribution shows concentration in a handful of states, with the top three — Texas, California and New York — accounting for a significant portion of total revenue and influence. Illinois, Ohio and others follow with more modest but meaningful presences.
Implications for Business and Policy
Texas’ leadership may encourage other states to review their economic policies, particularly regarding taxation and regulation. For California, the change serves as a reminder of competitive pressures, prompting discussions on retaining businesses through incentives and infrastructure improvements.
Economists view such shifts as natural market responses to differing state environments. While headquarters moves generate headlines, actual operations often remain distributed, with employment impacts varying by case.
For investors, the Fortune 500 distribution offers insights into regional economic strengths and sector exposures. Texas-heavy portfolios may benefit from energy and logistics tailwinds, while California exposure provides technology growth potential.
Looking Ahead
As companies adapt to remote work trends, supply chain shifts and sustainability demands, headquarters locations will continue evolving. Texas is expected to maintain momentum, but sustained leadership will require ongoing investments in education, infrastructure and talent development.
The 2026 list underscores the dynamic nature of American business geography. Texas’ achievement highlights successful long-term economic strategies, while California’s strong showing despite challenges demonstrates enduring appeal in innovation hubs.
This annual ranking remains a key barometer of corporate America, revealing not just size but also the shifting centers of economic power across the nation. As Texas celebrates its position atop the Fortune 500, the competition among states for business headquarters is likely to intensify in the years ahead.
Getty Images

Listen below or on the go via Apple Podcasts and Spotify

Deal expected to be signed Friday. (0:16) Stocks rise as oil tumbles. (1:07) U.K. announces social media ban. (2:01)
The following is an abridged transcript:
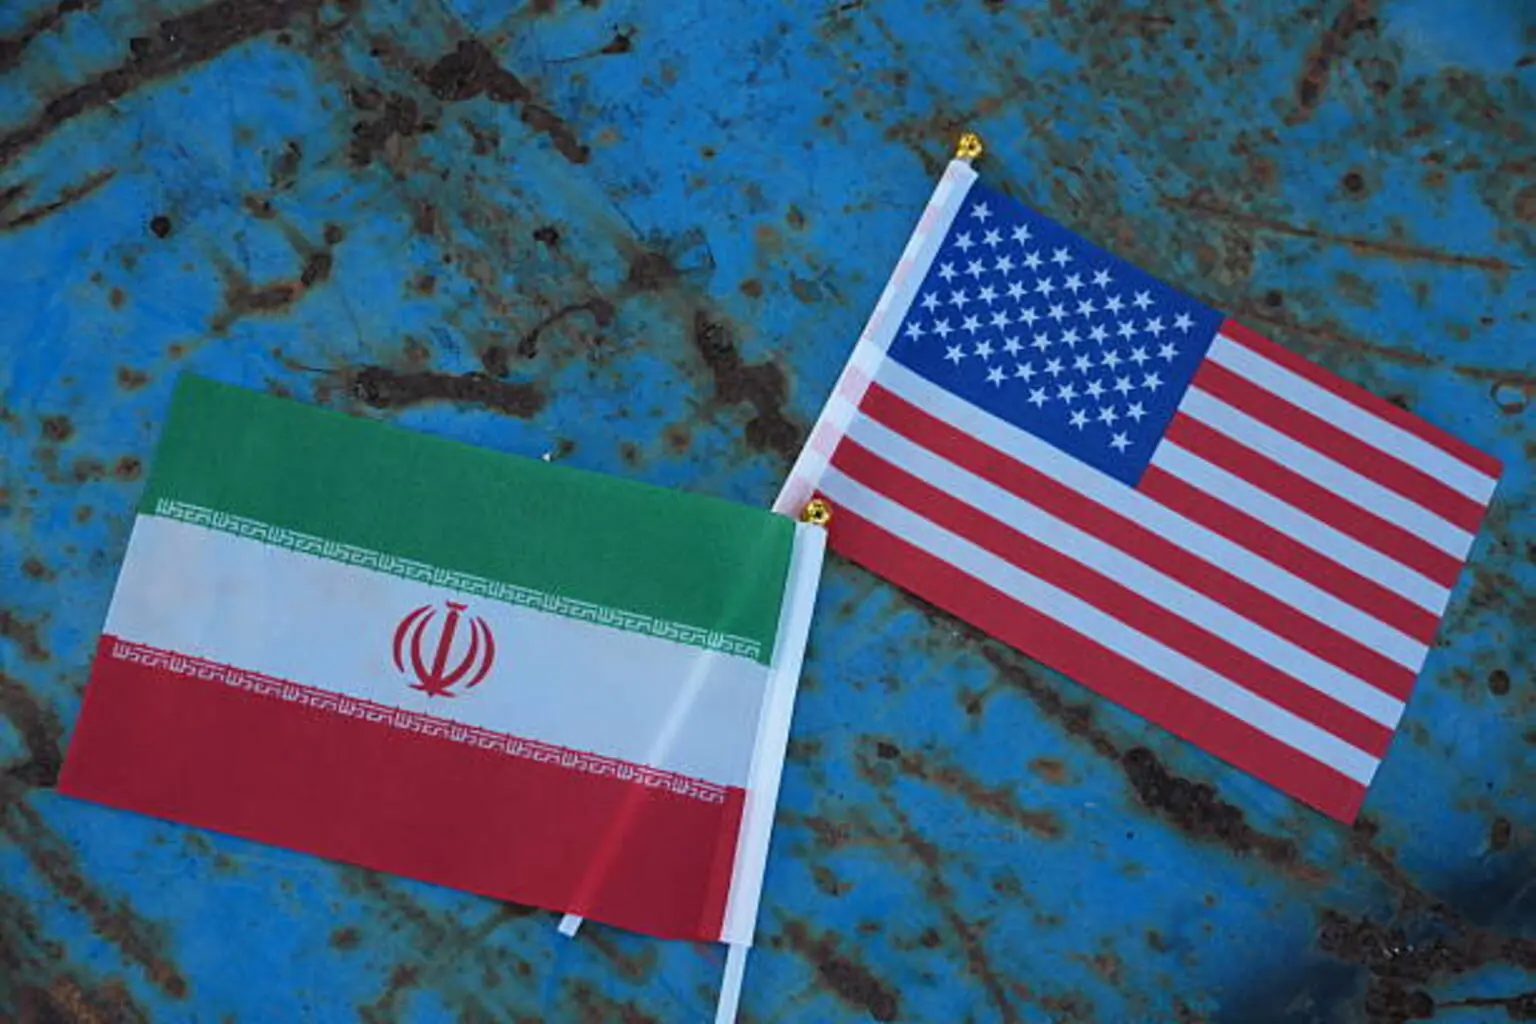
The U.S. and Iran have agreed to a peace deal to end the war, a move that will halt the U.S. blockade and reopen the Strait of Hormuz. But the official text of the memorandum of understanding remains unpublished.
Key details—including long-term access to the Strait of Hormuz, restrictions on Iran’s nuclear program and the situation in Lebanon—have yet to be disclosed.
President Trump told The New York Times he would resume military action if Tehran failed to reach a broader nuclear agreement with the U.S. Negotiations and a formal signing are scheduled for Friday in Switzerland.
According to Iranian state-affiliated Mehr News, the 14-point draft includes an end to the war, including in Lebanon, the withdrawal of U.S. forces around Iran, sanctions relief and reconstruction plans.
But Israeli Prime Minister Benjamin Netanyahu has already rejected a Lebanon-related provision, saying Israel is not bound by that clause.
In reaction, stock-index futures are rallying while oil prices tumble and Treasury yields move lower.
Brent crude (BNO) is down about 5%, while WTI (USO) is also off more than 5%.
Nasdaq 100 futures (US100:IND) lead the advance, up about 2%, while S&P 500 futures (SPX) are up more than 1%.
Anthropic (ANTHRO) is scrambling to restore access to its most advanced AI models, dispatching senior technical staff to Washington for meetings with White House officials, Axios reported.
The Trump administration ordered Anthropic to suspend access to its newly released Fable 5 and Mythos 5 models for foreign nationals, citing national security concerns.
Anthropic said the directive effectively forced it to disable the models for all users worldwide to ensure compliance.
According to Axios, company staff have been holding discussions with administration officials since Friday, while senior technical personnel traveled to Washington for in-person talks aimed at restoring access.
And U.K. Prime Minister Keir Starmer announced a social media ban for children under 16, following a model similar to Australia’s.
“Parents want to keep their kids safe and happy, but the online world has made that harder than ever,” Starmer said. “This is a line in the sand.”
The ban will cover platforms including Snapchat (SNAP), TikTok (TIKTOK), YouTube (GOOGL), Instagram, Facebook (META) and X, while messaging services such as WhatsApp and Signal are exempt.
The government also announced restrictions on livestreaming platforms and said it will explore overnight curfews and limits on infinite scrolling for under-18s.
Now Here’s What’s Trending on Seeking Alpha:
Is the Knicks championship a sign of a market top?
Spielberg’s ‘Disclosure Day’ lands with a $44M debut.
McDonald’s looks beyond Coca-Cola as it chases the specialty drink boom.
And the economic calendar is busy for a Monday as markets prepare for a holiday-shortened week, with Juneteenth on Friday.
- 08:30 am June Empire State Manufacturing
- 09:15 am May Industrial Production
- 09:15 am May Capacity Utilization
- 10:00 am June NAHB Housing Market Index

OPINION: Customers may benefit from the practice of personalised pricing, but that depends on retailers’ motivation.

NEW YORK — As both Tesla and SpaceX trade publicly in 2026, investors face a compelling choice between two Elon Musk-led companies at the forefront of electric vehicles, autonomous driving, renewable energy and space exploration. Tesla offers established automotive leadership with AI ambitions, while SpaceX brings explosive growth in launches, satellite broadband and infrastructure, but each carries distinct risks and opportunities.
Tesla shares closed recently around $406, reflecting a market capitalization exceeding $1.3 trillion. The company continues to dominate electric vehicle sales globally despite increasing competition, with strong brand loyalty and expanding energy storage operations. SpaceX, fresh from its record-breaking IPO priced at $135 per share, surged to close around $161 on debut, pushing its valuation above $2 trillion and making Musk the world’s first trillionaire when combining stakes across his ventures.
Tesla’s Strengths and Challenges
Tesla benefits from mature financials, with annual revenue exceeding $90 billion and positive free cash flow in recent periods. Vehicle deliveries remain robust, supported by the Model Y and Cybertruck, while energy generation and storage segments show high growth potential. The company’s Full Self-Driving software and robotaxi initiatives represent significant upside if regulatory hurdles are cleared and technology scales effectively.
However, Tesla faces margin pressures from price competition, higher capital expenditures for AI and manufacturing expansion, and execution risks on ambitious projects like Optimus humanoid robots. Analyst consensus leans toward Hold, with average price targets near $400-410, though optimistic forecasts from firms like ARK Invest project substantial long-term upside tied to autonomous and robotics breakthroughs.
SpaceX’s Growth Trajectory
SpaceX has revolutionized access to space with reusable Falcon 9 rockets and the Starlink constellation, which provides broadband connectivity to millions and generates growing recurring revenue. The company’s Starship program aims for fully reusable heavy-lift capabilities, potentially transforming interplanetary travel and large-scale satellite deployment. Recent infrastructure deals, including major AI computing partnerships, diversify its business beyond traditional aerospace.
The post-IPO performance highlights strong investor enthusiasm, with shares rising nearly 19% on debut. However, SpaceX remains heavily focused on capital-intensive growth, with reported losses and high burn rates as it scales operations. Valuation multiples are elevated, reflecting expectations for Starlink expansion and future contracts, but execution on Starship timelines and regulatory approvals will be critical.
Comparative Investment Case
Tesla offers more predictable near-term financials and a proven track record as a public company, appealing to investors seeking exposure to clean energy and AI with established revenue streams. Its ecosystem of vehicles, energy products and software creates multiple growth vectors, though competition in EVs and delays in autonomy pose risks.
SpaceX represents higher-risk, higher-reward potential for those bullish on the commercial space economy. Its launch dominance, Starlink subscriber growth and government contracts provide durable advantages, but the business is earlier in its maturity curve with greater execution uncertainty. The IPO has provided capital access while introducing public market scrutiny and volatility.
Both companies benefit from Musk’s leadership and synergies, including shared talent and technological cross-pollination. However, investors should consider portfolio allocation carefully, as concentrated exposure to one individual introduces company-specific risks. Diversification across both could capture complementary strengths in transportation and space infrastructure.
Market Outlook and Risks
Broader market conditions, interest rates and geopolitical factors will influence performance. Tesla’s valuation reflects optimism around AI and robotics, while SpaceX’s premium pricing bets on continued space commercialization. Regulatory environments for autonomous vehicles and satellite operations remain key variables.
Analysts emphasize long-term horizons for both names. Tesla’s path involves scaling existing businesses while pioneering new ones, whereas SpaceX must prove repeatable success with next-generation vehicles and broadband profitability. Neither is without challenges, including supply chain issues, talent retention and competition.
Investment Considerations
Neither stock suits conservative investors seeking stability. Tesla provides greater earnings visibility today, while SpaceX offers exposure to a transformative industry with massive addressable markets. Due diligence on quarterly results, technological milestones and competitive dynamics is essential.
This is not investment advice. Stock prices fluctuate based on numerous factors, and past performance does not guarantee future results. Investors should consult financial advisors and review detailed filings before making decisions. Both companies play vital roles in advancing technology and human progress, but individual suitability depends on risk tolerance, time horizon and portfolio goals.
As 2026 unfolds, the Tesla-SpaceX comparison encapsulates broader themes in innovation investing: balancing proven execution with visionary potential. Tesla’s automotive and energy leadership provides a solid foundation, while SpaceX’s orbital achievements and infrastructure expansion point to outsized opportunities in the space economy. The choice ultimately hinges on which vision investors believe will deliver superior returns over the coming decade.

Commodities: U.S.-Iran Peace Deal

Experts warn the impact of the war will continue to affect the global economy for months to come.

Weekly Market Pulse: Questions

Form 6K TOYOTA MOTOR CORP/ For: 15 June

This Week’s Market Catalysts: Fed Meeting, SpaceX (SPACEX) Debut, and U.S.-Iran Peace Agreement
David Bowie’s 1983 Heartbreaking Song Predicted the Death of Romance

North Yorkshire councillors’ home addresses to be secret


-

 Business20 hours ago
No Jackpot Winner as $257 Million Prize Rolls Over to $269 Million Monday Draw
-

 Crypto World4 days ago
Oppenheimer backs SpaceX as $70 billion retail frenzy builds
-

 Crypto World4 days ago
Markets Rally as SpaceX IPO Looms Amid Iran Tensions and Inflation Surge
-

 Fashion3 days ago
Weekend Open Thread: Tuckernuck – Corporette.com
-

 Sports7 days ago
FIFA WC 2026 Group C: Morocco, Scotland challenge Brazil’s hunt for glory | FIFA World Cup 2022
-
 Crypto World7 days ago
Eli Lilly (LLY) Stock Surges 4% Following Breakthrough Sleep Apnea Trial Results
-
Crypto World12 hours ago
Zimbabwe Requires Crypto Businesses to Register Annually Under New FIU Regulations
-

 Entertainment6 days ago
The Ryan Gosling True Crime Thriller On Netflix That Gets Even Stranger, Stream It Now
-
 Sports6 days ago
Bangladesh beat Australia after 20 years in ODIs, register only their second win over six-time world champions | Cricket News
-

 Tech3 days ago
This Week In Security: Microsoft On Microsoft, Register Your Domains, Linux On ARM, And FreeBSD Joins The File Cache Club
-

 Tech2 days ago
NanoClaw integrates JFrog registries to secure AI agent downloads
-

 Crypto World2 days ago
Bitget enters Argentina’s regulated crypto market through PSAV registration
-

 Politics4 days ago
Politics Home | Healey Resignation Is “Colossal Failure Of Government”, Says Former Labour Defence Secretary
-

 Tech5 days ago
‘This is Seattle’s position on AI’: City Council votes unanimously to pause big new data centers
-
 Tech4 days ago
Dutton Ranch star claims they ‘didn’t see any disruption’ on set following Chad Feehan’s exit from Yellowstone spinoff fueled by Taylor Sheridan clash rumors
-

 NewsBeat4 days ago
El Nino has formed in the Pacific and could set records, forecasters say
-
 Entertainment4 days ago
Donnie Wahlberg & More Heat Up Las Vegas at Circa’s Barry’s Downtown Prime
-

 Sports4 days ago
First Time Since 1971: Australia Register Historic Low In ODI Cricket
-
 Tech4 days ago
Opendoor Ends India Operations, Fueling a Bigger Conversation About AI and Outsourcing
-

 Tech7 days ago
Nvidia and Hyundai deepen their robotics push around Atlas
You must be logged in to post a comment Login