Defiance S&P 500 Target Income ETF (SPYT) is an actively managed options income ETF launched on 3/7/2024. SPYT has a distribution rate of 20% and a total expense ratio of 0.92%. Distributions are paid on a monthly basis. It is a small ETF, with $149 million in assets under management (“AUM”). Nonetheless, the average daily trading volume of $2.6 million is sufficient for long term investment and tactical allocation as well. The issuer Defiance ETFs is an asset management firm founded in 2018 with 80 ETFs in three categories: leveraged, income, and thematic funds.
Strategy
As described in the prospectus by Defiance ETFs, the fund primarily invests in an ETF tracking the S&P 500 Index, and sells daily credit call spreads on the Index.
A covered call strategy consists of investing in an asset and selling one or more call options on it for a premium. The fund’s call spread strategy adds a long call with a higher strike price for the same expiration date. Buying an additional call reduces the premium income, but also limits the risk of loss on the short call should the underlying asset price surge beyond expectations. Such a strategy enhances income with option premium, and also limits the gains from the underlying index.
Advertisement
In SPYT, call spreads are rolled on a daily basis with near-term expiration. The fund may also gain synthetic exposure to the index by using call options.
The fund targets net premiums of 1.7% per month and an annual cash distribution of approximately 20%. There is no guarantee to reach the target, though. Distributions may include a significant part of return of capital (“ROC”). Distributions in excess of the fund’s earnings will reduce the net asset value, and therefore the dollar amount of future distributions. The portfolio turnover rate was 31% in the most recent fiscal year. I will use State Street SPDR S&P 500 ETF Trust (SPY) as a benchmark.
Portfolio
As an example from 6/5/2026, the fund has 99.9% of net asset value in iShares Core S&P 500 ETF (IVV), and two positions in S&P 500 Index calls (one short and one long) expiring the same day, with strike prices of 7584.31 (short) and 7599.48 (long). The index was at 7553.68 at the previous daily close, meaning the income-generating short call is 0.4% above the closing price, and the protective long call is 0.6% above the closing price. Options will have been rolled if you read this on a later date, and these percentages may change depending on market conditions.
Performance
SPYT has underperformed SPY by 4.1% annualized from 3/14/2024 to 6/5/2026, with slightly lower volatility and similar maximum drawdown.
Advertisement
Total Return
Annual.Return
Drawdown
Advertisement
Sharpe ratio
Volatility
SPYT
39.74%
Advertisement
16.22%
-18.25%
0.98
11.46%
Advertisement
SPY
51.07%
20.36%
-18.76%
Advertisement
1.15
12.78%
Data: Portfolio123
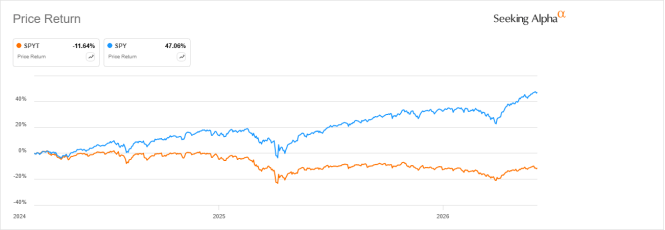
Like for most, if not all, buy-write ETFs, the high yield doesn’t offset price underperformance. Excluding distributions, SPYT has lost 11.6% from inception to 6/5/2026, while SPY is up 47%.
Advertisement
SPYT vs SPY price return (Seeking Alpha)
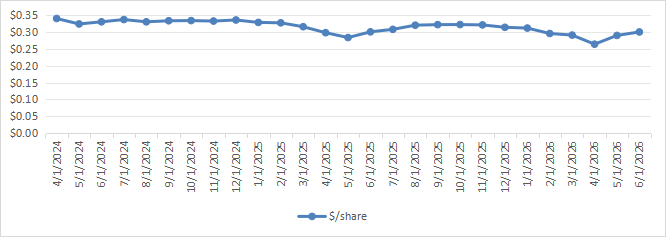
Monthly distributions have been on a slow downtrend following the share price, as plotted below.
SPYT distribution history (Chart: author; data: Defiance ETFs)
Based on the fund’s 19a-1 notice for May 2026, the distribution of that month was 100% Return of Capital (“ROC”). High ROC may have a negative impact on a shareholder’s tax payment. For example, non-resident aliens (“NRA”) may be initially submitted to withholding tax, with an adjustment at year-end that is not always automatic, depending on the broker.
Advertisement
Competitors
The next table compares characteristics of SPYT and four income ETFs based on daily rolled S&P 500 options:
This list is not intended to be exhaustive. In particular, ETFs with less then $50 million in AUM have been excluded. I have also added two non daily-rolled S&P 500 options income ETFs:
* calculated with Portfolio123 from 8/21/2024 to match inception dates.
SPYT is ranked third in yield, sixth in total return between 8/21/24 and 6/5/26, and fourth in Sharpe ratio (a measure of risk-adjusted performance). Investors focused on yield may prefer WDTE or XDTE (with the inconvenient of higher volatility and faster price erosion), while risk-averse investors may choose SPYI or GPIX for total return, lower volatility and asset preservation.
Takeaway
Defiance S&P 500 Target Income ETF (SPYT) aims at a 20% yield with a daily options strategy on the S&P 500 Index. SPYT is best-suited for investors seeking a high and stable yield and accepting significant erosion in asset value, which may be offset by reinvesting a part of distributions.
Pro: High and stable yield, sufficient liquidity.
Cons: high expense ratio, high ROC, price erosion.
This article answers three main questions about SPYT:
What criteria does SPYT have for its holdings selection?
How does SPYT compare to similar ETFs?
Which investors is SPYT suitable for?
Editor’s note: This article is intended to provide a general overview of the ETF for educational purposes only and, unlike other articles on Seeking Alpha, does not offer an investment opinion about the ETF.
Shares of Manhattan Associates surged 26.70% in Wednesday morning trading, climbing $44.90 to $213.07, after the supply chain software company reported record second-quarter results driven by strong growth in its cloud subscription business.
The Atlanta-based company reported second-quarter revenue of $297.8 million, up 9.3% from $272.4 million in the same period a year earlier and ahead of the consensus analyst estimate of roughly $293.7 million. Cloud subscription revenue, the segment investors have watched most closely as a signal of the company’s transition away from legacy licensing and services, climbed 26% year over year to $126.7 million. Services revenue came in at $133.0 million for the quarter.
On the earnings side, Manhattan Associates reported non-GAAP adjusted diluted earnings per share of $1.39, topping the analyst consensus estimate of $1.34 and improving from $1.31 reported in the second quarter of 2025. GAAP diluted earnings per share, however, declined to 85 cents from 93 cents a year earlier, with net income falling to $50.4 million from $56.8 million over the same period, a divergence that reflects differences between the company’s adjusted and unadjusted accounting measures.
The company’s remaining performance obligations, a metric that reflects contracted future revenue not yet recognized, grew 23% year over year to reach $2.5 billion as of June 30, according to the company’s earnings release. Manhattan Associates said the quarter marked its third consecutive period of record bookings, a trend executives described as reflecting sustained business momentum and effective execution of the company’s go-to-market strategy.
Advertisement
Company leadership highlighted the growing role of artificial intelligence capabilities in driving the quarter’s results. Manhattan Associates said the introduction of AI-related features across its supply chain and omnichannel commerce platforms has become a meaningful differentiator in customer conversations, contributing directly to both deal activity and the company’s broader sales pipeline growth.
The company maintained an active share buyback program during the quarter, repurchasing 874,029 shares for a total of $125.0 million. Manhattan Associates ended the quarter with $186.1 million in cash and generated $90.7 million in cash flow from operations during the three-month period, according to its financial disclosures.
Manhattan Associates’ stock had already shown strength heading into the earnings report, rising 9.8% over the month prior to the release, alongside an average analyst price target of $185.45 compared with the stock’s pre-earnings price of $151.67. The magnitude of Wednesday’s rally, however, significantly exceeded the roughly 10% to 11% gains the stock initially posted in after-hours trading following the results, suggesting that additional buying interest developed as investors had more time to digest the details of the report and the strength of the underlying cloud growth trends.
Wednesday’s surge continues a broader pattern for Manhattan Associates, whose stock has repeatedly posted double-digit single-session gains following past quarterly reports when cloud revenue growth has exceeded expectations. The company posted a similar roughly 10% jump following its first-quarter 2025 results, when cloud revenue grew 21% year over year and the company subsequently raised its full-year guidance for that fiscal year.
Advertisement
The company’s five-year historical sales growth rate stands at approximately 12.7% annually, according to recent analysis, though some market observers have noted that growth has moderated somewhat in more recent periods, with annualized revenue growth of roughly 6.3% over the trailing two years running below the longer five-year trend. Analysts have said that pattern reflects a broader dynamic within the enterprise software sector, where growth rates for even strong-performing companies have generally cooled from the elevated pace seen during and immediately following the pandemic-era surge in cloud software adoption.
Manhattan Associates provides supply chain management and omnichannel commerce software used by large retailers, logistics companies and other enterprises to manage complex inventory, fulfillment and distribution operations. The company has positioned its ongoing shift toward cloud-based subscription offerings as central to its long-term growth strategy, arguing that the recurring revenue model provides greater predictability and higher long-term customer value compared with the company’s legacy on-premises software licensing business.
Despite Wednesday’s sharp gain, the stock remains well below its most recent highs reached earlier in the year, having traded as much as 34% below those peak levels amid a period of broader volatility across software and technology stocks tied to shifting investor sentiment around enterprise software valuations and growth expectations more broadly.
Investors are likely to continue monitoring Manhattan Associates’ cloud revenue growth trajectory and the pace of its remaining performance obligations expansion in the coming quarters as key indicators of whether the company can sustain the kind of momentum reflected in Wednesday’s results, particularly as the broader enterprise software sector continues to navigate questions about the durability of growth rates following the initial post-pandemic acceleration in cloud adoption across the industry.
MGP Ingredients, Inc. (MGPI) Q2 2026 Earnings Call July 29, 2026 10:00 AM EDT
Company Participants
Julie Francis – CEO, President & Director Brandon Gall – CFO & Treasurer
Advertisement
Conference Call Participants
Seamus Cassidy – TD Cowen, Research Division Marc Torrente – Wells Fargo Securities, LLC, Research Division Sean McGowan – ROTH Capital Partners, LLC, Research Division Mitchell Pinheiro – Sturdivant & Co., Inc., Research Division Benjamin Klieve – The Benchmark Company, LLC, Research Division
Presentation
Advertisement
Operator
Good morning and welcome to the MGP Ingredients Second Quarter 2026 Earnings Conference Call with Julie Francis, President and CEO, and Brandon Gall, CFO. [Operator Instructions] Please also note this event is being recorded today.
In addition, this call may involve certain forward-looking statements. The company’s actual results could differ materially from any forward-looking statements due to a number of factors, including the risk factors described in the company’s annual and quarterly reports filed with the SEC. The company assumes no obligation to update any forward-looking statements made during the call, except as required by law.
This call will contain references to certain non-GAAP measures, which the company believes are useful in evaluating the company’s performance. A reconciliation of these measures to the most comparable GAAP measures is included in today’s earnings release, which was issued this morning before the markets opened and is available at www.mgpingredients.com. At this time, I would like to turn the call over to Julie Francis, President and CEO of MGP Ingredients. Please go ahead.
Advertisement
Julie Francis CEO, President & Director
Good morning. I’d like to thank you all for joining us today on our second quarter 2026 earnings call. For the second quarter, sales came in at $124.4 million, down versus the prior year as expected. Adjusted EBITDA of $27.6 million and adjusted basic EPS of $0.72 also declined versus the second quarter of last year. However, both of these
Shares of telehealth company Hims and Hers Health fell sharply Wednesday after the Federal Trade Commission sued the company, alleging it misled consumers about privacy protections, billing practices and subscription cancellations.
The FTC, joined by Los Angeles County and Utah, alleged Hims and Hers shared users’ sensitive health information with online advertising platforms including Meta Platforms and Snap Inc. through tracking technologies embedded on its website. The agency said the company’s practices were inconsistent with promises it made to protect users’ health data.
The FTC also accused Hims and Hers of charging customers for prescriptions before they have spoken with a healthcare provider. The agency alleges many customers are billed after completing an intake form rather than after a consultation with a medical professional.
Advertisement
The regulator further alleges the company made it difficult for users to cancel subscriptions.
Hims and Hers denied the allegation in a post on X, saying the lawsuit “disregards substantial evidence” provided during the FTC’s nearly three-year investigation into the company and “contorts the law to try to manufacture claims.”
The company said it is confident in its position and will “vigorously defend” itself.
The lawsuit comes as Hims and Hers has emerged as one of the largest telehealth providers in the fast-growing market for weight loss medications. The company offers virtual appointments and prescriptions for treatments including weight loss drugs, erectile dysfunction, hair loss and mental health medications, which are shipped directly to consumers.
Advertisement
The investigation by the FTC dates back to October 2023. CNBC has reported on several probes into Hims and Hers’ business practices, including its Super Bowl ad and compounded weight loss drugs.
In April, the FTC formally communicated the findings of its probe started in 2023 to the company and settlement discussions began. In May, Hims and Hers disclosed a $15 million probable-loss accrual related to the matter, warning the final cost could be materially higher. The company said it made a settlement offer without admitting wrongdoing.
Wednesday’s lawsuit escalates that dispute, with regulators pushing new claims.
Hello, everyone. Thank you for joining us, and welcome to the Benchmark Electronics Q2 2026 Earnings Call. [Operator Instructions]
I will now hand the conference over to Paul Mansky, Benchmark Investor Relations. Please go ahead.
Advertisement
Paul Mansky Investor Relations & Corporate Development Officer
Thank you, Piercy, and thanks, everyone, for joining us today for Benchmark’s Second Quarter 2026 Earnings Call. With us today are David Moezidis, our President and CEO; and Bryan Schumaker, our CFO.
After the market closed, we issued an earnings release pertaining to our financial performance for the second quarter of 2026, along with a presentation, which we will reference on this call. Both are available under the Investor Relations section of our website. This call is being webcast live, a replay of which will be available approximately 1 hour after we conclude.
The company has provided a reconciliation of our GAAP to non-GAAP measures in the earnings release as well as in the appendix to the presentation. Please take a moment to review the forward-looking statements disclosure on Slide 2 of the presentation.
Advertisement
During our call, we will discuss forward-looking information. As a reminder, any of today’s remarks which are not statements of historical fact are forward-looking statements, which involve risks and uncertainties as described in our press releases and SEC filings. Actual results may differ materially from these statements. Benchmark undertakes no obligation to update any forward-looking statements.
“I know I’m not going to be a millionaire running a bakery,” says Phil Clayton.
We are speaking in the busy bakery he runs with his wife Tina. It is only 10am, but the operation has been in full swing for nine hours.
Clayton says it is “absolutely not true” that the bakery enjoys more profit due to price rises.
In May, families were paying 2% more for bread rolls than they were a year earlier, according to the CPI.
Advertisement
But in April, farmers were receiving 0.3% less for wheat, the main ingredient, according to API figures.
The 2% increase in prices for customers is smaller than the 3% rise seen across the whole CPI index.
Clayton says he does not regret increasing his prices by 10p to 20p.
“My responsibility is to make sure all of this lot get paid,” he says, referring to his 30-strong team, which includes bakers, delivery drivers and Saturday staff employed in the cafe that adjoins the bakery.
Advertisement
Clayton points out the extra money shoppers pay at the tills goes towards increases in rent, wages, National Insurance, delivery fuel and the rising cost of flour – much of which originates from farms in the region.
Southeast Asia has emerged as a major electric vehicle market, with Vietnam, Singapore, Indonesia, and Thailand posting EV sales shares that rival or exceed Western benchmarks. Chinese manufacturers, led by BYD, have driven much of this growth through significant factory investments and competitive pricing, capturing dominant market share across the region.
Thailand, Indonesia, and Vietnam each represent distinct policy models: Thailand has prioritized manufacturing scale and export capacity, Indonesia is leveraging nickel reserves to demand local production commitments, and Vietnam has developed a domestic champion in VinFast. The trajectory of each market depends on how governments balance foreign investment incentives against the development of local industrial capacity.
Southeast Asia has quietly become one of the most contested electric vehicle battlegrounds on the planet. Vietnam and Singapore have pushed EV sales shares to roughly 40 percent of new car sales, a level that now exceeds the UK and the EU, while Indonesia has overtaken the United States on EV penetration and Thailand has sold more EVs in three quarters of 2025 than Denmark managed in the same period, according to energy think tank Ember. The region’s electric car sales more than doubled year on year, the International Energy Agency notes in its 2026 Global EV Outlook, with Vietnam, Indonesia and Thailand leading the charge.
What began as a Chinese-led price disruption has evolved into a genuine multi-front contest, with Japanese incumbents recalibrating, Korean and European manufacturers staking out production footholds, and Vietnam’s VinFast attempting to become the region’s first credible domestic champion beyond its home market.
Thailand: the manufacturing hub China built
Thailand remains the clearest example of how quickly an EV market can be remade. BYD’s $900 million Rayong plant, opened in July 2024 as the company’s first factory outside China, anchors a cluster that includes Great Wall Motor, SAIC Motor, GAC Aion, Changan Automobile and Chery, most either operating or completing capacity in the Eastern Economic Corridor. The Thailand Board of Investment reported this month that the kingdom has now secured over 4.1 billion dollars in EV supply chain investment pledges across 198 projects, spanning batteries, assembly, components and charging infrastructure, with Hyundai Mobility and China’s Omoda and Jaecoo both scheduled to begin production in 2026.
Chinese brands have translated that manufacturing base into commercial dominance, holding somewhere between 70 and 80 percent of Thai EV market share by most 2025-2026 estimates, with BYD alone commanding around 40 percent. That speed of displacement has not been without friction. Domestic auto sales fell to a fifteen-year low in 2024, several Japanese-oriented parts suppliers have closed, and Thai regulators opened an investigation into BYD’s local distributor over aggressive discounting that angered earlier buyers. Bangkok’s response has been to recalibrate rather than retreat: the government’s “30@30” target, once framed as a battery-electric mandate, is increasingly being pursued through a broader mix that includes hybrids, as Thai policymakers weigh industrial ambition against the risk of hollowing out a legacy auto sector that Japanese manufacturers spent six decades building.
Indonesia: playing the nickel and localization card
Indonesia has taken a different route, using its dominant global nickel reserves as leverage to demand local production in exchange for market access. BYD has committed roughly 1 billion dollars to a West Java plant targeting 150,000 units annually, due to begin operations this year, while VinFast opened its own Subang, West Java facility in December, just seventeen months after breaking ground, with an initial 50,000-unit capacity that could scale toward 350,000 units as later phases are funded. Toyota, GAC Aion and Hyundai (in partnership with LG Energy Solution on battery cells) have all made comparable localization commitments, betting that Jakarta’s local-content thresholds, which require 40 percent local content by 2026, rising to 80 percent by 2030, will reward early movers.
Advertisement
Despite the investment, EV penetration in Indonesia remains modest relative to registered vehicles, and Chinese brands led by BYD, Wuling and Chery continue to hold the advantage on price and brand recognition that VinFast and others are still trying to close.
Vietnam: the one market with a real domestic champion
Vietnam stands apart as the only Southeast Asian market with a large-scale domestic manufacturer rather than an import-and-assemble foreign operation. VinFast delivered around 124,000 EVs domestically in the first ten months of 2025 and closed the year on a record fourth quarter, with roughly 88 percent of that volume still concentrated in Vietnam itself. The company is now attempting to convert that home advantage into a regional one, targeting at least 300,000 deliveries in 2026 and pushing into Indonesia, India, the Philippines and Malaysia through a mix of local assembly, an electric taxi fleet under its Xanh SM brand, and an aggressive charging buildout through its V-Green unit. BYD has entered Vietnam but remains a marginal player there so far, a rare instance in the region of a domestic brand holding off Chinese competition on its own turf.
The foreign-versus-domestic calculus
The pattern across the three largest markets suggests foreign capital, overwhelmingly Chinese, is setting the pace of the region’s EV transition, while domestic policy is shaping where that capital lands and on what terms. Thailand has traded market share for manufacturing scale and export capacity, positioning itself to ship Thai-made EVs to Europe and Australia. Indonesia is trading market access for supply chain localization tied to its mineral wealth. Vietnam is the outlier, having incubated a national champion capable of competing on price with Chinese entrants, though VinFast’s continuing losses underline how costly that path has been.
For investors and business planners tracking ASEAN exposure, the near-term signals worth watching are Thailand’s shift toward a multi-technology, hybrid-inclusive strategy as pure-BEV demand growth moderates, Indonesia’s ability to convert local-content rules into a genuine domestic battery and component industry rather than a captive assembly hub, and whether VinFast’s push into Indonesia, the Philippines and beyond can achieve profitability before Chinese manufacturers close the remaining gap on brand trust.
Thailand, often dubbed the “Land of Smiles,” has become a notable destination for sex tourists. Many men are drawn by the country’s reputation for vibrant nightlife, affordability, and the perceived availability of sex. The red-light districts in cities like Bangkok and Pattaya offer an array of clubs and bars where men can easily engage in paid encounters. Cultural attitudes towards sex work and a non-judgmental environment further contribute to this appeal.
The Allure of Thailand for Men Seeking Companionship
Thailand has become a popular destination for men seeking companionship and intimacy, largely due to the country’s vibrant nightlife and perceived affordability. The appeal lies in its entertainment districts teeming with bars, clubs, and massage parlors that promise an exhilarating experience. Many tourists are drawn by the notion of an adventure that combines exotic allure with a sense of liberation.
Cultural and Social Drivers
Cultural perceptions also play a role, as some men view Thailand as a place where societal norms are different, allowing for more freedom in personal interactions. This perception is often shaped by stories and media portrayals that emphasize relaxation and indulgence. The local hospitality and the welcoming nature of the people further enhance this image, making it a seemingly desirable destination for those yearning for a break from their routine lives.
Lasting Impressions and Impact
For those who visit, the experiences can be memorable, often leaving a lasting impression. The distinctive atmosphere, combined with personal connections formed, sometimes leads men to yearn for a return journey. However, it is crucial to approach these interactions thoughtfully, respecting cultural nuances and considering the broader implications on local communities. Such experiences, while enticing, also call for a respectful and mindful engagement with the rich culture and its people.
A woman who has publicly alleged private misconduct by South Korean actor Hwang Jung-min pushed back Wednesday against her characterization by the actor’s talent agency as a criminal stalker, telling reporters that a legal fight between the two sides remains active in the courts.
The woman, identified only by the initial “A” in Korean media reports in keeping with local privacy conventions, told the entertainment outlet StarNews that she had seen the official statement issued by Hwang’s agency, Sam Company. “Regardless, it’s a fact that a 3 million won fine was issued, and I’m currently disputing multiple cases in formal trial,” she said, referring to roughly $2,200 in South Korean currency.
She went on to characterize the agency’s public statement as a deliberate framing strategy. “That’s probably all Hwang Jung-min’s side can say right now,” she said. “The only thing they can do at this point is push this narrative as far as possible, painting me as a stalking criminal.”
The dispute traces back to allegations the woman first raised on her personal social media account regarding Hwang’s private conduct. According to StarNews’s reporting, Hwang and the woman first met in August 2023 and maintained contact over roughly two years, during which time she says the relationship grew close. The woman has alleged that during that period, Hwang made sexually suggestive remarks to her, proposed meetings and a business partnership, and exchanged selfies and photographs with her.
Advertisement
Hwang’s agency, Sam Company, issued a formal response disputing the woman’s characterization of their relationship entirely, describing her instead as “a stalking crime suspect who has continuously harassed Hwang Jung-min.” The agency said Hwang had filed a criminal complaint against the woman, and that a court had imposed provisional restraining measures against her on three separate occasions, including orders barring her from approaching Hwang. The agency further stated that a summary court order had found her guilty of stalking and imposed a fine of 3 million won, and said the company intended to pursue additional legal action over what it described as maliciously edited posts targeting the actor.
Court records cited in the reporting confirm that the woman received a summary fine order of 3 million won on stalking charges in February. She has not accepted that outcome and is currently contesting it through a formal trial process, according to her own statement to reporters. Separately, in February, the woman filed a civil lawsuit against Hwang seeking approximately 200 million won, or roughly $145,000, in damages, according to the same reporting.
The dispute has continued to escalate publicly in the days since the initial allegations surfaced, with additional claims and counterclaims emerging from both sides. According to related coverage, questions have also been raised about whether the woman contacted a minor connected to Hwang, allegations that have added a further layer of controversy to the case, though the specifics of those additional claims remain contested between the parties. Separately, disputes have emerged online over the authenticity of audio recordings connected to the case, with conflicting claims about whether the recordings were artificially manipulated or whether the application used to create them makes such manipulation technically implausible.
Hwang Jung-min is one of South Korea’s most prominent film actors, known for a body of work spanning several decades and multiple major domestic box office successes, including roles in films that have drawn wide critical acclaim within the Korean film industry. His representation by a major talent agency and his public profile in South Korea mean that legal disputes involving him tend to draw substantial domestic media coverage, as has been the case with this dispute since it first became public.
Advertisement
Cases involving stalking allegations in South Korea are governed under the country’s Act on Punishment of Stalking Crimes, which was substantially strengthened in recent years following a series of high-profile stalking-related violent incidents. Provisional restraining measures of the kind the agency said were imposed against the woman are a common tool used by South Korean courts in stalking cases to separate parties while a criminal investigation or prosecution proceeds, distinct from a final determination of guilt.
Both the criminal case against the woman and her separate civil damages lawsuit against Hwang remain active and unresolved as of Wednesday, according to the available reporting, with the woman having formally challenged her stalking conviction rather than accepting the summary fine order. Neither Hwang nor his agency has publicly addressed the woman’s specific underlying allegations regarding his private conduct in detail beyond disputing her characterization of their relationship and asserting that she is the one engaged in a pattern of unlawful harassment.
With both legal proceedings ongoing, further developments in the case are expected to continue drawing significant attention from South Korean entertainment media in the weeks ahead, particularly as the formal trial contesting the woman’s stalking conviction moves forward alongside her separate civil suit against the actor.





















































You must be logged in to post a comment Login