
Crypto World
1,700 UK Investors Sue Binance Over Derivatives Offerings

Almost 1,700 UK investors are reportedly suing Binance and its founder Changpeng Zhao for 150 million British pounds ($200 million), alleging the crypto exchange offered and sold crypto derivatives without regulatory approval.
The law firm representing the investors, KP Law, said Binance’s leverage tokens, futures contracts and options offerings breached the Financial Services and Markets Act 2000 and that these products continued to be offered after the Financial Conduct Authority banned such products from being offered to retail customers in January 2021.
“There appeared to be no effective barrier preventing UK customers from accessing them,” the law firm said.
Binance told Cointelegraph it would “defend against these claims through the appropriate legal process” and it “remains committed to its obligations to users and to operating in accordance with applicable law.”

Source: Cointelegraph
The lawsuit adds to a growing list of legal and regulatory challenges for the crypto exchange, including recently failing to secure a Markets in Crypto-Assets-compliant license from a European Union member state before the July 1 deadline.
Binance has also been facing allegations that it facilitated $850 million in transactions tied to a sanctioned Iranian financier that flowed to Iran’s Islamic Revolutionary Guard Corps. The crypto exchange strongly denied the allegations.
Binance UK customers lost “tens of thousands of pounds”
One of the affected customers, Tomas Sutas, was a financial controller who allegedly invested more than 100,000 British pounds ($132,400) into Binance’s derivatives products before the value of his investments was wiped out, the Financial Times reported.
Reuters also reported that multiple UK users lost “tens of thousands of pounds” through the products.
Related: Australia’s crypto travel rule is coming into effect: Here’s what’s changing
KP Law said it is still identifying the full scope of affected customers.
“While the precise number of UK customers affected is not publicly known, Binance is one of the world’s largest cryptocurrency exchanges, meaning that a substantial number of users could potentially have been exposed to these issues.”
Binance’s operations in the UK became heavily restricted in June 2021 when the FCA informed Binance Markets Limited that it couldn’t operate in the region without written consent.
Reuters noted that the lawsuit was filed in the London High Court.
The Binance-affiliated Nest Exchange and “persons unknown” were also named as defendants.
Magazine: Bitcoin slides to $58K, XRP hits $1 but onchain data promising: Market Moves

Bitcoin’s price is on the move today, prompted by the latest developments on the US-Iran war front, but this time in the opposite direction.
After it slipped to another multi-week low yesterday evening, the cryptocurrency has rebounded by approximately $1,500 and now sits at around $63,500. The reason for this is the major de-escalation announced by the POTUS hours ago.
US President Trump announced on his social media platform, Truth Social, that although his country’s military remains “locked and loaded” to continue attacking Iran, they were asked by the Middle Eastern country and other nations in the region to pause the strikes for now.
He added that those countries are working on a new deal that would include the “immediate, complete and total opening of the Hormuz Strait, and an end to Iran’s nuclear threat.”
“Based on this request, I have agreed, for the future benefit of the WORLD and, likewise, the survival of a successful and prosperous Iran, to cancel the attack, subject to being able to rapidly make a DEAL. The Country of Israel joins me in this commitment. Get to work, everybody, and get it DONE.”
As mentioned above, BTC reacted immediately with a notable rebound. It had dipped to an 18-day low at $62,200 yesterday evening as the tension between the two had increased once again, with new planned strikes. In addition, there are other factors, such as ETF exodus and technical indicators, that suggested the cryptocurrency could face another leg down soon.
For now, though, the war developments appear to have the most significant impact on bitcoin’s price moves, and essentially every de-escalation brings back hope to the market. The actual impact is likely to be experienced on Monday morning, as it has happened numerous times in the past several weeks.

The post Bitcoin Price Rebounds as Trump Calls Off Iran Strikes and Hints at a Deal appeared first on CryptoPotato.

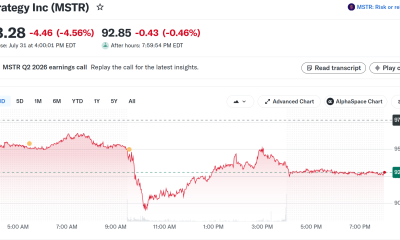
Leading Bitcoin treasury company Strategy’s results for the second quarter show a loss of over $8 billion, while crypto exchange Coinbase reported a 14% quarterly revenue loss.
According to the two companies’ latest earnings reports released on Thursday, Strategy lost over $8.23 billion in its operations after recording an unrealized loss of $8.32 billion in the second quarter of 2026. The largest crypto exchange by volume in the U.S., Coinbase, also suffered a 19% annual revenue decline, while its trading volumes went down 24% to slightly above $145 billion.
Q2 2026 Bitcoin Price Cooldown Sees Strategy Draw Losses
Strategy grew its BTC holdings by 846 units within the three-month period ending June 30. In its report, the company’s chief executive, Phong Le, said it reduced its convertible debt to just under $7 billion and increased its U.S. dollar holdings and Bitcoin per share by 12% and 5%, respectively. The Bitcoin treasury had seen a $10 billion income in the second quarter of 2025, but Bitcoin’s dull price performance this year has supposedly caused a net loss of $8.22 billion.
“Our objective is for STRC to trade over time at $99 to $100. If STRC trades below $100, we intend to repurchase STRC shares in a regular and disciplined manner, scaling our repurchases according to market price and liquidity. These repurchases are an attractive use of capital that reduces our future preferred dividend requirements at a discount while allowing independent market demand to establish a healthy and sustainable market,” the CEO explained.
In the total revenue column for the quarter, Strategy announced it had a 6.9% increase in the last 12 months, jumping from $114.5 million in Q2 2025 to over $122 million in Q2 2026. The gross profits made by the company’s business reached $81.6 million, which it counted as a 69% gross margin compared to the previous year’s second quarter’s $78.7 million.
“In the midst of this phase of muted bitcoin sentiment and market skepticism, we continue to evolve our business model and establish Digital Credit as a new asset class. Our plan is to return STRC to health with stable demand, high liquidity, and low volatility trading near par. We believe this is the best way to create shareholder value over the long term,” executive chairman and founder Michael Saylor told reporters.
Coinbase Revenue Drops after Trading Slump, Prediction Market Thrives
Meanwhile, Coinbase’s first half of the year continues to yield lower-than-expected earnings following a continued loss trend in both quarters, but its prediction market sector has risen by more than $100% quarter-over-quarter. The exchange revealed its revenue had taken a 19% hit in the 12 months ending June 30, and its transaction revenue dropped 21%. As seen in the report on net losses, the trading company’s earnings before interest, taxes, depreciation, and amortization reached $208 million, while it recorded over $300 million in losses after adjustments.
Coinbase’s fee collection from subscriptions and services slumped by 5% in the quarter but accounted for almost half of its net revenue in that period. Consumer transactional revenue also fell by 20% compared to Q1 2026, which the company attributed to a 24% decline in crypto spot trading volume. At the end of the quarter, the average amount of USDC held across Coinbase products hit a record high of $20 billion, accounting for more than 30% of all USDC in circulation.
The post Strategy Posts $8.2B Q2 Loss as Coinbase Revenue Falls 19% appeared first on CryptoPotato.

Federal prosecutors are continuing to litigate the fallout from the collapse of FTX, as defense teams push back on what juries can hear and how certain market activities are regulated. In the Southern District of New York (SDNY), Michelle Bond—whose husband, former FTX executive Ryan Salame, is serving a 90-month sentence after pleading guilty in 2023—has asked the court to block references to that guilty plea in a campaign finance case.
At the same time, other SDNY-related crypto-adjacent legal fights are highlighting how prediction markets and event contracts can collide with insider-trading and commodity regulation arguments. Separate actions involving a former congressman’s Kalshi trades and a US soldier accused of making a large Polymarket bet underscore that courts may soon be forced to clarify both evidentiary rules and the legal classification of event contracts.
Key takeaways
- Michelle Bond’s legal team asked SDNY to exclude evidence tied to Ryan Salame’s guilty plea, arguing it has little relevance to Bond’s alleged intent or knowledge.
- In a separate CFTC case, former New York Rep. George Santos was ordered to pay $35,000 over trades on Kalshi’s event contracts, with the regulator citing misleading posts about his planned attendance at the 2026 State of the Union.
- A US soldier accused of earning more than $400,000 on Polymarket event contracts is seeking dismissal, challenging whether the Commodity Exchange Act can clearly apply to event contracts as “swaps.”
- Across these matters, the central pressure points are evidentiary fairness for defendants and regulatory clarity for prediction-market participants.
Bond seeks to bar Salame’s guilty plea in campaign finance fight
According to a Friday filing in the US District Court for the Southern District of New York, Michelle Bond’s attorneys asked the court to preclude the government from introducing evidence about Ryan Salame’s guilty plea or any “related plea materials” in her campaign finance case.
Bond faces charges over alleged unlawful campaign funding tied to her unsuccessful 2022 congressional run in New York. The prosecution’s theory, as described in the filing, is that contributions supporting Bond’s campaign were partially funded through FTX arrangements facilitated by Salame.
Salame pleaded guilty in 2023 and is currently serving a 90-month sentence connected to conduct arising from FTX’s 2022 collapse. In Bond’s motion, her lawyers argued that Salame’s plea—where he admitted to making political contributions in Bond’s name funded by transfers from accounts associated with an FTX-linked entity—should not be treated as evidence against Bond herself.
“The Court should preclude the government from introducing or referring to Mr. Salame’s guilty plea or any related plea materials, because their minimal probative value is substantially outweighed by the risk of unfair prejudice to Ms. Bond,” the filing states.
Bond’s team further said that the plea materials do not meaningfully bear on Bond’s state of mind. They characterized the plea as an admission of Salame’s own guilt, not proof of Bond’s knowledge or participation in the charged conduct, quoting from the motion: “[…] Mr. Salame’s plea materials lack any probative value as to Ms. Bond’s guilt, knowledge, or intent. Mr. Salame’s plea is an admission of his own guilt, not evidence of Ms. Bond’s state of mind or participation in any charged offense.”
How personal litigation could become part of the argument
Bond’s motion also requested that the court allow information connected to her “contemporaneous divorce and custody proceedings.” Her lawyers appear to be positioning that personal context to rebut the government’s characterization of Bond as an “ordinary ‘individual’ donor,” despite her and Salame having divorced before the alleged criminal conduct.
While the filing’s request reflects a broader strategy often used in criminal litigation—attempting to shape how jurors interpret the campaign contributions and the parties’ relationship—the court’s decision will determine what personal-history evidence, if any, is ultimately presented.
CFTC penalizes George Santos for Kalshi event-contract trading
Separate from the FTX-linked litigation, the US Commodity Futures Trading Commission (CFTC) has issued an order involving George Santos, a former member of the US House of Representatives who was expelled from Congress in 2023. The CFTC ordered Santos to pay $17,500 in a civil monetary penalty plus $17,570 in disgorgement from profits earned through prediction market trading on Kalshi.
According to the CFTC, the relevant trades were tied to event contracts betting on whether Santos would appear at the 2026 State of the Union in Washington, DC. The regulator said Santos posted on social media about his plans to attend or not attend the event, and that these posts contained “material misrepresentations and omissions.”
The CFTC added that after the posts, contract prices moved in a direction favorable to Santos’ positions, enabling him to earn over $17,500.
As part of the CFTC order, Santos is barred from trading on prediction market platforms for three years.
The case also sits in the shadow of Santos’ criminal proceedings. Earlier coverage notes Santos was sentenced to 87 months in prison in 2025 for wire fraud and aggravated identity theft, though he served only three months before his sentence was commuted by US President Donald Trump, as reflected in the article’s background.
Polymarket insider-trading allegations tested under “swap” debate
A more direct challenge to prediction-market regulation is underway in another SDNY matter. Gannon Ken Van Dyke, a US soldier accused of making more than $400,000 trading Polymarket event contracts, is attempting to dismiss the indictment.
As outlined in the background of the case, prosecutors allege that Van Dyke traded using nonpublic information connected to a military operation involving the removal of Venezuelan President Nicolás Maduro in January. The US Department of Justice alleges he used that alleged insider information to wager on whether Maduro would be removed from power, leading to criminal charges filed in April.
In a Friday SDNY filing, Van Dyke’s attorneys submitted a 51-page memorandum supporting a motion to dismiss. Among other arguments, they contend that the Commodity Exchange Act (CEA) is ambiguous in how it treats event contracts as “swaps,” which is relevant to three of the charges.
Van Dyke’s lawyers argue that the ambiguity affects basic fairness: if the “swap” definition is not clear across Congress, agencies, and courts, ordinary citizens may lack “fair notice” that their prediction-market wagers fall under the CEA.
“If Congress, executive branch agencies, and courts all find the ‘swap’ definition ambiguous, how can ordinary citizens have fair notice that prediction market wagers are covered by the CEA?” the filing asks.
The defense also contrasts with the position taken by the CFTC under Chair Michael Selig, which has argued it has “exclusive jurisdiction” over prediction markets by treating event contracts as “swaps.” The dismissal motion suggests that—at least for some counts—those jurisdictional assumptions may not survive if the law is too unclear.
Why these cases matter beyond one courtroom
Taken together, the filings point to two urgent fault lines for the crypto-adjacent prediction market space: what evidence courts allow juries to consider when guilt and intent are contested, and whether the regulatory framework—especially the CEA’s treatment of event contracts—offers enough clarity for enforcement.
As courts weigh motions like Bond’s request to exclude plea materials and Van Dyke’s bid to dismiss based on legal ambiguity, traders, builders, and public officials using event-contract platforms may want to watch how judges define relevance, prejudice, and “fair notice.” The next procedural rulings could signal how far prosecutors can stretch existing statutes—and how tightly defendants can force regulators to justify their classification theories.

The first half of 2026 was the most active six months for crypto exploits on record.
This is according to a new report from Blockaid, which shows hackers stole $1.1 billion across 212 incidents.
Crypto Hacks Top $1.1B in H1 2026
The Blockaid report found that four major incidents involving KelpDAO, Drift, Resolv, and CoW Swap made up roughly $707 million of the total losses.
KelpDAO suffered the largest loss, after hackers stole $292 million worth of crypto by faking a cross-chain message that siphoned off the protocol’s Ethereum reserves. Drift Protocol, a perpetuals exchange built on the Solana chain, also suffered a similarly huge hit, as it was exploited for $285 million within 12 minutes.
Blockaid linked both cases to TraderTraitor, a state-sponsored North Korean subset of the larger Lazarus Group. Humanity Protocol’s $32 million loss was also connected to the same attacker cluster, bringing DPRK-linked losses to $609 million, which is about 55% of all funds stolen during the period.
The pace of attacks also increased through the year, with monthly incidents going from 18 in January to 57 in June. April proved to be the most painful month, as the KelpDAO and Drift Protocol hacks wiped out a combined $577 million to push total losses in that month to $635 million.
Privileged key misuse was the most costly attack type in the first half of 2026, with losses of approximately $790 million, or close to three-quarters of all funds stolen in the period, said Blockaid. Unbacked mint exploits came second in value, led by the $80 million Resolve breach. But the hacks at the code level caused the most casualties, accounting for nearly four out of five attacks by count.
Attack Vectors Change as New Threats Emerge
The report named AI agents as a new target after hackers in May used a prompt injection attack to fool Bankr’s AI agent into approving an unauthorized transaction for about $216,000.
Cross-chain bridges also took a major hit, with attackers breaching the verification systems of KelpDAO and Taiko through forged proofs and attestations accepted by the destination chains.
In addition, security teams faced newer attack methods in 2026, with Blockaid identifying four incidents involving EIP-7702 wallet delegation attacks, where a wallet can hand control to a smart contract. Legacy smart contracts also continue to be a common vulnerability, with data showing around five cases in May and June, including two involving Aztec Connect and one targeting Raydium’s AMM V3.
Recent incidents outside the report period showed the same pressure on crypto infrastructure. For instance, on July 23, AFX Trade, BSquaredNetwork, and Verus were hit in separate attacks on the same day that collectively caused more than $35 million in losses. Recall that Verus had already suffered another exploit about two months earlier, and Blockaid linked both incidents to the same bridge contract and bug class.
Recovery results varied depending on the type of attack. Per the report, code-related incidents sometimes allowed teams to freeze funds or negotiate returns, while attacks involving stolen keys usually ended with the money moving through mixers or cross-chain routes.
The post Crypto Hacks Drain $1.1B in First Half of 2026 Amid 212 Security Incidents appeared first on CryptoPotato.


Holders of Strategy’s (MSTR) high-yielding preferred stock STRC will not see a dividend increase in August.
Led by Executive Chairman Michael Saylor, Strategy is maintaining the current 12% dividend on the shares.
STRC investors may have been expecting as much as a 50-basis-point hike in the dividend as Strategy has customarily raised the payout anytime the stock traded sizably below its par value ($100) for the month.
As recently as July 1, Strategy had lifted the dividend 50 basis points following June’s plunge in STRC to as low as $71.
While that hike — along with Strategy’s sale of some bitcoin to fund dividends, and a bit of stabilization in the price of bitcoin — helped STRC bounce in July to the current $89.46, that level is still significantly below par.
CEO Phong Le yesterday said Strategy’s Corporate Objective is for STRC to trade at $99-$100 over time.
Nevertheless, the company is under no obligation to raise the dividend and chose not to do so this month.

A Friday filing in the U.S. District Court for the Southern District of New York (SDNY) seeks to limit what prosecutors can use in the campaign-finance case involving Michelle Bond, the wife of former FTX Digital Markets co-CEO Ryan Salame.
Bond’s attorneys argued that evidence tied to Salame’s 2023 guilty plea—while relevant to his own conduct—should not be admitted against her because it carries a risk of unfair prejudice and, in their view, offers little direct proof of Bond’s knowledge or intent. The motion also asks the court to factor in details from Bond’s contemporaneous divorce and custody proceedings.
Key takeaways
- Michelle Bond wants the court to exclude evidence and “related plea materials” tied to Ryan Salame’s guilty plea, arguing they are not probative of her state of mind.
- Bond’s campaign-finance charges stem from allegations that contributions to her 2022 congressional bid were influenced by FTX-linked activity facilitated by Salame.
- The SDNY motion also requests inclusion of information about Bond’s divorce and custody proceedings, contending she was not an “ordinary” donor.
- Separately, the CFTC ordered former congressman George Santos to pay $35,000 in total—$17,500 in penalty and $17,570 in disgorgement—over trades connected to Kalshi prediction market event contracts.
- A soldier accused of making more than $400,000 on Polymarket event contracts linked to a military operation asked the SDNY court to dismiss charges, citing ambiguity in how “swap” definitions apply to event contracts under the Commodity Exchange Act.
Bond asks SDNY to keep Salame’s guilty plea out of her case
Bond faces campaign finance charges tied to her unsuccessful 2022 congressional run in New York. According to the criminal allegations, contributions to her campaign were partly funded through FTX-related channels that were facilitated by her husband, Ryan Salame.
In the latest SDNY filing, Bond’s legal team asked the court to preclude prosecutors from introducing Salame’s guilty plea and related plea materials. The filing points to the core logic of the request: Bond is not being tried for Salame’s admissions, and the defense claims the government’s use of those materials would not meaningfully establish Bond’s guilt, knowledge, or intent.
Bond’s attorneys argued that Salame’s plea is an admission of his own conduct, not evidence about Bond’s mental state or participation in the charged offense. They said the materials’ probative value is substantially outweighed by the risk of unfair prejudice to Bond.
Prosecutors are expected to weigh heavily on the narrative connecting alleged campaign funding to the conduct of individuals tied to FTX’s collapse. Bond’s motion, however, signals an effort to narrow what jurors are allowed to consider—particularly evidence that may influence them emotionally or circumstantially rather than strictly proving the elements of the charges against her.
Why the defense is raising divorce and custody proceedings
Alongside the evidentiary dispute over Salame’s plea, Bond’s filing also requested that the court include information related to Bond’s divorce and custody proceedings that were underway around the same time as the alleged crime.
Bond’s lawyers’ position is that the circumstances of her family life affect how her campaign-related donor status should be viewed. The filing argues that Bond should not be treated as an ordinary individual donor solely because she is facing personal charges in connection with her political bid, even if she and Salame were not married at the time of the alleged conduct.
Whether and to what extent these family-law details will be admissible is likely to be a key procedural issue. It can shape the tone and framing of the case—especially if the government seeks to portray the campaign finances as closely connected to Salame’s network rather than to Bond’s independent circumstances.
George Santos ordered to pay over Kalshi predictions market trading
In a separate development involving prediction markets, the U.S. Commodity Futures Trading Commission (CFTC) ordered former New York representative George Santos—who was expelled from Congress in 2023—to pay a total of $35,000. The figure breaks down into a $17,500 civil monetary penalty and $17,570 in disgorgement of profits.
The regulator said the action was tied to Santos trading on event contracts on Kalshi connected to whether he would attend the 2026 State of the Union address in Washington, DC. The CFTC stated that Santos made social media posts about his plans to attend or not attend the event and that those posts contained “material misrepresentations and omissions.”
According to the CFTC, after the posts, the contract prices moved in a way that became favorable to Santos’ positions and allowed him to make more than $17,500.
As part of the same order, Santos was barred from trading on prediction market platforms for three years. The order also comes against the backdrop of criminal proceedings: Santos was sentenced to 87 months in prison for wire fraud and aggravated identity theft in 2025, but served only three months before his sentence was commuted by U.S. President Donald Trump, as noted in earlier reporting.
Polymarket insider-trading allegations head toward dismissal arguments
Another SDNY filing, this time from the defense of Gannon Ken Van Dyke, challenges the legal foundation of allegations that he profited from Polymarket event contracts using nonpublic information.
The U.S. Justice Department says Van Dyke was involved in a military operation connected to the removal of Venezuelan President Nicolás Maduro in January, and prosecutors allege he later used insider information to bet whether Maduro would be removed from power—leading to criminal charges announced in April. The defense filing argues Van Dyke is facing accusations involving more than $400,000 in alleged profits from Polymarket event contracts.
Van Dyke’s attorneys filed a 51-page memo supporting a motion to dismiss the indictment based on multiple legal theories. One focus is the Commodity Exchange Act’s treatment of event contracts as “swaps,” which the defense characterizes as ambiguous.
While the CFTC under Chair Michael Selig has asserted that the agency has “exclusive jurisdiction” over prediction markets by treating event contracts as “swaps,” Van Dyke’s lawyers say the uncertainty itself is enough to dismiss at least some charges. In the filing, they argue that if lawmakers, executive agencies, and courts consider the “swap” definition ambiguous, then ordinary citizens cannot reasonably have fair notice that prediction market wagers fall under the CEA.
The case is expected to proceed on a timeline that could lead to trial in late 2026 or early 2027, based on a schedule submitted in June, and Van Dyke has pleaded not guilty to all charges.
The defense’s arguments also extend beyond Van Dyke’s personal exposure. The filing suggests the ruling could matter for lawmakers and government officials who have used prediction markets in connection with political events or public statements. Earlier coverage referenced by the filing indicates that Trump’s teleprompter operator reportedly placed more than $100,000 in bets on Kalshi event contracts tied to presidential speeches, underscoring how prediction markets can draw interest from political circles.
Across these cases, courts are being asked to decide what evidence is fair game, what definitions govern crypto-adjacent instruments, and how much clarity regulators must provide before individuals can be held criminally liable—issues that could determine how future crypto and prediction-market enforcement plays out.

Wife of former FTX executive seeks to preclude her husband’s guilty plea
In a Friday filing with the US District Court for the Southern District of New York (SDNY) over campaign finance charges, Michelle Bond’s legal team asked the court to consider precluding evidence related to former FTX Digital Markets co-CEO Ryan Salame, her husband who is currently serving a 90-month sentence after he pleaded guilty in 2023.
Bond faces campaign finance charges alleging that her unsuccessful 2022 congressional run in New York was partially funded by contributions from FTX facilitated by Salame. As part of the filings this week, Bond asked the court to exclude evidence of her husband’s guilty plea and “related plea materials,” in which the former executive admitted to making “political contributions in [his] name that were funded by transfers from the bank accounts” of an entity tied to FTX.
“The Court should preclude the government from introducing or referring to Mr. Salame’s guilty plea or any related plea materials, because their minimal probative value is substantially outweighed by the risk of unfair prejudice to Ms. Bond,” said the filing.
Bond’s lawyers added:
“[…] Mr. Salame’s plea materials lack any probative value as to Ms. Bond’s guilt, knowledge, or intent. Mr. Salame’s plea is an admission of his own guilt, not evidence of Ms. Bond’s state of mind or participation in any charged offense.”
The motion also requested the court include information related to Bond’s “contemporaneous divorce and custody proceedings,” arguing that though she and Salame were not married at the time of the alleged crime, the former FTX executive was not an “ordinary ‘individual’ donor” contributing to her campaign.
Related: US Senate unanimously adopts resolution opposing clemency for SBF
The criminal case is one of the latest involving individuals tied to the defunct crypto exchange following its 2022 collapse. Salame, former FTX CEO Sam Bankman-Fried and former Alameda Research CEO Caroline Ellison were all sentenced to prison for their role in the misuse of customer funds and related charges.
Former congressman ordered to pay $35,000 over Kalshi bet
George Santos, a former New York House representative who was expelled from Congress in 2023, was ordered to pay a $17,500 civil monetary penalty and $17,570 in disgorgement from profits earned over bets placed on prediction markets platform Kalshi. The order from the US Commodity Futures Trading Commission (CFTC) stemmed from Santos trading on event contracts betting on his appearance at the 2026 State of the Union address in Washington, DC.
“While buying and selling positions in this market, Santos posted on social media about his plans to attend or not attend the SOTU,” said the CFTC. “In his social media posts, Santos made a series of material misrepresentations and omissions about whether he would attend the SOTU. After these posts, the SOTU contract prices moved in a direction that was favorable to Santos’ positions which allowed him to make over $17,500.”
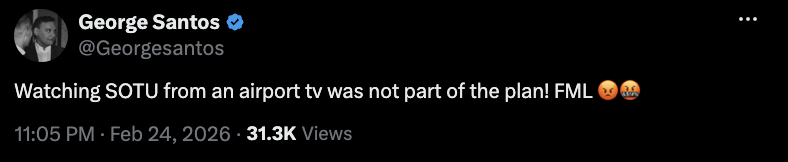
February X post about his State of the Union attendance. Source: George Santos
Santos is barred from trading on prediction market platforms for three years as part of the order. He was also previously sentenced to 87 months in prison for wire fraud and aggravated identity theft in 2025, but served only three months before his sentence was commuted by US President Donald Trump.
US solider accused of making $400,000 Polymarket bet seeks to dismiss charges
Gannon Ken Van Dyke is a US soldier who faces charges for allegedly making more than $400,000 on Polymarket event contracts using nonpublic information tied to a military operation involving the removal of Venezuelan President Nicolás Maduro in January. He was involved in the operation removing Maduro, according to the US Justice Department, and allegedly used insider information to bet whether the Venezuelan president would be removed from power, leading to criminal charges in April.
In a Friday SDNY filing, Van Dyke’s legal team filed a 51-page memo in support of a motion to dismiss the indictment based on different legal theories, including that the Commodity Exchange Act (CEA) at the center of three of the charges was “ambiguous” in treating event contracts as “swaps.”
Although the CFTC under Chair Michael Selig has claimed that the agency has “exclusive jurisdiction” over prediction markets on the basis that event contracts are treated as “swaps,” Van Dyke’s lawyers said the lack of clarity was sufficient to dismiss some of the charges.
“If Congress, executive branch agencies, and courts all find the ‘swap’ definition ambiguous, how can ordinary citizens have fair notice that prediction market wagers are covered by the CEA?” said the filing. “They cannot.”
The case is expected to have significant implications for lawmakers and government officials using prediction markets. Trump’s teleprompter operator reportedly made more than $100,000 using Kalshi event contracts related to the president’s speeches.
Based on a schedule filed in June, Van Dyke is potentially looking at a trial beginning in late 2026 or early 2027. He has pleaded not guilty to all charges.
Magazine: Here’s why the CLARITY Act’s ethics deal may be so hard to reach


The attacker working through Coldcard-generated keys is now emptying wallets worth a few thousand dollars each.
Galaxy Research flagged a third wave of sweeps early Sunday, roughly 208 bitcoin drained from 1,912 addresses between Friday midday and Saturday morning UTC.
That is just over a tenth of a bitcoin per victim. The July 30 opening wave averaged close to a full coin, 1,083 bitcoin from 1,196 addresses in 41 minutes.
Observed losses across all three waves now total 1,367 bitcoin, nearly $89 million, from 4,585 addresses.
Wave three sends each victim’s coins to its own destination rather than the handful of shared collector addresses that made the first two easy to map, and parks them in pay-to-witness-script-hash outputs, a format that can carry multisignature or timelock conditions, instead of the plain single-key outputs used before.
It batched an average of six victims into each sweep where wave one took exactly one at a time, and it scanned only the default derivation path, the standard branch of the key tree a wallet checks first, instead of testing several branches per seed.

Perhaps due to the quickly re-escalating tension in the Middle East, the cryptocurrency market has posted fresh losses over the past few hours, with BTC dropping to $62,000 after failing to reclaim the $63,000 support during the day.
XRP was not spared, as it just slipped below $1.05. The asset was rejected at $1.20 during the mid-July rally after the favorable US inflation data for June, and eventually lost the coveted $1.10 support. Now, it fights for the last line of defense before the bulls would have to defend the $1.00 zone.
Popular analyst EGRAG CRYPTO outlined the significance of the $1.05 level, calling it the ‘battlefield’ region. Although he noted earlier today that the cross-border token had managed to maintain that level, he acknowledged the predominantly bearish structure of lower highs on the 4-hour chart.
The short-term path of recovery would be a successful defense of $1.05 before XRP can bounce above $1.083 and eventually reclaim the $1.10 level, which now acts as resistance.
EGRAG laid out an even more promising road ahead for the asset if it manages to continue its recovery, with the “major price target” set at $1.30.
However, a decisive breakdown below $1.05 would essentially mean that XRP will head toward the notable liquidity zone at around $1.00, he warned.
Mikybull Crypto also believes XRP has the strength to stage a surprising comeback. The analyst claimed that the asset’s bullish reversal run is currently loading despite the negative outlook.
His long-term chart compares the current market structure with the one from two years ago when XRP was highly compressed at around $0.60. Once it broke out the upper boundary, though, it rocketed to a fresh all-time high within less than a year.
“Before the last run, I screamed for you to buy at a crazy discount. The opportunity is presenting again,” he said now.
History is not on XRP’s side at the moment, though, as August has been quite a painful month for the asset. As reported earlier today, the cross-border token was deep in the red in all four previous editions.
The post XRP Price Dips to ‘Battlefield’ Zone, but Analysts See Major Reversal Opportunity appeared first on CryptoPotato.
Q1 earnings this week: Infosys, Eternal, Bajaj Auto among 573 companies set to announce June quarter results

CISA warns of cyberattacks disrupting U.S. water utilities

Three top UK family dog walks are close to Bolton

Renter of Home in Anne Heche Crash Denies Settlement With Son

No Jackpot Winner as $257 Million Prize Rolls Over to $269 Million Monday Draw

Weekend Open Thread: Staud – Corporette.com

What is Finance? | Definition Financial Company|Financial Information| Accounts Video #financial

Howard prints money on the anniversary of the creation of the U.S. Monetary System (August 8, 1786)

Complete Finance MasterClass 2025 | For people in 20’s & 30’s
-
 Sports6 days ago
Commonwealth Games boxing: Jadumani Singh seals dominant 5-0 win over Pakistan’s Sumama Rehman to enter quarter-finals | Commonwealth Games News
-

 Business3 days ago
Why Trees Belong on the Risk Register
-

 Fashion2 days ago
Weekend Open Thread: Wit & Wisdom
-

 Tech6 days ago
Intel is reversing course and bringing hyper-threading back to its server chips
-

 Politics1 day ago
Meta enters AI-training agreement with far-right ‘propaganda rag’ Newsmax
-

 Politics6 days ago
Luke Littler dismantles Gerwyn Price to retain title in Blackpool
-
 Crypto World15 hours ago
MicroStrategy Post-Earnings CLARITY Act Push Could Add New Catalyst for Its Stock
-

 Politics5 days ago
The Part of the Electric Transition Nobody Wants to Discuss
-
 Entertainment4 days ago
‘Stargate’ Creator’s New Sci-Fi Series Returns for Season 3 Tomorrow
-

 News Videos6 days ago
BITCOIN JUST ENTERED THIS CRITICAL ZONE…
-

 Business4 days ago
Major shareholder moves on Canyon
-

 Crypto World7 days ago
XRP Ledger adds $2.6B as RWA inflows rank second
-

 Politics7 days ago
Spain sweeps the board at 2026 World Cup with individual awards
-

 News Videos3 days ago
Bitcoin Enters the 3rd Stage of the Bear Market
-
Crypto World23 hours ago
XRP Ledger v3.3.0 brings five institutional features
-

 Crypto World4 days ago
Kraken Enables Retail Access to Jersey Mike’s IPO via Tokenized Shares
-

 Tech5 days ago
New macOS Sequoia & Sonoma security updates for older Macs
-

 News Videos4 days ago
Claude: Build Financial Dashboards in Minutes (2026)
-

 Politics3 days ago
Luke Littler’s dominance sparks GOAT debate
-

 Sports2 days ago
Seema Kaliramna Wins Discus Throw Bronze, Takes India’s CWG Medals Tally To 17
You must be logged in to post a comment Login