
Crypto World
Complete guide to automated crypto trading in 2026


Disclosure: This article does not represent investment advice. The content and materials featured on this page are for educational purposes only.
A new guide explains how crypto trading bots automate strategies, manage risk, and execute trades across spot and futures markets around the clock.
Summary
- This guide explains how crypto trading bots automate strategies, manage risk, and operate across volatile markets 24/7.
- Learn how grid, DCA, and other crypto trading bots work, plus setup tips, backtesting, and strategy basics.
- Explore crypto trading bots, popular strategies, and practical guidance for automating trades across crypto markets.
A crypto trading bot can help users automate their trading strategies across volatile markets without staring at charts around the clock. This guide covers everything from grid trading and signal bot management to setup and optimization, so anyone can decide if automated crypto trading fits their plan.
Key takeaways
Modern trading bots automate buy and sell orders on a crypto exchange 24/7, executing trades based on predefined parameters while sleeping, working, or simply stepping away. Automated trading reduces stress and emotional mistakes, letting a strategy run without hesitation. Here are the essentials:
- Grid bots and DCA bots dominate retail bot trading in 2026, profiting from market volatility by buying low and selling high across multiple levels.
- Bots support long and short positions on both spot and futures markets, depending on the exchange and configuration.
- Backtesting and paper trading are non-negotiable before committing real money. Setting up a profitable trading bot requires an understanding of trading strategies and market mechanics.
- Profitability is never guaranteed. In comparative tests, only 3 of 8 bots produced consistent profit over six months. Success depends entirely on strategy and discipline.
What is a crypto trading bot?
A crypto trading bot is software that automatically executes buy and sell orders on a crypto exchange based on predefined rules or algorithms. Bots connect to exchanges via APIs to manage, buy, and sell cryptocurrencies, acting on real-time price data without manual intervention. Automated trading can operate 24/7 without human intervention across dozens of trading pairs simultaneously.
Common bot types include: grid trading bot, DCA bot, arbitrage bot, market-making bot, and trend-following bot. Each uses different indicators and logic to automate decisions. Since 2017–2018, crypto trading bots have evolved from simple scripts into full platforms with dashboards, mobile apps, cloud hosting, and a growing community of traders sharing custom strategies.
How crypto trading bots work in practice
A typical workflow looks like this: connect an exchange via api keys, select a strategy, define risk parameters, enable the bot, then track performance over time. Crypto trading bots continuously monitor market data, including price and volume, evaluate conditions against a setup, and submit orders via exchange APIs.
Market analysis involves monitoring price, volume, order books, and technical indicators. Bots use limit orders, market orders, stop-loss, take-profit, and trailing stops to manage positions. They handle position sizing, scaling in, and scaling out for both long and short positions. Advanced bots can use machine learning or statistical models, but most retail bots in 2026 rely on rule-based strategies and backtested parameters. Automated bots can execute trades based on predefined parameters consistently, whether users configure a simple grid or a complex signal-based system.
Popular types of crypto trading bots
Bots differ mainly by strategy logic and how they respond to market volatility. No single bot type is best for making money; performance depends on configuration, risk limits, and market regime.
Grid trading bots
A grid trading bot places a series of buy and sell limit orders at predefined price levels, creating a grid that profits from price oscillations. Grid trading bots buy low and sell high automatically, and a grid bot operates within a predefined price range. Automated trading can profit in sideways markets with grid strategies, where price bounces between support and resistance.
Visually, the grid looks like horizontal lines between a lower price bound and a higher price bound, with buy orders on lower levels and sell orders on higher levels across multiple levels. Variations include:
- Neutral Grid bots profit in sideways markets by buying low and selling high
- Long Grid bots accumulate profits during upward trends by buying dips
- Short Grid bots automate short-selling in bearish market conditions
- Infinity Grid bots expand upward without an upper price limit
- Futures Grid bots operate on derivatives markets using leverage
Grid bots can be configured for bullish or bearish markets. Key parameters include grid range, number of grid levels, order size, base vs quote currency, and safety stops. A short grid bot works best during bearish conditions, while a long grid bot captures upside in trending markets. Users can also run hedge mode to maintain positions in both directions simultaneously.
DCA bots
Dollar-Cost Averaging (DCA) purchases a set amount of cryptocurrency regularly, and DCA bots automate this process by buying more as the price drops. For example, a DCA bot might buy $50 every time the price drops 5%, averaging entry at a lower price across multiple steps.
DCA bots combine with take-profit targets and trailing exits to lock gains once the average entry returns to profit. Be cautious: aggressive DCA without caps can lock all capital into a losing position. Always set a maximum number of safety orders and a fixed allocation.
Signal-based and copy trading bots
A signal bot executes trades automatically when it receives external signals from TradingView signals, custom APIs, or third-party providers. Traders connect indicators from platforms like TradingView to trigger automated orders on their crypto exchange account.
Copy trading bots mirror trades from a strategy provider onto the user’s balance, making automation accessible to beginners. Always evaluate any new signal source with paper trading first, apply strict risk limits per trade, and verify the provider’s data and track record before committing real money.
Key features to look for in a crypto trading bot platform
Not every platform delivers equal results. Feature set, security, and reliability determine long-term success.
Essential features include support for major exchanges (spot and futures), backtesting, paper trading, robust risk management tools, and a responsive support team. Look for a visual strategy builder, pre-made templates for grid trading and DCA, clear performance analytics, and detailed documentation. Security risks include vulnerabilities in API keys used by bots for trading, which always require encrypted key storage, no withdrawal permissions, 2FA for account access, IP whitelisting, and activity logs. No credit card is required to start on most platforms.
Exchange connectivity and market coverage
A serious platform in 2026 should support multiple top-tier exchanges like Binance, OKX, Bybit, Coinbase, and Kraken for spot and derivatives. Users might notice the OKX logo alongside Binance and Bybit on most bot platforms. Check exchange-specific limits-minimum order size, tick size, and leverage caps-that affect bot configuration. Running the same grid strategy on two exchanges can produce different outcomes due to liquidity and fee differences.
Backtesting, paper trading, and optimization
Backtesting means running a strategy on historical market data to estimate performance before risking capital. Backtesting strategies on historical data increases trading confidence. Grid trading strategies can be backtested over 15 days or longer to see how they handle both sideways phases and sharp breakouts.
Paper trading simulates live conditions with virtual balances. Optimize by adjusting grid width, number of levels, and take-profit distances. But beware of overfitting-strategies that perform perfectly on past data may fail in future volatile markets.
Risk management for bot trading
Successful bot trading requires strict risk management strategies. Automated trading amplifies both good and bad strategies, so risk controls are non-negotiable.
- Never invest money that someone cannot afford to lose
- Diversify across strategies and pairs
- Cap maximum exposure per bot to 1–3% of total account equity
- Use stop loss, equity limits, and max daily loss rules
Always start with a small size in live mode, even after successful paper trading, to account for slippage and execution differences.
Specific risks of grid trading bots
Range break risk occurs when price trends strongly beyond the grid range, leaving unclosed positions and large unrealized losses. Grid bots can also tie capital in numerous open orders, reducing flexibility. If grid steps are too narrow, trading fees (0.1–0.2% per cycle) consume most of the profit. Set an emergency stop loss beyond grid boundaries and monitor an account daily.
Leverage and futures Bots: Long and short positions
Futures grid bots and DCA bots can use leverage to open long and short positions, amplifying both profits and losses. Isolated margin limits risk to a single position; cross margin exposes the entire account. Moderate leverage (2x–5x) suits most automated strategies. A short grid bot on BTC during a rapid short-covering rally can face liquidation. Understand the exchange’s funding fees, liquidation mechanics, and margin requirements before enabling any futures bot.
How to get started with a crypto trading bot in 2026
Start by learning basic crypto trading concepts, then choose a reliable exchange, enable 2FA, and create api keys with trading-only permissions. Select a platform that supports grid trading, DCA bots, paper trading, and clear tools to track performance. Begin with a simple predefined template instead of complex custom strategies on day one.
Step-by-Step Setup Checklist
- Create an exchange account, complete KYC, and enable 2FA
- Generate API keys-trading permissions only, no withdrawals, restrict by IP
- Connect a bot platform and enable paper trading
- Select a bot type (e.g., BTC/USDT neutral grid: wide range, 5–10 levels, small order size)
- Run simulation for 2–4 weeks, then go live with minimal capital
- Monitor logs, open orders, and realized PnL daily in the first week
After several weeks of stable results, gradually scale positions or deploy additional bots. Document every setup, result, and adjustment in a trading journal format to optimize an approach over time. Send a message or alert for any configuration change.
Advanced topics: Strategy design and optimization
Serious traders eventually design or configure their own trading strategies, combining indicators like RSI, moving averages, and Bollinger Bands with grid or DCA logic. Regime detection-distinguishing sideways vs trending markets-helps decide when to switch bots on or off. Multi-timeframe analysis (1-minute entries, 1-hour trend direction) improves robustness, and simple statistical filters like volatility thresholds can boost consistency.
Monitoring, analytics, and troubleshooting
Track metrics beyond profit: win rate, average trade size, maximum drawdown, and profit factor. Set up alerts (email, mobile, Telegram) for key events-bot stopped, API errors, equity drawdown thresholds. Common problems include a bot not trading due to a too-narrow grid, an incorrect position mode (hedge vs one-way), or an invalid symbol mapping. Manage a regular review schedule: daily quick check, weekly deeper analysis, monthly parameter review to keep performance aligned with current market conditions.
Legal, tax, and ethical considerations
Regulations and tax rules vary by country and change frequently-consult local professionals. Some jurisdictions classify certain automated strategies as investment services requiring licensing. Profits from bot trading are typically taxed like manual crypto gains, but the higher trade volume means heavier record-keeping. Use exportable trade histories from your platform to simplify reporting. Avoid market manipulation tactics and respect exchange terms of service.
FAQ
Is a crypto trading bot profitable for beginners?
Bots do not guarantee profits-they execute a strategy consistently, so a bad strategy will still lose money. Beginners should use simple grid bots or dca bots with low risk settings and focus on learning risk management. Start with paper trading for at least 2–4 weeks, then go live with very small amounts.
How much money do I need to start bot trading?
Some exchanges allow orders as small as $10–$20, but the recommended capital for grid trading is $200 to properly cover multiple grid levels and minimum order sizes. Don’t deploy all capital into a single bot-keep a cash buffer and diversify.
Can I run multiple crypto trading bots at the same time?
Most modern platforms support running many bots simultaneously on different pairs or even the same pair with different strategies. Track total exposure to avoid over-allocating across overlapping bots on correlated assets, and cap active bot allocation at 30–50% of an account.
What hardware and internet connection do I need?
Cloud-hosted platforms remove most hardware requirements. Self-hosted bots need a stable VPS (1–2 vCPUs, 2–4 GB RAM) with low-latency internet and a system clock synchronized via NTP. Avoid hosting critical bots on unreliable home connections without power backup or remote access.
How do I know if my API keys are safe on a bot platform?
Always disable withdrawal permissions and enable 2FA on both the exchange and bot platform. Choose platforms with encrypted key storage, IP whitelisting, and transparent security documentation. Rotate keys every 3–6 months and revoke immediately if suspicious activity is detected.
Disclosure: This content is provided by a third party. Neither crypto.news nor the author of this article endorses any product mentioned on this page. Users should conduct their own research before taking any action related to the company.


Decentralized exchange spot trading rose to about 24% of centralized exchange volume in July 2026, according to The Block’s current DEX-to-CEX data series.
Summary
- July’s DEX-to-CEX spot ratio reached about 24%, according to The Block’s current data series estimate.
- DefiLlama’s trailing data ranked Solana, BNB Chain and Ethereum among the largest spot ecosystems globally.
- Robinhood Chain added July activity after Uniswap deployed four protocol versions from its first day.
The reading was described as the strongest shown in the current series and continued a broader rise in onchain market share since 2024.
The Block calculates the measure by dividing monthly DEX volume by volume on a selected group of centralized exchanges. Its dashboard includes the top 30 decentralized exchanges by volume from DefiLlama. Therefore, the figure does not mean DEXs handled 24% of combined spot trading. It means DEX activity equaled roughly 24% of the covered CEX total.
DEX spot volume ratio reaches about 24% in July
The July figure followed a faster expansion that began in 2025. The ratio remained below 10% for much of 2024 before rising as traders increasingly used permissionless markets for memecoins, newly issued assets and products unavailable on large centralized platforms.
However, the reading also came during a weaker period for centralized spot trading. Talos reported that total exchange spot volume fell 28% quarter over quarter to $2.32 trillion in the second quarter of 2026. Lower CEX activity can lift the ratio even when DEX volume does not reach an absolute record.
Current DefiLlama data shows that activity remains spread across several networks. Its Aug. 2 trailing 30-day rankings listed Solana at about $49.86 billion, BNB Chain at $31.04 billion, Ethereum at $28.84 billion and Base at $22.38 billion in spot DEX volume. Robinhood Chain added another $14.48 billion over the same rolling period.
New chains and wider token access supported onchain trading
Robinhood Chain was one of July’s clearest new sources of DEX activity. Uniswap Labs announced that Uniswap v2, v3, v4 and UniswapX went live on the network on July 2, one day after its public mainnet launch. The deployment supported crypto assets and Robinhood Stock Tokens through Uniswap’s web app, wallet and API.
CoinDesk Data later estimated that Robinhood Chain averaged about $690 million in daily DEX and aggregator volume over a seven-day period. Activity peaked at $943.6 million on July 11, while Uniswap accounted for about 99.5% of the network’s seven-day DEX volume.
The stock tokens were available in more than 120 countries but were not offered to U.S. users. Early trading also included memecoins rather than being limited to tokenized equities and other real-world assets.
As crypto.news reported, Robinhood Chain drove a sharp increase in Uniswap activity and passed $1 billion in cumulative swap volume during its first ten days. However, the role of speculative tokens makes sustained activity more important than launch-week totals.
Other ecosystems entered July with established onchain liquidity. Solana DEX volume exceeded $800 billion during the first part of 2025, while Jupiter remained a major routing layer for trades.
The “record” description needs a methodology caveat
The claim that July produced the “highest level since tracking began in 2019” requires qualification. The Block’s current chart supports the reported July reading, but older reports from the same publisher described higher figures under earlier versions of its data.
In June 2025, The Block reported that DEXs reached 25% of CEX spot volume during May. One month later, it reported a 29% ratio for June. Both historical figures are above July 2026’s roughly 24% reading.
The difference may reflect historical data revisions, changes in the exchanges counted or adjustments to volume filtering. However, the public description on the current dashboard does not explain why its historical readings differ from the publisher’s earlier articles.
A separate CoinGecko study used a different group of exchanges. It placed DEX spot share at 24.5% in June 2025 before the measure returned to about 13%–14% by January 2026. CoinGecko linked the earlier peak partly to Binance Alpha 2.0 routing trades through PancakeSwap.
CoinGecko’s top-20 exchange coverage and The Block’s current top-30-DEX methodology are not directly interchangeable. July can therefore be described safely as the highest reading in the current cited series. Calling it an uncontested market-wide record would go beyond the available methodology disclosures.
What comes next for the DEX-to-CEX ratio
The August reading will show whether the ratio can remain near one-quarter of covered CEX volume after July’s new-chain activity settles. Traders will also watch whether Robinhood Chain retains its early volume and whether Solana, BNB Chain, Ethereum and Base maintain their current pace.
Absolute volume will matter alongside market share. A rising ratio caused mainly by falling CEX activity would describe a different market structure from one driven by growing DEX liquidity, more users and deeper trading pools. Changes to protocol coverage or the exchanges included in the calculation could also revise historical readings.
No verified token-price move can be attributed solely to July’s ratio. The data shows where spot trades occurred, not why individual assets moved. The next completed monthly datasets should provide a clearer test of whether July marked a durable change or a temporary peak connected to new products and network launches.


South Korea’s five major won-based crypto exchanges recorded 560.3 billion won, about $367 million, in net stablecoin outflows to overseas platforms in June 2026.
Summary
- 18 consecutive months of stablecoin outflows ended June with 560.3 billion won leaving South Korea.
- June transfers sent 2.7625 trillion won overseas and returned 2.2022 trillion won to Korean exchanges.
- Reported uses include overseas derivatives, RWA products, DeFi and staking services unavailable on Korean exchanges.
The figure extended the country’s uninterrupted outflow run to 18 months.The figures came from Financial Supervisory Service data submitted to People Power Party lawmaker Lee Jong-wook and reported by Yonhap News on Aug. 2. Upbit, Bithumb, Coinone, Korbit and Gopax sent 2.7625 trillion won in stablecoins abroad during June. They received 2.2022 trillion won from overseas exchanges.
South Korean stablecoin outflows reach 560.3 billion won
The latest monthly total continued an uninterrupted net-outflow streak that began in January 2025, when the available data series started. Every month since then, stablecoin withdrawals to foreign exchanges have exceeded deposits returning to the five Korean platforms.
June’s net outflow rose from 477.1 billion won in May but remained below January’s 1.1429 trillion won. The monthly figures show persistent outward movement despite substantial changes in the amounts transferred.
The gap also remained large during the second quarter. Between April and June, net stablecoin outflows reached 1.6872 trillion won. During the same period, Korean retail investors recorded 1.6185 trillion won in net sales of overseas stocks, according to Korea Securities Depository figures cited by Yonhap.
In June alone, overseas stock purchases exceeded sales by $472.54 million, or about 722 billion won using the month’s average exchange rate. Stablecoin net outflows therefore equaled 77.6% of Korean investors’ net overseas stock purchases. However, the comparison does not prove that both flows involved the same investors or strategies.
Overseas derivatives appear to drive stablecoin demand
The report said the transferred stablecoins are “believed to be used mainly” for products unavailable on domestic exchanges. These include crypto and equity derivatives, tokenized real-world assets, decentralized finance services and staking products.
Some overseas platforms offer futures and other leveraged products linked to cryptocurrencies and major Korean stocks, including Samsung Electronics, SK Hynix and Hyundai Motor. However, the FSS figures track transfers between exchanges rather than each wallet’s final activity. The proposed connection to specific products remains an estimate, not a transaction-by-transaction finding.
The overseas shift comes as domestic trading activity has weakened. Crypto.news reported that trading volume across the five major won exchanges fell 54.6% year over year during the first half of 2026. Lower local activity provides context, although the available data does not establish it as the cause of the overseas transfers.
Investor protection pressure meets delayed legislation
Lee called for faster safeguards, saying investors were “being left defenseless against high-risk derivatives on foreign exchanges.” He asked the government to review its investor protection and management framework as more funds move offshore.
South Korea is already working on broader digital asset rules. At a March 4 Virtual Asset Committee meeting, the Financial Services Commission discussed exchange internal controls, security standards, strict compensation duties and possible rules for stablecoin issuers. The commission said it planned further consultations before legislation moved forward.
However, the details remain unsettled. In January, the FSC cautioned that major provisions covering stablecoin issuers and ownership structures had not been finalized.
More recently, as crypto.news reported, the regulator told lawmakers it intended to prepare a consolidated Digital Asset Basic Act covering stablecoins, exchanges, disclosures and operational controls.
The next monthly exchange data will show whether July extended the outflow streak to 19 months. Regulators may also face pressure to distinguish ordinary cross-border transfers from flows connected to leveraged derivatives, DeFi and other higher-risk services.
For now, the June figures document movements between Korean and overseas exchanges. They do not identify individual users, destination platforms or final investments. Any policy response will depend on further regulatory reviews and progress on the Digital Asset Basic Act.
Bitcoin’s price dipped to another multi-week low at just over $62,000 on Saturday evening but rebounded to $63,500 on Sunday morning after US President Donald Trump said he had canceled the planned attacks against Iran.
Most larger-cap alts have turned green with minor increases, led by Cardano’s native token, which has jumped by 9%.
BTC Returns to Over $63K
The business week began on a more positive note after last weekend’s de-escalation in the Middle East. Bitcoin had remained above $64,000, and then it tapped $65,600 on a couple of occasions on Monday. However, it couldn’t continue upward, and uncertainty ahead of the FOMC meeting led investors to de-risk by offloading BTC, which resulted in a massive drop to $62,800.
Volatility remained high before and after the event, with the asset going up and down between $63,000 and $65,000. It rocketed to just over the upper boundary on Friday morning, where it was rejected once again.
The subsequent leg down was even more painful as bitcoin dipped to $62,400 for the first time in over two weeks. It managed to rebound to $63,000 on Saturday before it dropped once again to $62,100 (on most exchanges). The situation improved on Sunday morning after US President Trump canceled planned attacks against Iran, and BTC jumped to $63,500.
Its market cap has reclaimed $1.270 trillion, while its dominance over the alts remains below 57% on CG.

ADA Soars
Most larger-cap alts have turned green in the past day. XRP has defended the $1.05 support, which has been described as a major support level by analysts that can propel the next rally. SOL is up by 1%, and so is HYPE. ETH, TRX, DOGE, RAIN, and ZEC have marked minor increases.
Cardano’s native token has become today’s top performer, surging by 9% to $0.185. XLM, DOT, AVAX, NEAR, PEPE, and WLD have marked gains of up to 4%.
The total crypto market cap is up by $40 billion since yesterday’s low and is up to $2.250 trillion on CG.

The post Cardano Rockets by 9%, Bitcoin Reclaims $63K After War De-Escalation: Weekend Watch appeared first on CryptoPotato.
Bitcoin’s price is on the move today, prompted by the latest developments on the US-Iran war front, but this time in the opposite direction.
After it slipped to another multi-week low yesterday evening, the cryptocurrency has rebounded by approximately $1,500 and now sits at around $63,500. The reason for this is the major de-escalation announced by the POTUS hours ago.
US President Trump announced on his social media platform, Truth Social, that although his country’s military remains “locked and loaded” to continue attacking Iran, they were asked by the Middle Eastern country and other nations in the region to pause the strikes for now.
He added that those countries are working on a new deal that would include the “immediate, complete and total opening of the Hormuz Strait, and an end to Iran’s nuclear threat.”
“Based on this request, I have agreed, for the future benefit of the WORLD and, likewise, the survival of a successful and prosperous Iran, to cancel the attack, subject to being able to rapidly make a DEAL. The Country of Israel joins me in this commitment. Get to work, everybody, and get it DONE.”
As mentioned above, BTC reacted immediately with a notable rebound. It had dipped to an 18-day low at $62,200 yesterday evening as the tension between the two had increased once again, with new planned strikes. In addition, there are other factors, such as ETF exodus and technical indicators, that suggested the cryptocurrency could face another leg down soon.
For now, though, the war developments appear to have the most significant impact on bitcoin’s price moves, and essentially every de-escalation brings back hope to the market. The actual impact is likely to be experienced on Monday morning, as it has happened numerous times in the past several weeks.

The post Bitcoin Price Rebounds as Trump Calls Off Iran Strikes and Hints at a Deal appeared first on CryptoPotato.

Leading Bitcoin treasury company Strategy’s results for the second quarter show a loss of over $8 billion, while crypto exchange Coinbase reported a 14% quarterly revenue loss.
According to the two companies’ latest earnings reports released on Thursday, Strategy lost over $8.23 billion in its operations after recording an unrealized loss of $8.32 billion in the second quarter of 2026. The largest crypto exchange by volume in the U.S., Coinbase, also suffered a 19% annual revenue decline, while its trading volumes went down 24% to slightly above $145 billion.
Q2 2026 Bitcoin Price Cooldown Sees Strategy Draw Losses
Strategy grew its BTC holdings by 846 units within the three-month period ending June 30. In its report, the company’s chief executive, Phong Le, said it reduced its convertible debt to just under $7 billion and increased its U.S. dollar holdings and Bitcoin per share by 12% and 5%, respectively. The Bitcoin treasury had seen a $10 billion income in the second quarter of 2025, but Bitcoin’s dull price performance this year has supposedly caused a net loss of $8.22 billion.
“Our objective is for STRC to trade over time at $99 to $100. If STRC trades below $100, we intend to repurchase STRC shares in a regular and disciplined manner, scaling our repurchases according to market price and liquidity. These repurchases are an attractive use of capital that reduces our future preferred dividend requirements at a discount while allowing independent market demand to establish a healthy and sustainable market,” the CEO explained.
In the total revenue column for the quarter, Strategy announced it had a 6.9% increase in the last 12 months, jumping from $114.5 million in Q2 2025 to over $122 million in Q2 2026. The gross profits made by the company’s business reached $81.6 million, which it counted as a 69% gross margin compared to the previous year’s second quarter’s $78.7 million.
“In the midst of this phase of muted bitcoin sentiment and market skepticism, we continue to evolve our business model and establish Digital Credit as a new asset class. Our plan is to return STRC to health with stable demand, high liquidity, and low volatility trading near par. We believe this is the best way to create shareholder value over the long term,” executive chairman and founder Michael Saylor told reporters.
Coinbase Revenue Drops after Trading Slump, Prediction Market Thrives
Meanwhile, Coinbase’s first half of the year continues to yield lower-than-expected earnings following a continued loss trend in both quarters, but its prediction market sector has risen by more than $100% quarter-over-quarter. The exchange revealed its revenue had taken a 19% hit in the 12 months ending June 30, and its transaction revenue dropped 21%. As seen in the report on net losses, the trading company’s earnings before interest, taxes, depreciation, and amortization reached $208 million, while it recorded over $300 million in losses after adjustments.
Coinbase’s fee collection from subscriptions and services slumped by 5% in the quarter but accounted for almost half of its net revenue in that period. Consumer transactional revenue also fell by 20% compared to Q1 2026, which the company attributed to a 24% decline in crypto spot trading volume. At the end of the quarter, the average amount of USDC held across Coinbase products hit a record high of $20 billion, accounting for more than 30% of all USDC in circulation.
The post Strategy Posts $8.2B Q2 Loss as Coinbase Revenue Falls 19% appeared first on CryptoPotato.

Federal prosecutors are continuing to litigate the fallout from the collapse of FTX, as defense teams push back on what juries can hear and how certain market activities are regulated. In the Southern District of New York (SDNY), Michelle Bond—whose husband, former FTX executive Ryan Salame, is serving a 90-month sentence after pleading guilty in 2023—has asked the court to block references to that guilty plea in a campaign finance case.
At the same time, other SDNY-related crypto-adjacent legal fights are highlighting how prediction markets and event contracts can collide with insider-trading and commodity regulation arguments. Separate actions involving a former congressman’s Kalshi trades and a US soldier accused of making a large Polymarket bet underscore that courts may soon be forced to clarify both evidentiary rules and the legal classification of event contracts.
Key takeaways
- Michelle Bond’s legal team asked SDNY to exclude evidence tied to Ryan Salame’s guilty plea, arguing it has little relevance to Bond’s alleged intent or knowledge.
- In a separate CFTC case, former New York Rep. George Santos was ordered to pay $35,000 over trades on Kalshi’s event contracts, with the regulator citing misleading posts about his planned attendance at the 2026 State of the Union.
- A US soldier accused of earning more than $400,000 on Polymarket event contracts is seeking dismissal, challenging whether the Commodity Exchange Act can clearly apply to event contracts as “swaps.”
- Across these matters, the central pressure points are evidentiary fairness for defendants and regulatory clarity for prediction-market participants.
Bond seeks to bar Salame’s guilty plea in campaign finance fight
According to a Friday filing in the US District Court for the Southern District of New York, Michelle Bond’s attorneys asked the court to preclude the government from introducing evidence about Ryan Salame’s guilty plea or any “related plea materials” in her campaign finance case.
Bond faces charges over alleged unlawful campaign funding tied to her unsuccessful 2022 congressional run in New York. The prosecution’s theory, as described in the filing, is that contributions supporting Bond’s campaign were partially funded through FTX arrangements facilitated by Salame.
Salame pleaded guilty in 2023 and is currently serving a 90-month sentence connected to conduct arising from FTX’s 2022 collapse. In Bond’s motion, her lawyers argued that Salame’s plea—where he admitted to making political contributions in Bond’s name funded by transfers from accounts associated with an FTX-linked entity—should not be treated as evidence against Bond herself.
“The Court should preclude the government from introducing or referring to Mr. Salame’s guilty plea or any related plea materials, because their minimal probative value is substantially outweighed by the risk of unfair prejudice to Ms. Bond,” the filing states.
Bond’s team further said that the plea materials do not meaningfully bear on Bond’s state of mind. They characterized the plea as an admission of Salame’s own guilt, not proof of Bond’s knowledge or participation in the charged conduct, quoting from the motion: “[…] Mr. Salame’s plea materials lack any probative value as to Ms. Bond’s guilt, knowledge, or intent. Mr. Salame’s plea is an admission of his own guilt, not evidence of Ms. Bond’s state of mind or participation in any charged offense.”
How personal litigation could become part of the argument
Bond’s motion also requested that the court allow information connected to her “contemporaneous divorce and custody proceedings.” Her lawyers appear to be positioning that personal context to rebut the government’s characterization of Bond as an “ordinary ‘individual’ donor,” despite her and Salame having divorced before the alleged criminal conduct.
While the filing’s request reflects a broader strategy often used in criminal litigation—attempting to shape how jurors interpret the campaign contributions and the parties’ relationship—the court’s decision will determine what personal-history evidence, if any, is ultimately presented.
CFTC penalizes George Santos for Kalshi event-contract trading
Separate from the FTX-linked litigation, the US Commodity Futures Trading Commission (CFTC) has issued an order involving George Santos, a former member of the US House of Representatives who was expelled from Congress in 2023. The CFTC ordered Santos to pay $17,500 in a civil monetary penalty plus $17,570 in disgorgement from profits earned through prediction market trading on Kalshi.
According to the CFTC, the relevant trades were tied to event contracts betting on whether Santos would appear at the 2026 State of the Union in Washington, DC. The regulator said Santos posted on social media about his plans to attend or not attend the event, and that these posts contained “material misrepresentations and omissions.”
The CFTC added that after the posts, contract prices moved in a direction favorable to Santos’ positions, enabling him to earn over $17,500.
As part of the CFTC order, Santos is barred from trading on prediction market platforms for three years.
The case also sits in the shadow of Santos’ criminal proceedings. Earlier coverage notes Santos was sentenced to 87 months in prison in 2025 for wire fraud and aggravated identity theft, though he served only three months before his sentence was commuted by US President Donald Trump, as reflected in the article’s background.
Polymarket insider-trading allegations tested under “swap” debate
A more direct challenge to prediction-market regulation is underway in another SDNY matter. Gannon Ken Van Dyke, a US soldier accused of making more than $400,000 trading Polymarket event contracts, is attempting to dismiss the indictment.
As outlined in the background of the case, prosecutors allege that Van Dyke traded using nonpublic information connected to a military operation involving the removal of Venezuelan President Nicolás Maduro in January. The US Department of Justice alleges he used that alleged insider information to wager on whether Maduro would be removed from power, leading to criminal charges filed in April.
In a Friday SDNY filing, Van Dyke’s attorneys submitted a 51-page memorandum supporting a motion to dismiss. Among other arguments, they contend that the Commodity Exchange Act (CEA) is ambiguous in how it treats event contracts as “swaps,” which is relevant to three of the charges.
Van Dyke’s lawyers argue that the ambiguity affects basic fairness: if the “swap” definition is not clear across Congress, agencies, and courts, ordinary citizens may lack “fair notice” that their prediction-market wagers fall under the CEA.
“If Congress, executive branch agencies, and courts all find the ‘swap’ definition ambiguous, how can ordinary citizens have fair notice that prediction market wagers are covered by the CEA?” the filing asks.
The defense also contrasts with the position taken by the CFTC under Chair Michael Selig, which has argued it has “exclusive jurisdiction” over prediction markets by treating event contracts as “swaps.” The dismissal motion suggests that—at least for some counts—those jurisdictional assumptions may not survive if the law is too unclear.
Why these cases matter beyond one courtroom
Taken together, the filings point to two urgent fault lines for the crypto-adjacent prediction market space: what evidence courts allow juries to consider when guilt and intent are contested, and whether the regulatory framework—especially the CEA’s treatment of event contracts—offers enough clarity for enforcement.
As courts weigh motions like Bond’s request to exclude plea materials and Van Dyke’s bid to dismiss based on legal ambiguity, traders, builders, and public officials using event-contract platforms may want to watch how judges define relevance, prejudice, and “fair notice.” The next procedural rulings could signal how far prosecutors can stretch existing statutes—and how tightly defendants can force regulators to justify their classification theories.

The first half of 2026 was the most active six months for crypto exploits on record.
This is according to a new report from Blockaid, which shows hackers stole $1.1 billion across 212 incidents.
Crypto Hacks Top $1.1B in H1 2026
The Blockaid report found that four major incidents involving KelpDAO, Drift, Resolv, and CoW Swap made up roughly $707 million of the total losses.
KelpDAO suffered the largest loss, after hackers stole $292 million worth of crypto by faking a cross-chain message that siphoned off the protocol’s Ethereum reserves. Drift Protocol, a perpetuals exchange built on the Solana chain, also suffered a similarly huge hit, as it was exploited for $285 million within 12 minutes.
Blockaid linked both cases to TraderTraitor, a state-sponsored North Korean subset of the larger Lazarus Group. Humanity Protocol’s $32 million loss was also connected to the same attacker cluster, bringing DPRK-linked losses to $609 million, which is about 55% of all funds stolen during the period.
The pace of attacks also increased through the year, with monthly incidents going from 18 in January to 57 in June. April proved to be the most painful month, as the KelpDAO and Drift Protocol hacks wiped out a combined $577 million to push total losses in that month to $635 million.
Privileged key misuse was the most costly attack type in the first half of 2026, with losses of approximately $790 million, or close to three-quarters of all funds stolen in the period, said Blockaid. Unbacked mint exploits came second in value, led by the $80 million Resolve breach. But the hacks at the code level caused the most casualties, accounting for nearly four out of five attacks by count.
Attack Vectors Change as New Threats Emerge
The report named AI agents as a new target after hackers in May used a prompt injection attack to fool Bankr’s AI agent into approving an unauthorized transaction for about $216,000.
Cross-chain bridges also took a major hit, with attackers breaching the verification systems of KelpDAO and Taiko through forged proofs and attestations accepted by the destination chains.
In addition, security teams faced newer attack methods in 2026, with Blockaid identifying four incidents involving EIP-7702 wallet delegation attacks, where a wallet can hand control to a smart contract. Legacy smart contracts also continue to be a common vulnerability, with data showing around five cases in May and June, including two involving Aztec Connect and one targeting Raydium’s AMM V3.
Recent incidents outside the report period showed the same pressure on crypto infrastructure. For instance, on July 23, AFX Trade, BSquaredNetwork, and Verus were hit in separate attacks on the same day that collectively caused more than $35 million in losses. Recall that Verus had already suffered another exploit about two months earlier, and Blockaid linked both incidents to the same bridge contract and bug class.
Recovery results varied depending on the type of attack. Per the report, code-related incidents sometimes allowed teams to freeze funds or negotiate returns, while attacks involving stolen keys usually ended with the money moving through mixers or cross-chain routes.
The post Crypto Hacks Drain $1.1B in First Half of 2026 Amid 212 Security Incidents appeared first on CryptoPotato.


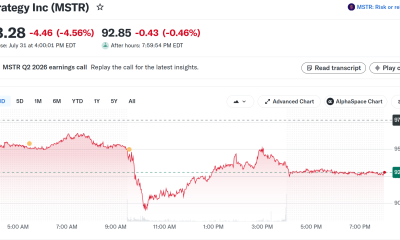
Holders of Strategy’s (MSTR) high-yielding preferred stock STRC will not see a dividend increase in August.
Led by Executive Chairman Michael Saylor, Strategy is maintaining the current 12% dividend on the shares.
STRC investors may have been expecting as much as a 50-basis-point hike in the dividend as Strategy has customarily raised the payout anytime the stock traded sizably below its par value ($100) for the month.
As recently as July 1, Strategy had lifted the dividend 50 basis points following June’s plunge in STRC to as low as $71.
While that hike — along with Strategy’s sale of some bitcoin to fund dividends, and a bit of stabilization in the price of bitcoin — helped STRC bounce in July to the current $89.46, that level is still significantly below par.
CEO Phong Le yesterday said Strategy’s Corporate Objective is for STRC to trade at $99-$100 over time.
Nevertheless, the company is under no obligation to raise the dividend and chose not to do so this month.

A Friday filing in the U.S. District Court for the Southern District of New York (SDNY) seeks to limit what prosecutors can use in the campaign-finance case involving Michelle Bond, the wife of former FTX Digital Markets co-CEO Ryan Salame.
Bond’s attorneys argued that evidence tied to Salame’s 2023 guilty plea—while relevant to his own conduct—should not be admitted against her because it carries a risk of unfair prejudice and, in their view, offers little direct proof of Bond’s knowledge or intent. The motion also asks the court to factor in details from Bond’s contemporaneous divorce and custody proceedings.
Key takeaways
- Michelle Bond wants the court to exclude evidence and “related plea materials” tied to Ryan Salame’s guilty plea, arguing they are not probative of her state of mind.
- Bond’s campaign-finance charges stem from allegations that contributions to her 2022 congressional bid were influenced by FTX-linked activity facilitated by Salame.
- The SDNY motion also requests inclusion of information about Bond’s divorce and custody proceedings, contending she was not an “ordinary” donor.
- Separately, the CFTC ordered former congressman George Santos to pay $35,000 in total—$17,500 in penalty and $17,570 in disgorgement—over trades connected to Kalshi prediction market event contracts.
- A soldier accused of making more than $400,000 on Polymarket event contracts linked to a military operation asked the SDNY court to dismiss charges, citing ambiguity in how “swap” definitions apply to event contracts under the Commodity Exchange Act.
Bond asks SDNY to keep Salame’s guilty plea out of her case
Bond faces campaign finance charges tied to her unsuccessful 2022 congressional run in New York. According to the criminal allegations, contributions to her campaign were partly funded through FTX-related channels that were facilitated by her husband, Ryan Salame.
In the latest SDNY filing, Bond’s legal team asked the court to preclude prosecutors from introducing Salame’s guilty plea and related plea materials. The filing points to the core logic of the request: Bond is not being tried for Salame’s admissions, and the defense claims the government’s use of those materials would not meaningfully establish Bond’s guilt, knowledge, or intent.
Bond’s attorneys argued that Salame’s plea is an admission of his own conduct, not evidence about Bond’s mental state or participation in the charged offense. They said the materials’ probative value is substantially outweighed by the risk of unfair prejudice to Bond.
Prosecutors are expected to weigh heavily on the narrative connecting alleged campaign funding to the conduct of individuals tied to FTX’s collapse. Bond’s motion, however, signals an effort to narrow what jurors are allowed to consider—particularly evidence that may influence them emotionally or circumstantially rather than strictly proving the elements of the charges against her.
Why the defense is raising divorce and custody proceedings
Alongside the evidentiary dispute over Salame’s plea, Bond’s filing also requested that the court include information related to Bond’s divorce and custody proceedings that were underway around the same time as the alleged crime.
Bond’s lawyers’ position is that the circumstances of her family life affect how her campaign-related donor status should be viewed. The filing argues that Bond should not be treated as an ordinary individual donor solely because she is facing personal charges in connection with her political bid, even if she and Salame were not married at the time of the alleged conduct.
Whether and to what extent these family-law details will be admissible is likely to be a key procedural issue. It can shape the tone and framing of the case—especially if the government seeks to portray the campaign finances as closely connected to Salame’s network rather than to Bond’s independent circumstances.
George Santos ordered to pay over Kalshi predictions market trading
In a separate development involving prediction markets, the U.S. Commodity Futures Trading Commission (CFTC) ordered former New York representative George Santos—who was expelled from Congress in 2023—to pay a total of $35,000. The figure breaks down into a $17,500 civil monetary penalty and $17,570 in disgorgement of profits.
The regulator said the action was tied to Santos trading on event contracts on Kalshi connected to whether he would attend the 2026 State of the Union address in Washington, DC. The CFTC stated that Santos made social media posts about his plans to attend or not attend the event and that those posts contained “material misrepresentations and omissions.”
According to the CFTC, after the posts, the contract prices moved in a way that became favorable to Santos’ positions and allowed him to make more than $17,500.
As part of the same order, Santos was barred from trading on prediction market platforms for three years. The order also comes against the backdrop of criminal proceedings: Santos was sentenced to 87 months in prison for wire fraud and aggravated identity theft in 2025, but served only three months before his sentence was commuted by U.S. President Donald Trump, as noted in earlier reporting.
Polymarket insider-trading allegations head toward dismissal arguments
Another SDNY filing, this time from the defense of Gannon Ken Van Dyke, challenges the legal foundation of allegations that he profited from Polymarket event contracts using nonpublic information.
The U.S. Justice Department says Van Dyke was involved in a military operation connected to the removal of Venezuelan President Nicolás Maduro in January, and prosecutors allege he later used insider information to bet whether Maduro would be removed from power—leading to criminal charges announced in April. The defense filing argues Van Dyke is facing accusations involving more than $400,000 in alleged profits from Polymarket event contracts.
Van Dyke’s attorneys filed a 51-page memo supporting a motion to dismiss the indictment based on multiple legal theories. One focus is the Commodity Exchange Act’s treatment of event contracts as “swaps,” which the defense characterizes as ambiguous.
While the CFTC under Chair Michael Selig has asserted that the agency has “exclusive jurisdiction” over prediction markets by treating event contracts as “swaps,” Van Dyke’s lawyers say the uncertainty itself is enough to dismiss at least some charges. In the filing, they argue that if lawmakers, executive agencies, and courts consider the “swap” definition ambiguous, then ordinary citizens cannot reasonably have fair notice that prediction market wagers fall under the CEA.
The case is expected to proceed on a timeline that could lead to trial in late 2026 or early 2027, based on a schedule submitted in June, and Van Dyke has pleaded not guilty to all charges.
The defense’s arguments also extend beyond Van Dyke’s personal exposure. The filing suggests the ruling could matter for lawmakers and government officials who have used prediction markets in connection with political events or public statements. Earlier coverage referenced by the filing indicates that Trump’s teleprompter operator reportedly placed more than $100,000 in bets on Kalshi event contracts tied to presidential speeches, underscoring how prediction markets can draw interest from political circles.
Across these cases, courts are being asked to decide what evidence is fair game, what definitions govern crypto-adjacent instruments, and how much clarity regulators must provide before individuals can be held criminally liable—issues that could determine how future crypto and prediction-market enforcement plays out.

Wife of former FTX executive seeks to preclude her husband’s guilty plea
In a Friday filing with the US District Court for the Southern District of New York (SDNY) over campaign finance charges, Michelle Bond’s legal team asked the court to consider precluding evidence related to former FTX Digital Markets co-CEO Ryan Salame, her husband who is currently serving a 90-month sentence after he pleaded guilty in 2023.
Bond faces campaign finance charges alleging that her unsuccessful 2022 congressional run in New York was partially funded by contributions from FTX facilitated by Salame. As part of the filings this week, Bond asked the court to exclude evidence of her husband’s guilty plea and “related plea materials,” in which the former executive admitted to making “political contributions in [his] name that were funded by transfers from the bank accounts” of an entity tied to FTX.
“The Court should preclude the government from introducing or referring to Mr. Salame’s guilty plea or any related plea materials, because their minimal probative value is substantially outweighed by the risk of unfair prejudice to Ms. Bond,” said the filing.
Bond’s lawyers added:
“[…] Mr. Salame’s plea materials lack any probative value as to Ms. Bond’s guilt, knowledge, or intent. Mr. Salame’s plea is an admission of his own guilt, not evidence of Ms. Bond’s state of mind or participation in any charged offense.”
The motion also requested the court include information related to Bond’s “contemporaneous divorce and custody proceedings,” arguing that though she and Salame were not married at the time of the alleged crime, the former FTX executive was not an “ordinary ‘individual’ donor” contributing to her campaign.
Related: US Senate unanimously adopts resolution opposing clemency for SBF
The criminal case is one of the latest involving individuals tied to the defunct crypto exchange following its 2022 collapse. Salame, former FTX CEO Sam Bankman-Fried and former Alameda Research CEO Caroline Ellison were all sentenced to prison for their role in the misuse of customer funds and related charges.
Former congressman ordered to pay $35,000 over Kalshi bet
George Santos, a former New York House representative who was expelled from Congress in 2023, was ordered to pay a $17,500 civil monetary penalty and $17,570 in disgorgement from profits earned over bets placed on prediction markets platform Kalshi. The order from the US Commodity Futures Trading Commission (CFTC) stemmed from Santos trading on event contracts betting on his appearance at the 2026 State of the Union address in Washington, DC.
“While buying and selling positions in this market, Santos posted on social media about his plans to attend or not attend the SOTU,” said the CFTC. “In his social media posts, Santos made a series of material misrepresentations and omissions about whether he would attend the SOTU. After these posts, the SOTU contract prices moved in a direction that was favorable to Santos’ positions which allowed him to make over $17,500.”
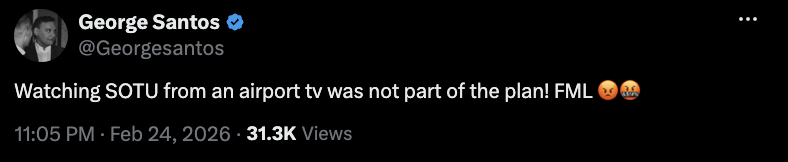
February X post about his State of the Union attendance. Source: George Santos
Santos is barred from trading on prediction market platforms for three years as part of the order. He was also previously sentenced to 87 months in prison for wire fraud and aggravated identity theft in 2025, but served only three months before his sentence was commuted by US President Donald Trump.
US solider accused of making $400,000 Polymarket bet seeks to dismiss charges
Gannon Ken Van Dyke is a US soldier who faces charges for allegedly making more than $400,000 on Polymarket event contracts using nonpublic information tied to a military operation involving the removal of Venezuelan President Nicolás Maduro in January. He was involved in the operation removing Maduro, according to the US Justice Department, and allegedly used insider information to bet whether the Venezuelan president would be removed from power, leading to criminal charges in April.
In a Friday SDNY filing, Van Dyke’s legal team filed a 51-page memo in support of a motion to dismiss the indictment based on different legal theories, including that the Commodity Exchange Act (CEA) at the center of three of the charges was “ambiguous” in treating event contracts as “swaps.”
Although the CFTC under Chair Michael Selig has claimed that the agency has “exclusive jurisdiction” over prediction markets on the basis that event contracts are treated as “swaps,” Van Dyke’s lawyers said the lack of clarity was sufficient to dismiss some of the charges.
“If Congress, executive branch agencies, and courts all find the ‘swap’ definition ambiguous, how can ordinary citizens have fair notice that prediction market wagers are covered by the CEA?” said the filing. “They cannot.”
The case is expected to have significant implications for lawmakers and government officials using prediction markets. Trump’s teleprompter operator reportedly made more than $100,000 using Kalshi event contracts related to the president’s speeches.
Based on a schedule filed in June, Van Dyke is potentially looking at a trial beginning in late 2026 or early 2027. He has pleaded not guilty to all charges.
Magazine: Here’s why the CLARITY Act’s ethics deal may be so hard to reach

DEX spot volume reaches 24% of CEX trading

CANVAS HiFi Names Playback Distribution Its Exclusive U.S. Distributor
drought and heatwaves are creating UK’s climate whiplash


-
 Sports6 days ago
Commonwealth Games boxing: Jadumani Singh seals dominant 5-0 win over Pakistan’s Sumama Rehman to enter quarter-finals | Commonwealth Games News
-

 Business3 days ago
Why Trees Belong on the Risk Register
-

 Fashion2 days ago
Weekend Open Thread: Wit & Wisdom
-

 Tech6 days ago
Intel is reversing course and bringing hyper-threading back to its server chips
-

 Politics1 day ago
Meta enters AI-training agreement with far-right ‘propaganda rag’ Newsmax
-

 Politics6 days ago
Luke Littler dismantles Gerwyn Price to retain title in Blackpool
-
 Crypto World17 hours ago
MicroStrategy Post-Earnings CLARITY Act Push Could Add New Catalyst for Its Stock
-

 Politics5 days ago
The Part of the Electric Transition Nobody Wants to Discuss
-
 Entertainment5 days ago
‘Stargate’ Creator’s New Sci-Fi Series Returns for Season 3 Tomorrow
-

 News Videos6 days ago
BITCOIN JUST ENTERED THIS CRITICAL ZONE…
-

 Business4 days ago
Major shareholder moves on Canyon
-

 Crypto World7 days ago
XRP Ledger adds $2.6B as RWA inflows rank second
-

 Politics7 days ago
Spain sweeps the board at 2026 World Cup with individual awards
-

 News Videos3 days ago
Bitcoin Enters the 3rd Stage of the Bear Market
-
Crypto World1 day ago
XRP Ledger v3.3.0 brings five institutional features
-

 Crypto World4 days ago
Kraken Enables Retail Access to Jersey Mike’s IPO via Tokenized Shares
-

 Tech5 days ago
New macOS Sequoia & Sonoma security updates for older Macs
-

 News Videos4 days ago
Claude: Build Financial Dashboards in Minutes (2026)
-

 Sports2 days ago
Seema Kaliramna Wins Discus Throw Bronze, Takes India’s CWG Medals Tally To 17
-

 Politics3 days ago
Luke Littler’s dominance sparks GOAT debate
You must be logged in to post a comment Login