
Crypto World
3 Altcoins Facing Liquidation Risks in the 2nd Week of February
After three consecutive weeks of sharp declines, buying pressure has returned to the market. However, it remains insufficient to dispel investor skepticism fully. Several altcoins now show unique catalysts that could drive outsized recoveries this week, increasing liquidation risks.
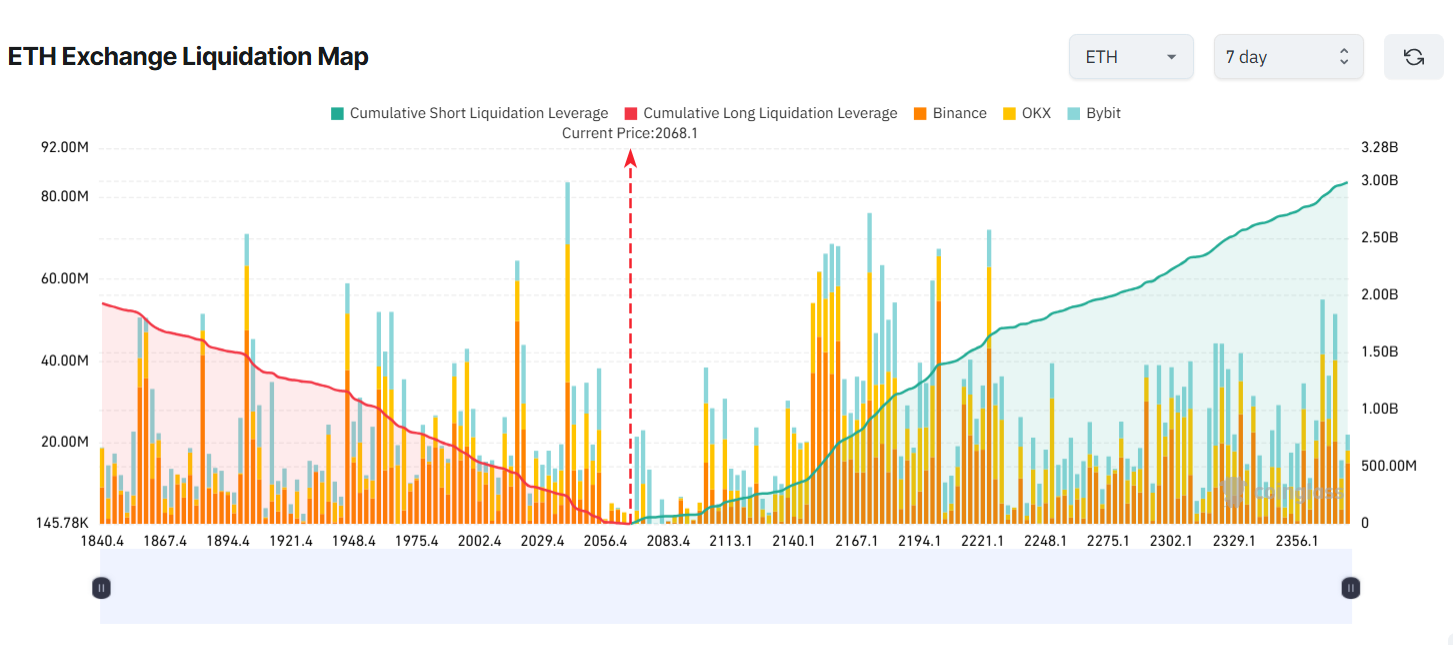
Ethereum (ETH), Dogecoin (DOGE), and Zcash (ZEC) could collectively trigger more than $3.1 billion in liquidations if traders fail to assess the following risks properly.
1. Ethereum (ETH)
ETH’s 7-day liquidation map shows that potential liquidations from short positions outweigh those from long positions.
Sponsored
Sponsored
Many traders appear to expect further downside. ETH has already fallen about 40% since mid-January.

This bearish expectation faces growing risk. On-chain data shows that only around 16 million ETH remain on exchanges. This level marks the lowest since 2024.
Recent sell-offs have accelerated outflows from exchanges. Lower exchange balances reduce available supply. This dynamic can amplify price recoveries through supply–demand imbalances.
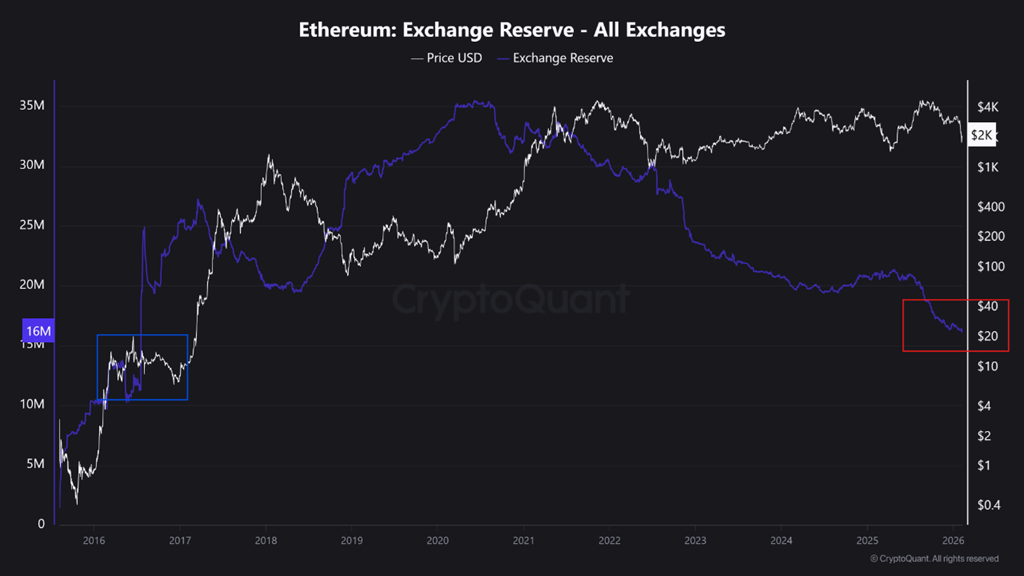
Additionally, more than 4 million ETH also sit in the staking queue. This further constrains the market’s liquid supply.
If ETH’s recovery strengthens due to these factors, short sellers could face significant risk. If ETH rises to $2,370 this week, potential liquidations from short positions could reach $3 billion.
Sponsored
Sponsored
2. Dogecoin (DOGE)
Dogecoin (DOGE) has fallen below $0.10. This level matches its 2024 price low. The 7-day liquidation map shows potential short liquidations of up to $98 million if DOGE rebounds to $0.109 this week.
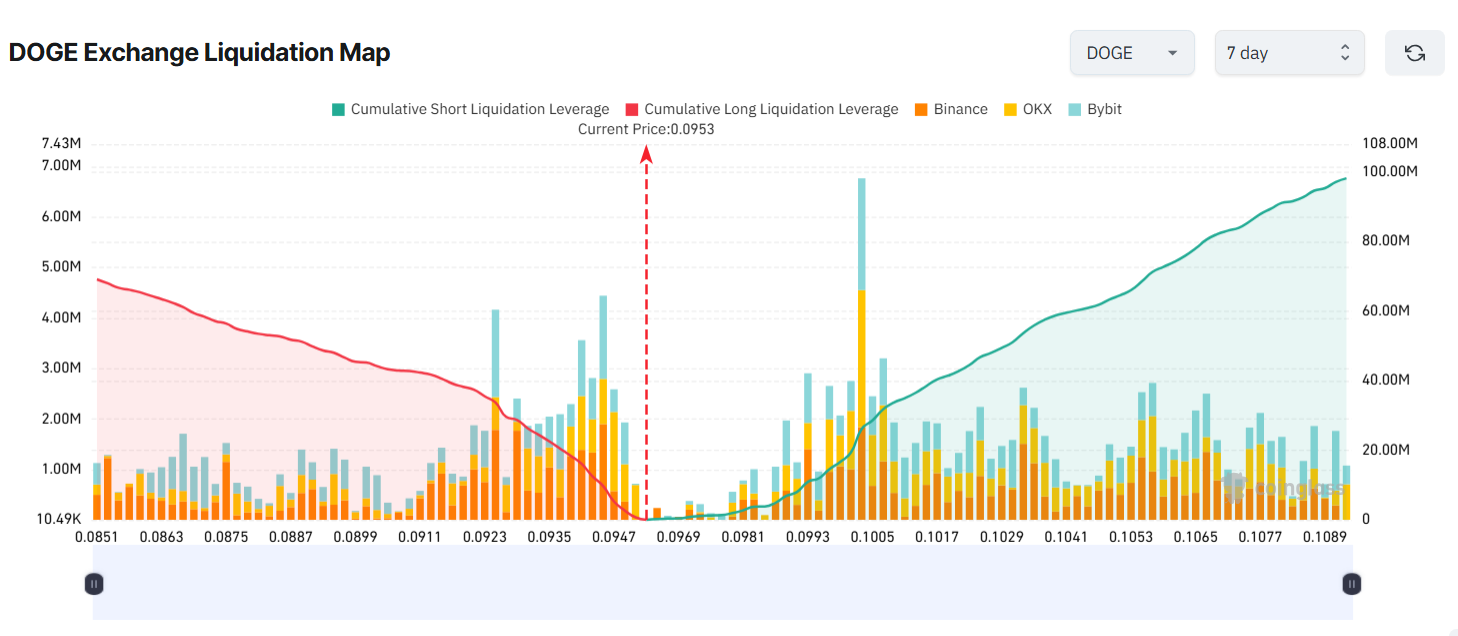
Analysts argue that such a scenario remains plausible given both short- and long-term structures.
In the short term, trader Trader Tardigrade points to a Bull Flag pattern. This setup suggests DOGE could move toward $0.12 this week.
From a longer-term perspective, analyst Javon Marks highlights the formation of Higher Lows (HL) following Higher Highs (HH). This structure signals strength.
Sponsored
Sponsored
“As Higher Lows hold, we could see Dogecoin climb over 640% to and above the current ATH levels at ~$0.73905,” Javon Marks projected.
Discussion around Dogecoin may also regain momentum. In early February, billionaire Elon Musk responded to a question from the Tesla Owners Silicon Valley account regarding Dogecoin.
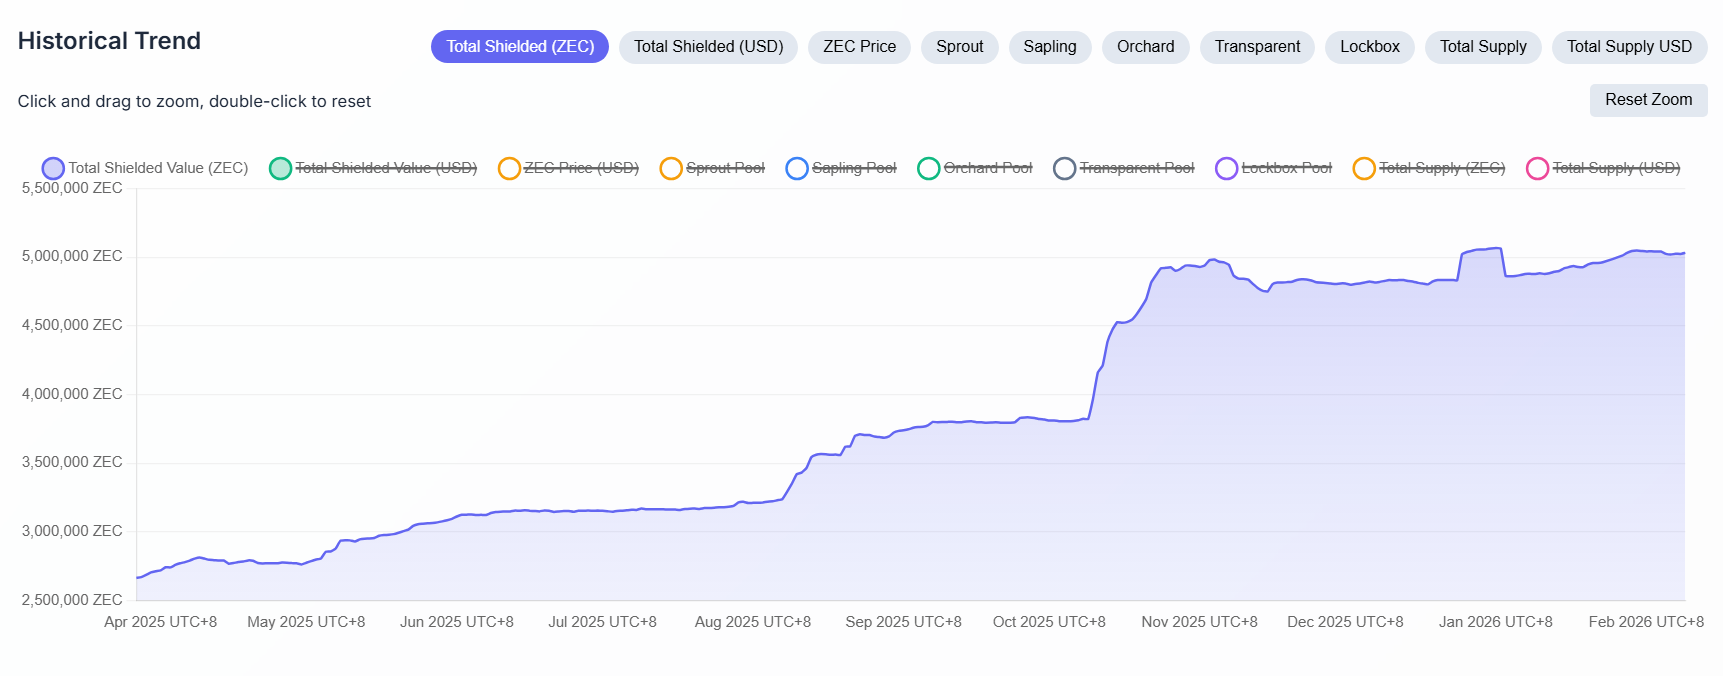
3. Zcash (ZEC)
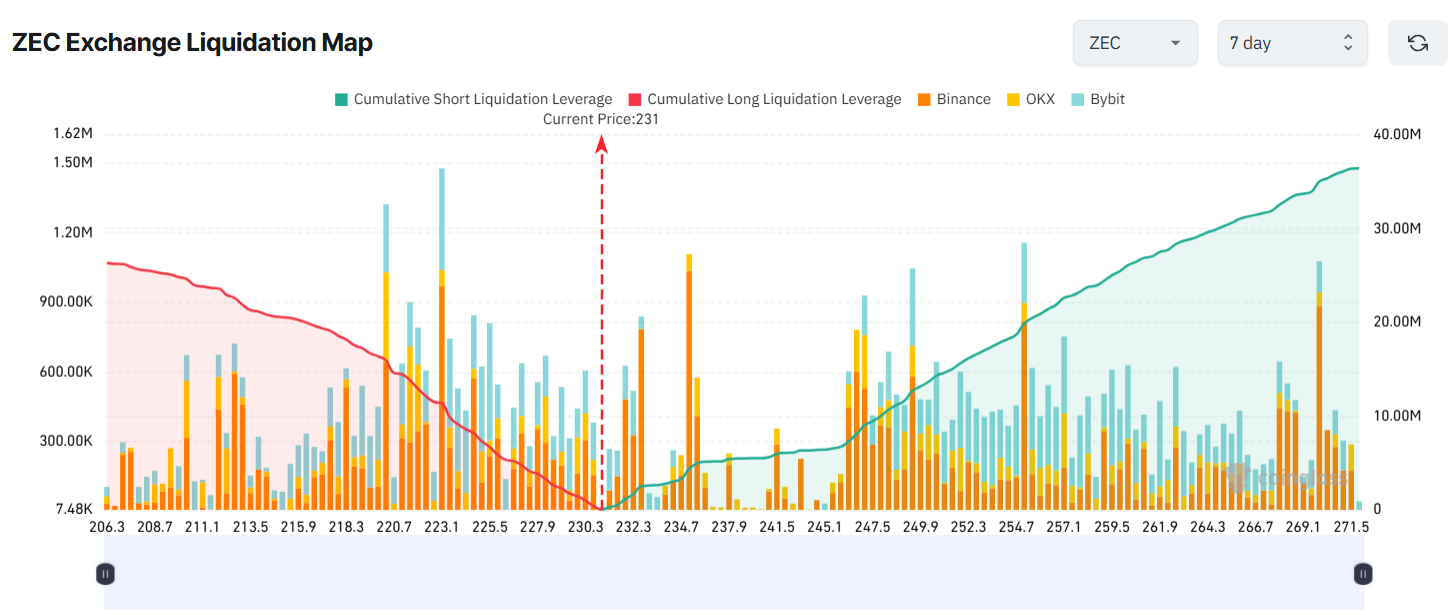
Zcash (ZEC) has dropped about 50% since January 8. The decline followed the announcement that the entire Electric Coin Company (ECC) team, the core developer behind Zcash, would depart. Broader negative market sentiment has further prolonged the downturn.
ZEC’s liquidation map shows that potential liquidations from short positions dominate. This indicates that many traders still expect the downtrend to continue.
Sponsored
Sponsored
Several positive signals have emerged recently. Vitalik Buterin, the founder of Ethereum, publicly donated to Shielded Labs, a development group working on Zcash.
Buterin emphasized that privacy is not optional. He described it as core blockchain infrastructure. This action could help revive positive sentiment toward ZEC.
Data from zkp.baby shows that more than 5 million ZEC remain locked in the Shielded pool, despite the sharp price decline. Negative news and broader selling pressure appear not to have undermined investor confidence in Zcash’s technology.
Overall, the altcoin market has begun to rebound after a period of panic selling. Recent analyses suggest total market capitalization could recover above $2.8 trillion.
This broader recovery, combined with asset-specific catalysts, could push prices well beyond short sellers’ expectations, increasing the likelihood of liquidations.

A crypto governance critique argues that token voting has not fulfilled its decentralized promise, and markets may offer a better coordination mechanism. In a perspective piece, Francesco Mosterts, co-founder of Umia, outlines why the early dream of “on-chain democracy” via token-weighted votes faces fundamental flaws—and how a market-based approach could reshape how on-chain organizations decide what to build and fund.
Mosterts emphasizes that crypto’s strength lies in markets: prices, incentives, and capital flows already coordinate almost every facet of the ecosystem, from token valuations to lending rates and blockspace demand. Yet when governance arrives, the system often abandons markets. He points to ongoing governance frictions across major protocols and a troubling pattern of participation and influence in DAOs. A recent study covering 50 DAOs found a persistent engagement gap: token holders vote inconsistently, and a single large voter can sway about 35% of outcomes, while four voters or fewer can influence two-thirds of decisions. In practice, this means governance power remains highly concentrated even as a decentralization narrative remains loud.
Key takeaways
- Token voting suffers from chronic underparticipation: most token holders abstain, leaving decisions to a small, active minority.
- Whales wield outsized influence, undermining the egalitarian premise of decentralized governance and risking outcomes dominated by a few large holders.
- There is no price signal attached to governance votes, creating misalignment between information, conviction, and action.
- Markets-based governance—where outcomes are priced and funded—could transform governance from expression of opinion into a mechanism of measurable conviction.
The promise and limits of token governance
The original vision of DAOs began with a simple idea: token holders would govern by voting on proposals, thereby aligning ownership with decision rights. The first wave of experiments—DAOs launched in 2016 and beyond—sought to replace centralized management with code-driven governance. Tokens, in theory, would symbolize both ownership and influence, enabling any participant to steer a protocol’s direction by casting a vote.
In practice, however, token voting has struggled to live up to that promise. Three core challenges repeatedly surface: participation, the dominance of whales, and incentive misalignment. Participation remains uneven, as many governance decisions require significant time and effort to review and analyze. The result is governance fatigue, with the majority of token holders remaining passive while a narrow cadre of participants makes the call on key proposals.
Whales compound the problem. Large holders can and do tilt outcomes, demoralizing ordinary voters who feel their input matters less than those with bigger balance sheets. This dynamic starkly contrasts with the ideal of a broad, democratic process where every tokenholder has a meaningful voice.
Then there’s the incentive issue. Governance voting lacks a direct economic signal—votes carry equal weight regardless of a voter’s information, due diligence, or risk tolerance. There is little price for being right or penalty for being wrong, which can encourage speculative or uninformed participation rather than careful, conviction-driven decision-making.
Why pricing decisions could fix governance
The argument pivots on a simple observation: crypto already uses markets to allocate capital, price risk, and signal conviction across a spectrum of activities. If governance can be integrated with pricing mechanisms, it could convert opinions into measurable expectations and align participation with real economic incentives. In other words, decision markets could monetize governance outcomes by letting participants buy and sell bets on proposed directions or policies, thereby revealing collective conviction through market activity.
Advocates of this approach point to several possible benefits. First, decision markets would incentivize participants to research proposals more thoroughly, because their capital at stake would fluctuate with the perceived success of a given outcome. Second, pricing governance outcomes would help surface true preferences and risk assessments, reducing the influence of uninformed voting and opportunistic behavior. Finally, markets could extend beyond mere protocol decisions to broader capital allocation—funding the most promising initiatives with transparent, incentive-aligned mechanisms from inception.
There is a growing sense in the ecosystem that the governance bottleneck—characterized by protracted debates, treasury disputes, and stalled proposals—is a symptom of the misalignment between how decisions are made and how value is created. If crypto wants governance to be a true coordination engine, it may need to borrow from markets more aggressively. Predictions markets, futures-like payoffs on governance outcomes, and futarchy-inspired mechanisms are increasingly revisited as potential pathways to price governance bets and coordinate action around credible forecasts.
What changes when governance is priced, not just voted on
Framing governance as a pricing problem could shift the dynamic from passive endorsement to active, informed risk assessment. By attaching economic signals to decisions, participants would be exposed to the consequences of their bets in real-time, incentivizing careful evaluation of proposals and potential trade-offs. The broader implication is a move from “vote for my preferred outcome” to “trade for the outcome you expect to materialize.”
Beyond improving participation and alignment, decision markets could influence how on-chain organizations allocate resources from day one. Startups and protocols might raise capital with built-in incentive structures for governance that reflect the true costs and benefits of proposed initiatives. In this view, token voting remains valuable for signaling preferences, but it becomes part of a wider system where markets determine which directions receive support and funding, and within what conditions.
As the ecosystem debates these ideas, it’s worth noting that some observers have already flagged governance tensions at prominent protocols. For example, coverage from Cointelegraph highlighted governance disputes around Aave’s exit from a DAO governance framework, underscoring the fragility of current models when high-stakes decisions collide with real-world incentives. The ongoing tug-of-war between governance control and treasury strategy illustrates how far the current approach is from a scalable, market-informed model.
What to watch next as markets reshape on-chain governance
The broader market is watching for experiments that meaningfully integrate pricing into governance. If decision markets can demonstrate durable improvements in decision quality and coordination speed without compromising decentralization, they could become a central feature of the next generation of on-chain organizations. The revival of discussions around futarchy, prediction markets, and other market-based coordination tools points to a phase of crypto where governance becomes less about voting rituals and more about economically rational decision-making under uncertainty.
Still, several questions remain unresolved. How would such markets be designed to prevent manipulation or collusion? What safeguards would ensure that price signals reflect diverse risk tolerances and long-term value creation rather than short-term speculation? And how would regulators treat on-chain decision markets that directly influence capital allocation and product strategy?
What’s clear is that token voting, while historically significant as crypto’s first big governance experiment, is unlikely to be the final answer to decentralized coordination. The next era could see governance complemented, or even superseded, by markets that price outcomes, align incentives, and actively guide what gets built with transparent, market-driven signals.
In the meantime, readers should monitor ongoing debates about how to harmonize decentralization with effective governance, particularly where treasury management, proposal execution, and cross-chain coordination are concerned. The direction crypto takes next—whether sticking with traditional voting or embracing a pricing-based framework—will shape how communities decide and fund the protocols they rely on every day.
Ripple XRP moved closer to full national trust bank status on April 1 as the OCC’s final rule – detailed in Bulletin 2026-4 – took effect, formalizing a regulatory framework that directly enables Ripple’s conditionally approved national trust bank charter to progress toward operational status.
The rule revises chartering regulation to allow national trust banks to conduct non-fiduciary activities alongside fiduciary ones, expanding the scope of what Ripple National Trust Bank can legally offer once pre-opening conditions are satisfied.
XRP traded at $1.3364 on April 1, with technical indicators shifting bullish for the first time in two weeks as the regulatory milestone landed.
The OCC issued this rule after conditionally approving charters for Ripple National Trust Bank, First National Digital Currency Bank, BitGo, Fidelity, and Paxos – a cluster of approvals that signals the agency’s deliberate move to integrate crypto-native and crypto-adjacent institutions into the federally regulated banking system.
That this rule arrives under a Trump-era OCC that has explicitly positioned itself as pro-crypto makes the timing more than procedural: it is structural.
- Rule Scope: OCC Bulletin 2026-4 takes effect April 1, expanding national trust bank authority to include non-fiduciary activities – custody and safekeeping of digital assets now explicitly in scope.
- Ripple’s Position: Ripple National Trust Bank holds conditional OCC approval from December 2025, pending satisfaction of AML, KYC, capital adequacy, and risk control conditions before full operations begin.
- Regulatory Background: XRP was classified as a digital commodity by the SEC and CFTC on March 17, 2026, clearing the legal ambiguity that had shadowed Ripple’s institutional adoption narrative for years.
- XRP Market Impact: XRP price sat at $1.3364 on April 1, with bullish technicals emerging for the first time in two weeks; exchange outflows signal accumulation among holders amid the regulatory catalyst.
- What to Watch: Ripple’s Federal Reserve master account application is the next gating variable – Kraken’s approval sets a precedent, and Ripple’s clearance would give it direct access to Fed payment rails.
Discover: Top Crypto Presales to Watch Before They Launch
What the OCC Final Rule Actually Does – and Why the Terminology Change Matters
The core mechanism of OCC Bulletin 2026-4 is a terminological revision that carries operational weight: the agency replaced the phrase “fiduciary activities” with “operations of a trust company and activities related thereto” in its chartering regulation.
That distinction matters. Under the prior framework, national trust bank charters were more narrowly scoped around fiduciary functions – managing assets on behalf of clients in a representative capacity. The revised language explicitly opens the door to non-fiduciary activities, which includes custody and safekeeping services where the institution holds assets but does not exercise discretionary management over them.
For digital asset firms, that difference is the entire product. Custody – holding client crypto assets under federal oversight without necessarily exercising fiduciary discretion – is the foundational service that institutional clients require before allocating capital through a regulated entity.
The OCC has been explicit that this rule neither expands nor contracts its chartering authority; it clarifies what charter-holders can operationally do. That framing matters because it neutralizes the argument that the OCC is overstepping – the agency is not creating new powers, it is specifying existing ones with enough precision for digital asset custody to fit cleanly within them.
The rule’s April 1 effective date follows a sequence: conditional approvals for Ripple, BitGo, Fidelity, and Paxos came first, and the final rule now establishes the operational framework those approved entities will operate under once their pre-opening conditions are cleared. Ripple’s path to full charter runs through this framework directly.
Ripple XRP Specific Position – From SEC Defendant to Federal Bank Applicant
The speed of Ripple’s regulatory repositioning over the past 18 months is the context that makes April 1 significant: a company that spent years fighting the SEC over whether XRP was an unregistered security received a digital commodity classification on March 17, 2026, and now holds a conditional OCC national trust bank charter – a trajectory that would have been unthinkable in 2023, and that now positions Ripple as one of the most institutionally credible crypto-native entities in the U.S. banking framework.
Ripple National Trust Bank’s conditional approval enables the company to operate as a federally regulated fiduciary, custody client assets under federal oversight, and integrate RLUSD – its stablecoin – and XRP-denominated products within U.S. banking infrastructure.
The remaining conditions – robust risk controls, compliance systems, AML and KYC procedures, and capital adequacy thresholds – must be satisfied before full operations begin. Commentator Xaif noted the rule’s potential to enable federal-level digital asset custody services for Ripple once those restrictions lift, framing it as infrastructure rather than just licensing.
"The digital marketplace is important to the future, and Ripple is the right partner to take us there." — Eddie Gonzalez, President, i-payout — Ripple (@Ripple) March 16, 2026
Ripple Payments helps i-payout deliver real-time payouts into the U.S. & Canada, from days to seconds. 
See how →… pic.twitter.com/WWNmJc9utQ
Ripple has also applied for a Fed master account, which would give it direct access to Federal Reserve payment rails – the same access Kraken recently received approval for.
Analysts tracking XRP’s institutional adoption narrative have flagged the Fed master account as the variable that converts national trust bank status into full-stack banking capability. The Bank Policy Institute, representing JPMorgan, Goldman Sachs, and Citigroup, is reportedly weighing a lawsuit against the OCC over crypto firm charters – a sign that incumbent banks view these approvals as competitive threats, not bureaucratic formalities.
Explore: Best Crypto Projects With High Growth Potential in 2026
The post Ripple XRP Nears National Bank Status as OCC Rule Takes Effect April 1 appeared first on Cryptonews.

TLDR
- Gnosis, Zisk, and the Ethereum Foundation launched the Ethereum Economic Zone at EthCC 2026 in Cannes.
- The framework aims to connect more than 20 Ethereum layer two networks under a unified structure.
- The Ethereum Economic Zone enables synchronous smart contract calls across rollups and the mainnet.
- The system uses ETH as the default gas token and removes separate bridge requirements.
- Early partners include Aave, Centrifuge, and a Swiss-based EEZ Alliance.
The Ethereum Economic Zone launched on March 29 at EthCC in Cannes to address layer-2 fragmentation. Gnosis, Zisk, and the Ethereum Foundation introduced the rollup framework at the Palais des Festivals. The initiative aims to unify liquidity and restore synchronous composability across the Ethereum mainnet and participating rollups.
Ethereum Economic Zone framework targets L2 fragmentation
Gnosis, Zisk, and the Ethereum Foundation presented the Ethereum Economic Zone during EthCC 2026 in Cannes. They introduced a rollup framework that connects multiple layer-2 networks under a shared structure. The project seeks to reduce fragmentation across more than 20 operational Ethereum L2s.
Those networks currently secure about $40 billion in assets but operate as isolated systems. Each L2 maintains separate liquidity pools, deployments, and bridge infrastructure. As a result, users and developers navigate disconnected environments.
Gnosis co-founder Friederike Ernst addressed this issue during the conference. She said, “Ethereum doesn’t have a scaling problem. It has a fragmentation problem.” She added that each new L2 creates another isolated liquidity pool and bridge.
The Ethereum Economic Zone enables smart contracts to perform synchronous calls across rollups and the mainnet. It allows atomic transactions that execute across networks within a single process. The framework also uses ETH as the default gas token.
Developers can remove separate bridge protocols under this structure. The system keeps security anchored to Ethereum’s base chain. Project backers said the design restores composability between rollups.
Zisk developer Jordi Baylina joined Ernst during the presentation. They described the framework as aligned with Ethereum’s scaling roadmap. The collaboration receives co-funding from the Ethereum Foundation.
Zisk CEO Maria Roberts spoke during the event. She said, “The zone will facilitate a new era of blockchain innovation.” She added that developers can integrate existing applications into the framework “pretty easily.”
Conference highlights institutional focus and market data
Early partners include Aave, Centrifuge, and a Swiss-based EEZ Alliance. Organizers confirmed these groups joined at launch. Coverage from The Block and CoinDesk reported their participation.
Ethereum’s shift toward cheaper L2 networks has reduced mainnet fee revenue. ETH trades near $2,000 according to recent market data. The network secures about $53 billion in DeFi total value locked.
Stablecoins on Ethereum account for about $163 billion in value. Market data cited by Phemex outlined these figures. Organizers positioned EEZ as a structural upgrade for capital flow efficiency.
EthCC organizers described 2026 as “the year of professionalisation of Ethereum and the wider crypto ecosystem.”
The conference relocated to Cannes for this edition. The event featured institution-focused forums.
Kaiko launched its Agora forum during the conference. Organizers said the forum targets professional market participants. They highlighted infrastructure and market structure discussions.
Separate reporting referenced Kaiko’s findings on market structure gaps. One report stated that an Alameda trading gap still exists. The conference sessions addressed transparency and liquidity topics.
The Ethereum Economic Zone framework officially went live during EthCC. Project representatives confirmed that onboarding discussions continue with other L2 teams. The launch took place on March 29 at the Palais des Festivals in Cannes.

By Omkar Godbole (All times ET unless indicated otherwise)
As the new quarter gets underway, the crypto market is sending a subtle but important signal: traders seem a bit more cautious about bitcoin than ether (ETH).
You can see this in the options market, where more experienced traders and institutions go to hedge risk or generate extra returns. Think of options as a kind of insurance. Traders can buy protection against price drops (puts) or bet on price increases (calls), depending on their outlook.
Right now, one key metric, called a risk reversal, is negative for both bitcoin and ether across different time frames. In simple terms, that means puts, or downside protection, is more expensive than bullish bets. When traders are willing to pay more for put options, it usually signals lingering fears of a price drop. That’s perfectly normal, considering the brutal downtrend in bitcoin and ether since October.
But here’s where it gets interesting: that caution is stronger for bitcoin. Put options on bitcoin are more expensive than those on ether across all time frames, suggesting traders are more worried about BTC’s downside risk.
The difference becomes even clearer when zooming further out. Longer-dated ether options, such as those expiring next March, are only slightly bearish, while bitcoin’s equivalent options carry a much steeper premium for downside protection.
In short, the market is betting that ether will be relatively resilient. That would signal a bullish trend change in the ether-to-bitcoin ratio, which has been in a downtrend since August (see the technical analysis section).
Ether has risen 5% over the past 24 hours, outpacing bitcoin , XRP (XRP), solana (SOL), and the CoinDesk 20 Index. Several smaller tokens associated with quantum-computing-resistant technology have rallied by 20% or more.
Analysts said a firm breakout in BTC above its 50-day moving average of $68,680 will likely strengthen the bullish momentum.
In traditional markets, the 10-year U.S. Treasury yield fell for the fourth straight day while futures tied to the Nasdaq and S&P 500 rose nearly 0.5%. Together, these things point to risk-on sentiment ahead. Stay alert
Read more: For analysis of today’s activity in altcoins and derivatives, see Crypto Markets Today
What to Watch
For a more comprehensive list of events this week, see CoinDesk’s “Crypto Week Ahead“.
- Crypto
- Macro
- April 1, 8:15 a.m.: U.S. ADP Employment Change for March (Prev. 63K)
- April 1, 10:00 a.m.: U.S. ISM Manufacturing PMI for March (Prev. 52.4)
- Earnings (Estimates based on FactSet data)
Token Events
For a more comprehensive list of events this week, see CoinDesk’s “Crypto Week Ahead“.
- Governance votes & calls
- Unlocks
- Token Launches
- April 1: Orexn (OXN) enters a phased exchange listing period after the token generation event.
Conferences
For a more comprehensive list of events this week, see CoinDesk’s “Crypto Week Ahead“.
Market Movements
- BTC is up 0.61% from 4 p.m. ET Wednesday at $68,622.64 (24hrs: +3.34%)
- ETH is up 1.47% at $2,136.90(24hrs: +5.27%)
- CoinDesk 20 is up 0.62% at 1,968.28 (24hrs: +3.62%)
- Ether CESR Composite Staking Rate is unchanged at 2.76%
- BTC funding rate is at 0.0033% (3.5193% annualized) on Binance

- DXY is down 0.37% at 99.59
- Gold futures are up 1.5% at $4,748.80
- Silver futures are down 0.69% at $74.40
- Nikkei 225 closed up 5.24% at 53,739.68
- Hang Seng closed up 2.04% at 25,294.03
- FTSE is up 1.63% at 10,342.45
- Euro Stoxx 50 is up 1.75% at 5,667.09
- DJIA closed on Tuesday up 2.49% at 46,341.51
- S&P 500 closed up 2.91% at 6,528.52
- Nasdaq Composite closed up 3.83% at 21,590.63
- S&P/TSX Composite closed up 2.61% at 32,768.04
- S&P 40 Latin America closed up 4.26% at 3,623.86
- U.S. 10-Year Treasury rate is down 3.2 bps at 4.279%
- E-mini S&P 500 futures are up 0.33% at 6,592.25
- E-mini Nasdaq-100 futures are up 0.48% at 24,030.25
- E-mini Dow Jones Industrial Average Index futures are up 0.36% at 46,750.00
Bitcoin Stats
- BTC Dominance: 58.72% (-0.04%)
- Ether-bitcoin ratio: 0.03111 (0.89%)
- Hashrate (seven-day moving average): 1,004 EH/s
- Hashprice (spot): $32.37
- Total fees: 2.47 BTC / $166,441
- CME Futures Open Interest: 104,900 BTC
- BTC priced in gold: 14.5 oz.
- BTC vs gold market cap: 4.58%
Technical Analysis

- The chart shows daily swings in the ether-bitcoin ratio in the candlestick format.
- The ratio has been trending lower since August, showcasing ether underperformance relative to bitcoin. This downtrend is represented by the yellow line that connects the steady decline over seven months.
- The outlook would flip bullish if the ratio rises past this trendline. Such a move would confirm renewed investor preference for ether, as suggested by the options market.
Crypto Equities
- Coinbase Global (COIN): closed on Tuesday at $174.61 (+8.60%), +1.80% at $177.75 in pre-market
- Circle Internet (CRCL): closed at $95.41 (+6.12%), +2.69% at $97.98
- Galaxy Digital (GLXY): closed at $18.45 (+7.58%), +1.94% at $18.81
- Bullish (BLSH): closed at $35.73 (+7.39%), +0.95% at $36.07
- MARA Holdings (MARA): closed at $8.16 (+4.62%), +1.35% at $8.27
- Riot Platforms (RIOT): closed at $12.36 (+4.48%), +2.35% at $12.65
- Core Scientific (CORZ): closed at $14.96 (+7.55%), -0.40% at $14.90
- CleanSpark (CLSK): closed at $8.51 (+4.03%), +2.12% at $8.69
- CoinShares Valkyrie Bitcoin Miners ETF (WGMI): closed at $34.82 (+7.70%), +1.81% at $35.45
- Exodus Movement (EXOD): closed at $6.50 (+4.84%), -0.92% at $6.44
Crypto Treasury Companies
- Strategy (MSTR): closed at $124.80 (+2.77%), +1.48% at $126.65
- Strive (ASST): closed at $10.02 (+6.94%), +1.90% at $10.21
- SharpLink Gaming (SBET): closed at $6.45 (+7.32%), +2.02% at $6.58
- Upexi (UPXI): closed at $0.99 (+3.90%), +6.49% at $1.05
- Lite Strategy (LITS): closed at $1.16 (+11.54%)
ETF Flows
Spot BTC ETFs
- Daily net flow: $117.5 million
- Cumulative net flows: $56.09 billion
- Total BTC holdings ~ 1.29 million
Spot ETH ETFs
- Daily net flow: $31.2 million
- Cumulative net flows: $11.59 billion
- Total ETH holdings ~ 5.70 million
Source: Farside Investors
While You Were Sleeping
Trump says Iran war could end in ‘two weeks’, with or without deal (euronews): Trump, who will address the nation Wednesday night, said the war in Iran could end in two to three weeks. However, Israeli Prime Minister Benjamin Netanyahu said its war on Tehran will continue.
Iran fires missiles across Middle East as Trump signals exit (Bloomberg): Iran fired missiles across the Middle East while Israel and the U.S. kept up their bombardment of the Islamic Republic, even as Trump fueled market optimism by signaling he’s preparing to end the war.
UAE wants to force Hormuz open and is willing to join the fight (The Wall Street Journal): The UAE is preparing to help the U.S. and other allies open the Strait of Hormuz by force, Arab officials said, a move that would make it the first Persian Gulf country to join the war.
Crypto asset manager CoinShares to list on Nasdaq after $1.2 billion SPAC deal (CoinDesk): CoinShares, a leading European digital asset manager with over $6 billion under management, is set to begin trading on the Nasdaq Stock Market under the ticker symbol CSHR.


Summary
- EthCC 2026 in Cannes has introduced a dedicated institutional forum, The Agora by Kaiko, drawing more than 60 speakers and around 600 participants from traditional finance and Web3.
- For the first time, firms like Bloomberg, S&P Global, BNP Paribas, Euroclear, Amundi, SG Forge and Tradeweb are on the official EthCC agenda to debate Ethereum’s market structure under Europe’s MiCA regime.
- With MiCA and new EU tax rules nearing full implementation, panellists argued that Ethereum’s future liquidity and depth will increasingly depend on institutional rails rather than purely on retail-driven DeFi.
EthCC 2026 has shifted decisively from a builders’ retreat to an institutional showcase, as this year’s edition in Cannes hosts the inaugural “Agora” forum curated by market data provider Kaiko for more than 60 expert speakers and roughly 600 TradFi and crypto-market professionals.
Held on March 31 at the JW Marriott and branded as a neutral stage “where the foundations of digital market structure will be examined,” the event is explicitly designed for executives from banks, asset managers, trading venues and blockchain projects to interrogate how far crypto and digital assets can underpin the next generation of financial infrastructure.
If previous EthCC editions were best known for governance wars and protocol roadmaps, Cannes has brought bankers directly into the developers’ line of sight. Reporting from French outlet CrypCool notes that “Jean‑Marc Stenger, PDG de SG Forge,” alongside Aave founder Stani Kulechov and representatives from Euroclear, Bloomberg, BNP Paribas, S&P Global, Amundi, Google and Tradeweb, are now part of the official program, with Euroclear’s Isabelle Delorme cited as evidence that “l’institution est désormais dans la salle.” A separate analysis from TechFlow captures the mood shift more bluntly: “What was new was the formal participation of traditional financial institutions… on EthCC’s official agenda for the first time,” the publication writes, arguing that developers and market-structure professionals are finally sharing the same stage rather than operating in parallel tracks.
The core of the Agora’s agenda is not token launches but plumbing. According to Kaiko’s event materials, discussion tracks span tokenization of financial instruments, perpetual futures and ETPs, collateral mobility, and the convergence between centralized and decentralized venues. As one invitation post from Kaiko’s Hadrien Comte on LinkedIn put it, the goal is “a day of conversation focusing on tokenization, market infrastructure transformation, capital efficiency in institutional crypto, and next-generation digital asset investment strategies” rather than marketing pitches.
Underpinning those debates is Europe’s maturing regulatory environment. Commentaries from TechFlow, ODaily and Moomoo all highlight a “regulatory puzzle” coalescing around the EU’s Markets in Crypto‑Assets Regulation (MiCA), which is expected to be fully implemented by mid‑2026 and will cover trading platforms, stablecoin issuers and institutional participants. Combined with new EU‑wide and national tax-reporting frameworks for digital assets, that clarity offers the legal scaffolding banks and asset managers say they need before committing more balance sheet to Ethereum-based products.
For Ethereum (ETH) itself, the message from Cannes is that future liquidity may rely as much on regulated rails as on organic DeFi flows. CrypCool argues that the involvement of SG Forge, Euroclear and Tradeweb in Ethereum debates “valide une thèse: la convergence TradFi/DeFi est un chantier opérationnel,” adding that for ETH holders “la profondeur institutionnelle du marché se construit en partie ici.” That view is echoed in a Phemex dispatch, which describes EthCC 2026 as marking “un changement significatif dans l’écosystème Ethereum, avec la participation… d’institutions financières traditionnelles” and the launch of The Agora as a forum dedicated to aligning digital assets with traditional capital markets.
In short, EthCC’s centre of gravity has moved. The same conference that once incubated “governance meme” experiments now features Bloomberg terminals, Euroclear settlement specialists and bank capital-markets teams arguing over how Ethereum’s blockspace, rollups and collateral models fit into their risk frameworks. Whether that ultimately leads to deeper, more stable liquidity for ETH or dilutes the ecosystem’s grassroots ethos is a debate that will likely continue long after the lights go down in Cannes.

Key takeaways
-
Meta plans to introduce dollar-linked stablecoin payments across its platforms in late 2026. Unlike its earlier Libra attempt, the company will not issue its own cryptocurrency but instead integrate existing stablecoins.
-
Regulatory opposition to the Libra/Diem project made it clear that governments were uncomfortable with Big Tech issuing private global currencies. Meta’s new strategy reflects those lessons by avoiding direct control over the currency itself.
-
Instead of managing stablecoin reserves or issuance, Meta intends to work with external partners that handle infrastructure, compliance and settlement, while Meta itself focuses on user experience and payment distribution.
-
With billions of users across Facebook, Instagram and WhatsApp, Meta can embed stablecoin payments into everyday social and commercial interactions, potentially creating one of the largest digital payment ecosystems.
Meta is re-entering the stablecoin market with a revised strategy. Following the regulatory challenges that ended its previous Libra project, the company plans to introduce dollar-linked digital payments across its social media platforms in late 2026.
Rather than developing its own cryptocurrency, Meta is now opting to facilitate third-party stablecoins on its apps. This approach indicates a shift in focus. Instead of managing the currency itself, the company aims to leverage its massive user base to control how and where these transactions occur.
This article explores why Meta’s 2026 stablecoin strategy relies on partnerships rather than issuing its own currency. It examines how regulatory lessons from Libra, new stablecoin rules and Meta’s vast platform distribution are shaping a model focused on payment integration rather than monetary control.
The enduring lesson of Libra
To understand why Meta is being cautious with digital payments today, you need to look at its earlier attempt.
In June 2019, Meta, then Facebook, announced Libra, an ambitious plan to create a global digital currency linked to a basket of traditional currencies. The idea was to enable fast, low-cost payments across Facebook, WhatsApp and Instagram and to build a new cross-border payment system used by billions of people.
However, regulators quickly pushed back.
Governments in the US, Europe and other regions raised several concerns. They worried that a prominent private company launching a currency could weaken national monetary control and create risks to financial stability. There were also concerns about inadequate safeguards against money laundering and illicit finance. Meta’s past controversies over data privacy, including the Cambridge Analytica scandal, further deepened distrust.

The idea that a social media company with billions of users could launch something resembling a private global currency alarmed policymakers. Under strong political pressure, several partners left the project. Libra was later renamed Diem, but the project eventually shut down in 2022.
The episode made it clear that regulators would not accept Big Tech issuing its own currency. Meta’s current strategy reflects that lesson. Instead of creating a new coin, it now plans to integrate existing regulated stablecoins from partners and act mainly as a payments platform.
An alternative stablecoin approach for 2026
Meta is renewing its efforts in stablecoins, this time by integrating stablecoin payments directly into its platforms without issuing its own coin.
The company has issued requests for proposals (RFPs) to external partners capable of handling the back-end stablecoin infrastructure. Meta’s role would center on crafting a seamless user payment experience within its apps rather than managing the currency itself.
This could involve introducing a built-in digital wallet feature, allowing users to send and receive stablecoin payments throughout Meta’s ecosystem, which includes Facebook, Instagram and WhatsApp.
The planned rollout targets the second half of 2026.
This strategy marks a significant shift from the earlier Libra/Diem model. Instead of attempting to launch a new global monetary system, Meta is now positioning itself as a major distribution and user interface layer for established, regulated stablecoins like USDC (USDC) or USDt (USDT), potentially through partners such as Stripe.
Did you know? The term “stablecoin” was first widely used around 2014 and 2015, as crypto developers experimented with tokens designed to maintain stable value against fiat currencies, long before large tech platforms began exploring their payment potential.
Why partners may matter more than owning the power
At first glance, Meta’s decision to outsource stablecoin infrastructure could seem like a step back from control. It may actually amplify the company’s strengths.
Meta holds a wide distribution reach. With billions of active users across Facebook, Instagram and WhatsApp, it operates one of the planet’s largest communication and social networks. Seamlessly embedding stablecoin payments into these everyday apps could rapidly establish one of the world’s biggest digital payment ecosystems. It enables Meta to reach its objective without the need to issue a coin itself.
In this setup, real value shifts away from minting the currency and toward directing how and where it moves. Stablecoin issuers handle reserves, backing and regulatory compliance, while infrastructure providers manage settlement and back-end rails. What Meta brings to the table is the intuitive user interface, the social context and the daily transaction flow.
The Stripe angle
Stripe has become a front-runner for partnership in Meta’s revived stablecoin push. It has aggressively built its stablecoin capabilities, taking steps such as its acquisition of Bridge, a specialized crypto infrastructure firm that powers custody, transfers and blockchain-based payments at scale.
The ties between Meta and Stripe run deep. Stripe co-founder and CEO Patrick Collison joined Meta’s board of directors in April 2025, fueling speculation about closer strategic alignment between the two companies.

If Stripe, through Bridge, becomes the primary back-end partner, Meta gains instant access to a mature, regulated payments stack. This would help Meta bypass the heavy lift of building compliant infrastructure from the ground up. Stripe would own the complex financial pipeline, including settlement, compliance and reserves. Meta, on the other hand, would focus on delivering a frictionless, engaging user experience across its massive social ecosystem.
Regulatory changes have reshaped the industry
The evolution of the regulatory environment is a key reason Meta is choosing partners over power in its 2026 stablecoin push.
In 2025, the US passed the GENIUS Act (Guiding and Establishing National Innovation for U.S. Stablecoins Act). This law created a clear federal framework for payment stablecoins. It established strict requirements for 1:1 reserves with high-quality liquid assets. Other compliance requirements include issuer licensing and oversight, risk management, transparency through monthly reserve disclosures and consumer protections.
While the GENIUS Act brings much-needed clarity and promotes innovation in regulated stablecoins, it also imposes certain restrictions. Only permitted issuers, typically regulated banks, their subsidiaries or qualified nonbank entities, can legally issue payment stablecoins in the US.
This environment favors established, heavily regulated financial institutions and infrastructure providers over large consumer tech companies. By choosing to partner with compliant stablecoin issuers and infrastructure providers instead of issuing its own coin, Meta sidesteps regulatory burdens, compliance costs and intense scrutiny.
Did you know? The original Facebook payments system launched in 2009, allowing users to purchase virtual goods in games. It was one of Meta’s earliest experiments in building a payments ecosystem inside social platforms.
Stablecoins as the foundation for AI-driven commerce
Meta’s renewed focus on stablecoins also ties into a larger shift in technology. The company is making major investments in artificial intelligence (AI), with projections for 2026 indicating a capital expenditure (CapEx) range of $115 billion to $135 billion. A significant portion of this spending supports the development of autonomous digital agents. These are AI systems that can independently handle tasks such as shopping, booking services and executing payments on behalf of users.
In this scenario, stablecoins could serve as an ideal global settlement layer. These digital dollars offer instant, programmable, borderless transactions that machines can execute reliably and efficiently.
For Meta, embedding stablecoin payments could unlock several practical use cases, including:
-
Fast, low-cost cross-border payouts to creators worldwide
-
Seamless transactions in international marketplaces
-
Automated purchases and payments initiated by AI agents
-
Easier financial access and payments in emerging markets where traditional banking remains limited
In this context, stablecoins move beyond speculative crypto tools. They become essential infrastructure for machine-to-machine and AI-powered commerce.
Did you know? Stablecoins are widely used for international remittances and cross-border payments, particularly in regions where traditional bank transfers are slow or expensive.
The wider competition among platforms
Meta is not the only company exploring stablecoin payments.
Across the technology industry, major platforms are actively looking for ways to bring digital currencies into their ecosystems. The main goal is no longer to create and issue new coins. Instead, the focus is on controlling the payment systems built on top of existing stablecoins.
Shopify, for instance, facilitates payments in USDC on Base at checkout through partnerships with Coinbase and Stripe. PayPal’s PYUSD is designed for payments on PayPal and for transfers between PayPal, Venmo and external wallets or exchanges.
The reasoning is straightforward. When a platform enables and processes transactions, it gains valuable insight into users’ economic behavior. This information allows the company to develop new products and services tied to payments.
Stablecoins provide a practical solution. They enable programmable, instant and borderless payments without depending completely on traditional banks. For companies with hundreds of millions or billions of users worldwide, this represents a very large opportunity.
Risks remain significant
Even with a partnership-based approach, Meta’s stablecoin plan still faces certain risks.
-
Regulatory constraints: Regulatory attention on large technology companies continues to be strong, particularly when they enter financial services. Governments could introduce new rules or limits on how platforms offer or integrate digital payments.
-
Operational challenges: These include the risk of fraud, the need for strong wallet security, the high costs of regulatory compliance and the complexity of handling customer disputes at a very large scale.
-
User reluctance: Finally, the entire effort depends on whether users actually choose to use it. If the sign-up process feels too difficult, or if rules add too much extra friction, many people may simply stick with familiar payment methods such as cards or bank transfers.
Meta’s task will be to meet all regulatory requirements while keeping the experience simple and easy for users.
Cointelegraph maintains full editorial independence. Guides are produced without influence from advertisers, partners or commercial relationships. Content published in Guides does not constitute financial, legal or investment advice. Readers should conduct their own research and consult qualified professionals where appropriate.
Crypto World
Jack Dorsey says AI should replace the middle manager after Block (XYZ) cuts 4,000 jobs


In Jack Dorsey’s view of the world, the job most at risk from the AI revolution is the middle manager.
Dorsey argues in a new essay, “From Hierarchy to Intelligence,” published with Roelof Botha, Sequoia Capital’s managing partner, an investor in Block, that his company’s decision to cut approximately 4,000 of its more than 10,000 employees was not a cost reduction but a permanent restructuring to replace middle managers with AI.
Corporate hierarchy, the essay argues, has always existed to solve one problem: routing information through organizations too large for any single person to oversee.
Managers aggregate context from below, act as messengers from above, and maintain alignment across teams. AI can now perform those functions continuously and at scale, the authors argue, making the messenger redundant.
In place of management layers, Dorsey and Botha proposes two AI-driven “world models.”
One aggregates internal data from code, decisions, workflows, and performance metrics to create a continuously updated picture of company operations, replacing the context that managers traditionally carried.
The other maps customer and merchant behavior using transaction data from Cash App and Square.
Those models feed what Block calls an “intelligence layer” that composes financial products dynamically to fit market demand.
If done properly, the models absorb the coordination work that previously justified the existence of middle management.
Rather than building from fixed roadmaps, the essay proposes breaking Block’s business into modular capabilities, including payments, lending, card issuance and payroll.
When the system identifies a need, the essay’s example is a merchant facing a seasonal cash flow gap, it assembles a solution from existing capabilities. When it cannot, the missing capability defines what gets built next, replacing the product roadmap with a system-generated backlog.
The organizational structure is reduced accordingly. Block plans to operate with three roles: individual contributors who build the system, directly responsible individuals who own specific outcomes on 90-day cycles, and player-coaches who remain hands-on while developing people.
Dorsey told Wired in early Marchthe restructuring was triggered by a capability shift he observed in December in tools including Anthropic’s Opus 4.6 and OpenAI’s Codex 5.3, which he said was now capable of operating effectively in large codebases.
But current and former Block employees told the Guardian that roughly 95% of AI-generated code changes still require human modification, and that AI tools cannot yet lead in regulated areas like banking and money transfers.
Welcome to our institutional newsletter, Crypto Long & Short. This week:
- Nilmini Rubin on the challenge facing crypto and traditional markets to create a hybrid, shared governance structure.
- Meredith Fitzpatrick covers how financial institutions must fundamentally rethink AML risk as crypto and TradFi converge.
- Top headlines institutions should pay attention to by Francisco Rodrigues.
- Maple loans surge past $1 billion in Chart of the Week.
Expert Insights
Governance is the real Layer 1
By Nilmini Rubin, chief policy officer, Hedera
When Silicon Valley Bank collapsed in 2023, USDC briefly lost its dollar peg after billions in reserves were trapped in the bank. The impact spread quickly, stalling markets, repricing assets mid-transaction and triggering a broader confidence shock. While regulators stress-test traditional markets, this event exposed a new risk where failures in traditional finance can directly impact digital assets.
This episode raised fundamental questions about what happens if risk moves in the other direction, from crypto to the traditional market: who intervenes, who absorbs losses and how is confidence in markets restored?
As blockchains begin underpinning financial markets, the next phase of digital assets will be defined not only by innovation but by coordinated accountability. That accountability is shaped by how networks are designed.
The false binary
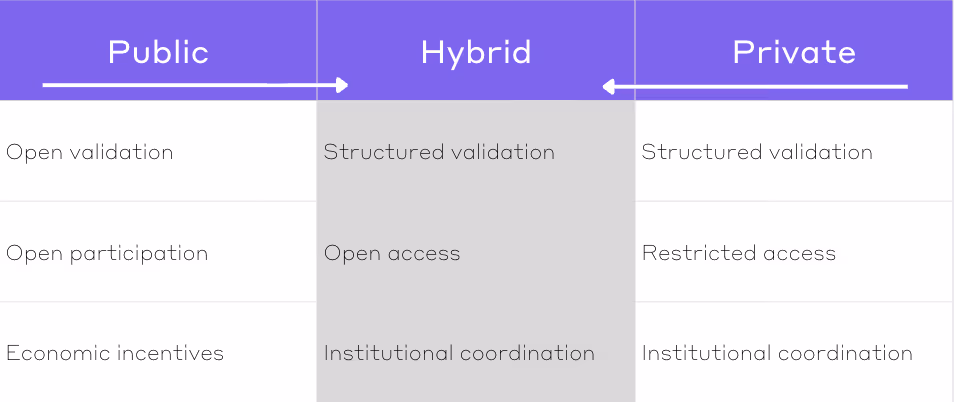
For years, blockchain debates revolved around a familiar divide: public vs. private networks.
Permissionless networks maximize openness and censorship resistance, but can struggle with coordinated upgrades, regulatory integration or emergency intervention. Private systems emphasize control and compliance over neutrality and interoperability.
As institutional adoption accelerates, hybrid models are emerging as the preferred solution.
Hybrid architectures combine public verifiability with open participation and predictable governance. This renders them more suitable for regulated use cases and compliance frameworks that require greater transparency and clear roles. Coordinated accountability, rather than simply public or private choices, is blockchain’s next major challenge.

Blockchain architecture is increasingly converging toward hybrid governance models.
When governance meets crisis
In complex systems, responsibilities are usually defined before problems emerge. Participants know who has authority, who absorbs losses and how emergencies are handled.
Blockchain networks should begin with that level of clarity. When stress arrives through sanctions enforcement, protocol failures or market crashes, effective governance proves a difficult test.
The industry has already seen early signals. During the March 2020 market crash, MakerDAO required emergency intervention after auction failures erased millions in value. The protocol recovered, but we cannot allow these incidents to occur frequently and at scale. In other cases, networks have used coordinated forks to address hacks or illicit activity, but only after the fact.
As tokenization expands, increasing resilience will require governance systems that anticipate crises and define decision-making before an event occurs to effectively mitigate.
Putting governance to the test
Mature financial systems routinely stress-test their governance structures to ensure resilience well before moments of disruption.
Hybrid networks must bring that discipline on-chain. Governance stress testing clarifies roles, aligns incentives and strengthens coordination under pressure, helping the industry prepare for scenarios such as stablecoin volatility, regulatory shifts and AI-driven governance dynamics.
Governance is the real Layer 1
Digital assets are reimagining ownership and participation. The next challenge is applying that same creativity to governance.
The networks that endure will not be the ones with the most tokens or the fastest throughput. They will be the ones that know how to govern effectively when the system comes under pressure.
Headlines of the Week
– By Francisco Rodrigues
The crypto industry has continued navigating the regulatory system over the week, making its way into the mortgage market while also seemingly being stopped from offering yields on stablecoin balances. Other major developments further build trust in the industry, even as prices drop.
Expert Perspectives
The new financial order: updating TradFi risk for crypto
– By Meredith Fitzpatrick, partner and head of cryptocurrency, Forensic Risk Alliance
The convergence of traditional finance and cryptocurrency is no longer theoretical sci-fi — it’s here. Regulatory clarity across major jurisdictions is accelerating institutional entry into digital assets, from Europe’s Markets in Crypto-Assets (MiCA) framework to expanding U.S. legislative momentum with the Guiding and Establishing National Innovation for U.S. Stablecoins (GENIUS) Act. For financial institutions, the question is no longer whether to engage with crypto, but how to do so safely.
The critical misstep many institutions make is treating crypto as an extension of existing products. It is not. Crypto fundamentally changes how anti-money laundering (AML) risk must be assessed, monitored and controlled.
At its core, blockchain introduces three defining characteristics: immutability, pseudonymity and borderless value transfer. These reshape both financial crime risk and the tools required to manage it.
Control shifts from accounts to keys
In traditional finance, assets are secured through centralized systems and reversible transactions. In crypto, control rests with private keys. When institutions offer custody, AML risk becomes inseparable from cybersecurity risk. A compromised key is not just a breach — it is an irreversible transfer of value, often beyond recovery. This requires controls such as multi-signature authorization, cold storage, strict access governance and wallet segregation — all of which sit outside traditional AML frameworks but are critical to risk mitigation.
Non-custodial wallets mean dynamic risk assessments
Traditional AML relies heavily on customer identity and static risk profiling. In crypto, this model breaks down. Customers can transact through non-custodial wallets that exist outside institutional onboarding frameworks, and illicit activity often hides in transaction behavior rather than identity.
As a result, risk assessment must evolve from “who the customer is” to “what the wallet does.” This requires continuous monitoring of on-chain activity, including exposure to high-risk counterparties, mixers and decentralized protocols. Risk becomes dynamic, not periodic.
Crypto financial crime is structurally more complex
Cryptocurrency money laundering can involve newer technologies, such as chain-hopping and the use of privacy-enhancing technologies like mixers, that have no direct parallel in traditional finance. Transactions can traverse multiple jurisdictions in minutes, rendering legacy screening systems insufficient. Effective AML now depends on blockchain intelligence: the ability to trace funds, identify direct and indirect exposure to risky parties and interpret transaction patterns across networks.
These shifts require a corresponding evolution in governance and risk management. Boards and risk committees must redefine risk appetite to reflect crypto-specific exposures. Institutions should introduce specialized teams (e.g., digital asset approval committees and high-risk customer panels) to manage rapidly changing risks.
Most importantly, the Enterprise-Wide Risk Assessment (EWRA) must become dynamic. Static, point-in-time assessments are inadequate in an environment where risk profiles can change with a single transaction.
The table below illustrates how customer risk assessment must evolve:
Area of focus |
TradFi |
Crypto |
|---|---|---|
| Customer identity | Typically, through identification and verification using government-issued IDs, physical addresses and relevant databases (e.g., credit history). | Most centralized virtual asset service providers (VASPs) have KYC/CDD/EDD procedures like TradFi institutions. However, “non-custodial wallets” (wallets where the user retains private key control) exist outside of a centralized body that collects KYC. In this case, on-chain activity may be used when assessing the risk of the customer. |
| Risk indicators | Based on factors like employment, income, geography and transaction history with the institution. | Based on wallet behaviour, age, transaction counterparties, interactions with high-risk services (e.g., mixers), and exposure to certain smart contracts, non-custodial wallets, or DeFi platforms. |
| Transaction transparency | Transaction data is private and accessed through internal banking records. | On-chain transactions are publicly available, enabling advanced analytics, but only for those with the tools and expertise to interpret them. |
| Dynamic risk monitoring | Risk profiles are usually static or periodically updated. | Risk can change dynamically with wallet activity, based on real-time blockchain analysis and ongoing monitoring. |
Finally, institutions must invest in new capabilities. Fluency in blockchain analytics for transaction monitoring and forensic investigation are no longer niche skills — they are core AML functions. Most organizations will require a hybrid model combining internal expertise with external specialists.
Professionals in this space must recognize that cryptocurrency compliance is not merely adapting existing frameworks but requires fundamentally different approaches to transaction monitoring, due diligence and incident investigation. Success requires compliance teams to understand traditional regulatory requirements and crypto-specific investigation challenges. Institutions approaching crypto adoption with appropriate forensic rigour — treating it as a fundamental compliance transformation rather than simple product addition — will be best positioned for sustainable success.
Chart of the Week
Maple loans surge past $1B on record $350M single-day issuance
Maple’s loans outstanding jumped back above $1 billion last week as the protocol issued $350 million in loans on a single day. With total AuM now exceeding $4.6 billion, there is a divergence between the protocol’s strong fundamentals and the associated SYRUP token price action. This growth, in spite of broader market conditions, continues to highlight the resilient demand for institutional-grade lending among crypto-native firms.

Listen. Read. Watch. Engage.
Looking for more? Receive the latest crypto news from coindesk.com and market updates from coindesk.com/institutions.
Note: The views expressed in this column are those of the author and do not necessarily reflect those of CoinDesk, Inc., CoinDesk Indices or its owners and affiliates.


- StakeStone price jumped from $0.11 to above $0.26, going vertical amid a spike in daily volume.
- The sharp gain follows a whale accumulating over 25.5 million STO tokens.
- STO price could see a steep pullback amid profit-taking deals.
StakeStone (STO) price exploded during early trading on April 1, pumping more than 130% to hit a new all‑time high.
The vertical action, which occurred amid a broader consolidation across the crypto market, saw STO’s intraday trading activity surge.
The token is in price discovery, but can the lofty levels hold?
Why StakeStone jumped 136% today
STO token posted a sharp intraday surge on Wednesday, significantly outperforming the broader altcoin market.
While most cryptocurrencies traded near key support levels, STO jumped from around $0.11 to a new all-time high above $0.26.
The move marked a gain of roughly 136% and made it the top performer among the 500 largest cryptocurrencies by market capitalisation.
The rally appears to have been driven by a large transaction linked to a newly created wallet.
Data from Lookonchain shows the wallet withdrew more than 25.5 million STO tokens, valued at over $4.85 million, from Binance.
The holdings represent approximately 11.32% of StakeStone’s circulating supply, suggesting concentrated accumulation that may have contributed to the sharp price movement.
The price of $STO surged from $0.11 to $0.26 today, a 136% increase.
A newly created wallet(0x5e2E) withdrew 25.5M $STO($4.85M) from #Binance in the past 20 hours, 11.32% of the circulating supply.https://t.co/UhTfZhT8CS pic.twitter.com/GAI5Y2L8LE
— Lookonchain (@lookonchain) April 1, 2026
The transfer acted as an immediate and powerful demand shock, with the size of the order absorbing available sell liquidity near the market price.
It forced quotes higher as market makers and sellers adjusted to the sudden imbalance between bids and offers.
With limited resting supply at higher levels, the price moved rapidly upward as each successive fill occurred at incrementally higher prices.
Data from CoinMarketCap shows a 560% increase in intraday volume, with over $190 million traded in the past 24 hours.
StakeStone’s market cap was also sharply up, as STO printed a new all-time high.
Prices hovered around $0.25 at the time of writing, up more than 390% since the all-time low of $0.049 on February 6, 2026.
STO price outlook — is a sharp decline next?
From a technical perspective, STO’s chart now reflects a near‑vertical candle following the 136% single‑day move.
Price currently hovers well above recent consolidation zones and historical trading ranges.
Such abrupt expansions in price and volume often leave the token looking temporarily extended.
In the market, this type of structure frequently precedes volatile retracements as the market digests the move and short‑term participants reassess risk and reward.

Given the magnitude and speed of the rally, a period of profit‑taking and a potential steep pullback cannot be ruled out.
A rapid unwind of intraday positions could see STO test lower levels, with $0.19 key.
If selling intensifies, the next major support zone could be $0.15-$0.11.
However, the reduced circulating supply could help support prices and allow for an extended, though volatile, ride to new highs.
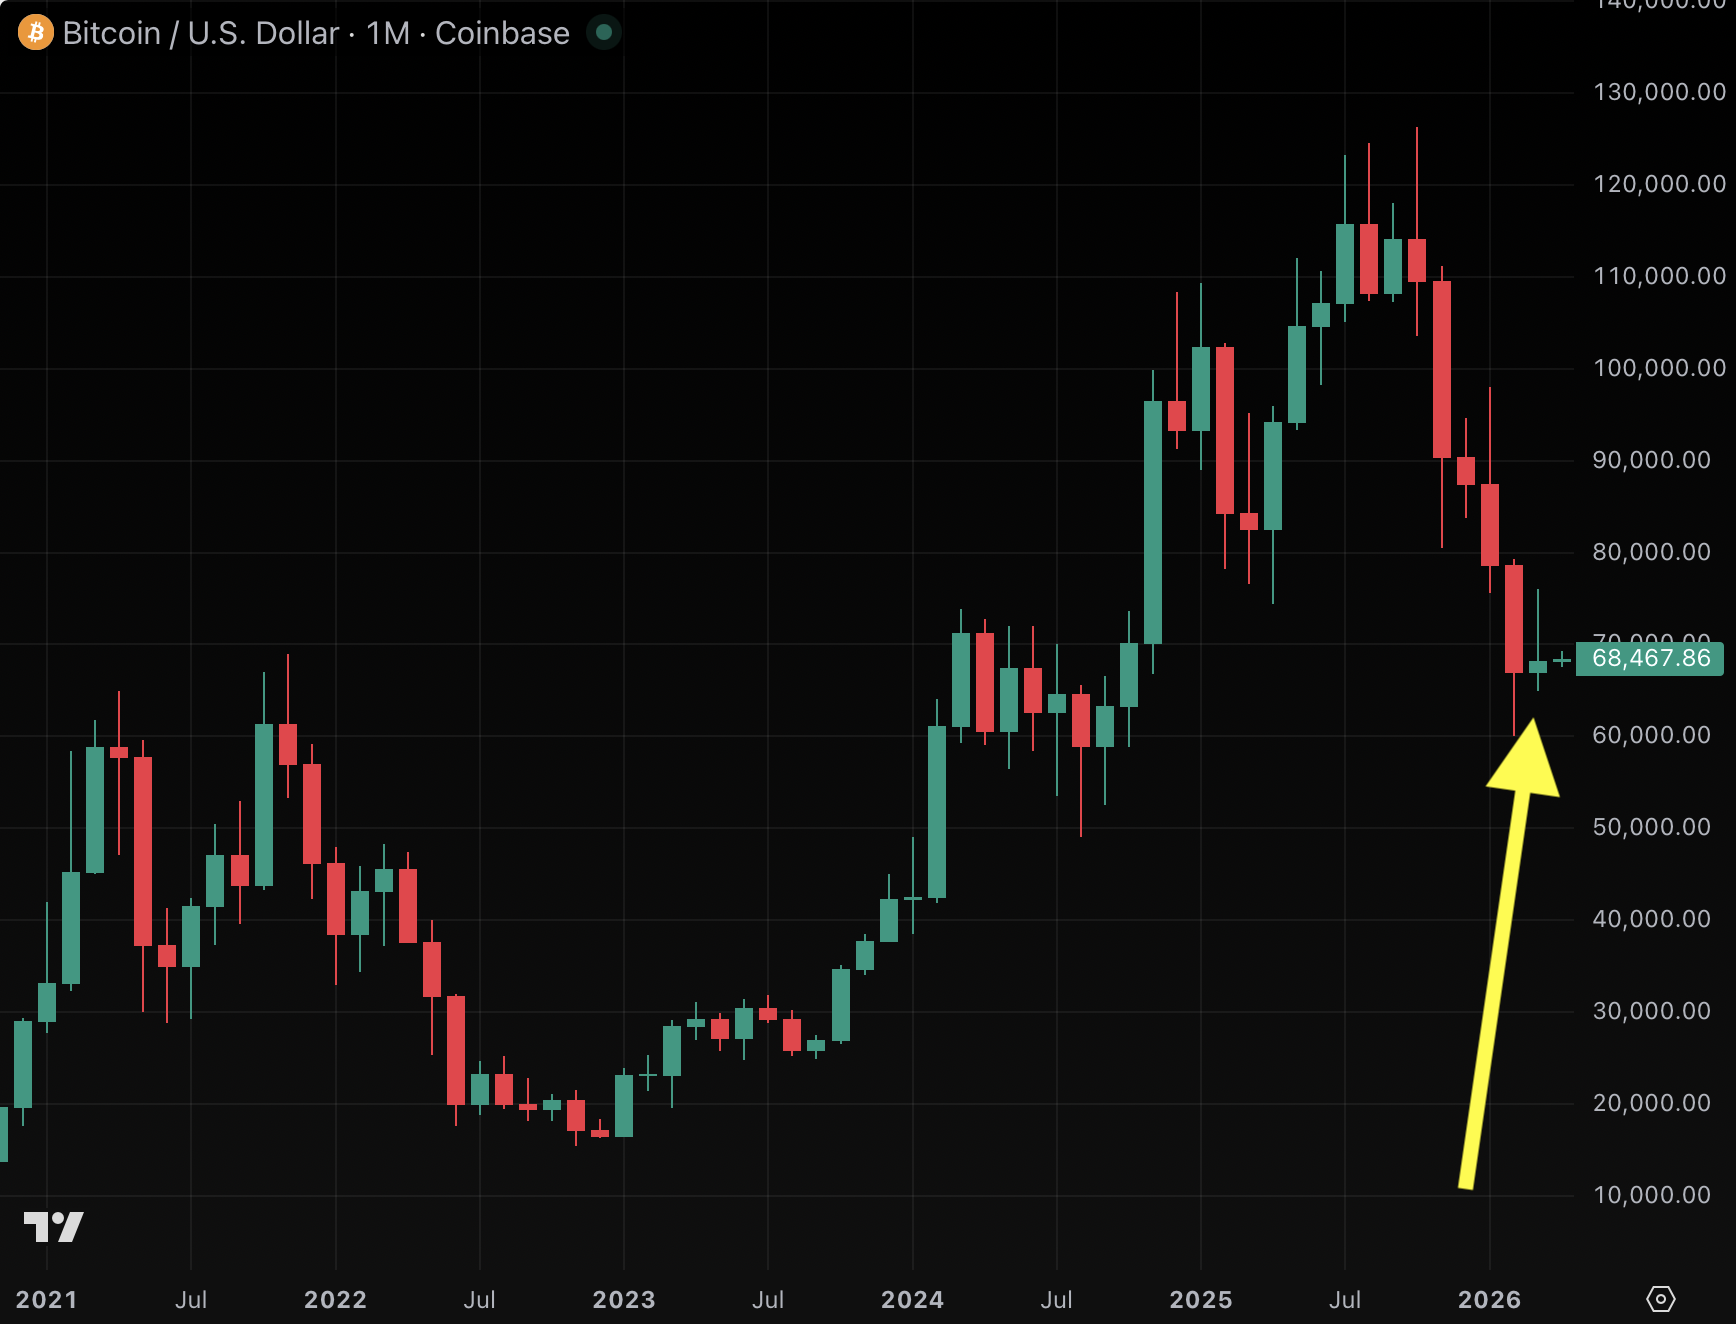
Bitcoin (BTC) finally closed a month with positive price performance for the first time since September, but it only snapped its five-month losing streak by the slimmest of margins.
BTC opened the month at $67,000 and closed at $68,221. In other words, the entire “gain” amounted to about $1,200 per coin, or 1.8%.
For context, BTC often fluctuates by that amount within a few minutes on an average day.
Energized by even the most pitiful shred of evidence that the crypto bear market might be ending, the BTC community celebrated the momentum shift.
The Fear and Greed Index hit an all-time low of five out of 100 on February 6, 2026. It’s now much higher, if you squint a bit less, at 31.

One less bad month for BTC
The streak that preceded March’s flicker of positivity was genuinely ugly.
BTC was worth more than $126,000 on October 6, 2025. By February 6, it had collapsed to $60,000.
Recent monthly losses have been relentless. Total crypto market capitalization fell by $200 billion in October, $610 billion in November, $110 billion in December, $300 billion in January, and $350 billion in February.
March paused that decimation with a $40 billion gain, the slimmest of margins.
Still, at least it’s not as bad as its absolute worst moment this year.
BTC is 14% higher than its $59,930 low set on February 6. It’s even rallied a bit since the onset of a typically bearish war and macro environment.
Read more: Bitcoin outperforms gold as Iran war shakes ‘safe-haven’ trade
The reaction on social media revealed just how desperate BTC traders had become for any glimmer of hope.
Bitcoin Magazine announced the green close with a breathless all-caps alert, as if BTC hadn’t just spent half a year losing nearly half its value.
One popular account called it a “massive dose of hopium” before adding, perhaps wisely, “Let’s hope this is not an April Fools’ joke.”
Read more: What is @inversebrah?
The longest continuous monthly bear streak prior to this stretch was a six-month long red streak from August 2018 through January 2019.
BTC is today priced at $68,300, 46% below its October high and 23% lower year to date.
Got a tip? Send us an email securely via Protos Leaks. For more informed news, follow us on X, Bluesky, and Google News, or subscribe to our YouTube channel.

Vintage Textures for Spring – Julia Berolzheimer

5 Things I REFUSE to Spend Money on in 2026 #money #finance #wealth #tyler

New riverside restaurant The Cumberland opens in York


-

 News Videos7 days ago
Parliament publishes latest register of MPs’ financial interests
-

 Business6 days ago
Instagram, YouTube Found Responsible for Teen’s Mental Health Struggle in Historic Ruling
-
 Tech6 days ago
Intercom’s new post-trained Fin Apex 1.0 beats GPT-5.4 and Claude Sonnet 4.6 at customer service resolutions
-

 NewsBeat5 days ago
The Story hosts event on Durham’s historic registers
-

 Sports5 days ago
Sweet Sixteen Game Thread: Tide vs Michigan
-
Entertainment2 days ago
Fans slam 'heartbreaking' Barbie Dream Fest convention debacle with 'cardboard cutout' experience
-
 Entertainment4 days ago
Lana Del Rey Celebrates Her Husband’s 51st Birthday In New Post
-
Crypto World1 day ago
Dems press CFTC, ethics board on prediction-market insider trades
-

 Sports1 day ago
Tallest college basketball player ever, standing at 7-foot-9, entering transfer portal
-

 Tech3 days ago
The Pixel 10a doesn’t have a camera bump, and it’s great
-

 Entertainment7 days ago
HBO’s Harry Potter Series Will Definitely Fail For One Big Reason, And It’s Not J.K. Rowling Or Snape
-

 Crypto World2 days ago
U.S. rule change may open trillions in 401(k) funds to crypto
-

 Tech1 day ago
How to back up your iPhone & iPad to your Mac before something goes wrong
-

 Fashion6 days ago
En Vogue in Brown Leather and Tailored Neutrals by Atelier Savoir, Styled by J Bolin
-

 Politics2 days ago
Should Trump Be Scared Strait?
-

 Tech1 day ago
EE TV is using AI to help you find something to watch
-

 Fashion6 days ago
What Are Your Favorite T-Shirts for the Weekend?
-

 Fashion5 days ago
Weekly News Update, 3.27.26 – Corporette.com
-

 Tech2 days ago
Flipsnack and the shift toward motion-first business content with living visuals
-

 Fashion4 days ago
Amazon Sundays: Soft Spring Layers
You must be logged in to post a comment Login