
Crypto World
30% Risk Despite Tom Lee’s Theory
BMNR stock price remains under pressure in early February as selling continues across crypto-linked equities. The stock is down nearly 25% over five days and more than 33% over one month, trading around $22.35.
While management defended recent crypto-led paper losses as part of a long-term strategy, market data suggests technical weakness is still driving investor behavior. And increasingly driving them away, despite a novel defense from BitMine Chairman, Tom Lee.
Ethereum Treasury Losses Spark ‘Feature, Not A Bug’ Defense
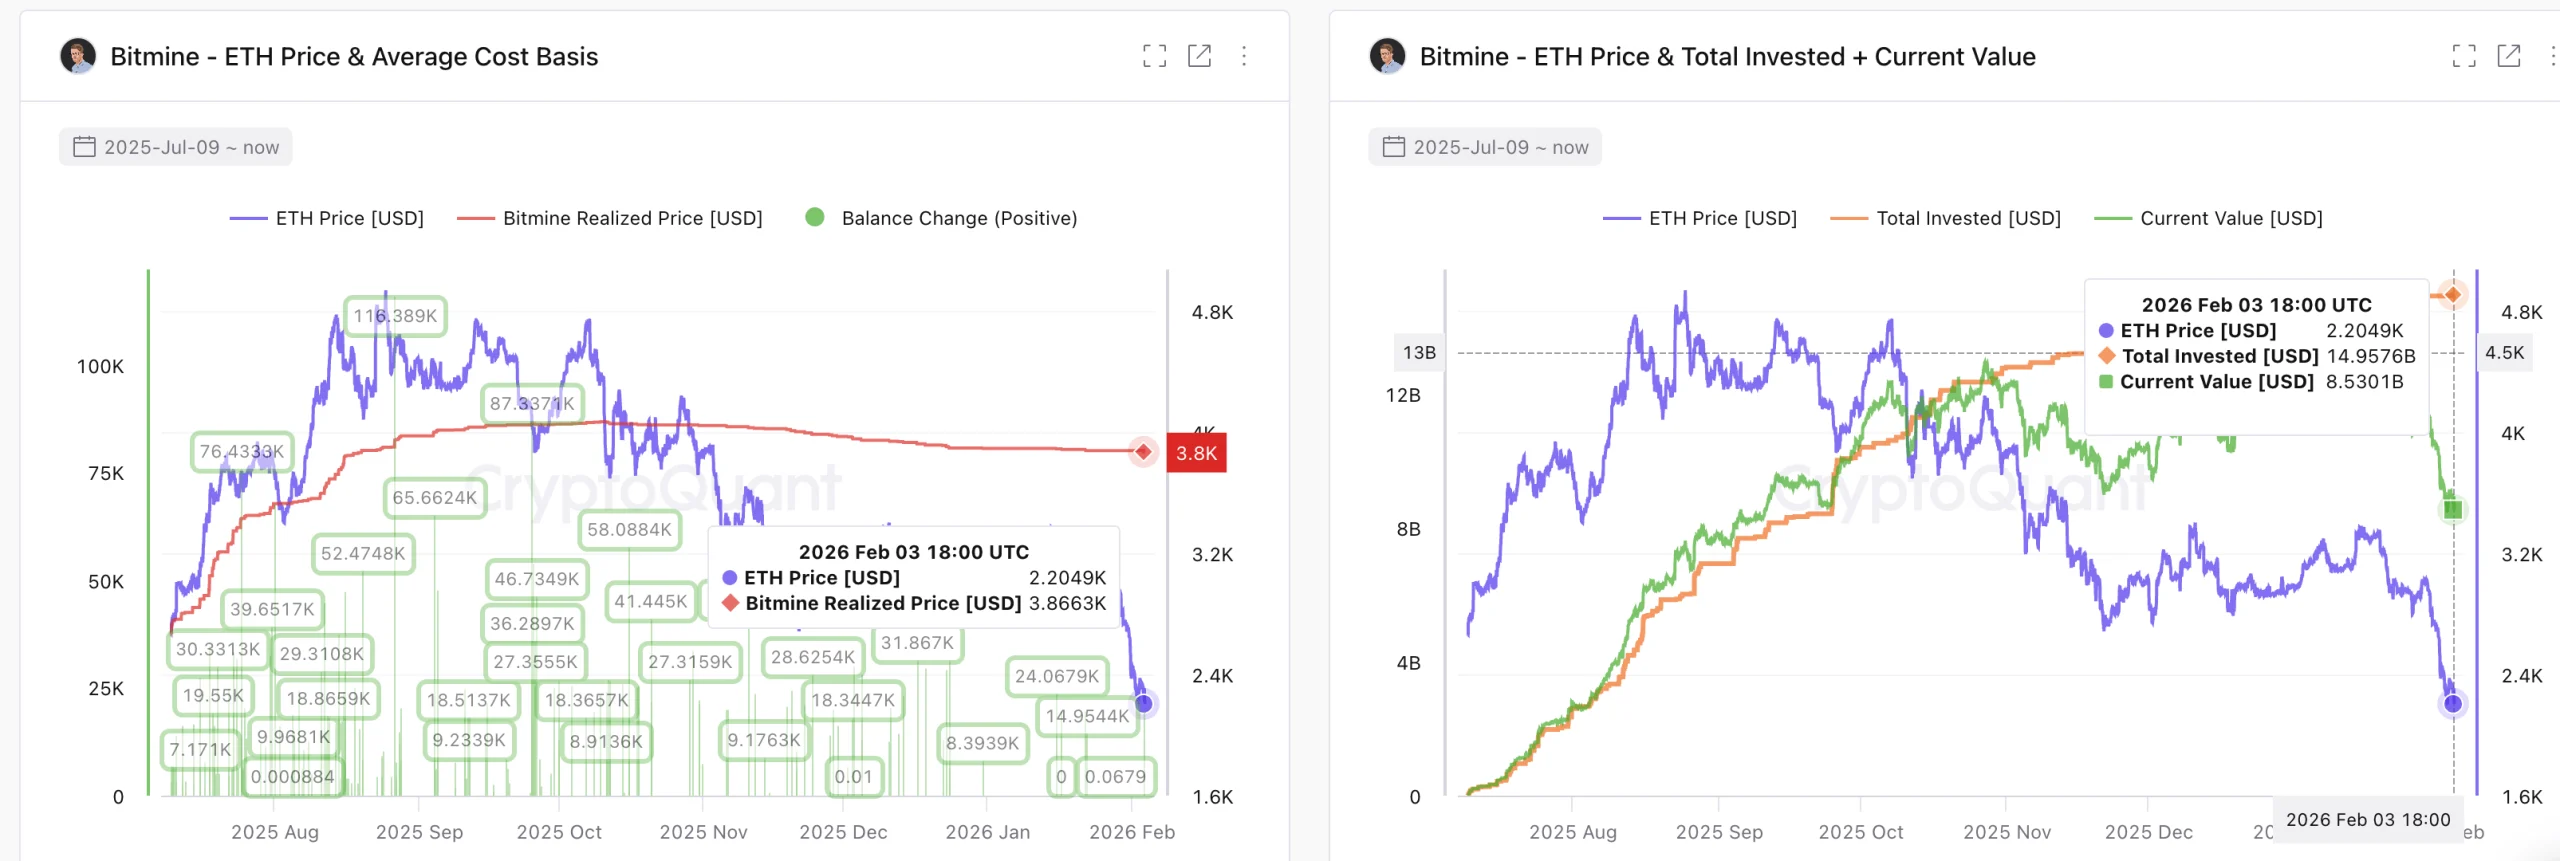
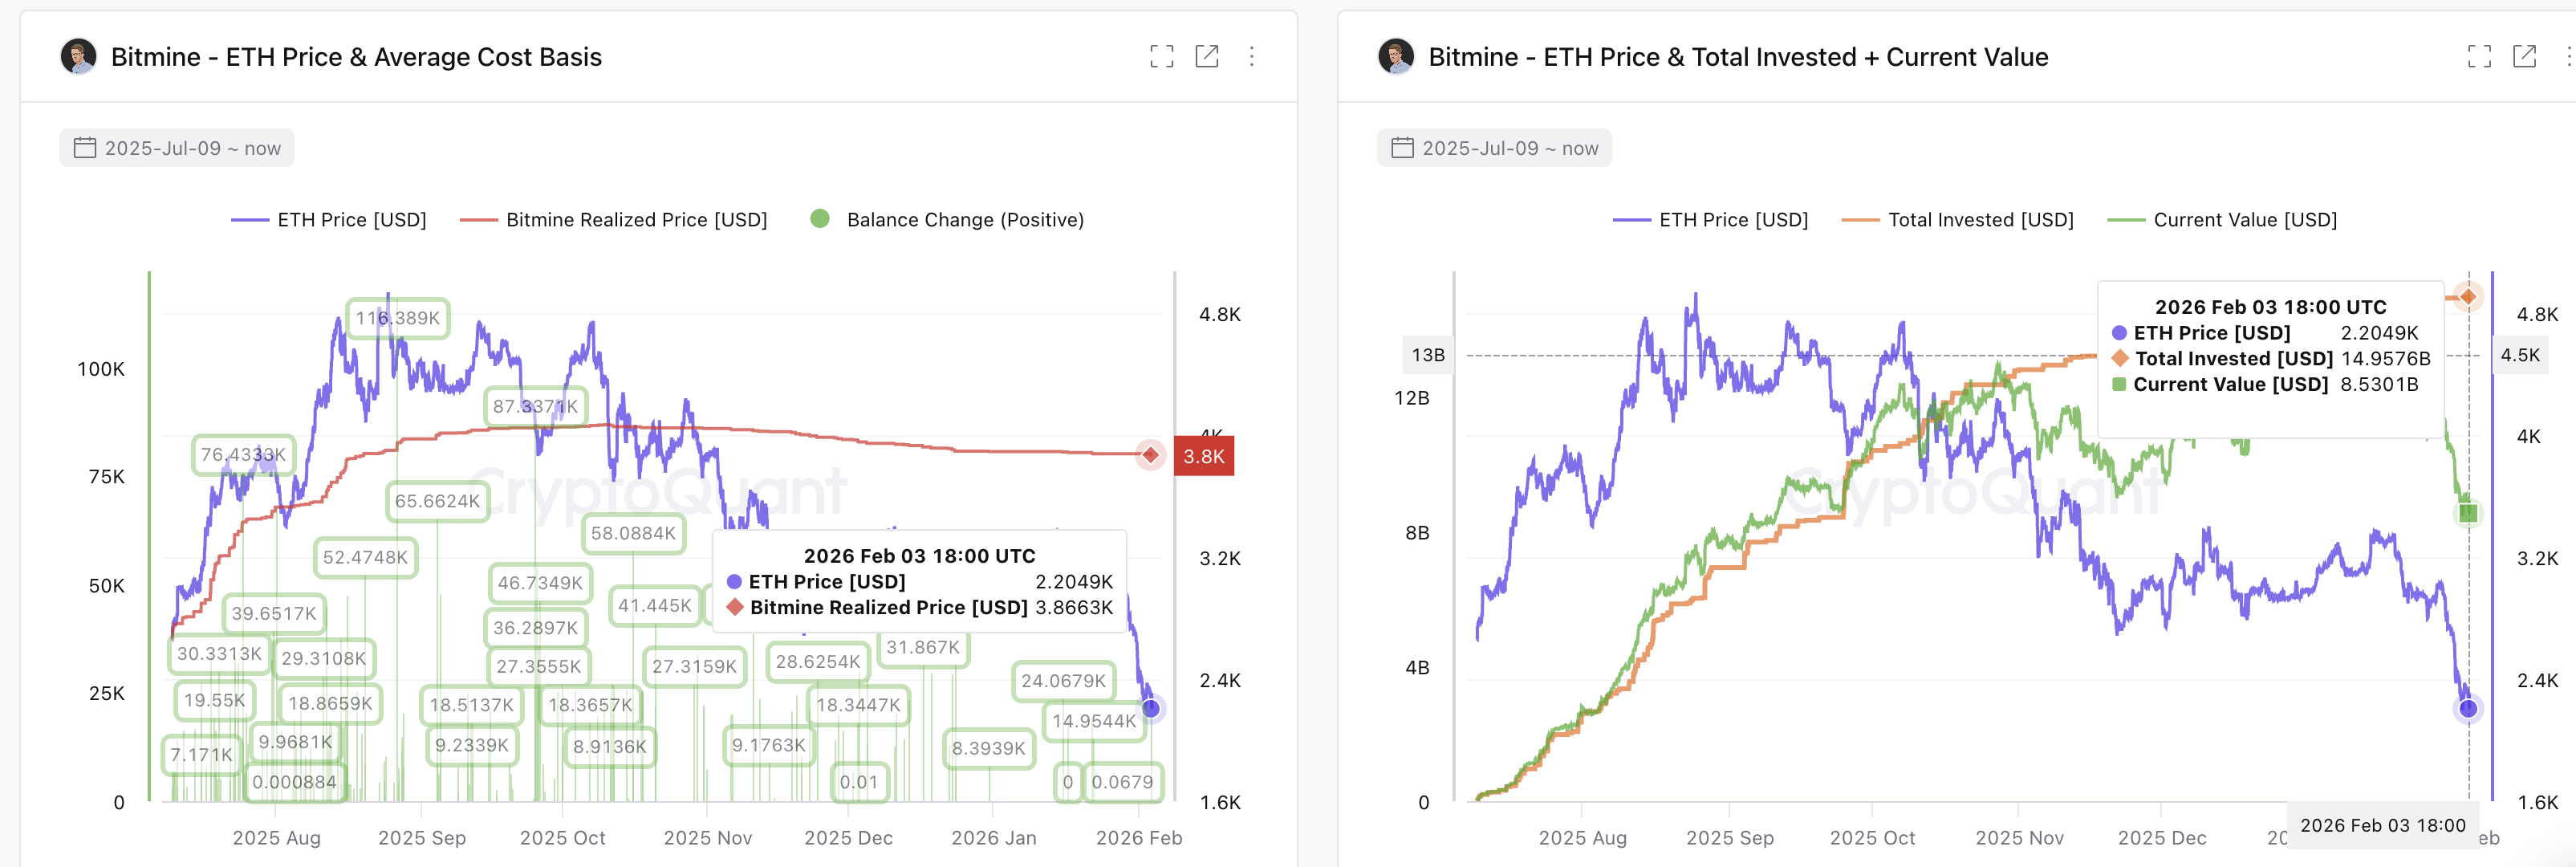
Concerns around BitMine’s balance sheet intensified after data showed heavy unrealized losses on its Ethereum treasury.
Sponsored
Sponsored
As of February 3, BitMine had invested roughly $14.95 billion into ETH holdings. However, the current market value had fallen to around $8.53 billion, implying paper losses of more than $6.4 billion.
At the same time, Ethereum was trading near $2,200, well below BitMine’s average acquisition cost of roughly $3,800. This gap highlighted how deeply underwater the company’s treasury had become.
Want more token insights like this? Sign up for Editor Harsh Notariya’s Daily Crypto Newsletter here.
These figures triggered criticism from market observers, who argued that such large unrealized losses could limit future upside and pressure shareholder returns. Some warned that accumulated ETH could eventually act as a selling supply.
In response, Chairman Tom Lee defended the strategy, stating that drawdowns are “a feature, not a bug.” He argued that crypto cycles naturally involve temporary losses and that BitMine is designed to accumulate through downturns to outperform over time.
Sponsored
Sponsored
However, despite this explanation, BMNR stock failed to attract sustained buying interest after the comments.
OBV and CMF Show Buyers Stayed Away After the Breakdown
Market participation data suggests that investors began exiting even before the public debate intensified.
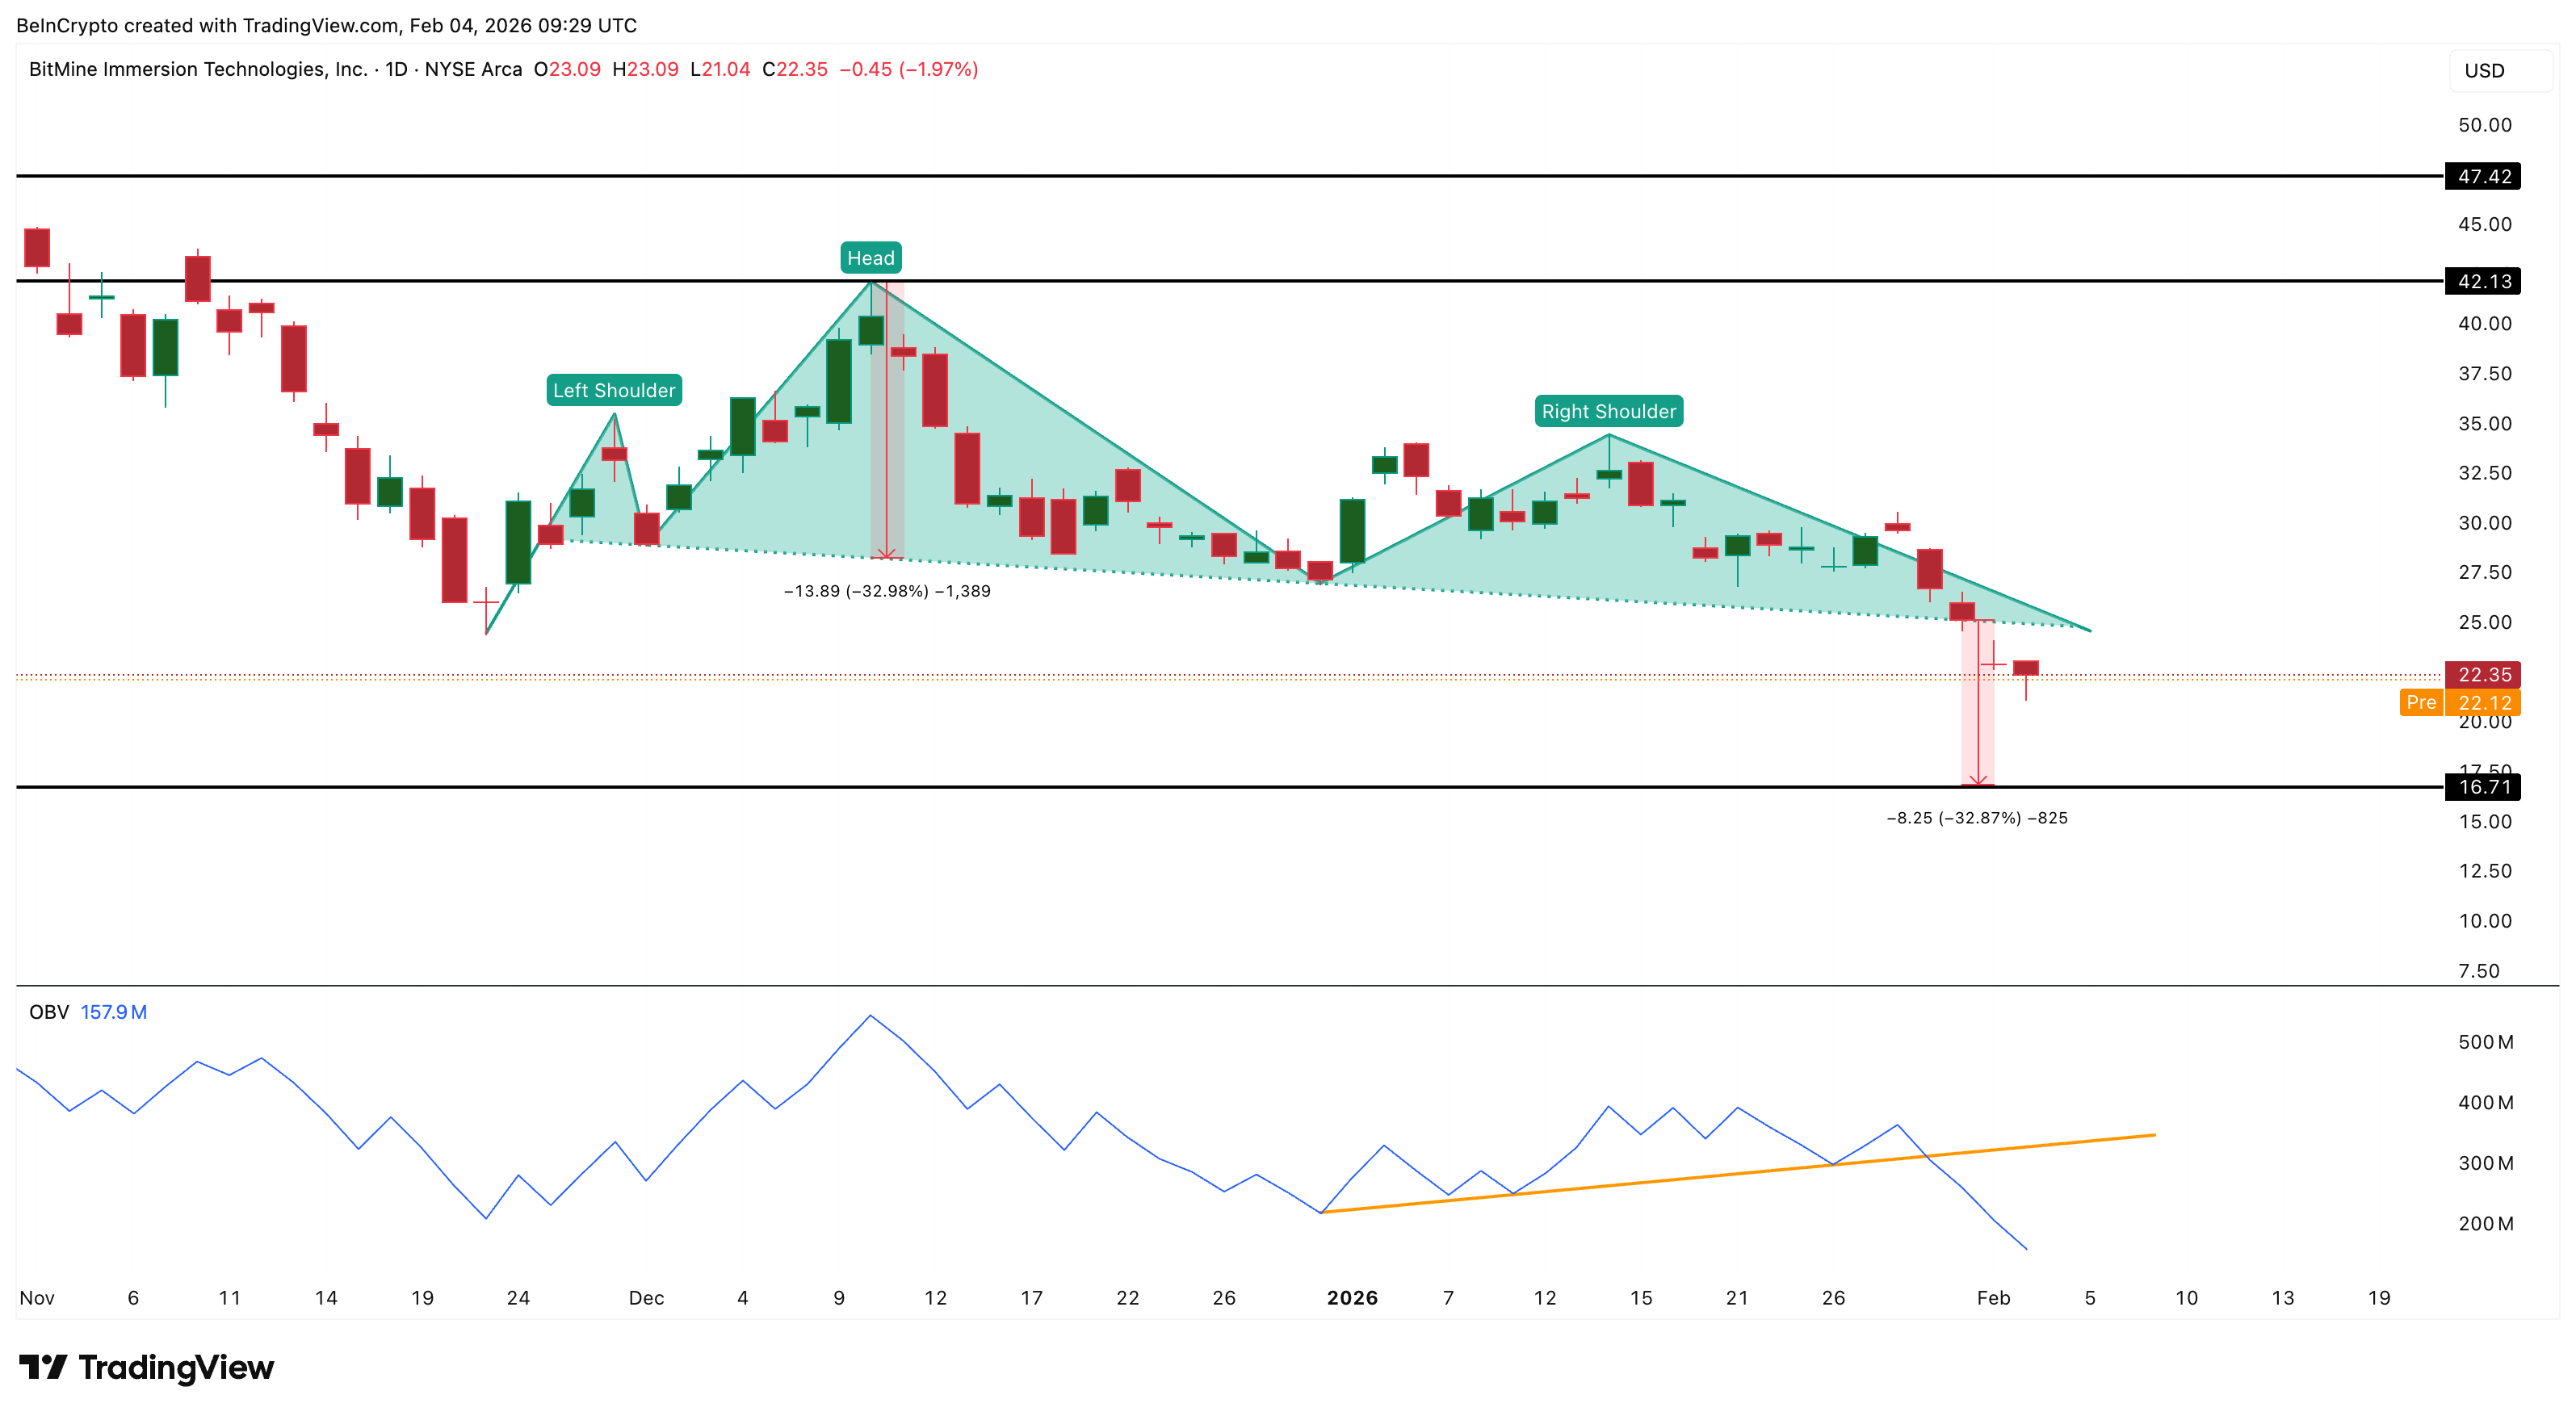
On-Balance Volume (OBV) tracks cumulative buying and selling pressure by adding volume on up days and subtracting it on down days. It reflects whether traders are accumulating or distributing.
From early December through late-January, OBV was forming higher lows, signaling steady accumulation. But between January 28 and 29, OBV broke below its rising trend line. This showed that possibly retail and short-term traders had started distributing shares.
Sponsored
Sponsored
After OBV weakened, institutional-style capital followed.
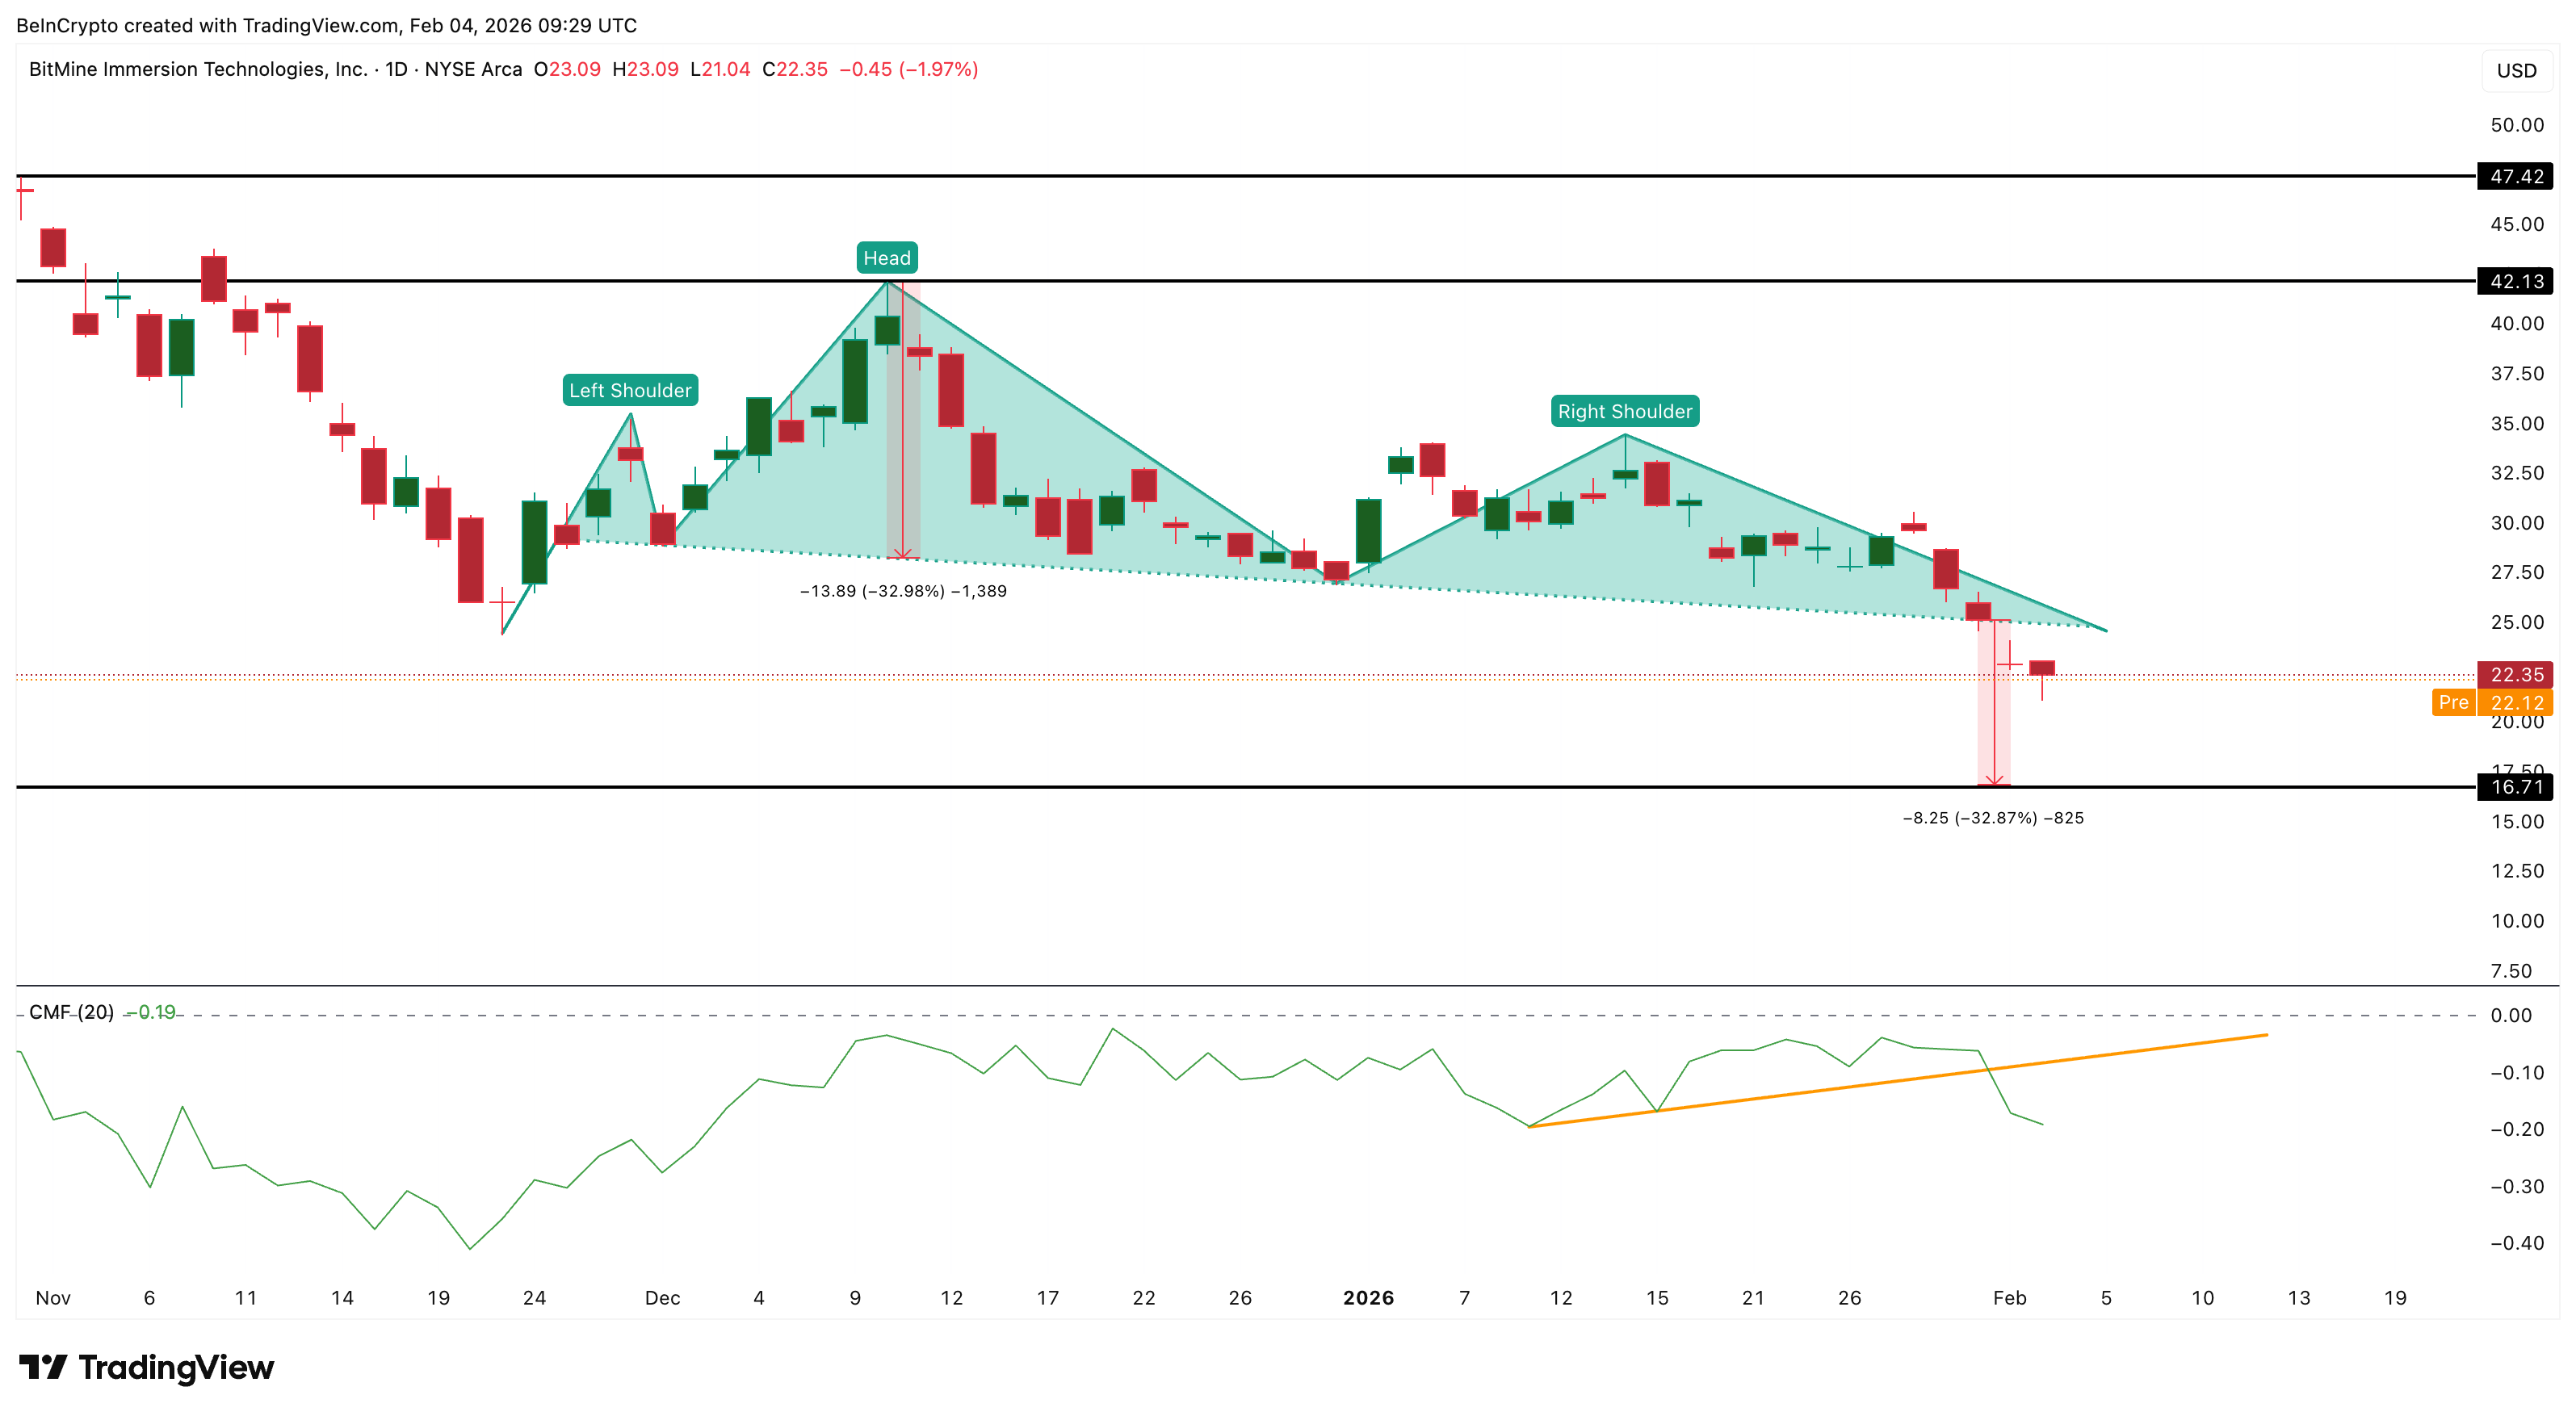
Chaikin Money Flow (CMF) measures whether money is flowing into or out of an asset using price and volume. Readings above zero suggest accumulation, while negative values signal capital outflows.
From January 30 onward, CMF fell sharply and remained below zero. This confirmed that large buyers were reducing exposure as the BMNR price approached key support. Both indicators aligned with the chart structure.
BMNR had been forming a head-and-shoulders pattern through December and January. When price failed near the neckline and then broke down on February 2 (gap-down formation), OBV and CMF confirmed the move.
In sequence, retail volume weakened first, large capital exited next, and prices collapsed afterward. The “feature, not a bug” ETH treasury narrative did not reverse this flow-driven sell-off.
Sponsored
Sponsored
Key BMNR Stock Price Levels Define the Next Move
After breaking the head-and-shoulders neckline and the rising trend line, the BMNR stock price resumed its broader downtrend, a projected dip of over 30%.
Several levels now define the outlook. On the downside, initial support sits near $19.26 if the BMNR stock price doesn’t reclaim $22.52 on the daily timeframe. Below $19.26, the next major level stands near $16.71, which aligns with the full technical projection of the bearish pattern.
If selling pressure accelerates, extended downside could reach toward $9.87, pushing the stock into single-digit territory. On the upside, recovery remains difficult.
The first resistance lies near $22.52. The BMNR stock price must reclaim this level to slow the decline. Above that, resistance appears near $25.07 and $28.66. These zones would need to be cleared to signal early stabilization.
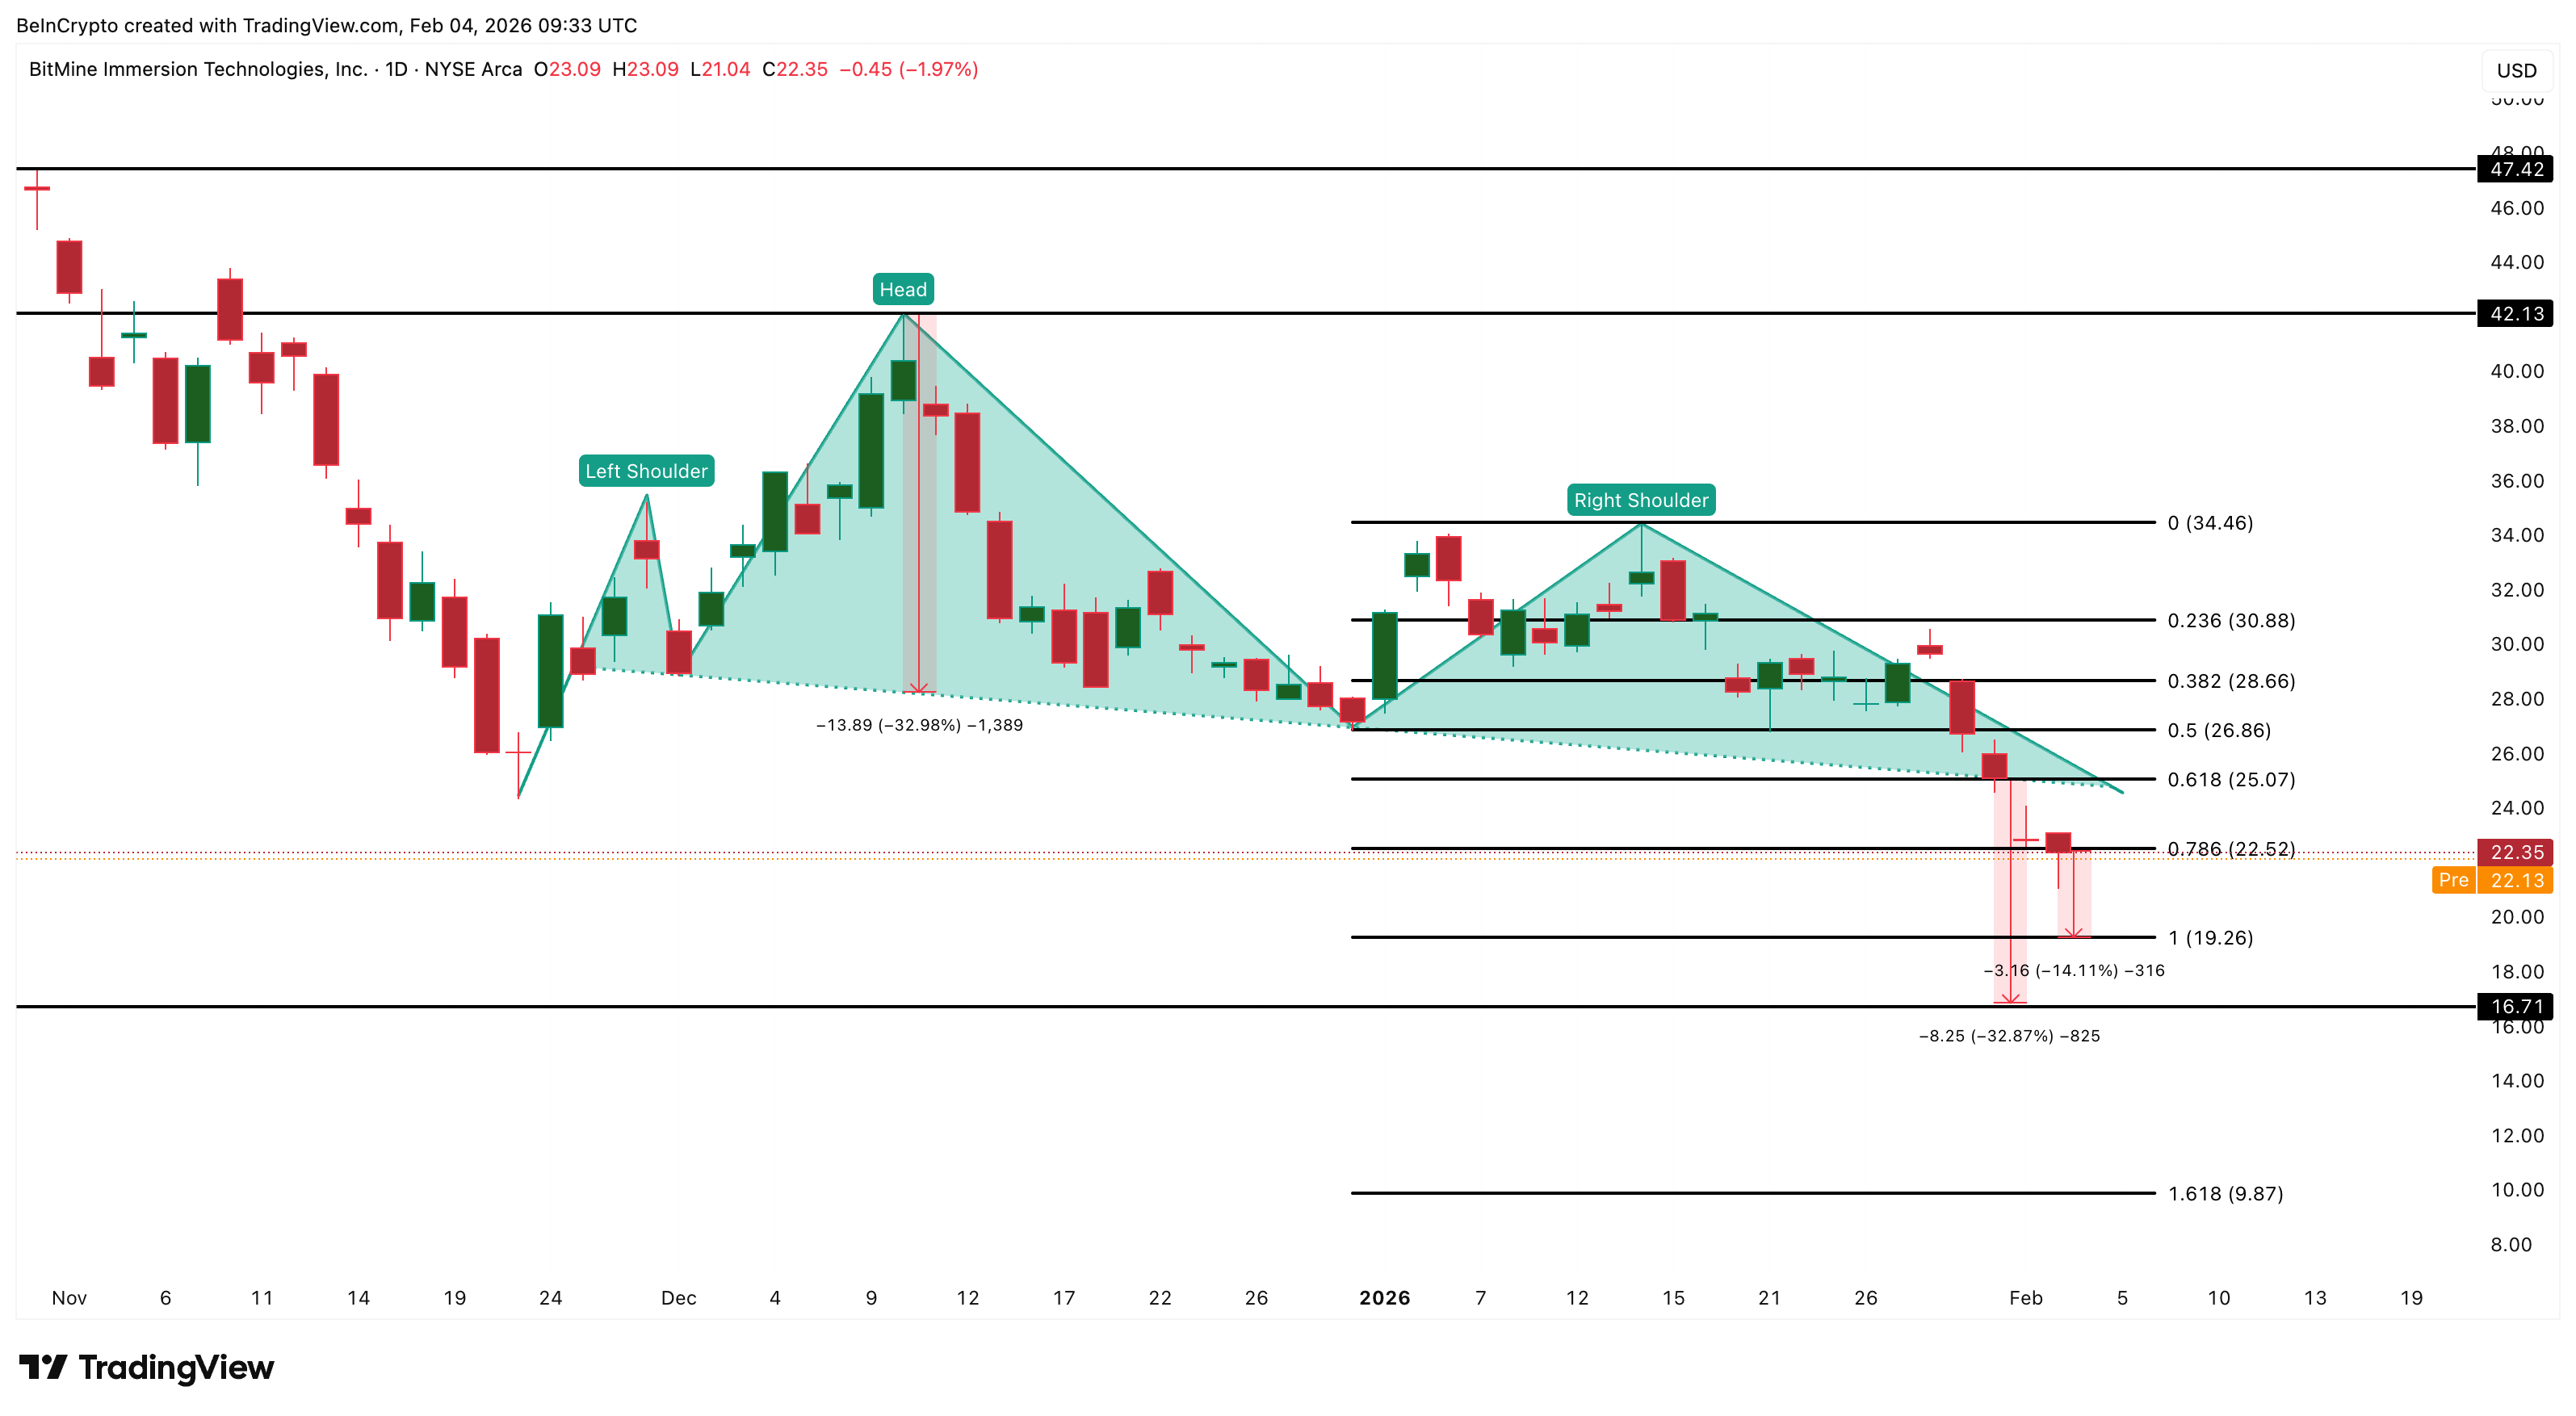
A broader trend shift would require a move above $34.46, followed by confirmation near $42. For now, both OBV and CMF remain weak, showing that buyers have not returned in force. Until capital flows turn positive and key resistance is reclaimed, technical pressure is likely to dominate BMNR stock price behavior.

Bitcoin (BTC) treaded water at Thursday’s Wall Street open as the S&P 500 reached new all-time highs.
Key points:
-
Bitcoin stays locked on $74,000 after its local highs preceded a new record for the S&P 500.
-
Analysis warns that the US midterm elections may impact the stock rally.
-
Bitcoin could follow the Nasdaq 100 higher, a trader suggests.
BTC price tripped after fresh highs from the S&P 500
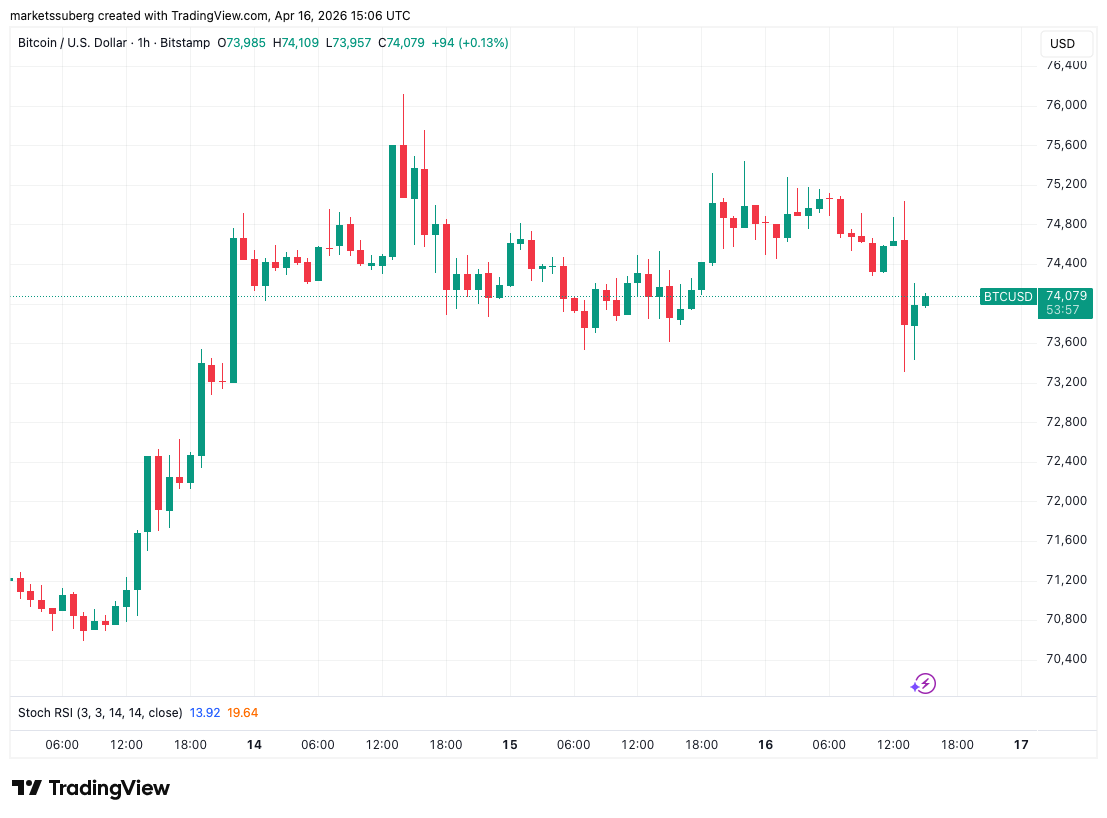
Data from TradingView showed $74,000 continuing to form an intraday BTC price focus.

US jobless claims came in marginally below expectations at 207,000 versus 213,000, pointing to the labor market withstanding current geopolitical and inflation pressures.
These followed a new record for the S&P 500, which crossed 7,000 points for the first time in history after Bitcoin hit two-month highs.
Commenting, trading resource Mosaic Asset Company noted that the S&P had advanced by nearly 11% in the past 11 trading sessions.
“It ranks as the fifth quickest recovery to record highs following a deep pullback,” it wrote in its latest “Mosaic Chart Alerts” update.
“The S&P closed firmly above the 7,000 level for the first time in history despite the ongoing uncertainty in the Middle East that sparked a 9% drawdown in the index into late March.”

Gold dipped to intraday lows and WTI crude oil eyed $94 per barrel as markets awaited further cues over the US-Iran war.
QCP, meanwhile, warned that seasonal trends could still end the stock rally as the US entered midterm elections. The S&P 500, it noted, “tends to find its peak about now ahead of mid-term elections, and then recovering during the final quarter of the year.”
“I would not base any investment decision or outlook based on seasonals alone, which is why I’m also watching confirmation from breadth,” it cautioned.

Trader sees “opportunity” in Bitcoin versus Nasdaq
With BTC price action finding resistance near its range highs, market participants eyed exchange order-book liquidity for clues as to where the next showdown could come.
Related: Bitcoin can grow ‘probably a lot bigger’ than $30T+ gold market — Analysis
“The price bucket at $72.2K – 72.4K has a large amount of open interest that has slowly accumulated,” Shubh Varma, CEO of crypto data platform Hyblock, told Cointelegraph on the day.
“We’ve seen this level where traders are often active, entering and exiting. Most recently, about $100 million longs and shorts opened here, bringing the total close to $400 million at that price bucket, over the last seven days (on Binance stablecoin perps).”
Varma added that this could form “an area to watch as potential support if price revisits it, as many of these longs and shorts may exit at breakeven ‘psychological’ level.”

Continuing the stocks theme, crypto trader Michaël van de Poppe flagged Bitcoin’s relationship with the Nasdaq-100 index as a cause for optimism going forward.
“Bitcoin is about to follow Nasdaq,” he told X followers.
“The reason for this is quite simple: the correlation has been significantly strong most of the time. This period? The weakest correlation in the past 10 years.”

Van de Poppe eyed a “tremendous opportunity” for Bitcoin buyers, having recently seen a similar bullish setup in Bitcoin versus gold.
This article is produced in accordance with Cointelegraph’s Editorial Policy and is intended for informational purposes only. It does not constitute investment advice or recommendations. All investments and trades carry risk; readers are encouraged to conduct independent research before making any decisions. Cointelegraph makes no guarantees regarding the accuracy or completeness of the information presented, including forward-looking statements, and will not be liable for any loss or damage arising from reliance on this content.

Commodity Futures Trading Commission (CFTC) Chairman Michael Selig told House lawmakers the agency will pursue anyone committing fraud or insider trading in prediction markets with “the full force of the law.”
Selig appeared before the House Agriculture Committee on Thursday as the agency faces mounting pressure over fast-growing event contract platforms and suspicious trades tied to political announcements.
Prediction Markets Under the CFTC Microscope
Selig told the committee that the Commodity Exchange Act grants the CFTC “very broad, exclusive jurisdiction” over commodity derivatives.
The chairman said he inherited a wave of self-certified event contracts from the prior administration, when “the floodgates really opened.”
The agency has since issued an advance notice of proposed rulemaking to set clearer standards for prediction market contracts.
Selig described a multi-layered oversight system. Designated contract markets serve as self-regulatory organizations and act as the first line of defense.
The CFTC reviews every contract self-certification and retains authority to reject listings. The agency also sued multiple states that attempted to apply gambling laws to licensed prediction market operators.
Lawmakers Press on $500 Million Oil Trades
Rep. McGovern raised a specific incident from March 23, when someone placed roughly $500 million in oil and equities futures trades minutes before President Trump posted about ceasefire talks on Truth Social.
The trades bet oil prices would drop and equities would rally.
“We have a zero tolerance policy when it comes to fraud, abuse of trading practices and manipulation, and anyone who engages in that behavior will face the full force of the law,” said Selig, chair of the CFTC.
Selig declined to confirm or deny any active investigation, stating that doing so would hinder enforcement efforts.
Follow us on X to get the latest news as it happens
CFTC-SEC Crypto Push and Solo Rulemaking
Beyond enforcement, Selig highlighted the agency’s role in shaping crypto policy. The CFTC and SEC signed a Memorandum of Understanding in March to coordinate on digital asset oversight, stablecoins, and tokenized collateral.
Selig said the two agencies had “failed to work well together” for too long and that the MOU would establish open communication on surveillance and policymaking.
Ranking Member Craig pressed Selig on whether he would pause rulemaking while serving as the CFTC’s only sitting commissioner. Selig refused.
He told the committee that investor protections and market safeguards could not wait for additional nominees.
The coming weeks may reveal whether that stance draws further congressional pushback or accelerates the prediction market framework the industry has been waiting for.
Subscribe to our YouTube channel to watch leaders and journalists provide expert insights
The post CFTC Chair Selig Vows To Stop Prediction Market Fraud appeared first on BeInCrypto.

Publicly traded Bitcoin miners sold more BTC in Q1 2026 than in all four quarters of 2025, signaling renewed pressure on the sector as mining economics tighten. The EnergyMag reports that operators including MARA, CleanSpark, Riot Platforms, Cango, Core Scientific and Bitdeer liquidated collectively more than 32,000 BTC in the first quarter, a quarterly record that eclipses earlier bear-market selloffs.
The quarter’s total also stands out against a backdrop of slumping profitability, as hashprice — the metric that combines network security costs with miner revenue potential — drifts toward the low end of profitability for many operators. Hashrate Index data puts current hashprice at roughly $33 per PH/s per day, near the $35 per PH/s per day breakeven line for older mining equipment, underscoring ongoing margin pressure in the sector. The combination of falling hashprice and rising electricity costs has pushed some miners into unprofitable territory, with CoinShares noting about 20% of the mining industry operating below breakeven on a cash-cost basis.
Key takeaways
- Publicly traded miners liquidated more than 32,000 BTC in Q1 2026, a new quarterly record and greater than their combined sell-off in all of 2025.
- Hashprice sits around $33 per PH/s per day, near the breakeven threshold for many operators, placing pressure on margins, especially for older hardware.
- An estimated 20% of miners are unprofitable at current hashprice levels, highlighting a widening profitability gap in the sector.
- Bitcoin treasury holders and corporate buyers diverge from miner selling, with Strategy reportedly increasing BTC purchases as price dips; co-founder Michael Saylor signaled continued accumulation.
Record miner liquidations reshape the mining economics landscape
The quarterly sell-off by public miners marks a notable shift in 2026, with The EnergyMag citing more than 32,000 BTC moved off balance sheets in Q1. The figure eclipses the 20,000 BTC sold during Q2 2022 — a period aligned with the Terra-Luna collapse and a severe crypto bear market — and sets a new benchmark for how much BTC miners liquidate in a single period. The scale matters because it highlights the fragility of a business model still adjusting to lower revenue per mined coin and higher energy costs, even as competition intensifies with more efficiently operated rigs joining the hash network.
Analysts say the burst of selling reflects both tightening margins and a shift in capital needs. As miners seek to cover operating expenses, network growth through hashrate expansion presses the economics of marginal production. The EnergyMag’s report underscores that even with a rising hashrate, a larger portion of cash flow may be diverted to debt service, electricity, and equipment upkeep rather than long-hold treasury strategies.
Hashprice dynamics and the profitability squeeze
Hashprice has been a critical, forward-looking indicator for miners since it directly ties the cost of securing the Bitcoin network to revenue potential. Hashrate Index data shows hashprice hovering near $33 PH/s per day, a level that many operators equate with a break-even threshold of roughly $35 PH/s per day, depending on equipment vintage and energy costs. That proximity to break-even is enough to tilt decisions toward liquidation for underpowered rigs, and it helps explain why even modest price dips or energy hikes can trigger balance-sheet adjustments.
CoinShares’ Q1 2026 Bitcoin Mining Report echoes the stress the sector faces: at current hashprice levels, around one-fifth of the mining industry appears to be unprofitable. When combined with persistent competitive pressure — a rising hashrate means more competitors for the same block rewards — the calculus for staying operators becomes increasingly conservative. In practical terms, miners with higher operating costs or older hardware face the prospect of deeper consolidation as weaker players exit the field or pivot toward other lines of business.
Treasure dynamics diverge: miners sell, treasury buyers accumulate
While miners sold record amounts of BTC, a contrasting trend persists among Bitcoin treasury holders. CryptoQuant notes a long-running decline in the total BTC held by miners, a “Miner Reserve” metric that has drifted down from about 1.86 million BTC at the end of 2023 to roughly 1.8 million BTC at the time of publication. The dynamic highlights a fundamental tension: miners often liquidate holdings to fund operations, while independent treasury-holders and corporate buyers accumulate, reshaping the supply/demand balance across cycles.
In parallel, corporate buyers have continued to add BTC to their treasuries even as prices wobble. Strategy, the largest Bitcoin treasury company by profile, has been repeatedly described as a net buyer. Michael Saylor, Strategy’s co-founder, this week signaled further purchases as BTC pulled back from a local high near $73,000, posting on social media that investors should “think bigger” and pointing to Strategy’s long-running pattern of accumulating BTC over time. Such guidance reinforces the broad divergence between miners’ near-term liquidity needs and treasury buyers’ longer-term accumulation strategies.
CoinShares’s assessment adds nuance to the picture: even as wide-margin miners face ongoing cost pressures, the sector’s capital allocation remains a study in contrasts — with accelerating buying by treasuries on one side and sanguine but cash-constrained producers on the other. The broader implication is that while producer liquidations can temporarily depress price and sentiment, strategic buyers and reserve managers can act as counterweights, potentially stabilizing demand in downturns.
What comes next for miners and investors
Looking ahead, several factors will determine the trajectory of mining profitability and the sector’s health. The first is BTC’s price trajectory; a material recovery would widen the gap between current hashprice and breakeven, allowing marginal operators to stabilize or expand. The second is the pace of hashrate growth, which affects the competitive landscape and block rewards for all miners. Third, macro energy costs remain a meaningful driver of operating expenses, particularly for older facilities or regions with high electricity prices.
Industry researchers, including CoinShares, warned that if BTC fails to recover meaningfully in the near term, capitulation among higher-cost operators could accelerate in the first half of 2026. That possibility underscores the fragility of a sector that depends on a delicate balance of energy economics, equipment efficiency, and BTC price dynamics. Meanwhile, treasury buyers appear poised to press ahead with purchases should price volatility persist, a development that could create a counterweight to mining selloffs over time.
Readers should watch how the quarterly cadence of miner liquidations evolves in Q2 2026, and whether hashprice strengthens or weakens as new miners deploy more efficient rigs. Any shift in the balance between miner sales and treasury purchases will offer clues about how the sector negotiates the next major price cycle and whether new capacity can be absorbed without triggering further distress in the mining economy.


Sky’s native stablcoins are being deployed on Avalanche via Skylink, Sky’s crosschain bridge protocol built on LayerZero infra.
Sky, the decentralized finance protocol formerly known as MakerDAO, has announced the first native deployment of its native stablecoin, USDS, and its yield-bearing version, Savings USDS (sUSDS), on Avalanche.
The rollout runs on Skylink, the Sky ecosystem’s crosschain bridge protocol, built on LayerZero infrastructure. Unlike traditional bridge deployments, Skylink operates on a burn-and-mint framework that requires no bridge liquidity, accoriding to Sky’s X announcement.
Grove Finance initiated the bridge of Sky’s USDS and sUSDS to Avalanche via Skylink, becoming the first entity to transfer the assets directly from Ethereum mainnet to Avalanche. “This is the first native deployment of USDS and sUSDS on Avalanche,” Sky emphasized on X, clarifying:
“Every previous stablecoin expansion into a new network required third-party bridges, but Skylink removes that dependency entirely.”
Explaining the phased rollout, Sky wrote that the Avalanche bridge went live on April 13 with a daily transfer cap of 5 million in either direction, set by Sky governance. Limits are set to increase to their final capacity on April 27, with native USDS-to-sUSDS conversions directly on Avalanche expected later in Q2 2026, per Sky’s X thread.
Avalanche currently has just over $756 million in total value locked in DeFi, per DefiLlama data, making it the 12th-largest chain by DeFi TVL. Ethereum is the largest with over $58 billion.
In a separate collaboration between Grove and Sky, yesterday Grove announced it had received 25 million USDS from the Sky ecosystem as part of its Agent Network allocations. “Each allocation expands the Sky Agent Network’s capacity to generate diversified yield,” Sky wrote on X.
Sky is the rebranded version of MakerDAO, one of DeFi’s oldest and most influential protocols. As The Defiant reported in August 2024, the rebrand introduced USDS as a successor to DAI, the protocol’s long-running decentralized stablecoin, as part of the protocol’s sweeping “Endgame” overhaul.
The Avalanche news adds to a busy week for the network. Just yesterday, April 15, Bitwise launched its Avalanche ETF (BAVA) on NYSE Arca, offering investors regulated AVAX exposure with in-house staking.
This article was written with the assistance of AI workflows. All our stories are curated, edited and fact-checked by a human.
Key takeaways:
-
Negative Bitcoin futures funding rates signal bear-market losses and forced liquidations rather than a shift in sentiment.
-
Institutional inflows into Bitcoin ETFs and corporate accumulation suggest that spot demand remains solid.
Bitcoin (BTC) sold off in early trading hours at the US stock market open, briefly losing the $75,000 level before rebounding. This unexpected price swing triggered $120 million in liquidations of leveraged long (buy) BTC futures positions. During this ordeal, the Bitcoin funding rate has remained negative, which could hint at further downside and a potential advantage to the bears.

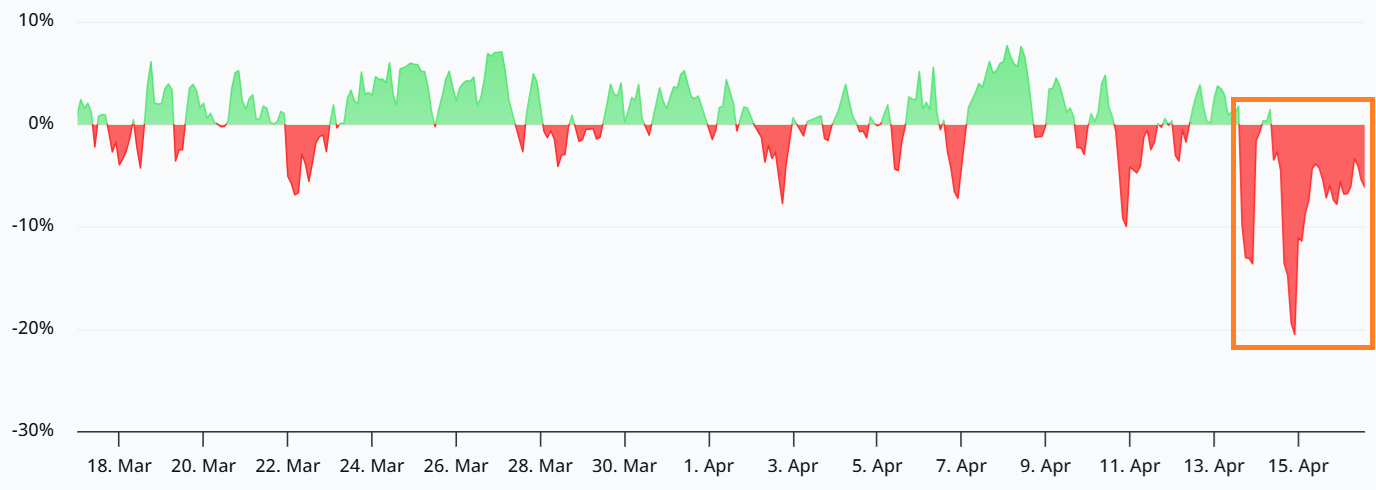
The negative funding rate has been the norm since Monday, indicating a lack of demand for bullish leverage. Negative rates mean shorts (sellers) are the ones paying to keep their positions open. Under neutral conditions, the indicator should range between 5% and 10% to compensate for the cost of capital and exchange risks. At first sight, a 20% rate indicates conviction, but that is not the whole story.
Liquidations back Bitcoin’s negative funding rate
The perpetual contract funding rates are calculated every 8 hours on most exchanges. Temporary spikes to 20%, either positive or negative, are not particularly concerning for most traders, as they amount to a 0.05% daily fee. In essence, even if the position has extremely high leverage, such as 20x, the cost is 1%. Unless this issue persists for much longer, it is hardly a burden.

Bitcoin bearish positions have been forcefully liquidated for $365 million since Monday, which has naturally eroded collateral on short positions. Traders could have opted to sit tight rather than rush to add margin, anticipating that funding rates would adjust on their own. Thus, the negative funding rate reflects losses from bears rather than conviction.

Bitcoin’s intraday moves have largely tracked the S&P 500 index for the past couple of weeks. The US stock market jumped to an all-time high on Thursday while Bitcoin remains distant from its $126,200 peak. Consecutive failures to re-establish the $76,000 level partially explain the lack of enthusiasm in BTC derivatives markets. Still, the latest round of US economic data is supportive for risk markets, including Bitcoin.
US industrial production decreased by 0.5% in March from the previous month, according to data released by the Federal Reserve on Thursday. Consumer durable goods were the negative highlight, with automotive production down 2.8%. In parallel, the continuing jobless claims increased 31,000 to a seasonally adjusted 1.818 million during the week ended April 4.
While counterintuitive, the S&P 500 benefited from the increased economic recession, which forced the government to accelerate stimulus measures. The upward pressure on inflation, which has also been fueled by the surge in oil prices, reduces incentives to hold fixed-income investments.
Related: Bitcoin bull run ‘still too early’ to call as demand lags exiting capital–Analyst

The Bitcoin options market data provides no signs of excessive demand for downside price protection. The premium paid on put (sell) options on Deribit has lagged behind the equivalent call (buy) instruments over the past week. The $921 million in net inflows into US-listed Bitcoin spot ETFs over five days, along with continued accumulation from Strategy (MSTR US), boosted investors’ confidence.
At the moment, Bitcoin’s negative funding rate does not raise alarms, especially since institutional investor demand remains strong in BTC’s spot markets.
This article is produced in accordance with Cointelegraph’s Editorial Policy and is intended for informational purposes only. It does not constitute investment advice or recommendations. All investments and trades carry risk; readers are encouraged to conduct independent research before making any decisions. Cointelegraph makes no guarantees regarding the accuracy or completeness of the information presented, including forward-looking statements, and will not be liable for any loss or damage arising from reliance on this content.

Josh Stark, a leading researcher and project manager at the Ethereum Foundation, is stepping away after five years with the non-profit behind Ethereum’s core ecosystem. In a short post on X, Stark said he has “no plans for the future” and will take time off to focus on family and friends, without detailing his next steps. His departure marks the most high-profile exit from the Foundation since a broader leadership reshuffle began to take shape in 2025.
Stark’s exit appears to be part of a larger current of change at the Ethereum Foundation, which has seen several leadership moves and a reorientation of its long-term strategic direction over the past year. Stark was listed among the four individuals identified as “Management” on the Foundation’s organizational chart, which maps reporting lines across the staff. Cointelegraph reached out to Stark for comment but did not receive a response by publication time.
The timing sits against a broader background: in early 2025, Ethereum co-founder Vitalik Buterin announced sweeping changes to the Foundation in response to growing debate over the organization’s trajectory. The updated plan aimed to infuse the Foundation with new talent, broaden decentralization, and invest in upgrading the protocol for higher throughput and faster transaction speeds. Buterin stressed that the changes would not involve lobbying in Washington or representing “vested interests,” and signaled that anyone seeking a different vision could form new organizations if they chose to do so.
Key takeaways
- Josh Stark leaves the Ethereum Foundation after five years, choosing a period of personal time with family and friends, with no stated next step.
- The departure follows a year of leadership shifts at the Foundation that align with Vitalik Buterin’s 2025 reform and decentralization push.
- In March 2025, the Foundation announced new co-directors: Hsiao-Wei Wang, a researcher at the Foundation, and Tomasz Stańczak, CEO of Nethermind, signaling a tighter, more centralized governance structure—at least in the near term.
- Stańczak stepped down from his role in February 2026, while Wang remains on the management board, indicating ongoing realignment within the organization.
- Observers will be watching how these leadership changes influence EF-backed projects, community sentiment, and the pace of Ethereum ecosystem initiatives.
Inside the leadership churn
Stark’s departure is a notable marker in a period of redefinition for the Ethereum Foundation. He has long been considered a key steward of Ethereum’s core research and project management efforts, helping navigate improvements to the network and its development roadmap. The explicit reasons for his exit were not disclosed, but his message on X underscored a personal, rather than strategic, exit—“no plans for the future”—and a focus on private life for the time being. The Foundation’s internal structure shows Stark among the core management team, suggesting his role was central to ongoing projects and coordination across teams.
The broader context is critical. In January 2025, Vitalik Buterin outlined a set of leadership changes designed to address community concerns about the Foundation’s direction and to accelerate progress on Ethereum’s scaling, governance, and decentralization. Buterin described a move away from centralized influence toward a model that emphasizes decentralization and openness to new organizational forms that might pursue different visions for Ethereum. He stressed the Foundation would refrain from ideological campaigning or lobbying, and invited others to form alternative groups if they believed they could advance different priorities.
That shift culminated in March 2025 with the Foundation officially naming new co-directors. Hsiao-Wei Wang, a longtime Ethereum Foundation researcher, joined Tomasz Stańczak, the chief executive of Nethermind (an Ethereum execution client), as co-directors. The arrangement signaled a renewed emphasis on leadership depth and an alignment of research and execution capabilities with governance oversight. The move was framed as a step toward more robust governance and a refreshed mandate for Ethereum’s ongoing development and ecosystem support.
What changed—and what remains uncertain
The leadership overhaul in 2025 represented more than a personnel reshuffle. It signaled a strategic pivot aimed at accelerating protocol improvements and expanding the Foundation’s ability to back core infrastructure and ecosystem projects. Buterin’s remarks suggested a deliberate move away from direct activism or involvement in external lobby efforts, focusing instead on building out internal capabilities and encouraging the broader ecosystem to organize around shared goals—and to form new entities if they desired a different course.
With Stańczak’s February 2026 departure, the Foundation’s leadership picture shifted again. Wang remains on the management board, indicating continuity in the new direction and a continued emphasis on research-driven governance. Yet the exact long-term balance between centralized leadership and decentralized governance within the Foundation remains an evolving question. For developers and projects that rely on EF funding and strategic guidance, leadership stability—alongside predictable support for grant programs, tooling, and ecosystem initiatives—will continue to be a watch point.
From an ecosystem perspective, the changes could have several implications. On one hand, a renewed leadership slate—combining deep technical know-how with execution-focused leadership—could streamline decision-making, reduce bottlenecks, and accelerate critical upgrades or incentive programs. On the other hand, persistent turnover at the Foundation can raise questions about continuity and the consistency of funding priorities, particularly for projects spanning Layer 2s, client implementations, and security research.
Market watchers and project teams will be looking for signals about how the Foundation plans to allocate resources, how it engages with core development efforts, and how governance processes might evolve under Wang’s and the Foundation’s current leadership. The near-term question is whether the shift will translate into more ambitious support for scaling solutions, faster client performance improvements, and a more transparent, participatory approach to funding decisions that reflect the wider Ethereum community’s priorities.
Broader implications for builders and users
For builders and users, leadership changes in the Ethereum Foundation can be both a source of reassurance and uncertainty. Reassurance comes from the prospect of a more focused, technically driven strategy that prioritizes resilient infrastructure and scalable upgrades. Uncertainty arises when leadership transitions intersect with funding cycles, policy directions for research, and the timing of strategic initiatives that affect development roadmaps and ecosystem incentives.
As the Foundation navigates this period of transition, contributors and stakeholders will be paying close attention to commitments around critical efforts—such as client diversity and performance improvements, rollouts of Layer 2 technologies, and security research that underpins Ethereum’s continued resilience. The ongoing governance arrangements within the EF’s management structure will likely shape how quickly these initiatives advance and how broadly they are supported across the ecosystem.
What to watch next
Readers should monitor how the Ethereum Foundation balances leadership continuity with strategic renewal. Key questions include how Wang’s ongoing role on the management board will influence budgeting, project selection, and stakeholder engagement; whether additional leadership changes will follow Stańczak’s departure; and how the Foundation’s stance on decentralization and external collaboration evolves in practice. As Ethereum’s roadmap continues to unfold—toward higher throughput, stronger security, and broader adoption—the Foundation’s governance choices will remain a meaningful barometer of the project’s longer-term direction.
In the near term, stakeholders will also want clarity on grant cycles, support for core infrastructure initiatives, and the Foundation’s approach to coordinating with other major ecosystem players. The volatility of leadership turnover is not new to Ethereum’s ecosystem, but it will be important to see how the Foundation translates changes in management into tangible progress for developers and users alike.
Crypto World
Class Action Lawsuit Filed Against Circle Over Drift Protocol $280 Million Hack: Gibbs Mura Law Group


Law firm charges Circle Internet Financial with failing to freeze $230 million in stolen USDC after the April 1 Drift Protocol exploit, allegedly linked to North Korean attackers.
A class action lawsuit was filed on April 14, 2026, by Gibbs Mura, A Law Group on behalf of Drift Protocol investors who lost funds in the $280 million April 1 hack. The lawsuit alleges that Circle Internet Financial knowingly permitted attackers—reportedly tied to North Korea’s government—to offload $230 million in stolen funds using Circle’s USDC stablecoin and CCTP bridge infrastructure over eight hours without freezing the assets, despite having the technical and contractual authority to do so.
The Drift Protocol exploit, executed via pre-signed administrative transactions on Solana, caused total value locked to collapse from $550 million to under $250 million and triggered indirect losses across at least 20 additional DeFi protocols. Blockchain analytics firm Elliptic linked the attack to North Korean state-sponsored actors. The lawsuit claims Circle has accumulated over $420 million in alleged compliance failures by repeatedly allowing unrestricted use of its stablecoin and bridge services during large breaches involving misappropriated funds.
Sources: Gibbs Mura, A Law Group
This article was generated automatically by The Defiant’s AI news system from publicly available sources.
Crypto World
Bitcoin Price Prediction: BTC Shorts Liquidated Amid Massive Rally as AlphaPepe Unveils Game-Changing AI DEX Demo Live

Bitcoin ripped 5.7% in a single session on April 14, surging from $70,700 to above $76,000 as a $650 million short squeeze tore through the derivatives market. Over $515 million of that came from liquidated short positions, with 177,000 traders wiped out in 24 hours according to CoinGlass. The catalyst was a cooler-than-expected US inflation print that sent risk assets surging across equities and crypto simultaneously. The Bitcoin price prediction is back in breakout territory. But while leveraged traders scrambled to cover positions they never should have held, AlphaPepe quietly unveiled its live AI DEX demo to the public, and the presale crossed $870,000 with 7,700 wallets now positioned in Stage 13 at $0.01494.
$650 Million in Shorts Wiped as the Bitcoin Price Prediction Resets
The squeeze started building on April 13 when BTC broke above $72,000 and triggered the first wave of liquidations near $73,500. By Tuesday evening, the cascade had accelerated past $75,000 where CoinDesk data showed $200 million in additional shorts stacked at the $75,500 level. Dealers on Deribit held deeply negative gamma at $75,000, meaning every tick higher forced them to buy into the rising market to hedge, amplifying the move mechanically.
Spot ETFs added fuel. BlackRock’s IBIT led with $411 million in single-day inflows on April 14. Open interest across crypto futures surged to $126 billion, the highest since January 31. Bitcoin OI hit a record 767,000 BTC with positive funding rates and cumulative volume delta confirming that aggressive buyers, not short-covering alone, were driving the flow.

The rally stalled just below $76,000 as profit-taking kicked in. The Bitcoin price prediction consensus now clusters around $75,000 as the key level. A sustained hold above it opens the path toward $80,000 and eventually Standard Chartered’s $100,000 year-end target. A rejection sends it back into the $70,000 to $74,000 range for another consolidation phase.
Either outcome takes weeks to resolve. The short squeeze proved the momentum exists. What it did not prove is that $76,000 is the floor.
AlphaPepe Unveils Live AI DEX Demo While the Market Watches BTC
The timing was deliberate. While every headline focused on liquidation numbers and candlestick formations, AlphaPepe opened public access to the AlphaSwap demo, the live cross-chain AI DEX that screens contracts for exploit patterns before execution, surfaces whale wallet activity across chains in real time, and routes swaps through an AI engine already generating fee revenue.
This is the product. Not a testnet. Not a mockup. A working interface backed by a developer who shipped 500 million transactions on Shibarium mainnet before writing the first line of AlphaSwap. The smart contract carries a 10/10 BlockSAFU audit with zero vulnerabilities. Supply is fixed at 1 billion tokens. Every presale purchase delivers instantly with no vesting locks.
Over $870,000 raised from 7,700 wallets. Around 100 new addresses joining daily. Stage 13 sits at $0.01494 with the price rising every few days and again when each stage fills. Stakers collect 85% APR while the Q2 DEX launch approaches. A Tier 1 CEX debut follows directly after.
A $1,000 entry at $0.01494 secures 66,934 tokens. Analysts targeting $1.50 post-listing would value that at $100,401. At the aggressive end of $3.50, it crosses $234,269. Buyers at $1,000 or above can apply code ALPHA30 for a 30% bonus that stretches the count before the first candle prints. The Bitcoin price prediction needs $75,000 to hold. AlphaPepe needs Q2 to arrive. One is a question. The other is a date.
Shorts Got Liquidated. The Presale Keeps Filling.
The $650 million squeeze reminded the market what happens when positioning gets crowded on the wrong side. The AlphaPepe presale at $0.01494 with a live AI DEX demo and $870,000 raised is not a leveraged bet that can be liquidated overnight. It is an accumulation window that closes when Stage 13 fills and the next price level locks in.
Click To Visit AlphaPepe Official Website To Enter The Presale
FAQs
How much was liquidated in the Bitcoin short squeeze?
Over $650 million in total liquidations with $515 million from short positions. The squeeze was triggered by a US inflation print and amplified by negative dealer gamma at $75,000.
What is the AlphaPepe AI DEX demo?
AlphaSwap is a live cross-chain AI DEX that screens contracts, tracks whale wallets, and routes swaps. The public demo is now accessible ahead of the Q2 launch.
Is the AlphaPepe presale still open?
Stage 13 is live at $0.01494 with over $870,000 raised and 7,700 holders. Tokens deliver instantly with no vesting and the next stage approaches at a higher price.
Disclaimer: This is a Press Release provided by a third party who is responsible for the content. Please conduct your own research before taking any action based on the content.


The UK’s FCA has opened a fresh consultation on how stablecoins, trading, custody and staking will be regulated before a full crypto regime goes live in 2027.
Summary
- The UK Financial Conduct Authority has launched a fresh consultation on how stablecoin issuance, trading platforms, custody and staking will be brought inside regulation.
- Industry feedback is open until June 3, 2026, with crypto firms able to apply for full FCA authorization from September 30, 2026, before the new regime starts in October 2027.
- The FCA says its crypto rulebook is “substantively complete” and aims to create a “competitive and sustainable” market, while warning that, for now, most crypto remains unregulated beyond promotions and financial crime.
The UK’s Financial Conduct Authority is asking crypto firms and stakeholders to weigh in on the final pieces of its digital asset framework, opening a consultation on how specific activities such as stablecoin issuance, trading platforms, custody and staking will be treated under upcoming rules. The regulator said the guidance is designed to clarify the “regulatory perimeter” for crypto assets and help businesses understand how the future regime will affect their operations and compliance obligations.
In a statement, the FCA said this round of feedback will run until June 3, 2026, after which it plans to publish a policy statement in the autumn that will sit alongside previously consulted rulebooks. “We want to develop a competitive and sustainable cryptoasset sector where UK consumers are served by authorised cryptoasset firms and can make informed decisions,” the watchdog said, adding that its consultations on the core rules are now “substantively complete.”
The guidance documents outline how activities ranging from issuing UK‑regulated stablecoins to operating spot and derivatives venues, safeguarding client assets and providing staking services will fall under the Financial Services and Markets Act regime. Earlier consultation papers had already proposed that issuers of qualifying stablecoins must hold 1:1 reserves, provide clear disclosures and would generally be barred from passing through interest on backing assets to retail holders.fca+2
Under the current timetable, crypto businesses will be able to start applying for FCA authorization from September 30, 2026, with the “application gateway” remaining open until February 2027 for existing firms. The full cryptoasset regime is scheduled to come into force on October 25, 2027, at which point all in‑scope firms will need authorization under FSMA; prior registration for anti‑money‑laundering purposes will not be enough.
The FCA has also said it will provide a pre‑application support service from July 2026, offering optional meetings where firms can explain their business models, discuss expectations and get steers on the authorization process. In parallel, consultation papers set out how the UK’s Consumer Duty, conduct standards, redress mechanisms and safeguarding rules will apply to cryptoasset firms, with the FCA acknowledging that “crypto markets operate differently from traditional finance” and may require tailored approaches.
Until the new legislative regime comes into force, crypto assets in the UK remain largely unregulated beyond financial promotions and financial crime controls, a point the FCA has stressed repeatedly while warning consumers only to invest money they can afford to lose. For exchanges, custodians and stablecoin issuers, the next year will determine not only the technical shape of the rulebook but also whether London can credibly position itself as a trusted, high‑compliance hub for digital assets in competition with centers such as the EU, Hong Kong and Singapore.
In earlier crypto.news reporting on UK and EU regulatory moves, coverage has tracked the country’s journey from light‑touch registration to a full licensing regime, as well as how global firms are weighing London against MiCA‑governed Europe and Asia’s emerging hubs when deciding where to base their crypto operations.


RFK Jr. HHS budget cuts of roughly $16 billion faced their first major congressional test Thursday as Health Secretary Robert F. Kennedy Jr. testified before the House Ways and Means Committee, fielding pointed questions on vaccine policy while defending a budget that slashes discretionary spending by 12.5% compared to last year.
Summary
- Trump’s 2027 budget proposes cutting HHS discretionary spending by approximately $16 billion, including $5 billion from the National Institutes of Health, as Kennedy opens a weeklong gauntlet of seven committee and subcommittee hearings.
- Kennedy deflected vaccine questions and said he was “not happy” with proposed cuts to WIC and SNAP nutrition programs, even as he defended the broader MAHA agenda and new FDA actions rolling back Biden-era peptide regulations.
- The White House has reportedly told Kennedy to hold off on vaccine reform announcements until after November’s midterm elections, a signal that the administration views his more controversial health positions as politically risky.
RFK Jr. HHS budget cuts totaling roughly $16 billion came under sharp congressional scrutiny Thursday as Health Secretary Robert F. Kennedy Jr. made his first Capitol Hill appearance of the year before the House Ways and Means Committee. A second hearing before a House Appropriations subcommittee followed at 2 PM, kicking off a marathon week of at least seven committee appearances spanning both chambers.
Kennedy opened by framing the cuts as a structural shift away from the status quo. “We’re ending the era of federal policies that fueled the chronic disease epidemic and replacing them with policies that put the health of Americans first,” he said in prepared remarks.
Trump’s 2027 budget requests $111.1 billion in HHS discretionary spending, a 12.5% reduction from 2026 levels. The most contested line item is a $5 billion reduction to the National Institutes of Health, the federal agency that funds basic medical science research at universities across the country. Members of both parties are expected to push back on that cut across the coming week of hearings.
Kennedy said he was “not happy” with proposed cuts to the Special Supplemental Nutrition Program for Women, Infants, and Children and the Supplemental Nutrition Assistance Program, an unusually candid admission that placed distance between himself and the broader Trump budget priorities. Rep. Gwen Moore pressed Kennedy on how those cuts aligned with his stated goal of reducing chronic disease in children. Kennedy did not offer a direct resolution.
On vaccines, Kennedy largely sidestepped, while Republican Rep. Tim Murphy praised him by pivoting to attacks on former NIAID Director Anthony Fauci. Rep. Linda Sánchez delivered the sharpest line of the morning, asking why Kennedy had suspended a pro-vaccine messaging campaign while simultaneously spending taxpayer funds on a promotional video depicting him working out shirtless in a hot tub with Kid Rock.
What the White House Is Telling Kennedy
The hearings arrive as the MAHA coalition shows signs of internal strain. White House advisers have reportedly told Kennedy and other HHS officials to avoid pushing controversial vaccine policy reforms publicly until after November’s midterm elections, a signal that the administration views some of his positions as an electoral liability rather than an asset.
Kennedy’s visibility matters for the same reason it carries risk. Former Attorney General Pam Bondi and former DHS Secretary Kristi Noem were both dismissed by Trump in part following poor performances before congressional committees. Thursday’s hearing is being watched as a measure of whether Kennedy can hold the line under sustained bipartisan questioning.
Congressional Bandwidth and the Broader Stakes
The week-long hearing series adds another layer to an already compressed congressional calendar that is simultaneously managing FISA reauthorization, budget reconciliation, and Senate markup pressure on the CLARITY Act, all competing for the same finite legislative bandwidth before midterm politics shut the window. Kennedy is also scheduled before the Senate Finance and HELP Committees on April 22.
Beyond the immediate political optics, the NIH cuts could affect AI-driven medical research pipelines that have expanded significantly under recent federal funding. As crypto.news has reported, the midterm calculation that is now shaping Kennedy’s public communications is the same political timeline driving decisions across the Trump administration on everything from crypto regulation to healthcare reform.

US Blockade Tightens Grip on Strait of Hormuz as Iran War Ceasefire Frays on Day 3

Bitcoin Set To Sync With Stocks, Possibly Chasing New Range Highs
McLaughlin: Should Cal, Stanford Have Stayed in Pac-12?


-

 Politics6 days ago
US brings back mandatory military draft registration
-
 Sports6 days ago
Man United discover Nico Schlotterbeck transfer fee as defender reaches Dortmund agreement
-

 Fashion6 days ago
Weekend Open Thread: Veronica Beard
-

 Politics7 days ago
Malcolm In The Middle OG Turned Down ‘Buckets Of Money’ To Appear In Reboot
-

 Politics4 days ago
World Cup exit makes Italy enter crisis mode
-

 Business6 days ago
Tesla Model Y Tops China Auto Sales in March 2026 With 39,827 Registrations, Beating Cheaper EVs and Gas Cars
-

 Crypto World3 days ago
The SEC Conditionalises DeFi Platforms to Be Avoided for Broker Registration
-

 Crypto World3 days ago
SEC Signals Exemption for Crypto Interfaces From Broker Registration
-

 News Videos2 days ago
Secure crypto trading starts with an FIU-registered
-
 NewsBeat4 days ago
Pep Guardiola and Gary Neville agree over Arsenal title problem that benefits Man City
-

 Business5 days ago
Ireland Fuel Protests Enter Day 5 as Blockades Spark Shortages and Government Prepares Support Package
-

 Business6 days ago
OpenAI Halts Stargate UK Data Centre Project Over Energy Costs and Copyright Row
-

 Crypto World6 days ago
Federal judge blocks Arizona from bringing criminal charges against Kalshi
-

 Politics7 days ago
LBC Presenter Mocks Trump Over Iran War Failures
-

 NewsBeat3 days ago
Trump and Pope Leo: Behind their disagreement over Iran war
-

 Crypto World3 days ago
SEC Proposes Certain Crypto Interfaces Don’t Need to Register as Brokers
-
 NewsBeat5 days ago
JD Vance announces ‘no agreement’ with Iran over nuclear weapons fear
-

 Business6 days ago
IMF retains floor for precautionary balances at SDR 20 billion
-

 Business6 days ago
Former Liverpool CEO eviscerates FIFA for World Cup ticket pricing
-
 Crypto World4 days ago
Sei Network Enters Quiet Reset Phase as On-Chain Metrics Signal a Slowdown in 2026
You must be logged in to post a comment Login