
Crypto World
$321 Million in Crypto Tokens Unlock This Week: What to Watch

The crypto market will welcome tokens worth more than $321 million in the third week of February 2025. Major projects, including LayerZero (ZRO), YZY (YZY), and KAITO (KAITO), will release significant new token supplies.
These unlocks could introduce market volatility and influence short-term price movements. So, here’s a breakdown of what to watch.
Sponsored
1. LayerZero (ZRO)
- Unlock Date: February 20
- Number of Tokens to be Unlocked: 25.71 million ZRO
- Released Supply: 429.96 million ZRO
- Total Supply: 1 billion ZRO
LayerZero is an interoperability protocol that connects different blockchains. Its primary goal is to facilitate seamless cross-chain communication. Thus, it enables decentralized applications (dApps) to interact across multiple blockchains without relying on traditional bridging models.
The team will unlock 25.71 million tokens on February 20, representing 5.98% of the released supply. Moreover, the supply is worth approximately $43.19 million.
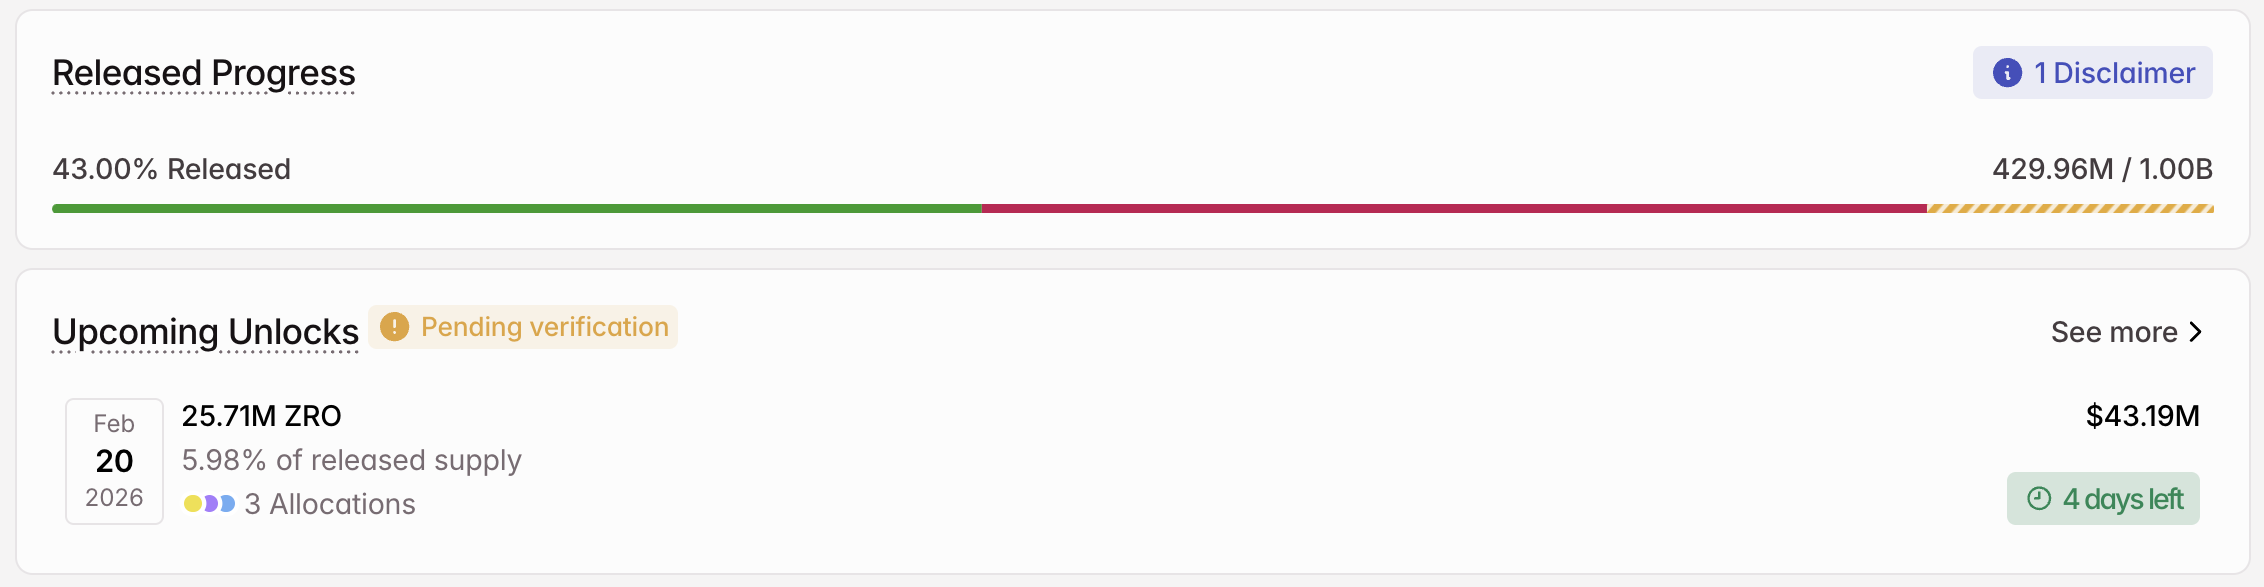
LayerZero will award 13.42 million altcoins to strategic partners. Core contributors will get 10.63 million ZRO. Lastly, 1.67 million ZRO are for tokens repurchased by the team.
Sponsored
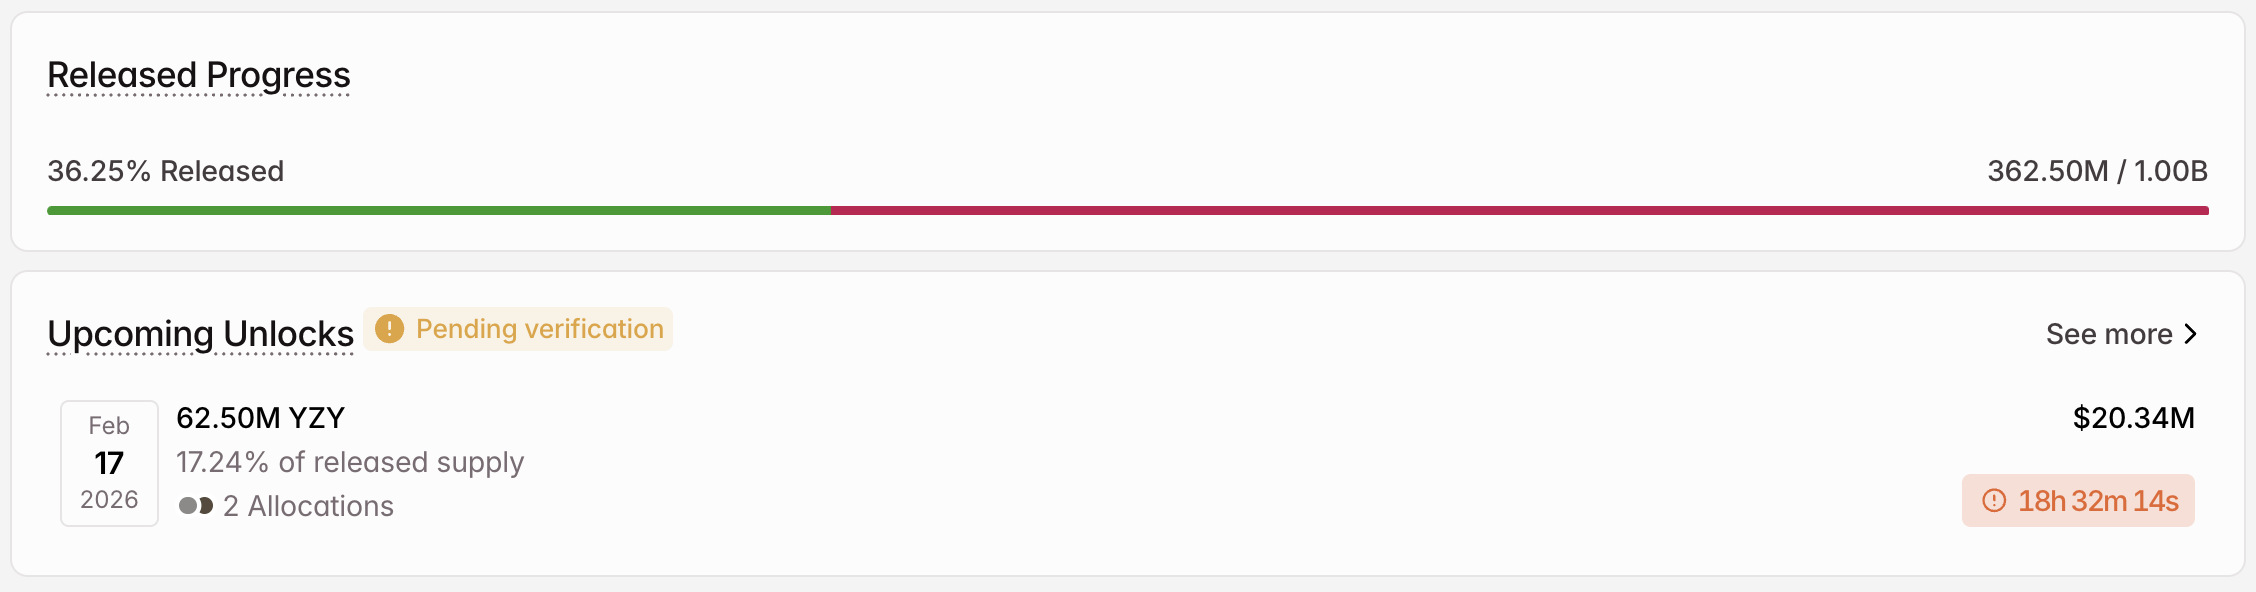
2. YZY (YZY)
- Unlock Date: February 17
- Number of Tokens to be Unlocked: 62.5 million YZY
- Released Supply: 362.5 million YZY
- Total supply: 1 billion YZY
YZY is a cryptocurrency token associated with the rapper Ye (formerly known as Kanye West). It is positioned as part of the broader “YZY MONEY” ecosystem, which includes the YZY token, a payment platform called Ye Pay, and a physical YZY Card.
On February 17, YZY will unlock 62.5 million tokens worth around $20.34 million. The tokens represent 17.24% of the released supply.
Sponsored
The team will allocate 50 million altcoins to Yeezy Investments LLC, Vesting 2. Moreover, it will direct 12.5 million tokens to Yeezy Investments LLC, Vesting 1.
3. Kaito (KAITO)
- Unlock Date: February 20
- Number of Tokens to be Unlocked: 32.6 million KAITO
- Released Supply: 306.49 million KAITO
- Total Supply: 1 billion KAITO
Kaito is an artificial intelligence (AI)-powered Web3 information platform that aggregates and analyzes cryptocurrency market data from diverse sources like social media, governance forums, news, and more. The KAITO token serves as a medium of exchange, governance tool, and incentive mechanism within the platform.
Sponsored
On February 20, the team will unlock 32.6 million tokens, representing 10.64% of the current released supply. The supply is worth approximately $10.08 million.
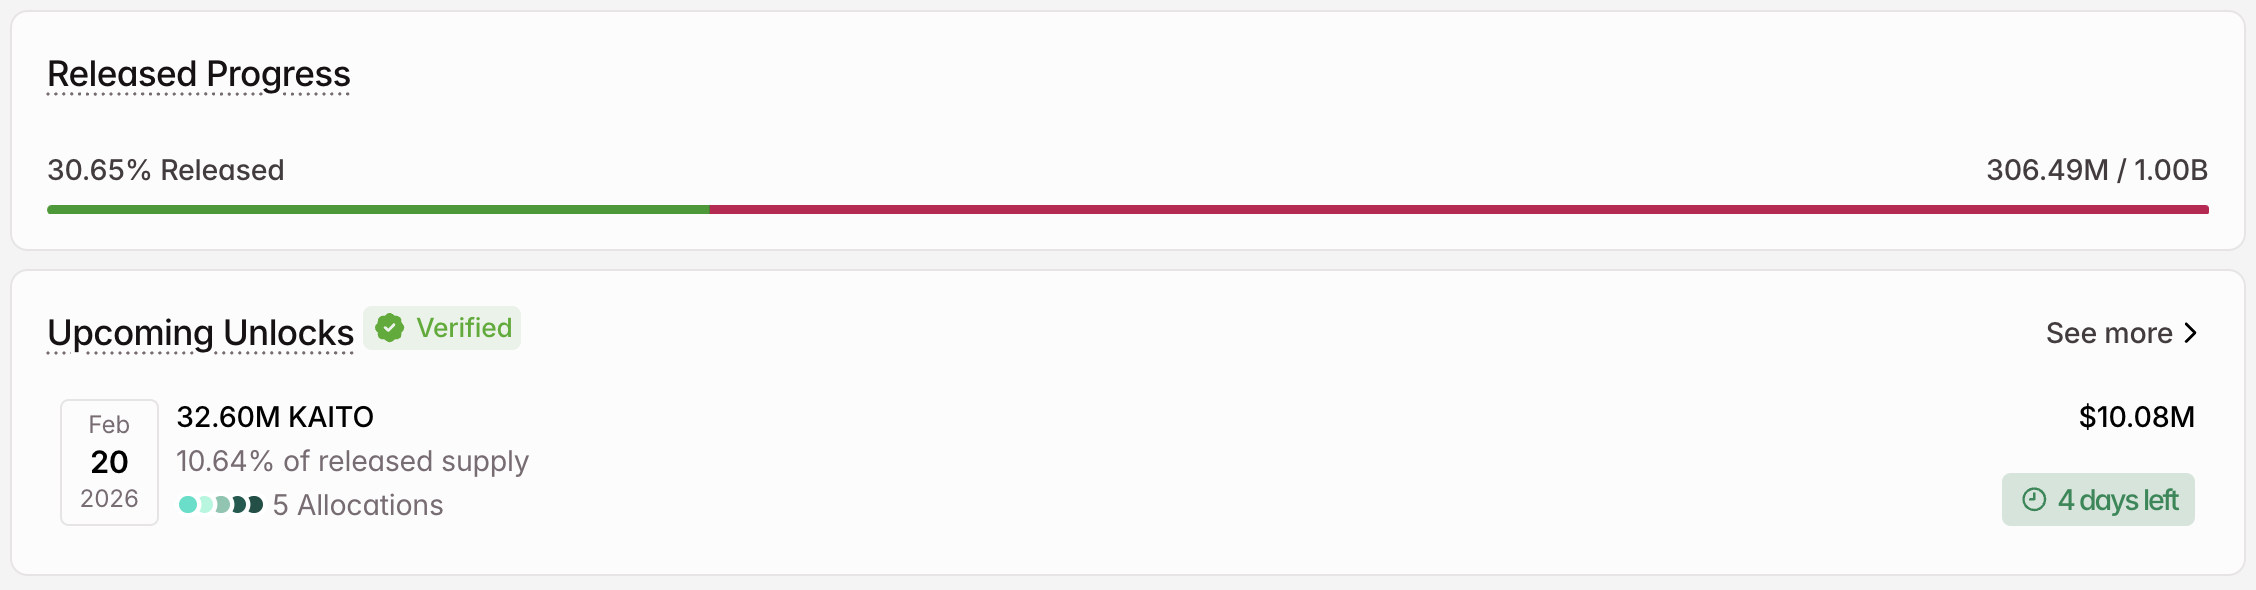
The team will split the unlocked tokens five ways. The foundation will receive 1.19 million tokens. Core contributions will get 6.94 million tokens. Furthermore, early backers will receive 2.31 million KAITO.
Finally, the team will direct 7.16 million KAITO for ecosystem and network growth and 15 million tokens for long-term creator incentives.
In addition to these, other prominent unlocks that investors can look out for in the third week of February include ZKsync (ZK), Solv Protocol (SOLV), ApeCoin (APE), and more, contributing to the overall market-wide releases.


Key Takeaways
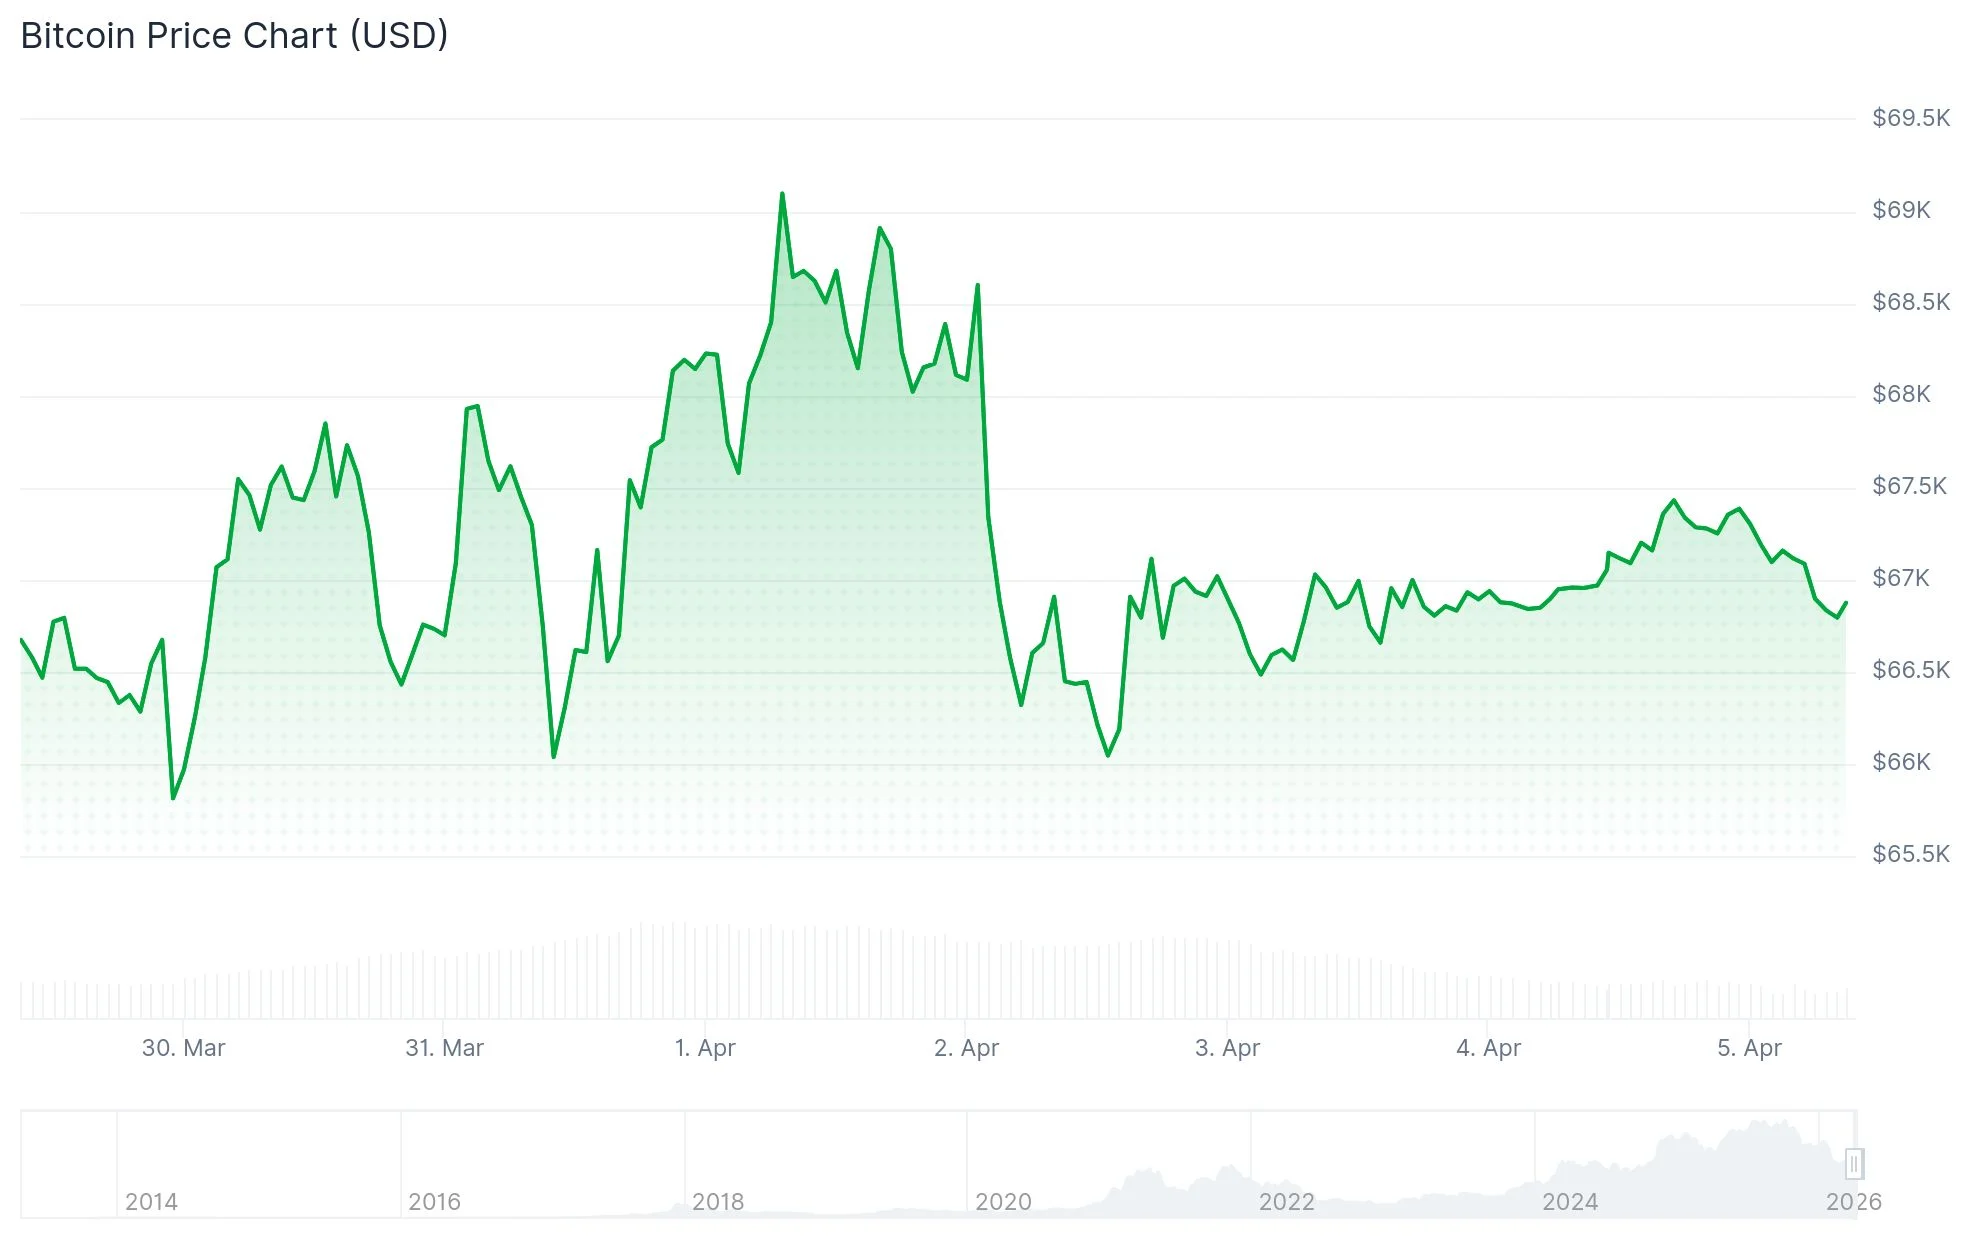
- Bitcoin hovers between $67,000 and $68,000, attracting investment from ETF managers and national wealth funds
- Ethereum dominates decentralized finance and asset tokenization, while Layer-2 networks slash transaction costs
- Solana continues rapid user expansion thanks to minimal fees and exceptional processing speeds
- Chainlink bridges smart contracts with external data sources and secures partnerships with mainstream finance players
- Bittensor offers decentralized AI infrastructure, rewarding network participants with native tokens
As early 2026 arrives, the cryptocurrency market capitalization hovers around $2.5 trillion. Investors with long time horizons are shifting attention away from volatile price movements toward digital assets backed by genuine utility and adoption.
What follows is an examination of five cryptocurrencies that market observers believe possess robust fundamentals as the industry enters its next growth phase.
Bitcoin: Institutional Treasuries Embrace Digital Scarcity
[[LINK_START_2]]Bitcoin[[LINK_END_2]] operates with a strict ceiling of 21 million tokens. This immutable supply limit establishes a scarcity dynamic unmatched by any traditional or digital asset.

The cryptocurrency presently changes hands in the $67,000 to $68,000 range. Exchange-traded funds holding actual Bitcoin have recorded substantial capital inflows throughout the previous twelve months.
National investment vehicles have incorporated Bitcoin into their asset allocations. Companies following MicroStrategy’s blueprint have increasingly adopted Bitcoin for corporate reserves.
Major financial players now categorize Bitcoin alongside traditional stores of value like precious metals. The asset continues drawing sustained investment from those seeking protection against macroeconomic volatility.
Ethereum: Dominant Force in Programmable Blockchain
[[LINK_START_4]]Ethereum[[LINK_END_4]] runs the vast majority of decentralized financial applications. The network also supports digital collectibles, stablecoins, and an expanding ecosystem of tokenized traditional assets.
Second-layer scaling technologies have dramatically reduced costs while increasing network capacity. The combination of staking rewards and token-burning mechanisms introduced through EIP-1559 creates deflationary pressure on supply.
Exchange-traded products tracking Ether have maintained strong institutional demand. Ethereum continues registering the highest development engagement among all programmable blockchain platforms.
Solana: Speed Meets Affordability
[[LINK_START_6]]Solana[[LINK_END_6]] processes several thousand transactions each second while maintaining negligible fees. The network captured significant market share from users priced out of Ethereum during periods of network congestion.
Consumer-facing applications, viral tokens, and mobile-first crypto experiences have fueled expansion across Solana’s ecosystem. Network stability has strengthened following infrastructure improvements.
Solana’s total valuation remains considerably smaller than Ethereum’s. Market analysts point to this differential as potential upside territory should institutional offerings broaden.
Chainlink: Bridging On-Chain and Off-Chain Worlds
Chainlink operates the most widely adopted oracle infrastructure. The network enables smart contracts to access external information including market prices and third-party application interfaces.
Its Cross-Chain Interoperability Protocol functions across numerous blockchain ecosystems. Chainlink has established relationships with conventional financial entities investigating distributed ledger technology.
As the tokenization of physical assets accelerates, the requirement for trustworthy external data sources should expand in parallel.
Bittensor: Building Decentralized Artificial Intelligence
Bittensor operates an open marketplace for computational power and machine learning algorithms. Network participants receive token compensation for contributing AI resources.
This project involves greater uncertainty compared to the four others discussed here. Both developer engagement and market attention have intensified during the past year.
Bittensor positions itself within decentralized artificial intelligence—a sector gaining prominence as policymakers scrutinize concentrated AI development.
Bitcoin and Ethereum represent the predominant holdings within exchange-traded fund products accessible during 2026.

Crypto World
Drift Protocol Hack: How a North Korean Group Spent Six Months Infiltrating a DeFi Protocol

TLDR:
- Drift Protocol froze all functions after a targeted exploit on April 1, 2026, linked to a state-backed group.
- Attackers posed as a trading firm for six months, meeting contributors in person across multiple countries.
- Three attack vectors were identified, including a silent code execution flaw in VSCode and Cursor editors.
- SEAL911 attributed the attack with medium-high confidence to UNC4736, a North Korean state-affiliated threat actor.
Drift Protocol suffered a major exploit on April 1, 2026, triggering a full protocol freeze. The incident has since been revealed as a structured, months-long intelligence operation.
Forensic partners, including Mandiant, are assisting law enforcement in investigating the breach. Preliminary findings point to a North Korean state-affiliated threat group as the likely perpetrators.
This marks one of the most deliberate social engineering campaigns documented in decentralized finance to date.
A Six-Month Social Engineering Campaign
The attack on Drift Protocol did not begin on the day it occurred. It traces back to Fall 2025, when contributors were approached at a major crypto conference.
The group presented themselves as a quantitative trading firm seeking protocol integration. They were technically fluent and carried verifiable professional backgrounds.
Over the following months, individuals from this group continued meeting Drift contributors in person. These encounters occurred at multiple industry conferences across several countries.
A Telegram group was established from the very first meeting. What followed were months of detailed conversations around trading strategies and vault integrations.
From December 2025 through January 2026, the group onboarded an Ecosystem Vault on the protocol. They deposited over $1 million of their own capital and participated in multiple working sessions.
By February and March 2026, the protocol noted that “these were not strangers; they were people Drift contributors had worked with and met in person.” Links to projects, tools, and applications were routinely shared throughout this period.
The investigation later revealed that “the profiles used in this operation had fully constructed identities including employment histories, public-facing credentials and professional networks.”
Contributors engaged with them across detailed product discussions. This built a credible operational presence inside the Drift ecosystem over time.
Three Attack Vectors and North Korean Attribution
After the April 1 exploit, a forensic review of affected devices and communications flagged the trading group as the likely intrusion vector.
Their Telegram chats and malicious software were completely wiped right after the attack. Three potential attack vectors have since emerged from the ongoing investigation.
One contributor may have cloned a code repository shared by the group. It was presented as a frontend deployment for their vault. Another contributor was induced to download a TestFlight application framed as the group’s wallet product.
Regarding the repository-based vector, “simply opening a file, folder, or repository in the editor was sufficient to silently execute arbitrary code, with no prompt or indication to the user, clicks, permissions dialog or warning of any kind.”
Full forensic analysis of affected hardware remains ongoing. Drift has since urged the broader ecosystem to “check in on your teams, audit who has access to what, and treat every device that touches your multisig as a potential target.”
With medium-high confidence, the SEALS 911 team assessed this as the work of UNC4736. That group is a North Korean state-affiliated actor tracked as AppleJeus or Citrine Sleet.
On-chain fund flows and overlapping personas connect this campaign to the October 2024 Radiant Capital hack. The individuals who appeared in person were not North Korean nationals, as DPRK threat actors are known to use third-party intermediaries for direct contact.
Key Takeaways
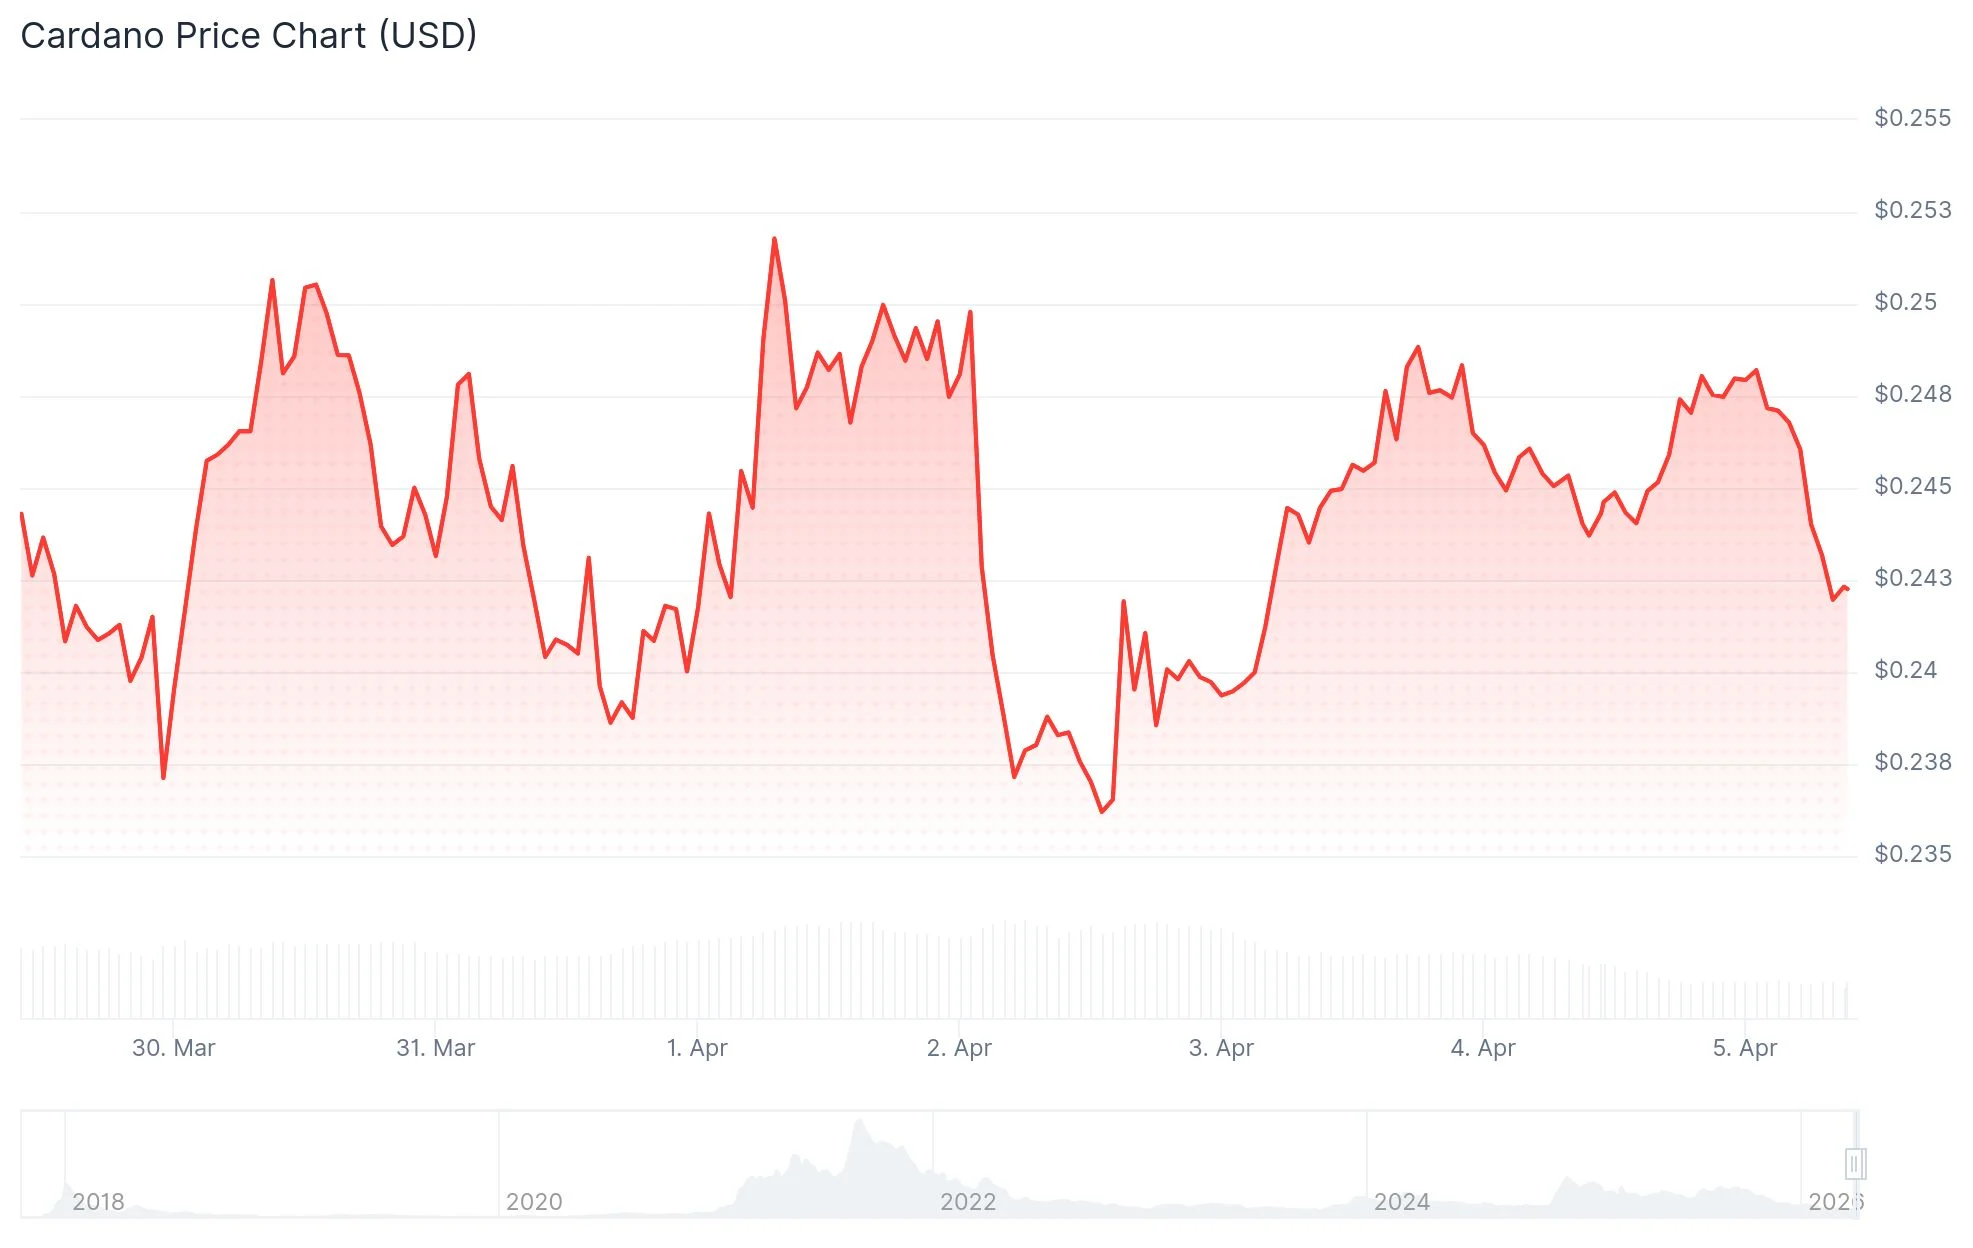
- Cardano (ADA) maintains stability around $0.24 with critical support established at $0.23
- On-chain stablecoin liquidity has surged over 100% compared to last year
- Large holder accumulation patterns have intensified throughout March, particularly during price retracements
- Network metrics show signs of stabilization following extended downtrend
- Technical analyst MasterAnanda identifies potential upside to $1.05 using Fibonacci extension levels
Cardano (ADA) continues to consolidate near the $0.24 level following a brief decline to $0.2342 on March 31 — marking its lowest valuation since February 6, when the token touched $0.220. Over the last 24 hours, ADA has experienced approximately 5.8% downward movement, consistent with widespread selling pressure throughout the altcoin sector.

However, beneath the surface price action, blockchain metrics paint a more optimistic picture. The total stablecoin liquidity deployed on the Cardano network has exploded to more than double its level from one year ago, establishing fresh cycle peaks. This expansion represents a significant increase in available capital within the ecosystem ready for deployment.
The current trading zone between $0.23 and $0.28 represents an established accumulation area. Historical data shows ADA previously consolidated at these price points during August 2024, subsequently launching a rally that peaked at $1.32 by year’s end.
Large holder behavior patterns have also evolved notably. Metrics tracking the differential between institutional and retail positioning reveal heightened accumulation events starting in early March. These buying episodes consistently align with local price bottoms, indicating sophisticated investors are strategically entering positions during weakness.
Blockchain engagement metrics have reached an inflection point. Data monitoring active wallet addresses and transaction throughput demonstrates the previous bearish trajectory has leveled off. This stabilization emerges after an extended period of declining activity and could suggest a foundation is being established.
Technical Analyst Projects Fibonacci-Based Price Targets
TradingView market analyst MasterAnanda identified the March 31 downtick as a potentially attractive entry zone. He characterized this movement as establishing a higher low formation, representing a strategic accumulation opportunity within the established support corridor.
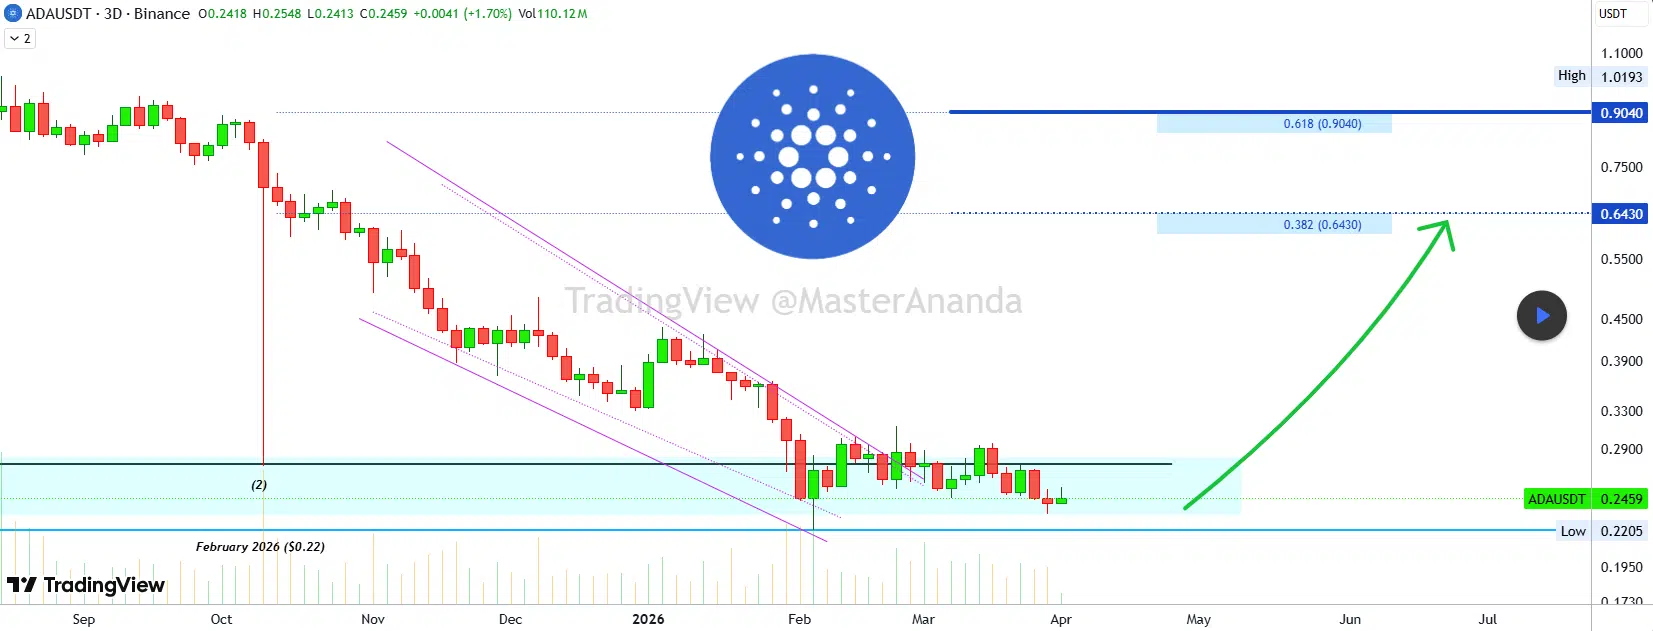
His technical framework projects the 0.382 Fibonacci retracement zone at $0.643 and the 0.618 extension level at $0.904. He further noted potential for continuation toward $1.05.
MasterAnanda proposed a leveraged long position at 10x with 5% portfolio allocation, targeting entries within the $0.2050 to $0.2500 range. Risk management includes a stop loss trigger on any weekly candle close beneath $0.2230. Successfully reaching the maximum target would generate returns exceeding 3,270%.
Critical Resistance Zones Ahead
Looking at overhead barriers, $0.27 represents the nearest resistance threshold. The $0.33 level serves as the decisive breakout point. Sustained movement above this zone would clear the pathway toward the $0.40–$0.50 range.
Should Cardano fail to defend the $0.23 support threshold, the current accumulation thesis would be invalidated, opening the door for additional downside movement.
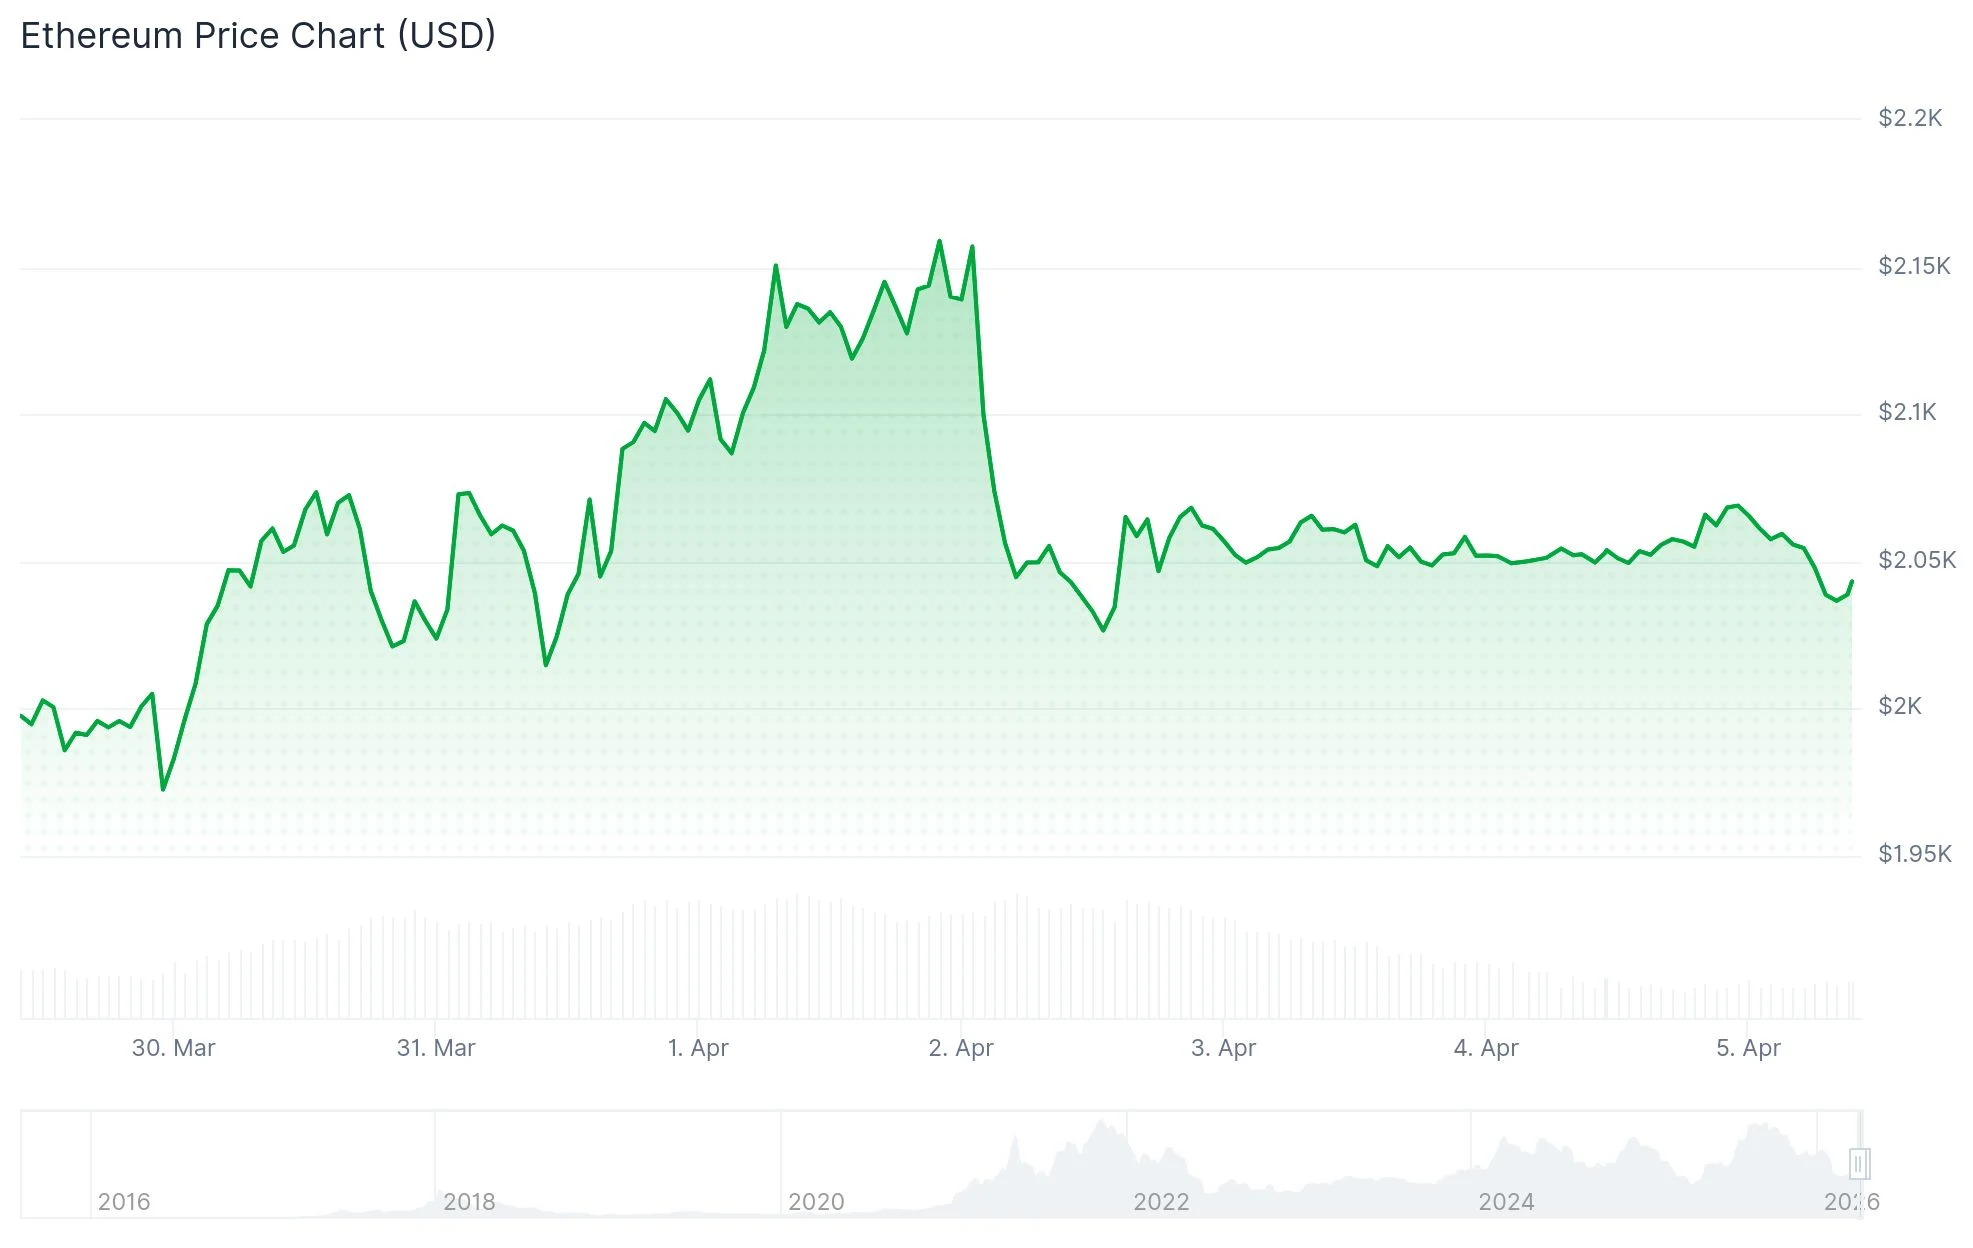
Bitcoin has demonstrated relative strength, recovering from below $65,000 to trade above $68,000 in recent sessions. Ethereum successfully recaptured the $2,100 level before experiencing a modest pullback while maintaining ground above $2,000. This broader market stability provides a constructive backdrop for ADA’s price action.
As of publication, ADA is trading near $0.2357, narrowly above the March 31 intraday low of $0.2342.
Key Takeaways
- New Google research indicates quantum computers may break Bitcoin’s encryption in less than 9 minutes
- Approximately 6.5 million BTC remain exposed in addresses susceptible to quantum attacks
- Multiple solutions are under development, including BIP 360, SPHINCS+, and commit/reveal protocols
- Investor Chamath Palihapitiya warns Bitcoin has between 5 and 7 years to address this vulnerability
- While no quantum machine can currently break Bitcoin, experts no longer view the threat as purely theoretical
The rise of quantum computing has emerged as a critical challenge to Bitcoin’s cryptographic foundation, prompting developers to accelerate their defensive strategies. Though today’s quantum computers lack the capability to compromise Bitcoin, fresh research has elevated this concern from academic speculation to an urgent priority for the cryptocurrency community.
Research released by Google this week indicates that a sufficiently advanced quantum computer could compromise Bitcoin’s underlying cryptographic protection in fewer than nine minutes. This timeframe is shorter than the typical interval required for confirming a Bitcoin transaction block. Industry experts project such technology could become reality as soon as 2029.
Roughly 6.5 million bitcoin currently reside in addresses that would be directly vulnerable to quantum attack. Approximately 1.7 million of these coins are stored in legacy address types that have already revealed their public keys through on-chain activity — this includes holdings believed to belong to Bitcoin’s pseudonymous founder, Satoshi Nakamoto.
Bitcoin’s protection framework depends on elliptic curve cryptography. Conventional computing systems would require billions of years to defeat this encryption. A quantum computer, however, could accomplish this feat within minutes by reversing the mathematical operations that connect public keys to their corresponding private keys.
Two primary attack vectors exist for quantum machines. The first involves long-exposure assaults, which target bitcoin that have remained in vulnerable addresses for extended periods. The second approach focuses on short-exposure attacks, intercepting transactions while they await confirmation in the mempool.
Developer Solutions in Progress
BIP 360 proposes eliminating permanent on-chain storage of public keys. This proposal introduces a fresh address structure that provides quantum attackers with no exploitable data. However, this protection applies exclusively to future transactions and cannot safeguard the 1.7 million BTC with already-exposed keys.
SPHINCS+, alternatively designated as SLH-DSA, represents a quantum-resistant signature protocol based on hash functions instead of elliptic curve mathematics. The National Institute of Standards and Technology officially standardized this approach in August 2024. The primary limitation involves signature size — approximately 8 kilobytes compared to Bitcoin’s existing 64-byte signatures — potentially increasing transaction costs significantly.
Tadge Dryja, co-creator of the Lightning Network, has introduced a commit/reveal mechanism. This approach divides transactions into two distinct stages, preventing quantum attackers from stealing funds through fraudulent competing transactions in the mempool. It serves as an interim measure while comprehensive long-term defenses are finalized.
A Critical Timeline
Hunter Beast’s Hourglass V2 proposal specifically addresses the 1.7 million BTC already exposed through revealed public keys. This plan would restrict withdrawals from vulnerable addresses to one bitcoin per block, effectively throttling any potential mass liquidation following a quantum breach. However, portions of the Bitcoin community have voiced opposition, contending that such limitations contradict fundamental principles regarding unrestricted spending rights.
On the All-In podcast, venture capitalist Chamath Palihapitiya noted that projections for viable quantum threats have compressed from 25 years down to just seven. He cautioned that non-governmental entities would likely target Bitcoin initially, extracting value before triggering a market collapse.
None of these protective measures have been implemented yet. Bitcoin’s decentralized governance structure demands consensus among developers, mining operations, and node operators before any protocol upgrade can take effect.
Drift Protocol, the decentralized exchange, says its latest breach was not a random incident but a six-month, highly coordinated operation carried out by a structured network of threat actors. The firm’s preliminary assessment describes the attack as an intelligence-style campaign that required organizational backing, substantial resources, and months of deliberate preparation. External estimates put the losses at roughly $280 million.
Drift traced the plan to October 2025, when attackers posing as a quantitative trading firm approached Drift contributors at a major crypto conference and signaled an interest in integrating with the protocol. Over the next six months, the group engaged Drift contributors in person at multiple industry events. Drift described the approach as targeted: individuals from the group appeared technically fluent, held verifiable professional backgrounds, and were familiar with how Drift operated. The attackers leveraged in-person meetings to build trust, then used shared link-based payloads and tools to compromise contributors’ devices, enabling the exploit before wiping their tracks.
Key takeaways
- The Drift Protocol breach is described as a six-month, coordinated operation with an external loss estimate near $280 million.
- The investigation points to an in-person, conference-era recruitment drive, beginning around October 2025, aimed at Drift contributors.
- Attackers obtained access through compromised devices via malicious links and tools, then removed any trace of their activity after execution.
- Drift asserts a possible link to the October 2024 Radiant Capital hack, suggesting the same actors may be involved, though attribution remains nuanced.
- Radiant Capital described the 2024 incident as malware delivered via Telegram from a North Korea-aligned hacker posing as an ex-contractor; Drift cautions that the individuals seen in person were not North Korean nationals.
- The case underscores ongoing security risks at crypto conferences and the need for heightened diligence when engaging with external collaborators.
Unfolding timeline: from conference curiosity to exploit
Drift’s account indicates the attackers began their engagement at a prominent industry gathering, presenting themselves as potential integration partners rather than outright attackers. Over the following months, the group met Drift contributors at several events, carefully building relationships and demonstrating a credible technical understanding of Drift’s operations. This phase helped the attackers gain access to internal channels and trusted communications, which then became the conduit for the exploit itself.
According to Drift, the operation was deliberately structured, with organized backing and resources that allowed the attackers to maintain a long-running campaign. The attackers eventually deployed malicious tooling and links through the compromised devices of Drift contributors, enabling the breach. After the exploit, the intruders reportedly erased their digital footprints, complicating the incident response and forensic work for Drift and its partners.
The breach serves as a sobering reminder to participants in the crypto space: even face-to-face interactions at conferences—often seen as networking opportunities—can be leveraged as vectors for sophisticated, well-resourced threat actors. The dynamic underscores the importance of strict device hygiene, layered security practices, and cautious third-party collaboration in a sector where trust fabric is tightly woven with interoperability.
Radiant Capital link: a potential throughline, with important caveats
Drift said it has high to medium-high confidence that the same group behind the October 2024 Radiant Capital hack may be connected to the Drift incident. The Radiant Capital breach was disclosed in December 2024, with the firm describing the intrusion as malware delivered via Telegram by a North Korea-aligned actor posing as an ex-contractor. In that case, a ZIP file shared for feedback among developers allegedly delivered the malware that enabled the intrusion.
Drift emphasized that the individuals who appeared in person at conferences were not North Korean nationals. The company also noted that DPRK-linked threat actors are known to use third-party intermediaries to conduct face-to-face relationship-building, a pattern observed in other cases as well. The connection remains a matter of ongoing investigation, and attribution in complex cyber incidents often evolves as new evidence comes to light.
For context, Radiant Capital’s incident highlighted how social engineering and remote payloads can converge with in-person trust-building to breach even sophisticated systems. The convergence of these narratives—conference-based recruitment, malware delivered through compromised devices, and links to prior high-profile hacks—will be scrutinized by investigators as they piece together the full chain of events surrounding Drift’s breach.
Ongoing investigation and industry implications
Drift said it is cooperating with law enforcement and other industry participants to assemble a complete picture of what happened during the April 1 attack. The company’s disclosure underscores the continuing need for cross-industry collaboration in threat intelligence, incident response, and post-breach forensics. While Drift has not disclosed all technical specifics of the compromise, the emphasis on a prolonged, coordinated effort points to a level of sophistication that extends beyond opportunistic intrusions.
For investors and builders in the DeFi space, the Drift incident reinforces several practical takeaways. First, even long-standing contributors and trusted relationships are not immune to manipulation when attackers blend in-person tactics with technical exploits. Second, attribution in sophisticated campaigns can be ambiguous, requiring careful, evidence-based reviews rather than premature conclusions. Finally, the episode highlights the ongoing need for robust security architectures that can detect and contain multi-stage intrusions, including compromised credentials, device-level footholds, and post-exploitation traces.
As the investigation unfolds, readers should watch for any updates on the attackers’ methods, new indicators of compromise, and any programmatic shifts in how Drift and other protocols approach contributor onboarding, partner integrations, and incident response playbooks. The convergence of a multi-month, conference-based approach with a potential linkage to previous high-profile breaches emphasizes a broader risk landscape facing decentralized platforms as they scale and collaborate across the ecosystem.
What remains uncertain is the full extent of the breach’s impact on Drift’s users and liquidity, how rapidly the platform will recover operationally, and whether additional cases of attribution will reshape the understanding of threat actor patterns in the DeFi space. The coming weeks will be pivotal for both transparency and security posture in an industry that increasingly relies on open collaboration and cross-border partnerships to innovate.
Looking ahead, market participants will want to monitor updates from Drift and related security researchers for any new findings about actors, tooling, and the broader implications for DeFi governance, risk management, and conference-based collaboration practices.
TLDR:
- Tether is targeting a $500 billion valuation, but investor demand may not meet expectations.
- The firm could delay its funding round if commitments fall short of its set threshold.
- Some investors are cautious about backing a deal larger than most U.S. banks.
- Market conditions continue to influence investor appetite for large-scale crypto funding deals.
Tether is seeking investor commitments for a new funding round at a $500 billion valuation, but may delay the process if demand remains limited. The proposed figure has drawn caution, as some investors question the scale of the target.
Investor Hesitation Emerges Over Valuation Target
A recent update shared by Coin Bureau on X brought attention to Tether’s fundraising stance. The post stated that the firm may postpone its round if investor appetite does not meet expectations.
The reported $500 billion valuation has triggered hesitation among potential backers. Many investors are weighing the size of the deal against current market conditions. The figure would place Tether among the largest financial entities globally.
Some participants in the market see the valuation as aggressive. Others remain cautious due to comparisons with established U.S. banks. The scale of the raise introduces questions about pricing and long-term positioning.
At the same time, Tether appears firm on its expectations. The company is reportedly seeking strong commitments before proceeding further. If demand fails to align, a delay remains a likely option.
Market Conditions Shape Fundraising Outlook
Investor sentiment continues to play a key role in shaping the outcome of this funding effort. Current conditions have led many firms to reassess large capital commitments. This environment affects both pricing and timing for major raises.
The size of the proposed valuation places Tether in a unique category. It would surpass most traditional financial institutions in market worth. As a result, investors are applying stricter scrutiny to the deal structure.
Meanwhile, the possibility of a delay suggests flexibility in Tether’s approach. The company appears willing to wait for stronger demand rather than adjust its valuation target. This stance reflects confidence, yet it also introduces uncertainty around timelines.
The update has added visibility to the situation. It has also sparked broader discussion across the crypto sector. Market participants continue to monitor whether investor demand will align with Tether’s expectations.
As discussions progress, attention remains on whether the funding round proceeds as planned. The outcome will depend on investor participation and acceptance of the proposed valuation. For now, the process remains open, with timing still uncertain.
Crypto World
Bitcoin (BTC) Tumbles on Geopolitical Tensions While Quantum Computing Threat Looms Large

Key Highlights
- Bitcoin slipped beneath $66,000 following Trump’s aggressive rhetoric toward Iran, triggering $440M in crypto market liquidations
- Research connected to Google suggests quantum computers may compromise Bitcoin wallets in less than 9 minutes
- Japanese firm Metaplanet acquired 5,075 BTC during Q1 2026, pushing total reserves to 40,177 BTC
- Coinbase secured conditional national trust charter from the OCC for expanded institutional custody operations
- The Ethereum Foundation executed its largest-ever single staking transaction with 22,517 ETH valued at approximately $46M
Bitcoin experienced significant downward pressure throughout the week. Following President Trump’s aggressive statements threatening to send Iran “back to the stone age,” cryptocurrency markets swiftly entered risk-off territory. Bitcoin descended below the $66,000 threshold, with the broader digital asset market shedding $440 million in value within hours. Simultaneously, crude oil climbed toward $120 per barrel as investors repositioned portfolios defensively.
Dogecoin experienced a 4.1% decline during the same market retreat. One significant holder withdrew $83 million from Bithumb exchange amid the volatility. XRP remained relatively unchanged around $1.33, sitting 45% beneath its peak from January, while March witnessed $31 million in outflows from spot ETF products.
Solana changed hands at $83, representing a 72% drawdown from its January 2025 zenith. Market observers have identified potential downside targets at $74 and potentially $50. Nevertheless, institutional liquidity provider B2C2 designated Solana as its principal stablecoin infrastructure, while the blockchain maintained its position as the leading network for decentralized exchange volume for seven consecutive months.
Iran Geopolitical Crisis Pushes Bitcoin Below Critical $66,000 Level
President Trump’s incendiary comments about sending Iran “back to the stone age” delivered a substantial blow to cryptocurrency valuations. Bitcoin surrendered previous session gains and broke through the $66,000 support level, with digital asset markets collectively hemorrhaging $440 million in rapid succession.
Geopolitical instability has been mounting throughout recent weeks. With crude oil prices nearing $120 per barrel, both cryptocurrency and equity investors have adopted defensive positioning across portfolios.
The liquidation cascade impacted virtually all major digital currencies. Dogecoin shed 4.1%, while XRP remained anchored near $1.33, a level maintained since February. Technical analysts are monitoring $1.12 as the next potential support threshold for XRP.
Quantum Computing Research Raises Alarm Over Bitcoin Security Vulnerabilities
A research paper associated with Google’s quantum computing division generated significant attention across the crypto community. The study calculated that sufficiently advanced quantum systems could theoretically compromise Bitcoin wallet encryption in approximately nine minutes—marginally faster than Bitcoin’s standard 10-minute block confirmation interval.
Existing quantum technology remains orders of magnitude away from achieving this capability. However, the findings have accelerated development timelines for quantum-resistant cryptographic protocols within the Bitcoin ecosystem.
Additionally, a Bitcoin address inactive since May 2014 transferred 500 BTC through five separate transactions this week. Several market observers speculated the owner might be migrating assets to enhanced quantum-resistant security infrastructure, although no official confirmation exists.
Metaplanet Accumulates Another 5,075 BTC During First Quarter
Metaplanet, Japan’s premier corporate Bitcoin accumulator, purchased 5,075 Bitcoin throughout Q1 2026. The company’s aggregate holdings have reached 40,177 BTC.
The organization has grown from zero Bitcoin holdings to exceeding 40,000 coins in fewer than 24 months. Metaplanet’s Bitcoin-per-share metric has consistently appreciated throughout this period, independent of equity price fluctuations.
Metaplanet’s acquisition program persists despite Bitcoin trading substantially below historical peak valuations. Company leadership has provided no indication of moderating its accumulation trajectory.
Coinbase Receives Preliminary OCC National Trust Approval
Coinbase obtained conditional authorization from the Office of the Comptroller of the Currency for a national trust company charter. This approval positions Coinbase alongside Ripple and Circle, which have secured comparable regulatory authorizations.
The charter framework designates a non-insured national trust company structure. Consequently, Coinbase will neither accept consumer deposits nor originate lending products. Authorized activities encompass custody solutions, staking infrastructure, and fiduciary services targeting institutional clientele.
Conditional status indicates the regulatory process remains incomplete. Nevertheless, this development represents meaningful progress toward Coinbase integration within the federal banking regulatory architecture.
Ethereum Foundation Executes Record-Breaking Staking Deposit
The Ethereum Foundation deposited 22,517 ETH into staking contracts this week, representing approximately $46 million at prevailing market rates. This transaction constitutes the Foundation’s largest individual staking commitment to date.
The transaction advances a comprehensive initiative to stake up to 70,000 ETH cumulatively. The Foundation approaches this strategic threshold.
Separately, BlackRock advanced preparations for launching a Bitcoin income ETF under the ticker BITA, submitting an updated filing with the SEC. The investment vehicle aims to generate yield while maintaining Bitcoin price correlation.

This complete guide explores the top Bitcoin and cryptocurrency casinos available to Cypriot players, highlighting their key features, game selections, and benefits.
We have personally tested and reviewed each site on the list, you can read our in depth reviews below.
Let’s dig in…
Top Bitcoin & Crypto Casinos Cyprus
- Massive game library with 11,294 titles from 63 providers
- Accepts 20 different cryptocurrencies with multiple network options
- Generous welcome bonus package worth up to $5,000 plus 75 free spins
- Unique dragon-themed loyalty program with rakeback up to 20%
- Comprehensive sports betting covering traditional sports and esports
- Fast crypto withdrawals processed within 24 hours
- Low minimum deposit of $1
- Provably fair games with verifiable outcomes
- User-friendly interface with intuitive navigation
- Massive selection of games
- Quality live dealer offering
- Crypto and fiat payment options
- Varied welcome offers and bonuses
- Up to 70% Rakeback + 10% Cashback
- Unlimited deposits and withdrawals
- Exclusive Thrill Original games
- 1500+ Casino Games from the Top Providers
- Truly anonymous and private gambling – no personal details or accounts required
- Innovative blockchain competitions with big ETH prize pools and NFT rewards
- Instant, fee-free deposits and withdrawals directly to/from your crypto wallet
- Instant Web3 withdrawals up to 100K USD
- Simple, user-friendly platform design with great mobile compatibility
- No KYC & VPN Friendly anonymous casino
- Zero fees, instant deposits & withdrawals
- 5,000+ casino games & sports betting without limits
- 10% Weekly Cashback
- Generous welcome bonus up to 1 BTC
- 8,000+ games including slots, casino, sports betting, crypto betting
- 470% Welcome Bonus & 400 Free Spins
- Supports 18+ major cryptocurrencies for deposits and withdrawals
- Smooth and user-friendly interface
- Massive selection of games
- Quality live dealer offering
- Crypto and fiat payment options
- Varied welcome offers and bonuses
- Large game selection with over 6,000 titles from top providers
- Generous crypto welcome bonus up to 50 mBTC
- Fast withdrawals through cryptocurrency support
- Slick, intuitive site design optimized for mobile
- Live chat provides quick customer support
- Huge selection of over 2,700 games from top providers
- Lucrative 200% deposit bonus up to €25,000
- Wide variety of cryptos supported
- Instant withdrawals
- Cutting-edge Telegram & WalletConnect integration
- Huge selection of over 9408 casino games from top providers
- Extremely generous 100% match welcome bonus up to 999 BTC
- Supports all major cryptocurrencies for payments
- Smooth and fast site with flawless mobile optimization
- 24/7 live chat and email customer support
- Truly anonymous and private gambling – no personal details or accounts required
- Innovative blockchain competitions with big ETH prize pools and NFT rewards
- Instant, fee-free deposits and withdrawals directly to/from your crypto wallet
- Instant Web3 withdrawals up to 100K USD
- Simple, user-friendly platform design with great mobile compatibility
- Massive game variety with over 6,000 slots, tables, specialty and live titles
- Huge sportsbook covering 40+ leagues including niche options
- Instant withdrawals to crypto wallets for fast access to funds
- Generous recurring sports betting promotional offers
- Large selection of over 3,300 casino games
- Lucrative welcome bonus up to 1,000,000 μBTC
- Instant Bitcoin deposits and fast payouts
- Cashback rewards and tournaments available
- Provably fair titles support transparent gameplay
- Wide game selection: Over 6,000 games from 70+ providers
- Generous welcome bonus: Up to 150% match on first deposit
- Daily cashback: 20% cashback on net losses
- Mobile-friendly responsive website
- 24/7 customer support via live chat and email
- Massive game library
- Generous promotions like 20% daily cashback
- Lucrative 4-part welcome package worth up to $8,000
- Cryptocurrency focus allows fast, secure and anonymous banking
- Huge selection of over 5,500 games from leading providers
- Lucrative two-tier welcome bonus up to $1,000
- Generous VIP program with escalating rewards
- Supports 9 major cryptocurrencies
- Instant withdrawals across all cryptos
- Lucrative 300% welcome bonus for new players
- Supports over 15 popular cryptocurrencies
- Huge selection of over 2,000 casino games
- Competitive odds and props available on 25+ sports leagues
- Highly Recommended by Blockonomi
- Huge selection of over 7,500 casino games from top suppliers
- Wide variety of sports betting markets across 20+ sports
- Generous 100% welcome bonus up to €500 for casino or €200 sports
- Multiple deposit and withdrawal methods including leading crypto
- Fast payout processing times
- Massive selection of over 3000 games from top providers
- Quick withdrawals, especially for cryptocurrencies
- Great recurring promos and VIP program for loyal players
- Mobile optimized – play anywhere on smartphone or tablet
- Huge selection of over 3,000 casino games
- Daily free spins and weekly cashback
- Tons of supported crypto and fiat currencies
- Fast, free payouts across payment methods
Best Bitcoin & Crypto Casinos Cyprus Reviews
ZunaBet
Zunabet
Welcome Bonus of 250% up to $5000 + 75 Free Spins
ZunaBet is a crypto casino offering over 11,000 games from 63 providers, extensive sports betting options across traditional and eSports, and a generous welcome package of 250% up to $5000 with 75 free spins
- Massive game library with 11,294 titles from 63 providers
- Accepts 20 different cryptocurrencies with multiple network options
- Generous welcome bonus package worth up to $5,000 plus 75 free spins
- Unique dragon-themed loyalty program with rakeback up to 20%
- Comprehensive sports betting covering traditional sports and esports
ZunaBet is a brand new crypto casino and sportsbook that launched in 2026. The site has over 11,000 games from 63 providers and accepts 20 different cryptocurrencies for deposits and withdrawals.
Key Features
- Massive Game Selection – ZunaBet offers 11,294 casino games including slots, table games, and live dealer options. Players can choose from titles by top providers like Pragmatic Play, Hacksaw Gaming, and Playtech.
- Crypto Payment Options – The casino accepts 20 cryptocurrencies including Bitcoin, Ethereum, Dogecoin, and multiple stablecoin options on different networks. Transactions process quickly, with most deposits confirming within minutes.
- Dragon Loyalty Program – Players progress through six tiers from Squire to Ultimate by wagering on games. Higher tiers unlock better rewards including up to 20% rakeback, 1,000 free spins, and VIP club access.
- Complete Sportsbook – The platform covers traditional sports like football, basketball, and tennis plus esports titles like CS2, Dota 2, and League of Legends. Live betting lets players wager as games unfold in real time.
- Mobile-Friendly Design – ZunaBet works on all devices through its responsive website and downloadable apps for iOS, Android, Windows, and MacOS. Players can access nearly all games and features from their phones or tablets.
ZunaBet delivers a solid gambling experience with its huge game library and modern cryptocurrency focus. The unique dragon loyalty program and generous welcome bonus make it worth checking out for both new and experienced players.
mBit Casino
mBit Casino
150% Welcome Bonus & 100 Free Spins!
mBit Casino is a feature-rich platform for online casino gaming, especially for Bitcoin players. The expansive games library and robust live dealer offering are definite strengths, while the comprehensive security measures provide peace of mind.
- Massive selection of games
- Quality live dealer offering
- Crypto and fiat payment options
- Varied welcome offers and bonuses
mBit Casino is a popular online gambling site focused on serving Bitcoin players. Established in 2014, this online casino offers over 2,600 slot games, more than 100 progressive jackpots, a large selection of table games and dedicated live dealer options.

mBit Casino accepts deposits and handles lightning-fast withdrawals using top cryptocurrencies like Bitcoin, Ethereum, and Litecoin. Players can also use traditional payment methods if preferred. The site advertises strong security and privacy standards for transactions.
New players are welcomed with a generous 3-part deposit bonus worth up to 5.5 BTC. There’s also a no-deposit bonus on sign-up. Regular players benefit from ongoing promotions, daily races, and an industry-leading 8-tier VIP program.
Key Points
- Huge selection of over 2,600 slot games from top developers like Amatic, Red Tiger Gaming, Play’N GO and Betsoft
- 100+ progressive jackpot slots with lucrative prize pools
- Wide variety of classic table games like blackjack, roulette, baccarat, dice games, etc.
- Immersive live dealer casino powered by Evolution Gaming’s software
- Generous welcome bonus package on first 3 deposits matched up to 110%
- Daily and weekly leaderboard promotions with prizes
- 8-tier VIP program providing bigger rewards for loyal players
- Supports deposits and fast withdrawals with major cryptocurrencies
mBit Casino stands out as a top-tier crypto-centered online casino platform with a lot to offer players. Its biggest strength is undoubtedly its vast games library with over 2,600 high-quality slots, table and live dealer titles from the best providers. This creates almost endless entertainment for every type of player.
Complementing the expansive gaming catalog is strong banking support for major cryptocurrencies like Bitcoin and Ethereum. Deposits and withdrawals are fast thanks to blockchain technology. mBit also provides privacy for players that want to remain anonymous.
With its exceptional game variety, crypto focus, and generous rewards programs, mBit Casino is a winning choice for any fan of online gambling.
Betplay
Betplay
Welcome Bonus Matches 100% up to 50 mBTC
With thousands of high-quality games, lucrative crypto bonuses, sleek mobile compatibility, and excellent customer support, emerging online casino Betplay delivers a polished, feature-rich experience catering to modern player preferences across devices.
- Large game selection with over 6,000 titles from top providers
- Generous crypto welcome bonus up to 50 mBTC
- Fast withdrawals through cryptocurrency support
- Slick, intuitive site design optimized for mobile
- Live chat provides quick customer support
Betplay is an emerging online crypto casino that aims to provide a modern, entertaining gambling experience through its extensive games library, lucrative bonuses, and slick platform design. Established in 2020 and licensed under a Costa Rica-based ownership group, Betplay offers over 6,000 titles across slots, table games, live dealer options and more from leading developers.

The site incentivizes new players with a generous 100% deposit bonus up to 50 mBTC while rewarding loyalty through weekly cashback and daily rakeback programs.
Betplay accepts major cryptocurrencies for fast, secure transactions and implements reasonable security controls around encryption and infrastructure monitoring.
With its expanding features and focus on user experience, Betplay shapes up as an intriguing new contender in the bitcoin casino space.
Key Points
- Offers over 6,000 casino games including slots, table games, live dealer games, and more from top providers like Microgaming and Evolution Gaming
- Lucrative welcome bonus of 100% deposit match up to 50 mBTC
- 10% weekly cashback on losses and daily rakeback rewards for loyal players
- Quick deposits and fast withdrawals through support of major cryptocurrencies
- 24/7 customer support via live chat and email with knowledgeable agents
- Allows play in free demo modes to try games risk-free before betting real money
For players seeking a modern, cryptocurrency-focused online casino, Betplay shapes up as an appealing option worth exploring.
Betplay makes a strong initial impression by getting the fundamentals right – offering a smooth, easily navigable platform across devices, expanding games library with titles from top studios, and reliable customer support response times.
The generous 100% welcome bonus matches competitors while daily rakeback and weekly cashback promotions cater to loyalty long-term.
Betplay has all the makings of a rising star worth betting on for crypto gamblers seeking quality gameplay and modern convenience.
Lucky Block Casino
Lucky Block Casino
Welcome Bonus of 200% match on first deposits up to €25,000
Lucky Block offers a world-class crypto casino and sports betting platform with thousands of games, generous rewards for loyal players, fast payouts, and an overall premium interactive gambling experience.
- Huge selection of over 2,700 games from top providers
- Lucrative 200% deposit bonus up to €25,000
- Wide variety of cryptos supported
- Instant withdrawals
- Cutting-edge Telegram & WalletConnect integration
Lucky Block is a new, feature-rich crypto casino making waves in the online gambling space since its launch in late 2022. Backed by an existing cryptocurrency brand, Lucky Block leverages its solid reputation to offer players a modern casino and sportsbook supporting popular cryptos like Bitcoin, Ethereum, and Tether for deposits and withdrawals.

Slick website design optimized for desktop and mobile coupled with around-the-clock chat support cement Lucky Block’s accessibility for crypto holders worldwide.
Key Points
- Large selection of over 2,700 casino games from 50+ top providers like NetEnt and Pragmatic Play, including slots, table games, jackpots, and live casino
- Generous welcome bonus of 200% match up to €10,000 plus 50 free spins
- Wide variety of 10+ cryptocurrencies supported for fast, anonymous deposits and withdrawals
- Instant crypto withdrawals processed directly to players’ wallets
- Lucrative loyalty program coming soon with cashback, birthday bonuses, and rewards for frequent players
- Innovative features like daily jackpot drops, lottery betting, and native LBLOCK token perks
Lucky Block emerged as one of our top recommendations for crypto gamblers seeking a leading destination supporting both casino games and sports betting with digital currencies
Backed by reputable licensing and a globally-recognized crypto brand, Lucky Block offers players a secure, legal platform to enjoy thousands of slots, jackpots, live table games, and betting markets across sports leagues like the NBA and esports tournaments
Fast and easy account setup via email or Telegram allows new players to claim a generous 200% welcome bonus up to €25,000 and start playing within minutes. Lucrative ongoing promotions and imminent loyalty perks provide recurring value for regular players
It’s a great place for gamblers, sports bettors and crypto enthusiasts – check it out!
CoinKings
CoinKings
100% Unlimited Welcome Bonus + 100 Free Spins
With a gigantic games selection, enormous 999 BTC welcome bonus, smooth performance on all devices, fast payouts, and 24/7 support, emerging crypto casino CoinKings emerges as a top destination.
- Huge selection of over 9408 casino games from top providers
- Extremely generous 100% match welcome bonus up to 999 BTC
- Supports all major cryptocurrencies for payments
- Smooth and fast site with flawless mobile optimization
- 24/7 live chat and email customer support
CoinKings is an exciting new cryptocurrency-focused online casino that aims to offer players a premium gaming experience.
Established in late 2023 by industry veterans, CoinKings brings together an enormous selection of over 9,408 casino games, generous bonus offers, smooth banking, and responsive performance across desktop and mobile.

With games delivered by major studios like NetEnt, Evolution Gaming, Pragmatic Play and more, enthusiasts of classic table games, poker, slots, live dealer tables, and other online gambling options will find top-quality entertainment catered at CoinKings.
Key Points
- Offers over 9,408 games from leading providers like NetEnt and Evolution
- Generous welcome bonus up to 999 BTC match + 150 free spins
- Accepts major cryptos for fast, anonymous payments
- Fiat currency deposits supported through integrated gateways
- Website and mobile apps optimized for all devices
- Lucrative loyalty program with 10 VIP levels
- Progressive jackpot games with big prize pools
After thoroughly testing and reviewing CoinKings’ offerings, there is no doubt this fresh new crypto gambling site establishes itself as a leading player in the market.
With its gigantic game selection from renowned studios, enormously generous 999 BTC welcome bonus and reasonable wagering terms, fast and smooth performance across all devices, and dedication to customer satisfaction through 24/7 support – CoinKings checks all the boxes.
For a fun, rewarding and polished crypto gaming environment with everything you expect from a top-rated operator, CoinKings belongs on the shortlist of casinos to join. With new titles, promotions and innovations surely on the horizon, savvy bettors would do well to secure their lucrative welcome bonus early at this rising star in crypto gambling.
Metawin
MetaWin
30% Extra Free on Every Deposit! Highest RTP. Instant payouts
MetaWin is a crypto casino that delivers anonymous & provably fair gambling by allowing users to connect a Ethereum wallet to access slots, table games, live dealers & more.
- Truly anonymous and private gambling – no personal details or accounts required
- Innovative blockchain competitions with big ETH prize pools and NFT rewards
- Instant, fee-free deposits and withdrawals directly to/from your crypto wallet
- Instant Web3 withdrawals up to 100K USD
- Simple, user-friendly platform design with great mobile compatibility
MetaWin is an exciting new decentralized online casino that offers a truly innovative and anonymous gambling experience on the Ethereum blockchain.

As the first-of-its-kind web3 cryptocurrency gambling platform, MetaWin allows users to connect their Ethereum wallet to access a great selection of casino games like slots, table games, live dealer tables, and more – all while maintaining complete privacy and security.
The site’s real innovation shines through its blockchain-based competitions where users can win big ETH prize pools and valuable NFTs from popular collections, with the results transparently determined by Ethereum smart contracts to guarantee fairness.
Key Points
- Truly innovative and anonymous online casino operating on the Ethereum blockchain
- Offers complete privacy as no account creation or personal information is required
- Allows players to connect their Ethereum wallet (e.g., MetaMask) to access games
- Hosts exciting blockchain-based competitions with opportunities to win big ETH prizes
- Chance to win valuable NFTs from popular collections like Beanz and Killabears
- Transactions and gaming activity occur on the secure Ethereum blockchain
- Players retain full custody of their funds in their private crypto wallets
MetaWin is truly at the vanguard of blockchain-based online gambling. By harnessing the power of the Ethereum blockchain, it delivers an anonymous, secure, and provably fair gaming experience like no other.
From the seamless wallet integration and instant payouts to the innovative smart contract competitions and opportunities to win big ETH prizes and coveted NFTs, MetaWin represents the future of web3 crypto casinos.
For crypto enthusiasts who have been awaiting a way to enjoy casino games while taking full advantage of the inherent benefits of decentralization, anonymity, and transparency, MetaWin is undoubtedly leading the way into this new frontier.
Jackbit
JackBit
100% Welcome Bonus + 100 Free Spins
A crypto gaming hub packing thousands of slots, live dealers, niche sports, and instant withdrawals alongside player anonymity, JackBit Casino delivers versatile entertainment and innovations.
- Massive game variety with over 6,000 slots, tables, specialty and live titles
- Huge sportsbook covering 40+ leagues including niche options
- Instant withdrawals to crypto wallets for fast access to funds
- Generous recurring sports betting promotional offers
JackBit is a premier crypto-based online gambling site that burst onto the scene in 2022, bringing a massive game selection and sportsbook. With intuitive navigation optimized for slots, specialty titles like lottery and arcade offerings, and extensive sports betting markets, JackBit utilizes blockchain protocols to enable instant anonymous payouts.

Players can easily deposit leading cryptocurrencies to access competitive odds and niche brackets across mainstream professional leagues and esports. And with the ability to withdraw winnings in under 10 minutes,
Key Points
- Launched in 2022, licensed in Curacao, over 6,600 games and 40+ sports
- Massive variety including slots, table games, live dealers, virtual sports
- Generous sports promotions like betting insurance and free plays
- Accepts 13 major cryptocurrencies with instant, anonymous payouts
- Overall robust, innovative crypto casino and sportsbook suitable for all
With its vast selection of thousands of games across every major gambling vertical paired with extensive sports betting markets, JackBit has firmly established itself as a premier one-stop entertainment hub since entering the scene in 2022.
Most importantly, by championing player privacy through anonymous accounts and lightning fast crypto payouts, JackBit pushes iGaming forward responsibly.
For these reasons, JackBit represents an exciting new option that both recreational punters and devoted bettors should evaluate to appreciate a refined, innovative destination catering to all play styles.
BSpin
BSpin
100% First Deposit Match Bonus Up To 1,000,000 μBTC.
With thousands of on-demand casino games, crypto-exclusive banking, and a polished mobile experience rich in rewards, BSpin positions itself as a premier licensed destination for Bitcoin gamblers.
- Large selection of over 3,300 casino games
- Lucrative welcome bonus up to 1,000,000 μBTC
- Instant Bitcoin deposits and fast payouts
- Cashback rewards and tournaments available
- Provably fair titles support transparent gameplay
BSpin is a licensed and regulated online casino launched in 2018 that specializes in crypto gambling, offering over 3,300 superb casino games playable with Bitcoin and other major digital currencies.
With an excellent 100% welcome bonus up to 1 million μBTC, instant deposits/withdrawals, and round-the-clock support, players benefit tremendously from BSpin’s focus on the crypto gaming experience.

Between generous promotional offers and the vast slots/tables selection, BSpin succeeds as a top-tier destination for Bitcoin gamblers worldwide.
Key Points
- Offers over 3,300 casino games including slots, table games, live dealer games from top providers like Evolution Gaming and Betsoft
- Lucrative 100% welcome bonus up to 1,000,000 μBTC plus free spins
- Fast Bitcoin deposits and withdrawals with no maximum limits
- Provably fair games that can be independently verified for fairness
- All players earn loyalty points to unlock better rewards like higher withdrawal limits
With its modern, mobile-friendly interface, enormous catalogue of over 3,300 games, lucrative crypto welcome bonus package, and unique rewards system, BSpin checks all the boxes as a premier licensed Bitcoin gambling site.
Players can expect fast deposits/withdrawals, high security, and 24/7 support as they enjoy the very best slots, tables, and live dealer action exclusively with leading cryptocurrencies.
Backed by proven fair gameplay and regulated transparency, BSpin appeals to all types of online casino fans seeking the advantages of blockchain-powered iGaming.
yBets
Ybets
Welcome bonus of 500% on the First 4 Deposits
Ybets Casino offers a modern, crypto-focused gambling experience with a vast game library, attractive bonuses, and comprehensive sports betting options, making it a promising choice for players seeking a diverse and innovative online casino platform despite its relatively recent launch in 2023.
- Wide game selection: Over 6,000 games from 70+ providers
- Generous welcome bonus: Up to 150% match on first deposit
- Daily cashback: 20% cashback on net losses
- Mobile-friendly responsive website
- 24/7 customer support via live chat and email
Ybets Casino is a modern online gambling platform that has quickly made a name for itself since its launch in 2023. Catering to the growing demand for cryptocurrency-friendly gaming options, Ybets offers a diverse and extensive selection of over 6,000 casino games from more than 70 software providers.

With a user-friendly interface designed for both desktop and mobile play, Ybets provides a seamless gaming experience across devices.
The casino attracts players with generous bonuses, including a substantial welcome package, and maintains their interest with regular promotions and daily cashback offers.
Key Points
- Modern crypto-focused online gambling platform launched in 2023
- Wide range of options including slots, table games, live dealer experiences, and sports betting
- Attractive welcome bonus offering up to 150% match, maximum $5,000
- User-friendly interface with intuitive design for both desktop and mobile devices
- Comprehensive sports betting section with competitive odds and live betting options
- Fast cryptocurrency transactions for both deposits and withdrawals
Ybets Casino stands out as a promising newcomer in the online gambling world, offering a fresh and innovative approach to digital gaming.
With its vast selection of games, user-friendly interface, and focus on cryptocurrency transactions, it caters well to modern players seeking variety and convenience.
The platform’s commitment to security, fair play, and responsible gambling, coupled with its attractive bonuses and responsive customer support, makes it an appealing choice for both casual players and seasoned gamblers.
Immerion
Immerion
500% Welcome Bonus & 400 Free Spins
Immerion Casino is a premier online gambling destination that offers an exceptional user experience, a vast game library from elite providers, innovative promotions like 20% daily cashback, and fully optimized cryptocurrency banking, all powered by a clean design and backed by legitimate licensing from Seychelles authorities.
- Massive game library
- Generous promotions like 20% daily cashback
- Lucrative 4-part welcome package worth up to $8,000
- Cryptocurrency focus allows fast, secure and anonymous banking
Immerion Casino is an exciting new online gambling destination that offers an exceptional user experience. From the moment you arrive, you’re greeted by a sleek, modern design and a massive library of over 6,000 high-quality games from elite providers like Pragmatic Play, Evolution Gaming, and Yggdrasil.
Whether you’re a slots enthusiast, table game fan, or enjoy the thrill of live dealer action, Immerion has something for everyone. The site truly shines with innovative promotions like 20% daily cashback on losses and the chance to win huge prizes like 5 BTC through the “Engine of Fortune.”

What sets Immerion apart is its focus on convenient cryptocurrency banking for lightning-fast, secure deposits and withdrawals without sharing sensitive personal information. The platform is fully optimized for seamless mobile play as well. With legitimate licensing and top-notch security, Immerion delivers a premium online gambling experience in a user-friendly package.
Key Points
- Vast game selection of over 6,000 titles from top providers like Pragmatic Play, Evolution Gaming, and Yggdrasil, covering slots, table games, live dealer games, and a sportsbook.
- Generous promotions, including a 4-part welcome bonus worth up to $4,000, 20% daily cashback on losses, and the “Engine of Fortune” promotion with a chance to win prizes like 5 BTC.
- User-friendly interface with advanced filtering options, making navigation and gameplay smooth across desktop and mobile devices.
- 24/7 multilingual customer support available through live chat, email, and telephone.
- Licensed and regulated by the Seychelles Financial Services Authority, ensuring legitimate and fair operations.
- Frequent tournaments with prize pools, adding an element of competition and chances for big wins.
Immerion Casino emerges as a top-tier online gambling destination that seamlessly blends an exceptional game library, innovative promotions, and a truly user-friendly experience. With over 6,000 titles spanning slots, table games, live dealer action and more from elite providers, players have an unparalleled selection at their fingertips.
Generous welcome offers and unique promotions like 20% daily cashback and the thrilling “Engine of Fortune” keep the excitement and value levels high. Immerion’s crypto-focus facilitates secure, anonymous banking with lightning-fast payouts, while its sleek design and intuitive navigation make for seamless gameplay across desktop and mobile.
Backed by legitimate licensing and prioritizing player security, Immerion has quickly established itself as a safe, rewarding, and entertaining option that exceeds expectations for the discerning online casino patron.
Flush
Flush
Welcome Bonus of 150% Match Up
Flush Casino is a top-tier crypto-only online casino featuring over 5,500 games, lucrative welcome bonuses up to $1,000, and instant payouts across 9 popular cryptocurrencies.
- Huge selection of over 5,500 games from leading providers
- Lucrative two-tier welcome bonus up to $1,000
- Generous VIP program with escalating rewards
- Supports 9 major cryptocurrencies
- Instant withdrawals across all cryptos
Flush Casino is a premier crypto-focused online casino launched in 2021 that has quickly established itself as a top destination for players seeking a modern, feature-rich gambling experience.

Fully licensed in Curacao, Flush Casino stands out by offering over 5,500 games from leading studios, lucrative welcome bonuses up to $1,000, instant crypto payouts across 9 currencies, and an industry-best 10-tier VIP program perpetuating rewards.
Key Points
- Lucrative two-tier welcome bonus can match up to $1,000 in deposits for new players
- Generous 10-tier VIP program provides escalating rewards like cash rebates, free spins, and luxury prizes
- Supports 9 popular cryptocurrencies for deposits/withdrawals (BTC, ETH, LTC etc)
- All crypto withdrawals processed instantly with no waiting time
Flush Casino delivers an exceptional crypto gambling experience that stands tall across the entire industry for new and veteran players alike. With an ever-growing catalog spanning over 5,500 diverse games from revered studios, everyone finds endless entertainment backed by the site’s strong responsible gaming initiatives.
Lucrative welcome offers followed by an unrivaled 10-tier VIP loyalty program perpetuate value over the long haul. Flush Casino also pioneers ultra-fast withdrawals using supported cryptocurrencies and blockchain technology for unmatched convenience.
Add seamless site navigation, 24/7 customer service, and mobile compatibility retaining full functionality, and Flush Casino simply has all the ingredients for accessible, secure and rewarding play sessions now and well into the future.
Coins.Game
Coins.Game
Welcome Bonus of 300% Deposit Match Up To $1,500
Coins.Game is a feature-rich crypto gambling site with a huge casino game selection, competitive sportsbook odds, lucrative welcome bonus, fast payouts, and excellent customer support, making it an appealing option for players globally.
- Lucrative 300% welcome bonus for new players
- Supports over 15 popular cryptocurrencies
- Huge selection of over 2,000 casino games
- Competitive odds and props available on 25+ sports leagues
- Highly Recommended by Blockonomi
Coins.Game is a new online gambling site making waves in the crypto space since its launch in 2022. This platform allows players worldwide to enjoy a feature-packed casino, sportsbook, and more using popular cryptocurrencies like Bitcoin, Ethereum, and Tether for deposits and withdrawals.

The site boasts an intuitive interface optimized for desktop and mobile, multiple crypto banking options with fast payouts, and dedicated 24/7 customer support.
Key Points
- Offers over 2,000 casino games including slots, table games, and live dealer
- Comprehensive sportsbook covering 25+ leagues with competitive odds
- Accepts 15+ popular cryptocurrencies for fast, anonymous payments
- Lucrative 300% first deposit welcome bonus up to $1,500
- Regular promotions like free spins, cashback, and reload bonuses
- VIP program unlocks cashback, prizes, and other perks
With over 2,000 total casino games, a full sportsbook and esports betting options, and support for a dozen cryptocurrencies – Coins.Game aims to be a one-stop shop for crypto gamblers.
The 300% first deposit bonus up to $1,500 provides new players with a lucrative head start. Regular promotional offers like free spins, cashback deals, and prizes give you plenty of reasons to stay active in the long run. For security, Coins.Game leverages encryption, firewalls, and fraud monitoring to protect your funds and data.
So if you’re looking for a full-featured Bitcoin and altcoin casino with leading slots, tables games, live dealers, virtual sports, and sportsbook betting under one roof – give this new gambling site serious consideration.
Betify
Betify
Welcome Bonus of 100% up to €500
With thousands of betting markets across dozens of sports and an endless collection of casino games, licensed gambling platform Betify offers members a robust, fully-featured one-stop shop for safe real money entertainment in a modern, mobile-friendly interface.
- Huge selection of over 7,500 casino games from top suppliers
- Wide variety of sports betting markets across 20+ sports
- Generous 100% welcome bonus up to €500 for casino or €200 sports
- Multiple deposit and withdrawal methods including leading crypto
- Fast payout processing times
Betify is a feature-rich online gambling platform offering a one-stop shop for sports betting, casino gaming, and unique specialty verticals. Betify provides members with safe access to wager on over a dozen sports and esports leagues supplemented by thousands of casino titles across slots, jackpots, live dealers and more.
-

Betify Homepage
Attractive welcome bonuses, around-the-clock support and lucrative loyalty perks further the appeal, making Betify an entertaining, rewarding destination for real-money entertainment spanning various player preferences under reputable governance.
Key Points
- Huge selection of over 7,500 casino games
- Extensive sports betting options
- Generous 100% first deposit bonus up to €500 for casino and 50% bonus up to €200 for sports
- Wide variety of secure banking options including bank transfer, credit cards, e-wallets, and leading cryptocurrencies
- Multi-channel 24/7 customer support
- Specialty products like social poker tables and volatile crash-style games
With over 7,500 casino games, extensive sports betting markets, and a modern mobile interface, Betify succeeds as a one-stop gambling site for entertainment.
Smooth website performance, intuitive navigation, lucrative ongoing promos and 24/7 customer service maintain enjoyment every step, from registration bonuses to requesting payouts.
For newcomers and passionate bettors alike seeking reputable, feature-rich real money experiences housing both essentials and unique alternatives like crash games and game shows, Betify’s unified platform impresses through choice diversity, business legitimacy and usability strengths prioritizing convenience.
7Bit Casino
7Bit Casino
Bonuses Up to 5 BTC Plus 300 Free Spins
7Bit Casino is a long-running, licensed online crypto casino with a huge games library, generous bonuses, and fast payouts across multiple traditional and digital currencies.
- Massive selection of over 3000 games from top providers
- Quick withdrawals, especially for cryptocurrencies
- Great recurring promos and VIP program for loyal players
- Mobile optimized – play anywhere on smartphone or tablet
As one of the longest-running crypto casinos online since 2014, 7Bit continues providing a premier destination for provably fair gambling and lightning-fast payouts.

Lucrative matched deposits continue through ongoing reload incentives, cashback deals and contest entries.
Across desktop and mobile, the platform focuses on usability from simplified verification to readily available customer assistance.
Key Points
- Over 3,000 games from leading providers like Betsoft and BGaming
- Lucrative welcome bonus up to 5 BTC plus 300 free spins
- Cryptocurrency support for fast, anonymous banking with BTC, ETH, LTC
- 8-tier VIP program with escalating rewards for loyal players
- Generous ongoing promotions like 25% Monday deposit match
- Instant payouts for withdrawal methods like Bitcoin and Ethereum
- Exclusive crypto games section provides unique gambling options
As one of the original Bitcoin-friendly online casinos since 2014, 7Bit Casino continues providing an enjoyable iGaming destination for crypto enthusiasts and traditional players alike.
Their Curacao license upholds legitimacy while a vast game selection from renowned studios guarantees entertainment across devices. Lucrative sign-up bonuses give way to recurring reload matches, cashback deals and contest entries incentivizing gameplay daily.
7Bit Casino has upheld the pillars of strong support, banking diversity and provably fair entertainment that made crypto casinos so revolutionary over the past decade for gamblers who value anonymity and instant transactions.
WildTornado
WildTornado is a leading online crypto casino that has offered a spectacular gaming experience to players worldwide since its launch in 2017.
With over 3,000 games from top-tier software developers and lucrative crypto welcome bonuses up to 1 BTC, WildTornado aims to satisfy both casual fans and serious gamblers alike.

The site excels in key areas like VIP rewards, mobile compatibility, versatile banking, and 24/7 customer support to cement its status as a top online gambling site for cryptocurrency users.
With sophisticated security measures in place and a proven track record, WildTornado delivers an exceptional casino product catering specifically to the growing crypto sector.
Key Points
- Licensed and regulated online crypto casino founded in 2017
- Offers over 3,000 casino games from leading providers like NetEnt and Microgaming
- Lucrative welcome bonuses up to 1 BTC + 100 free spins available
- Daily free spins, weekly cashback, and 7-tier VIP program for regular players
- Fast and free crypto transactions; payouts processed within 1 hour
- Supports numerous banking options including BTC, ETH, credit cards, e-wallets
- Fully optimized, attractive, and easy-to-use mobile experience
- 24/7 live chat provides excellent customer service with quick responses
- Uses SSL encryption and other security measures for a safe gambling site
- Allowed countries include Europe, Australia, Canada; restricted areas include the USA
- Established positive reputation over 5+ years with no major complaints
In closing, WildTornado stands out as a top-tier crypto gambling site thanks to its vast selection of games, lucrative BTC welcome bonus, responsively designed mobile experience, and excellent around-the-clock support.
With a track record of ethical operations spanning 5+ years, WildTornado instills confidence in players through cutting-edge security protocols and a commitment to transparent practices.
For newcomers and VIP bettors alike seeking a premier online casino catering specifically to cryptocurrency users, WildTornado delivers on all fronts. Their all-encompassing platform offers flexible banking, personalized rewards, and 24/7 assistance to complement robust gaming opportunities covering all genres.
Backed by a trusted foundation and optimized for user satisfaction across desktop and mobile, WildTornado makes a compelling case to rank among the very best in online crypto casinos worldwide.
Guide to Crypto Gambling in Cyprus
In recent years, the popularity of cryptocurrencies has soared, and with it, the emergence of crypto casinos. Cyprus, known for its vibrant gambling scene, has also embraced this new form of online gambling.
This guide will provide you with valuable insights into the best crypto casinos in Cyprus, as well as an overview of the legal landscape surrounding crypto gambling in the country.

What is a Crypto Casino?
A crypto casino operates similarly to traditional online casinos, but instead of using fiat currencies, they accept cryptocurrencies such as Bitcoin, Ethereum, and Litecoin.
Furthermore, the decentralized nature of cryptocurrencies allows for greater privacy and anonymity when playing at a crypto casino. Players can enjoy their favorite games without the need to disclose personal information, providing an added layer of security and confidentiality.
Benefits of Crypto Casinos
There are several advantages to playing at a crypto casino in Cyprus. Firstly, transactions are fast and secure since cryptocurrencies eliminate the need for third-party intermediaries. Additionally, crypto casinos offer provably fair games, ensuring that the outcomes are unbiased and transparent.
Another notable benefit of crypto casinos is the global accessibility they provide. Players from different parts of the world can easily participate in gaming activities without being restricted by geographical boundaries or traditional banking systems. This inclusivity fosters a diverse and vibrant community of players, contributing to the dynamic and evolving landscape of crypto gambling.

Crypto Gambling in Cyprus Laws
When it comes to the legality of crypto gambling in Cyprus, it is important to understand the current laws and regulations in place. Cyprus, known for its picturesque landscapes and rich history, is also making a mark in the digital world with its approach to cryptocurrency and online gambling.
The island nation of Cyprus, nestled in the eastern Mediterranean, boasts a unique blend of cultural influences and modern developments. This juxtaposition is reflected in its approach to crypto gambling, where traditional values meet cutting-edge technology.
Current Laws and Regulations
At present, Cyprus does not have specific laws governing crypto gambling. However, traditional online gambling regulations apply to crypto casinos operating within the country.
This means that these platforms must be licensed and regulated by the Cyprus Gaming and Casino Supervision Commission, ensuring player protection and fair gaming.
The Cyprus Gaming and Casino Supervision Commission, established to oversee the gaming industry in the country, plays a crucial role in maintaining the integrity of online gambling activities. By upholding stringent standards and monitoring compliance, the commission aims to safeguard the interests of both players and operators.

Future Predictions for Crypto Gambling Laws
As the crypto gambling industry continues to evolve, it is likely that Cyprus will introduce specific regulations tailored to this sector. These regulations will aim to address concerns such as money laundering and player protection, ensuring a safe and responsible gambling environment for all.
With its strategic location, vibrant culture, and progressive stance on technology, Cyprus is poised to navigate the complexities of crypto gambling with a forward-thinking approach.
Evaluating the Best Crypto Casinos in Cyprus
With numerous crypto casinos available in Cyprus, it is essential to know how to identify the best ones that meet your needs and preferences.
Cyprus has seen a surge in the popularity of crypto casinos due to their convenience and anonymity, offering players a unique and secure way to enjoy online gambling.
When looking for the best crypto casino in Cyprus, consider factors such as the variety of games offered. A top-tier crypto casino will provide a diverse selection of games, including popular options like slots, poker, blackjack, and roulette, catering to players with different preferences and tastes.

Key Features to Look For
When evaluating crypto casinos, there are several key features to consider. These include a wide variety of games, attractive bonuses and promotions, secure and anonymous transactions, responsive customer support, and a user-friendly interface.
A reputable crypto casino will offer enticing bonuses to new and existing players, creating an engaging and rewarding gaming experience.
Seamless and secure transactions are crucial when choosing a crypto casino. Look for platforms that support a range of cryptocurrencies and provide fast deposit and withdrawal processes. Anonymity is also a key factor for many players, so selecting a casino that prioritizes privacy and data protection is essential.
Safety and Security Measures
Safety and security should be a top priority when selecting a crypto casino. Look for platforms that utilize advanced encryption technology to protect your personal and financial information.
Reputable casinos should have their games audited by independent third-party agencies to ensure fair play. Trustworthy casinos will display their licensing and certification information prominently on their website, demonstrating their commitment to transparency and accountability.

How We Chose The Casinos on This List
Choosing the best crypto casinos in Cyprus involved a comprehensive evaluation process.
We considered various factors, including:
- Reputation and trustworthiness of the casino,
- Range of crypto gambling options available,
- Quality and security of the gaming platform,
- Customer support,
- Overall user experience.
- Variety of cryptocurrencies accepted,
- Availability of bonuses and promotions,
- Ease of deposits and withdrawals,
- Fairness and transparency of the gaming outcomes.
By taking all these factors into consideration, we were able to select the best crypto casinos Cyprus that provide a safe and enjoyable gambling experience for players.
How to Start Crypto Gambling in Cyprus
If you’re new to crypto gambling and want to get started, follow this step-by-step guide:
Step-by-step Guide to Getting Started
- Choose a reputable crypto casino that accepts players from Cyprus.
- Create an account by providing the necessary information.
- Select a cryptocurrency wallet and deposit funds into it.
- Transfer the desired amount of cryptocurrency from your wallet to the casino.
- Explore the wide range of games available and start playing.
- Ensure that the crypto casino you choose is licensed and regulated to guarantee a safe and secure gaming experience. Look for certifications from reputable authorities to ensure fair play and data protection.
Tips for Successful Crypto Gambling
While crypto gambling can be exciting, it is essential to keep a few tips in mind to enhance your chances of success. These include setting a budget, practicing responsible gambling, familiarizing yourself with the rules of the games you play, and taking advantage of bonuses and promotions.
Set limits on your gambling activities to prevent overspending and maintain control over your finances. Responsible gambling practices are crucial to enjoying the entertainment value of crypto gambling without falling into financial distress.

Conclusion
As the cryptocurrency landscape in Cyprus continues to evolve, so too does the world of online crypto gambling.
The Bitcoin and crypto casinos highlighted in this guide represent the best of this exciting intersection between digital currency and online gaming. They offer Cypriot players a unique blend of cutting-edge technology, enhanced privacy, and innovative gaming experiences.
Whether you’re drawn to the anonymity of crypto transactions, the potential for faster payouts, or simply the thrill of combining blockchain technology with casino games, these platforms open up a world of new possibilities for online gambling enthusiasts in Cyprus.
Good luck!
FAQs
Are crypto casinos legal in Cyprus?
The legal status of crypto casinos in Cyprus is complex. While online gambling is regulated in Cyprus, there are no specific laws addressing cryptocurrency gambling. Players should exercise caution and stay informed about current regulations.
How do I deposit cryptocurrency into an online casino?
To deposit cryptocurrency, you typically need to:
- Create an account at the casino
- Go to the cashier or deposit section
- Select your preferred cryptocurrency
- Copy the casino’s wallet address
- Send the desired amount from your personal wallet to this address
What cryptocurrencies are commonly accepted at online casinos?
Most crypto casinos accept Bitcoin (BTC), but many also support:
- Ethereum (ETH)
- Litecoin (LTC)
- Bitcoin Cash (BCH)
- Dogecoin (DOGE)
- Tether (USDT)
Are crypto casino winnings taxable in Cyprus?
Cryptocurrency regulations and taxation in Cyprus are evolving. It’s advisable to consult with a local tax professional for the most up-to-date information on how to handle crypto gambling winnings.
Are crypto casinos safe?
Reputable crypto casinos can be safe, but it’s crucial to do your research. Look for casinos with proper licensing, good user reviews, and transparent operations. Always use strong passwords and enable two-factor authentication when available.
What advantages do crypto casinos have over traditional online casinos?
Crypto casinos often offer:
- Enhanced privacy
- Faster transactions
- Lower fees
- Potentially better bonuses
- Provably fair games
What is a “provably fair” game?
Provably fair is a technology that allows players to verify the fairness of each game outcome. It uses cryptographic algorithms to ensure that neither the casino nor the player can manipulate the results.
Can I play at crypto casinos anonymously?
While cryptocurrencies offer a degree of privacy, most reputable casinos still require some form of identification for legal and security purposes, especially for large withdrawals.
How do I choose a reliable crypto casino?
Consider factors such as:
- Licensing and regulation
- User reviews and reputation
- Game variety and software providers
- Customer support quality
- Deposit and withdrawal options
- Bonus terms and conditions
TLDR:
- The Fed balance sheet grew by $18 billion in one week, reaching $6.675 trillion and rising again
- Treasury executed a $15 billion buyback, injecting liquidity into bond markets to maintain stability
- T-Bill purchases hit $381 billion, exceeding levels seen during the 2020 financial crisis period
- Lack of long-term bond buying and high uncertainty continue to limit chances of a strong bull run
The U.S. financial system is seeing fresh liquidity flows as central bank and Treasury actions expand balance sheets.
Recent data shows rising monetary support, although current conditions do not yet point to a clear market reversal or sustained bullish momentum.
Federal Reserve Balance Sheet Expands Again
A recent update shared by CryptoGoos noted that the Federal Reserve balance sheet increased by $18 billion in one week.
The total now stands at $6.675 trillion and continues to expand steadily. This shift follows the end of quantitative tightening in 2025, marking a return to balance sheet growth.
The data shows that the Fed never fully reversed its pandemic-era expansion. Instead, it stabilized at a higher baseline level.
That baseline is now rising again, reflecting renewed liquidity entering the system. While this growth signals easing financial conditions, it remains controlled rather than aggressive.
At the same time, short-term Treasury bill purchases are running at $381 billion. This level exceeds activity seen during the 2020 crisis period.
Such elevated buying suggests continued demand for short-term liquidity tools. It also shows that policymakers are maintaining support for market stability.
However, the nature of these actions matters. The current expansion does not involve large-scale purchases of long-term bonds.
Without that, the effect on broader financial markets may remain limited. Liquidity is present, yet it is not being deployed in a way that drives strong upward momentum.
Treasury Buyback Adds Support to Bond Markets
Alongside Federal Reserve activity, the U.S. Treasury recently completed a $15 billion debt buyback. This operation, finalized on April 2, 2026, marks the largest single buyback ever recorded. The move aimed to improve liquidity in the bond market and support smoother functioning.
According to the tweet, the buyback injected funds directly into the system. This helped stabilize conditions in the Treasury market, where liquidity can tighten during periods of uncertainty. By purchasing existing debt, the Treasury effectively increased cash flow within financial markets.
Even so, broader conditions remain mixed. The tweet notes that uncertainty across markets is still elevated. This limits the ability of liquidity injections to translate into sustained upward price action. Stability may improve, but confidence remains uneven.
Two key factors are still missing for a stronger market shift. There is no clear reduction in macro uncertainty at present.
In addition, the Federal Reserve is not actively buying long-term bonds. These elements often play a central role in driving major market cycles.
As a result, current measures may help hold markets in place rather than push them higher. Liquidity is returning, yet it is not at levels or forms that typically trigger a full bull run. For now, the system appears supported, though not positioned for a rapid reversal.
Crypto World
Algorand Breakout Gains Attention as Swiss Bank Post Finance Enables Direct ALGO Trading
TLDR:
- ALGO breaks key resistance near $0.12, signaling a shift from a prolonged bearish trend toward recovery
- Falling wedge breakout and MACD crossover indicate strengthening bullish momentum in the short term
- PostFinance enables direct ALGO trading, expanding access through regulated banking infrastructure
- Price stability above $0.12 remains crucial to sustain momentum and avoid a return to prior demand zones
Algorand’s native token ALGO is gaining renewed attention after a technical breakout coincided with increased institutional access.
Recent market structure shifts and banking integration have drawn focus to its evolving position within the broader crypto landscape.
Technical Structure Signals Momentum Shift
A recent tweet from market analyst Lucky @LLuciano_BTC outlined a notable shift in ALGO/USDT price action. The chart shows a move from a prolonged downtrend into a potential bullish phase. Over several months, price action followed a descending channel, marked by consistent lower highs and lower lows.
However, the structure began tightening into a falling wedge formation. This pattern often signals reduced selling pressure and possible reversal conditions.
As the wedge approached its apex, volatility declined, suggesting seller exhaustion. Price then broke above both the descending resistance trendline and the horizontal level near 0.12 $.
The breakout placed ALGO around 0.1213 $, marking a structural shift. The analysis also identified a demand zone between 0.0794 and 0.10$.
This zone held firmly during repeated tests, pointing to accumulation behavior. As a result, the breakout gained further technical backing.
Additional indicators support this shift. Bollinger Bands showed prior compression followed by expansion, often linked with trend transitions.
At the same time, the MACD indicator confirmed a bullish crossover, with momentum turning positive. These signals align with the observed breakout and suggest continued upward attempts if support levels hold.
Short-term resistance levels remain between 0.14$ and 0.16 $, while broader targets extend toward 0.20 and higher.
A projected move based on the wedge pattern places a potential upper range near 0.3360$. Still, price stability above the 0.12 level remains critical for continuation.
Banking Integration Expands Market Access
Alongside technical developments, adoption news has also emerged. A tweet from Collide @We_R_Crypto reported that Algorand is now available for direct trading through PostFinance.
This marks the first time a systemically important Swiss bank has enabled direct ALGO access from customer accounts.
This development reflects ongoing efforts to integrate digital assets into traditional financial systems. Customers of PostFinance can now buy and sell ALGO without relying on external crypto exchanges. As a result, access becomes more streamlined for users already within the banking network.
Moreover, regulatory clarity in Switzerland continues to support such integrations. The country has maintained a structured approach toward digital assets, allowing banks to expand crypto offerings within defined frameworks. This environment has encouraged institutions to explore additional blockchain-based services.
The integration also aligns with broader trends in real-world asset adoption and blockchain utility. While market participants continue to assess long-term outcomes, increased accessibility through established financial institutions remains a notable step.
At the same time, market conditions still require caution. Price action near upper Bollinger levels suggests possible short-term cooling.
A pullback toward the 0.115$–0.11$ range could occur before further movement. Maintaining higher lows will be important for sustaining upward structure.
Overall, ALGO’s recent price movement and institutional access update present two parallel developments. One reflects shifting market sentiment through technical patterns, while the other shows expanding availability through regulated channels.

It’s no longer free to use Claude through third-party tools like OpenClaw

Trump Threat: Bitcoin ($60,000 Incoming?)

County Championship: Spectators told to stay away after Storm Dave


-

 NewsBeat3 days ago
Steven Gerrard disagrees with Gary Neville over ‘shock’ Chelsea and Arsenal claim | Football
-

 Business2 days ago
No Jackpot Winner and $194 Million Prize Rolls Over
-

 Fashion2 days ago
Weekend Open Thread: Spanx – Corporette.com
-
Entertainment6 days ago
Fans slam 'heartbreaking' Barbie Dream Fest convention debacle with 'cardboard cutout' experience
-

 Crypto World4 days ago
Gold Price Prediction: Worst Month in 17 Years fo Save Haven Rock
-

 Tech6 days ago
The Pixel 10a doesn’t have a camera bump, and it’s great
-
Crypto World5 days ago
Dems press CFTC, ethics board on prediction-market insider trades
-

 Tech6 days ago
Avatar Legends: The Fighting Game comes out in July and it looks pretty slick
-

 Business3 days ago
Login and Checkout Issues Spark Merchant Frustration
-

 Sports12 hours ago
India men’s 4x400m and mixed 4x100m relay teams register big progress | Other Sports News
-

 Tech6 days ago
Apple will hide your email address from apps and websites, but not cops
-

 Sports5 days ago
Tallest college basketball player ever, standing at 7-foot-9, entering transfer portal
-

 Tech5 days ago
EE TV is using AI to help you find something to watch
-

 Politics6 days ago
Should Trump Be Scared Strait?
-

 Tech5 days ago
Flipsnack and the shift toward motion-first business content with living visuals
-

 Tech7 days ago
Elon Musk’s last co-founder reportedly leaves xAI
-

 Fashion6 days ago
The Best Spring Trends of 2026
-

 Tech5 days ago
How to back up your iPhone & iPad to your Mac before something goes wrong
-
Crypto World6 days ago
Bitcoin’s Six-Month Losing Streak: What On-Chain Data Says About the Market’s Next Move
-

 Politics6 days ago
BBC slammed for ignoring author of The Fraud
You must be logged in to post a comment Login