
Crypto World
Attention Economy Is Dying (Tokenized Value Is Replacing It)

Views Don’t Matter Anymore. Ownership Does.
For the last 15 years, the internet has run on a simple trade:
You give attention.
Platforms make money.
Every scroll, like, and click feeds an algorithm designed to extract one thing—your time. And while creators and users generate the value, platforms capture almost all of it.
That model is breaking.
Quietly, but decisively.
We’re moving from an attention economy to an ownership economy—and tokenization is the catalyst.
The Problem: Attention Is Extractive by Design
Traditional platforms don’t reward value—they reward engagement loops.
- Viral content beats meaningful content
- Clickbait beats substance
- Algorithms decide visibility, not creators
You don’t own your audience.
You don’t own your data.
You don’t even control distribution.
Even worse?
Creators are stuck in a system where:
- Monetization is gated (ads, sponsorships)
- Income is unpredictable
- Platforms can change rules overnight
You’re building on rented land.
The Shift: From Clicks → Ownership
Web3 flips the model.
Instead of extracting value from attention, it distributes value through ownership.
Tokens change everything because they turn users into participants, not products.
Now:
- Users can earn from the networks they contribute to
- Creators can own their communities directly
- Value flows back to the people generating it
This isn’t just monetization—it’s alignment.
Why Tokenized Value Is So Powerful
Tokens don’t just pay you—they represent your stake in a system.
That means:
1. Participation = Ownership
Providing liquidity, curating content, or even just being early can earn you a share of the network.
Your activity becomes capital.
2. Communities Become Economies
Instead of followers, you get stakeholders.
People aren’t just watching—they’re invested in growth.
That changes behavior:
- Less passive scrolling
- More meaningful contribution
- Stronger network effects
3. Value Is Transparent and Programmable
Smart contracts automate reward distribution.
No middlemen. No hidden rules.
If you add value, you get paid. Simple.
The Death of “Going Viral”
In the attention economy, success looks like this:
Millions of views. Minimal ownership.
In the tokenized economy, success looks like:
Smaller audience. Higher alignment. Real upside.
Virality becomes less important than economic participation.
Because:
- 1,000 aligned holders > 1,000,000 passive viewers
- A community that earns together stays together
The Next TikTok Won’t Sell Your Attention—It’ll Pay You
Imagine a platform where:
- You earn tokens for engagement
- Creators share upside with their audience
- Early users benefit from growth
- Algorithms are transparent—or even community-governed
This isn’t theoretical. It’s already happening in early forms across DeFi, social tokens, and on-chain platforms.
The difference?
These platforms don’t treat users as inventory.
They treat them as owners.
The Bigger Picture: Capital Becomes Labor
Here’s where it gets interesting.
In this new model:
- Your capital works like labor
- Your activity earns equity
- Your participation compounds over time
We’re moving from:
Work → Earn money
to:
Participate → Accumulate ownership
That’s a fundamental shift in how value is created and distributed online.
Final Thought
The attention economy isn’t dying because people stopped scrolling.
It’s dying because people are starting to realize:
They were never being paid what they’re worth.
The next phase of the internet isn’t about capturing attention.
It’s about rewarding contributions.
And in that world?
Views don’t matter.
Ownership does.
REQUEST AN ARTICLE


TLDR:
- Pi Network dominates mobile mining with a $1.85B market cap, controlling 95% of the $1.94B sector value.
- PI trades near $0.1795, rising 5.5% daily with $23.6M volume, showing growing market activity and attention.
- Protocol 22 upgrade deadline on April 27 introduces smart contracts, expanding network functionality and usage.
- Exchange outflows exceed inflows by 310K tokens, while 18M KYC users support steady ecosystem growth.
Pi Network continues to command the mobile mining sector, holding a dominant market share as price action strengthens.
The token trades near $0.1795, showing steady gains while upcoming network upgrades and events draw increased attention from market participants.
Pi Network controls mobile mining sector with strong market share
Pi Network remains the leading project in the mobile mining sector by a wide margin. Data shows it holds a $1.85 billion market cap, covering about 95% of the $1.94 billion category. This places Pi Network ahead of all competing mobile mining projects.
A recent tweet from BSCN reported that Pi Network is also the top trending and top-gaining coin in the segment. The update pointed to rising activity as Pi Network continues attracting attention across the crypto market. The tweet also noted growing trading volume and steady price movement.
Price action shows Pi Network trading near $0.1795, reflecting a 5.5% daily increase. The token also gained 3.8% over the past week, supported by $23.6 million in daily trading volume. These figures indicate renewed interest as traders monitor short-term movement.
At the same time, Pi Network benefits from its large user base. The project reports over 18 million KYC-verified users, which supports ongoing ecosystem growth. This user activity continues to support its position within the mobile mining sector.
Upgrade timeline and events support Pi Network momentum
Pi Network is approaching a key technical milestone with the mandatory Protocol 22 upgrade. The deadline is set for April 27, and it introduces support for smart contracts. This upgrade is expected to expand the network’s functionality and developer activity.
Alongside the upgrade, Pi Network founders Chengdiao Fan and Nicolas Kokkalis are scheduled to speak at Consensus 2026.
The event will take place in Miami in early May, drawing attention from industry participants. Their appearance places Pi Network in a broader market discussion.
Token flow data also shows a shift in supply movement. Exchange outflows have exceeded inflows by 310,000 tokens, suggesting reduced selling pressure. This trend often aligns with accumulation patterns as tokens move away from trading platforms.
In addition, token unlock pressure appears to be easing. This reduces short-term supply stress and may support more stable price movement. Combined with the upgrade timeline, Pi Network enters May with a structured setup.
Overall, Pi Network continues to hold a leading position in the mobile mining sector. Its market share, user base, and upcoming developments keep it in focus. As activity builds, Pi Network remains closely watched for further price movement.

TLDR:
- Strategy holds 815,061 BTC with an average cost near $75,528, maintaining a steady accumulation pace
- Recent purchases between $80K and $110K show continued buying despite higher Bitcoin price levels
- The firm remains in a modest unrealized profit as Bitcoin trades slightly above its average cost
- Over 100 purchases across cycles reflect a consistent Bitcoin accumulation approach without market timing
Michael Saylor has signaled continued commitment to Bitcoin, as new data shows ongoing accumulation by his firm.
The latest tracker presents sustained buying activity, a rising cost structure, and a position holding a modest unrealized gain.
Strategy Maintains Steady Bitcoin Accumulation Approach
The latest tracker data reflects a structured and ongoing Bitcoin accumulation approach, with purchases spread across different market phases.
The firm continues to add Bitcoin regardless of short-term price direction, maintaining a consistent acquisition pace.
A tweet shared by Michael Saylor hinted at another possible purchase, referencing the “Orange ₿eat Goes On.” The update also introduced the firm’s 16th 2026 tracker, reinforcing its ongoing Bitcoin accumulation activity.
The chart shows total holdings of 815,061 BTC, valued at about $63.46 billion. The average purchase price stands near $75,528 per Bitcoin, built through 107 separate buy transactions over time.
Orange dots on the chart mark individual purchases, showing activity during both market rallies and corrections. This pattern reflects a steady Bitcoin accumulation model rather than a reactive approach tied to market timing.
The average cost line continues to rise gradually, indicating that newer purchases occur at higher price levels. This trend signals continued participation in Bitcoin accumulation even as market prices increase.
Recent buying activity appears between the $80,000 and $110,000 range. This suggests the firm remains active in Bitcoin accumulation despite elevated price zones, maintaining consistency in its broader strategy.
Market Position Reflects Long-Term Bitcoin Accumulation Strategy
The firm’s current position sits slightly above its average cost basis, placing it in a modest unrealized gain range. This positioning supports the stability of its long-term Bitcoin accumulation strategy.
Holding above the average entry level may support continued confidence in the current position. At the same time, any movement below that level could influence short-term sentiment across the market.
With more than 800,000 BTC held, a portion of available supply remains out of active circulation. This level of Bitcoin accumulation reduces liquidity within the broader market environment.
Market behavior may respond more sharply during periods of rising demand due to reduced available supply. However, the firm continues to follow a structured Bitcoin accumulation approach rather than short-term trading adjustments.
Historical data from the chart shows no pause in buying activity during previous downturns. This pattern reflects a tolerance for volatility within the ongoing Bitcoin accumulation framework.
Future price movement above recent highs could expand unrealized gains tied to the current holdings. Meanwhile, stable price action near the average cost may support continued Bitcoin accumulation activity.
The tracker continues to document each purchase event, providing a clear record of long-term positioning. As a result, this Bitcoin accumulation strategy remains closely monitored within the market.
TLDR:
- DeFi losses topped $800M in April 2026, with incidents shifting from smart contract bugs to access control failures.
- Major losses included Kelp DAO $292M and Drift $285M, showing concentrated damage across leading DeFi protocols.
- Cross-chain bridges and admin roles emerged as key attack vectors, exposing weak governance and single points of failure.
- Despite improved smart contract security, poor key management and missing timelocks continue driving systemic DeFi risk.
The decentralized finance sector recorded one of its most severe periods in April 2026. Within just 26 days, DeFi losses in April 2026 crossed $800 million. The figures point to a shift in risk sources, moving away from smart contract errors.
Key Management Failures Replace Code Vulnerabilities
According to our Crypto Talk, the scale of DeFi losses in April 2026. The data showed major incidents across several protocols within a short period. Losses included $292 million from Kelp DAO and $285 million from Drift.
Other affected platforms included Grinex, Rhea Finance, and Volo, with smaller yet notable amounts. Even established names like CoW Swap and Silo reported losses. These figures reflect a broad issue rather than isolated events.
At the same time, smart contract bugs have dropped sharply. Reports indicate an 89% decline in such vulnerabilities. This shift shows that code audits and testing have improved across the sector.
However, the same cannot be said for operational security. Many affected protocols had completed audits before the incidents occurred. This raises questions about areas beyond code security.
DeFi losses in April 2026 now point toward failures in managing access and control systems. Weak key handling, poor role distribution, and missing safeguards appear repeatedly. These factors now dominate risk discussions within decentralized finance.
Bridges, Admin Roles, and Single Points of Failure
A closer look at the incidents reveals recurring patterns. Bridges remain a major target due to their complex design. Attackers often exploit weaknesses in cross-chain communication and validation processes.
Admin roles also present challenges when not properly secured. In several cases, single signers held critical authority over protocol operations. This creates a single point of failure that can be exploited.
Timelocks, which delay critical changes, were missing in some affected systems. Without them, attackers can act quickly after gaining access. This reduces the chances of intervention or recovery.
DeFi losses in April 2026 show how human decisions shape protocol safety. While smart contracts may function correctly, access control still depends on people. This includes how keys are stored and who can authorize changes.
The pattern across these incidents suggests a need for stronger governance frameworks. Multi-signature setups and layered permissions may reduce exposure. However, their adoption remains inconsistent across protocols.
As a result, DeFi losses in April 2026 continue to reflect gaps in operational discipline. The focus has shifted from code reliability to access management. This change marks a new phase in the assessment of risks.
The data from April presents a clear timeline of events. Multiple incidents occurred within weeks, affecting both large and small platforms. This clustering adds urgency to ongoing security discussions.
DeFi losses in April 2026 now serve as a reference point for evaluating risk priorities. The sector appears to be moving toward addressing human and structural weaknesses. This trend may shape future security practices across decentralized finance.
TLDR:
- PENGU/USDT holds a strong demand zone after three retests, forming a higher low that signals growing buyer strength
- Price is testing a long-term descending trendline, with a breakout likely to confirm a shift toward bullish momentum
- Fibonacci levels indicate upside targets at $0.015 and $0.020 as the price moves out of the accumulation phase
- Failure to break resistance could return the price to $0.006, keeping PENGU/USDT within its established range
PENGU/USDT is showing early signs of a possible trend reversal after holding a key demand zone for the third time.
The weekly chart structure now points to a shift from prolonged downside pressure toward a more constructive price setup.
Demand Zone Stability Strengthens Reversal Case
The recent analysis shared by Whale Factor points to a developing reversal structure on the PENGU/USDT weekly chart.
The post describes a classic accumulation pattern followed by a breakout attempt. It also notes that the asset has tested the same demand zone three times.
The $0.0045–$0.0060 range continues to act as a strong base. Each retest has produced a bounce, with the latest forming a higher low.
This pattern suggests buyers are stepping in earlier than before. As a result, PENGU/USDT is showing signs of gradual strength building within this range.
This demand zone has remained intact despite extended selling pressure earlier in the trend. The repeated defense of this level indicates sustained buyer interest. At the same time, the formation of a higher low suggests a shift in short-term structure.
In addition, the broader price trend had been bearish, marked by lower highs and lower lows. However, the current setup signals a possible transition phase. If support continues to hold, the structure may favor further upside attempts.
Trendline Test and Fibonacci Levels Define Next Moves
PENGU is now testing a descending resistance trendline that has capped prices since mid-2025. This level represents a key barrier that has rejected multiple bullish attempts. A clean breakout above this line would shift the broader trend outlook.
The current price sits near $0.0095, slightly above the demand zone. According to the shared chart, Fibonacci retracement levels outline potential upside targets. The first level to watch is around $0.015, followed by the $0.020 to $0.025 range.
These levels correspond to the 0.786 and 0.618 retracement zones. They often act as areas where price may pause or face resistance. If momentum continues, PENGU could move through these levels in a stepwise manner.
The projected path suggests a breakout followed by a brief pullback. After that, continuation toward higher levels may occur if buyers maintain control. This structure reflects a controlled upward movement rather than a sharp spike.
On the other hand, failure to break the trendline could shift focus back to support. A rejection at this level may push the price back toward $0.006. If the demand zone breaks, the current setup would no longer hold.
For now, the structure remains intact, with the trendline acting as the immediate decision point. Market participants are watching whether PENGU can sustain momentum above resistance or return to consolidation.
Crypto World
Powell’s Final FOMC: Grading His Wins, Losses, and the Mixed Bag He Leaves for Trump’s Fed Pick Kevin Warsh
Jerome Powell will gavel his last FOMC press conference on Wednesday, closing eight years atop the Federal Reserve with rates frozen at 3.50 to 3.75 percent and headline inflation back at 3.3%.
His successor, Kevin Warsh, Trump’s pick, walks into a corner office stacked with unfinished business, an oil-driven CPI spike, a $6.7 trillion balance sheet, and a crypto market that learned to live and die by Fed liquidity.
Powell vs Yellen: The Inheritance Gap
Janet Yellen handed Powell calm waters in February 2018. Rates sat near 1.5%, headline inflation hugged the 2% target, and the balance sheet was already shrinking by design.
Powell took over as a former lawyer and private equity executive, not an academic economist. He inherited a soft landing in progress and tried to keep it going with gradual hikes through 2018 before the trade war forced a pivot.
Yellen’s four years produced no recessions and almost no surprises. Powell’s eight years included a pandemic shutdown, the largest balance sheet in history, the worst inflation reading since 1981, and three regional bank failures inside ten days.
The Wins: From Pandemic Rescue to a Near-Soft Landing
Powell’s defenders point to March 2020 as his strongest hour. The Fed cut rates to zero, restarted asset purchases, and stood up nine emergency lending facilities in less than three weeks.
“Powell pushed back against some mild hawkish resistance to the jumbo emergency rate cut on March 15, 2020,” highlighted economist Nick Timiraos.
That liquidity wave saved markets and arguably saved Bitcoin’s first institutional cycle. Bitcoin (BTC) climbed from roughly $5,000 in March 2020 to a November 2021 peak above $69,000, tracking the expansion of the Fed’s balance sheet toward $9 trillion.
The second redemption arc came later. Powell ran the most aggressive tightening cycle since Paul Volcker, taking the policy rate from zero to 5.5% without triggering a deep recession or a labor collapse.
By late 2024 he also reframed the official tone on digital assets. At the DealBook Summit, Powell called Bitcoin “like gold, only it’s virtual,” a single sentence that helped push BTC above $103,000 inside a session.
“It’s just like gold only it’s virtual. People are not using it as a form of payment, or as a store of value. It’s highly volatile. It’s not a competitor for the dollar, it’s really a competitor for gold,” Powell said.
The Losses: Transitory Inflation and the Bank Scare
The “transitory” call of 2021 still defines the criticism. Powell waited until March 2022 to start hiking even as Consumer Price Index (CPI) prints exceeded 7%, a delay Warsh has called a “fatal policy error.”
“Once you let inflation take hold in the economy, it is more expensive and harder to bring it down, and so the fatal policy error going back four or five years is still a legacy that we are dealing with… we need a regime change in the conduct of policy,” stated Kevin Warsh, testimony before the Senate Banking Committee, April 21
Subscribe to our YouTube channel to watch leaders and journalists provide expert insights
The late start forced 11 hikes inside 16 months. That pace caught regional lenders flat-footed, and Silicon Valley Bank, Signature Bank, and First Republic all failed in March 2023 after losses on long-duration Treasuries.
“JAYPOW [Jerome Powell] might have broken US banking system. 2008 it was a banks portfolios of bad credit – aka subprime. 2023 it was banks portfolios of long duration bonds like UST and MBS??? If it goes down then remember Mar ‘20, big down, bailout, then big up! My body is ready,” said Arthur Hayes in a March 10, 2023 post.
Communication missteps deepened the damage. Forward guidance became a moving target through 2022 and 2023, and trader confidence in the Summary of Economic Projections dropped to multi-year lows.
Political bruises followed in 2025, when the Department of Justice opened and then dropped a probe of Powell that briefly froze Warsh’s confirmation calendar.
What is in the Bag for Trump’s Fed Chair Pick Kevin Warsh?
Warsh inherits a Fed running on tighter liquidity than markets had hoped. The federal funds target sits at 3.50 to 3.75% for a third straight meeting, and the March dot plot still pencils in only one cut for 2026 and one for 2027.
Inflation is moving the wrong way. CPI jumped to 3.3% in March from 2.4% in February after a 21.2% monthly spike in gasoline prices tied to the Iran war.
Policymakers lifted their 2026 core PCE projection to 2.7% from 2.4% in the same release.
Warsh has telegraphed a sharp pivot. He told senators at his confirmation hearing that the Fed needs a “different, new inflation framework,” signaled that he would scrap the post-meeting press conference cadence, and pledged not to act as anyone’s “sock puppet.”
He also wants the $6.7 trillion balance sheet smaller. Warsh argued under oath that a leaner Fed footprint could leave interest rates lower, inflation better, and the economy stronger.
All these language points toward faster quantitative tightening (QT) rather than rate cuts.
The Crypto Angle: Hawkish on Rates, Friendlier on Bitcoin
Crypto traders are sorting through a paradox. Warsh is more hawkish than Powell on inflation discipline yet more openly favorable on digital assets, and that combination cuts both ways for risk markets.
His public record now includes calling Bitcoin a “sustainable store of value,” ruling out a retail central bank digital currency (CBDC), and saying crypto is already part of the United States financial system.
He also disclosed more than $100 million in holdings spanning Layer 1 networks, Decentralized Finance (DeFi) protocols, and Bitcoin payment infrastructure.
Hawkish liquidity policy still pressures BTC in the short term. Bitcoin has retreated from its January peak as the dot plot hardened, and traders are increasingly caught between a Fed that wants to hold and a nominee who wants to shrink.
A longer-run case for Bitcoin lives inside the same trade. Former Fed governor Mark Spindel has argued that aggressive central bank policy strengthens the case for non-sovereign reserves, and Warsh’s framework could test that thesis from the inside.
What to Watch on Wednesday
The April 29 press conference will hand Powell his last microphone. Markets will parse every farewell line for:
- Hints about the cuts that did not arrive
- The inflation fight that is reigniting, and
- Whether Powell hands Warsh a clear baton or a contested one.
Powell can still stay on the Board of Governors until 2028, an option he has not ruled out.
If he steps fully aside on May 15, the next FOMC will be Warsh’s first, and the policy regime he wants to rewrite will start rewriting itself in real time.
Follow us on X to get the latest news as it happens
The post Powell’s Final FOMC: Grading His Wins, Losses, and the Mixed Bag He Leaves for Trump’s Fed Pick Kevin Warsh appeared first on BeInCrypto.

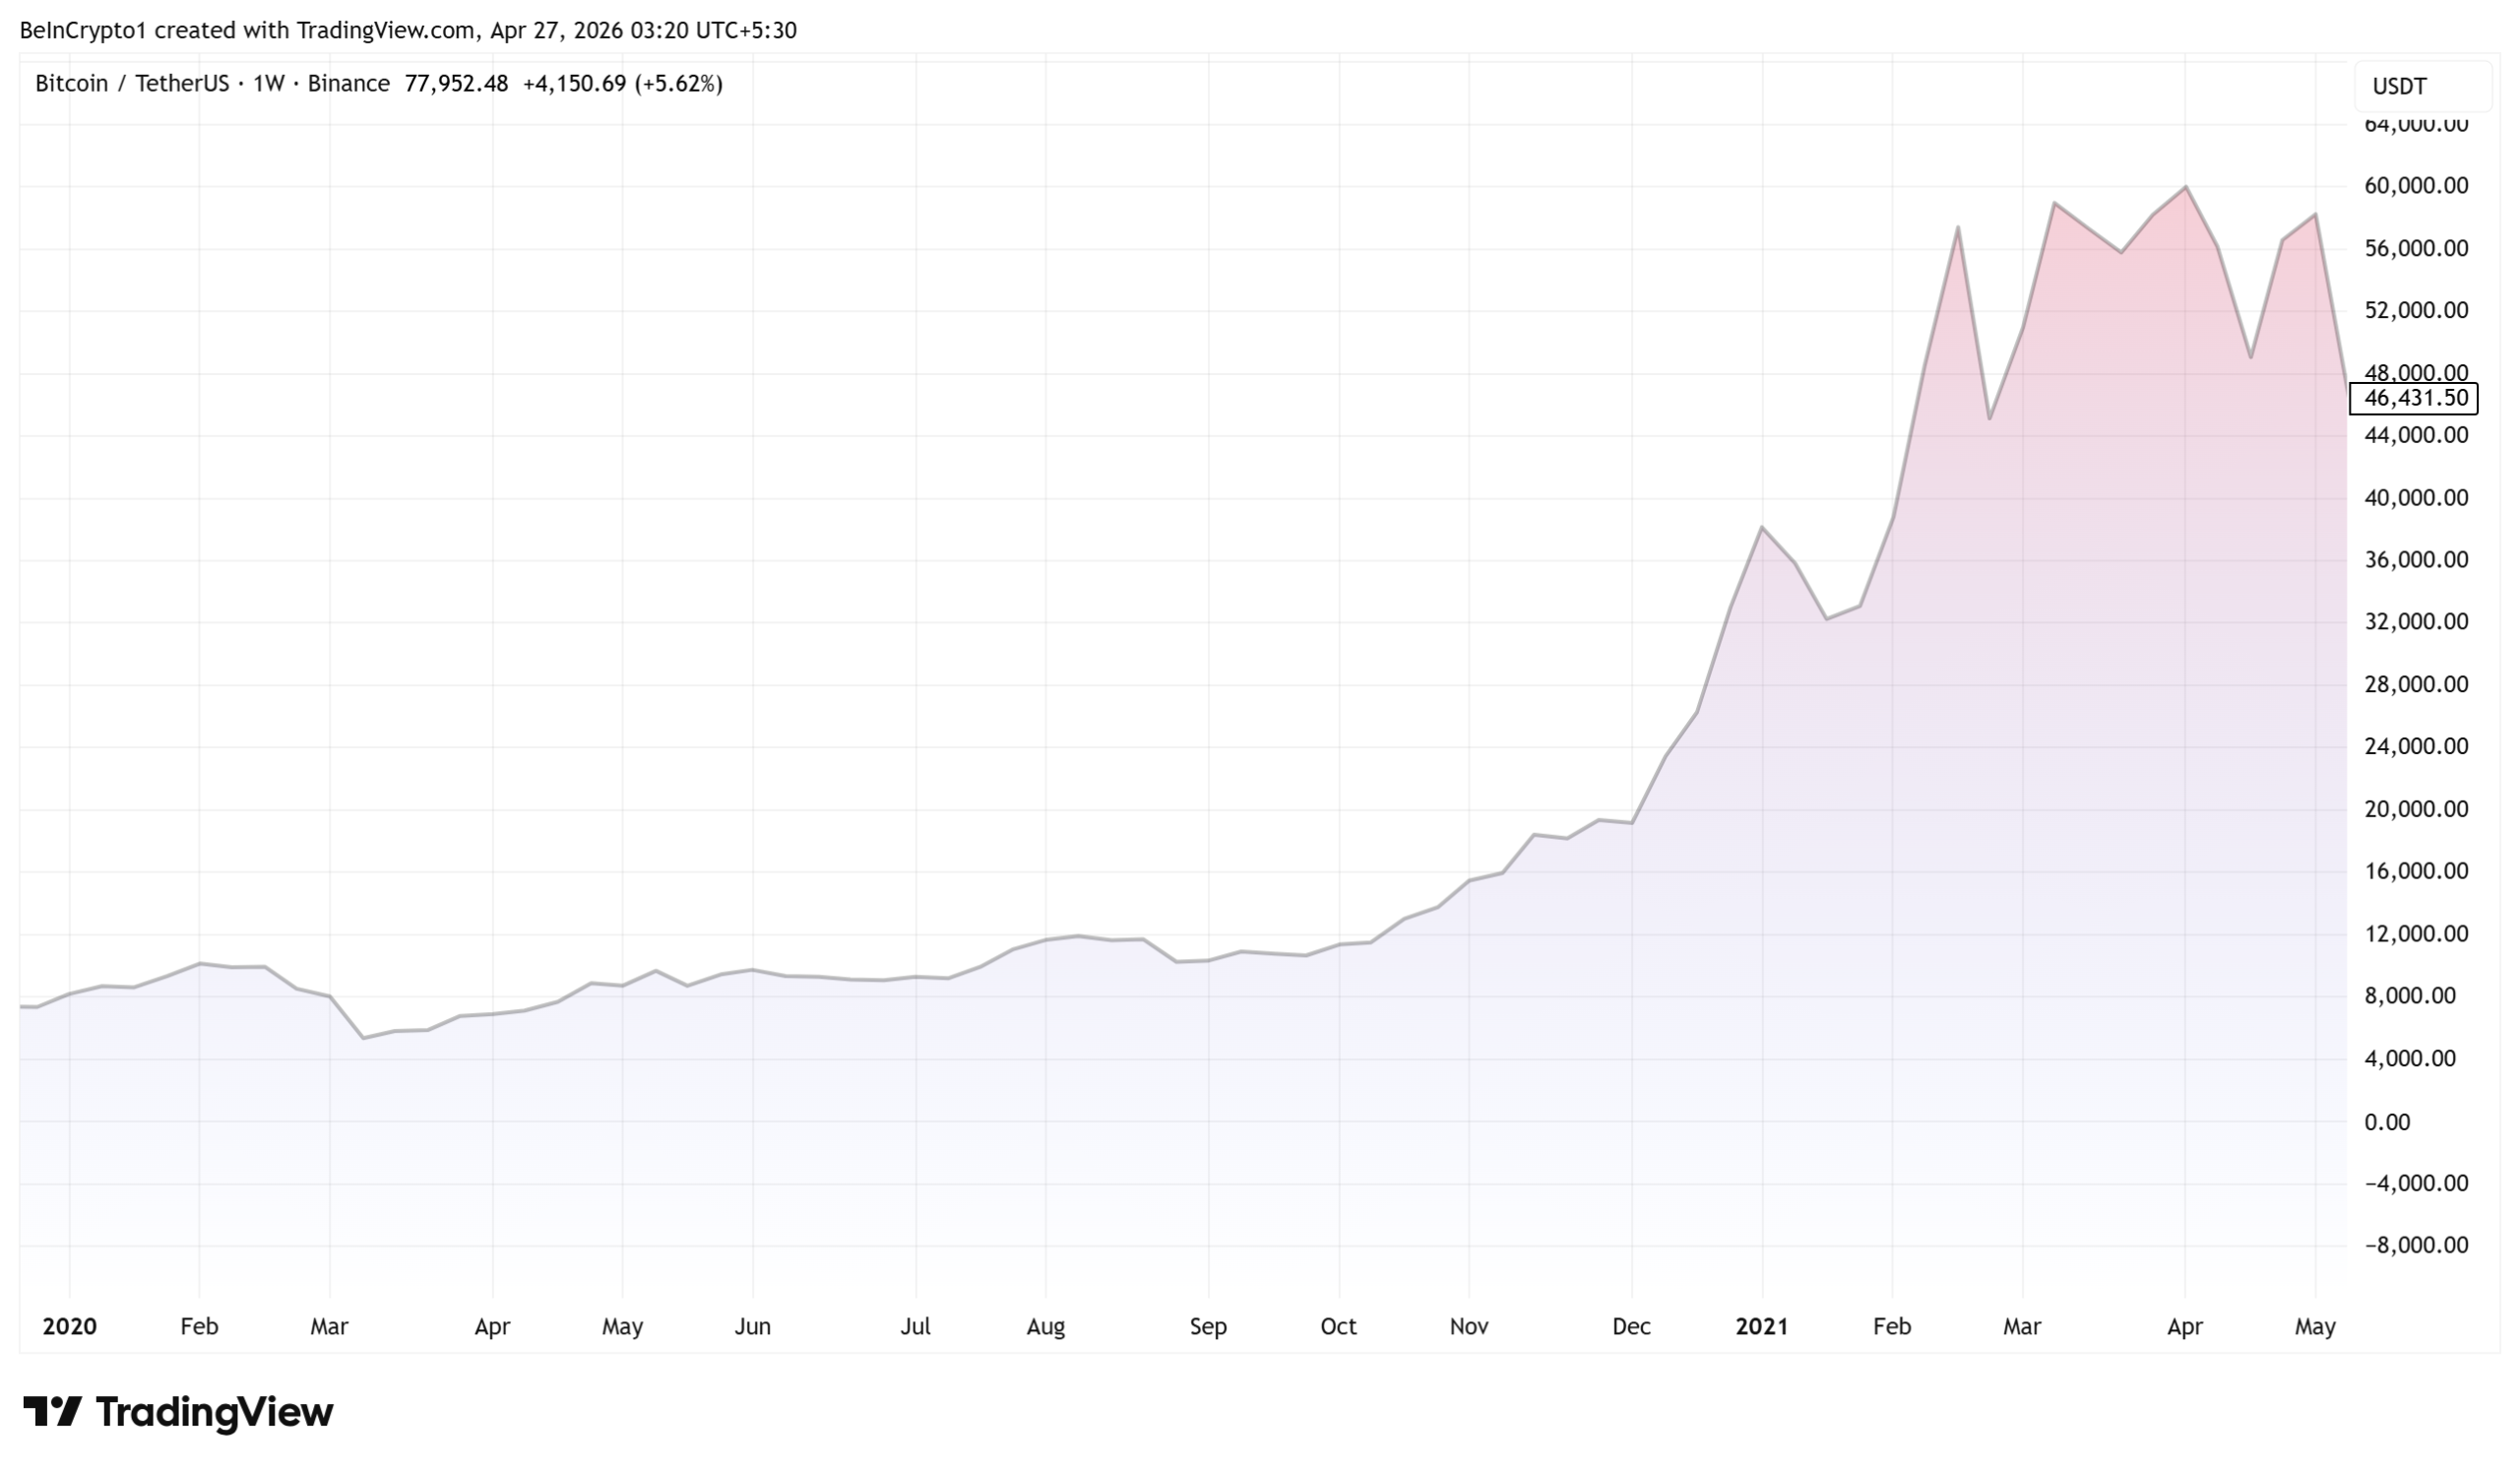
Bitcoin was “rejected” from the $80,000 price level, which is its next resistance zone on the way to reclaiming the $100,000 psychological price level.

Bitcoin has flashed another upward move, trading around the upper $70,000s after a roughly 13% surge since the start of April. Yet sentiment among holders remains unusually cautious, according to veteran analyst Matthew Hyland, who argues that the rally lacks genuine conviction and is instead being treated as a pendulum in a cautious market.
“There does not seem to be much euphoria or interest; many just projecting it to fit their bias,” Hyland said in a post shared on X over the weekend, underscoring a prevailing sense of disbelief even as prices push higher. The Bitcoin narrative remains dominated by a sense that the longer-term cycle could still tilt downward before any durable bottom forms.
Bitcoin consensus points to “another leg lower” by October
Hyland’s assessment sits against a broader view in which the market expects a further pullback before a potential capitulation or bottom. Even after a pullback to roughly $60,000 in February — about 53% off the October 2025 all-time high near $126,100 — a sizeable portion of traders still projects a cycle bottom later in 2026. The current price action has revived debates about whether a fresh down leg is imminent or whether the market is laying the groundwork for a sustained rally.
Bitcoin is currently hovering around $77,000, marking a gain of about 13% in the past month, according to data tracked by CoinMarketCap. The move comes as traders weigh whether the market is merely catching a breath before another leg higher or entering a phase of renewed volatility.
On the trading front, prominent trader Peter Brandt suggested on X that Bitcoin could print an “investable low” in September or October. He noted that the low may or may not breach the February 2026 trough, while maintaining a longer-term price range that could extend into the hundreds of thousands by 2029. The sentiment reflects a bifurcated view in which a durable bottom remains elusive, even as price action hints at renewed energy in the market.
Meanwhile, Michael van de Poppe, founder of MN Trading Capital, signaled no reason to doubt the ongoing rally, a stance that aligns with a subset of traders who view current price action as a continuation of an ongoing upcycle rather than the onset of a new bear market phase. The discord between skepticism and optimism highlights the clash between narrative and data in a market that has stubbornly defied easy categorization since last year.
Market bottoms don’t form when everyone expects them
The sentiment community has long warned against relying on consensus to time a bottom. Santiment, a crypto-market intelligence platform, argues that true market bottoms rarely emerge when a crowd is confidently forecasting them. In its recent notes, Santiment reiterated that bottoms tend to crystallize when the broader consensus has grown dangerously bearish about downside risk, rather than when traders insist prices must go lower. The caveat adds nuance to the debate around Oct 2026 timing and the possibility of a more protracted accumulation phase rather than an abrupt reversal.
In context, the market remains cautious but not paralyzed by fear. While some analysts point to technical milestones that could confirm a bottom, others warn that the absence of a crowded bottom signal can itself be a warning sign that selling pressure could re-emerge at any sign of a pullback.
As a backdrop to these debates, investors are weighing a range of historical benchmarks. Bitcoin’s fall from its late-2021 highs and the subsequent consolidation have kept market participants in a state of heightened sensitivity to macro shocks, regulatory developments, and shifts in liquidity. The $86,000 level has been flagged by some as a potential inflection point; a decisive move above that threshold could embolden bulls, while a failure to clear it might renew fears of a deeper correction.
What this implies for traders and builders
The current mood—ranging from cautious optimism to guarded skepticism—highlights a market that remains driven by both macro sentiment and on-chain signals. For traders, the risk-reward calculus hinges on whether Bitcoin can sustain its momentum and clear key resistance levels without triggering a renewed wave of profit-taking. For developers and builders in the space, the mood matters insofar as it shapes funding, network activity, and the pace at which infrastructure and use cases mature in a climate of mixed sentiment.
From a broader sector perspective, the disagreement among well-known voices underscores the fragility of timing signals in a market that has endured a choppy, multi-year cycle. The emphasis shifts from chasing a precise bottom to constructing robust strategies that can withstand a range of outcomes, including the possibility of a protracted accumulation or a fresh drawdown before facts on the ground can settle the narrative.
Where the story goes next
What remains uncertain is how quickly macro risk appetite will shift and whether a fresh catalyst can propel BTC above meaningful resistance, or whether a fresh risk-off impulse will undermine the rally. The next several weeks could be pivotal in confirming whether we are in a new leg higher, a consolidation phase, or a retest of February’s lows. In the meantime, market observers will be watching for price action around the $86,000 mark and any break above or below that threshold, along with evolving sentiment signals that could betray impending trend changes.
Readers should stay tuned to price action around critical levels, the pace of institutional inflows or outflows, and how consensus shifts in response to macro or regulatory developments. The coming months may offer clearer signals about whether the cycle is entering a fresh bullish phase or heading into a more extended period of indecision.
Crypto World
BeInCrypto Institutional Research: 15 Market Intelligence & Data Platform Behind On-Chain Visibility


Best Market Intelligence & Data Platform is an award category within The BeInCrypto Institutional 100, an annual research-driven program recognising institutional digital asset excellence across 26 categories and six pillars.
This category sits in Pillar 3: Access to Digital Assets. The 15 companies below are its longlist, drawn from data platforms serving institutional crypto intelligence workflows between April 2025 and March 2026.
A shortlist will be named in May 2026, and the winner will be announced at Proof of Talk in Paris on June 2–3, 2026.
- Longlist: 15 companies covering regulated indices, on-chain dashboards, wallet labelling, protocol financials, DeFi TVL, research platforms, and hybrid market data APIs
- Candidates screened: Starting pool of more than 30 data and intelligence providers across the global institutional crypto stack; 15 advanced to this longlist
- Scoring (Track A): Editorial quantitative 50%, Advisory Council 50%
- Criteria assessed: Data coverage and depth, institutional adoption, product innovation, research quality, funding and maturity, market standing, independence
- Sources: Company disclosures, press releases, regulator filings, and private-market data platforms, including PitchBook, Tracxn, and Crunchbase
| # | Company | Founded · HQ | Key People | Scale & Funding | Core Capability | Milestone |
|---|---|---|---|---|---|---|
| 1 | Kaiko | 2014 · Paris | Ambre Soubiran (CEO) | $1B valuation; $79M raised 15,000+ analysts in the network |
Institutional market data, indices | Benchmark provider for CBOE, D2X, Gemini Tokenized equities data partnership (2026) |
| 2 | Nansen | 2019 · Singapore | Alex Svanevik (CEO) Evgeny Medvedev (Co-founder) |
$88M+ raised; 170 employees 500M+ labeled wallets across 30+ chains |
On-chain analytics, wallet labeling | Nansen 2 AI platform launched $23B institutional liquidity report (2025) |
| 3 | Dune Analytics | 2018 · Oslo | Fredrik Haga (CEO) Mats Olsen (Co-founder) |
$1B valuation; $79M raised 15,000+ analysts in network |
SQL dashboards, on-chain analytics | smlXL acquisition (2024) Industry-standard query layer |
| 4 | Messari | 2018 · New York | Ryan Selkis (CEO) Dan McArdle (Co-founder) |
$61M raised; 137 employees 170TB enterprise data coverage |
Research, governance analytics | Crypto Theses 2026 published AI Copilot research tool launched |
| 5 | Glassnode | Zug, Switzerland | Leadership team | 7,500+ on-chain metrics 1,700+ assets covered |
On-chain data, derivatives analytics | Expanded derivatives coverage (2025) Joint research with Coinbase Institutional |
| 6 | CCData (CryptoCompare) | 2014 · London | Leadership team | FCA-regulated benchmark provider ISO 27001 + SOC 2 certified |
Market data, indices, benchmarks | Data feeds for Bloomberg and S&P ETF and ETP benchmark provider |
| 7 | Coin Metrics | 2017 · Boston | Talos (parent company) | Acquired by Talos (2025) $100M+ deal value |
Network data, indexing, feeds | Talos integration across execution stack Bletchley Index institutional benchmark |
| 8 | CoinGecko | 2014 · Singapore / KL | TM Lee (Co-founder) Bobby Ong (Co-founder) |
Independent data aggregator Millions of monthly users |
Market data aggregation, API | GeckoTerminal for DEX pricing Widely used independent pricing source |
| 9 | Arkham Intelligence | 2020 · United States | Miguel Morel (CEO) | 500M+ labeled wallets Binance Labs-backed |
Entity-labeled blockchain intelligence | Identified $25B US gov holdings Intel Exchange bounty model |
| 10 | DeFiLlama | 2020 · Open-source | 0xngmi (lead) Charlie Watkins (Co-founder) |
7,000+ protocols tracked $150B+ DeFi TVL coverage |
DeFi analytics, TVL aggregation | Standard TVL reference across industry Transparent methodology adoption |
| 11 | Amberdata | 2017 · Miami | Shawn Douglass (CEO) TongTong Gong (COO) |
$47M+ raised Backed by Franklin Templeton, Nasdaq |
Hybrid on-chain + market data API | AI-driven Amberdata Intelligence (2025) Unified institutional data platform |
| 12 | Token Terminal | 2019 · Helsinki | Henri Hyvärinen (Co-founder) Aleksis Tapper (Co-founder) |
Institutional subscription model Protocol financial datasets |
Protocol financials, valuation metrics | Standardized crypto financial statements Widely used in allocator reports |
| 13 | Artemis Analytics | 2022 · United States | Jon Ma (Co-founder) Michael Nadeau (Co-founder) |
Early-stage institutional platform Venture-backed |
Cross-chain fundamentals, metrics | Comparative blockchain dashboards Institutional research workflows |
| 14 | IntoTheBlock | 2018 · New York | Jesus Rodriguez (CEO) | Institutional client base ML analytics platform |
On-chain signals, DeFi risk | DeFi risk analytics for institutions Perseus enterprise analytics platform |
| 15 | Flipside Crypto | 2017 · Boston | Dave Balter (CEO) | $50M+ raised Community-driven model |
Analytics, ecosystem data bounties | Community analyst network insights Ecosystem data across L1s and L2s |
About This List
The BeInCrypto Institutional 100 — Market Intelligence & Data (2026 Long List) identifies the platforms providing data infrastructure for institutional crypto workflows. These firms supply benchmarks, analytics, research, and APIs used across trading desks, asset managers, and protocol teams.
Methodology
This category evaluates market intelligence and data platforms under Track A of the BIC 100 methodology: 50% quantitative metrics and 50% Advisory Council scoring.
Assessment spans seven criteria: data coverage and depth, institutional adoption, product innovation, research quality, funding maturity, market standing, and independence.
Data was verified using company disclosures, press releases, regulatory filings, and private-market sources, including PitchBook, Tracxn, and Crunchbase. Figures reflect the most recent available data at publication.
The post BeInCrypto Institutional Research: 15 Market Intelligence & Data Platform Behind On-Chain Visibility appeared first on BeInCrypto.
Crypto World
XRP Price Prediction Faces $1 Warning as Motley Fool Turns Bearish, But One Presale Keeps Growing
The XRP price prediction took a hit on April 25 after The Motley Fool published a warning telling investors not to buy the token until a major bank partnership is secured. XRP trades at $1.42 after falling 60% from its July 2025 high of $3.65, and the same week Morgan Stanley announced a dedicated fund to manage reserves for the stablecoin industry, according to CoinDesk.
Those numbers paint a clear picture. But nobody built lasting wealth buying large caps at resistance during a sideways market. The real returns came from finding the cheaper entry before the crowd arrived, and Pepeto’s presale at $0.0000001866 is attracting early money at a pace nothing else in 2026 has matched.
Bull runs never distribute gains equally. BTC leads, altcoins follow, and then early stage tokens deliver the outsized returns that rewrite portfolios in days. The proof lives on chain.
A single PEPE wallet that started with $2,184 across 1.5 trillion tokens saw the value peak near $43 million, with Lookonchain recording a $10.3 million cash out. Glauber Contessoto spent $180,000 on DOGE at $0.045 and hit seven figures within sixty days, per CNBC. A Dogwifhat position on Solana grew from $1,800 to $11 million, and one BONK holder converted $26,667 into over a million in less than seven days.
Not one of those projects shipped a product at launch. The outlook for XRP points to months of sideways trading, and April 2026 sits exactly 24 months past the 2024 halving. The window for presale entries is open right now.
XRP Price Prediction Compared: Pepeto and XRP (Ripple) in 2026
Pepeto: The Early Entry Every Cycle Rewards
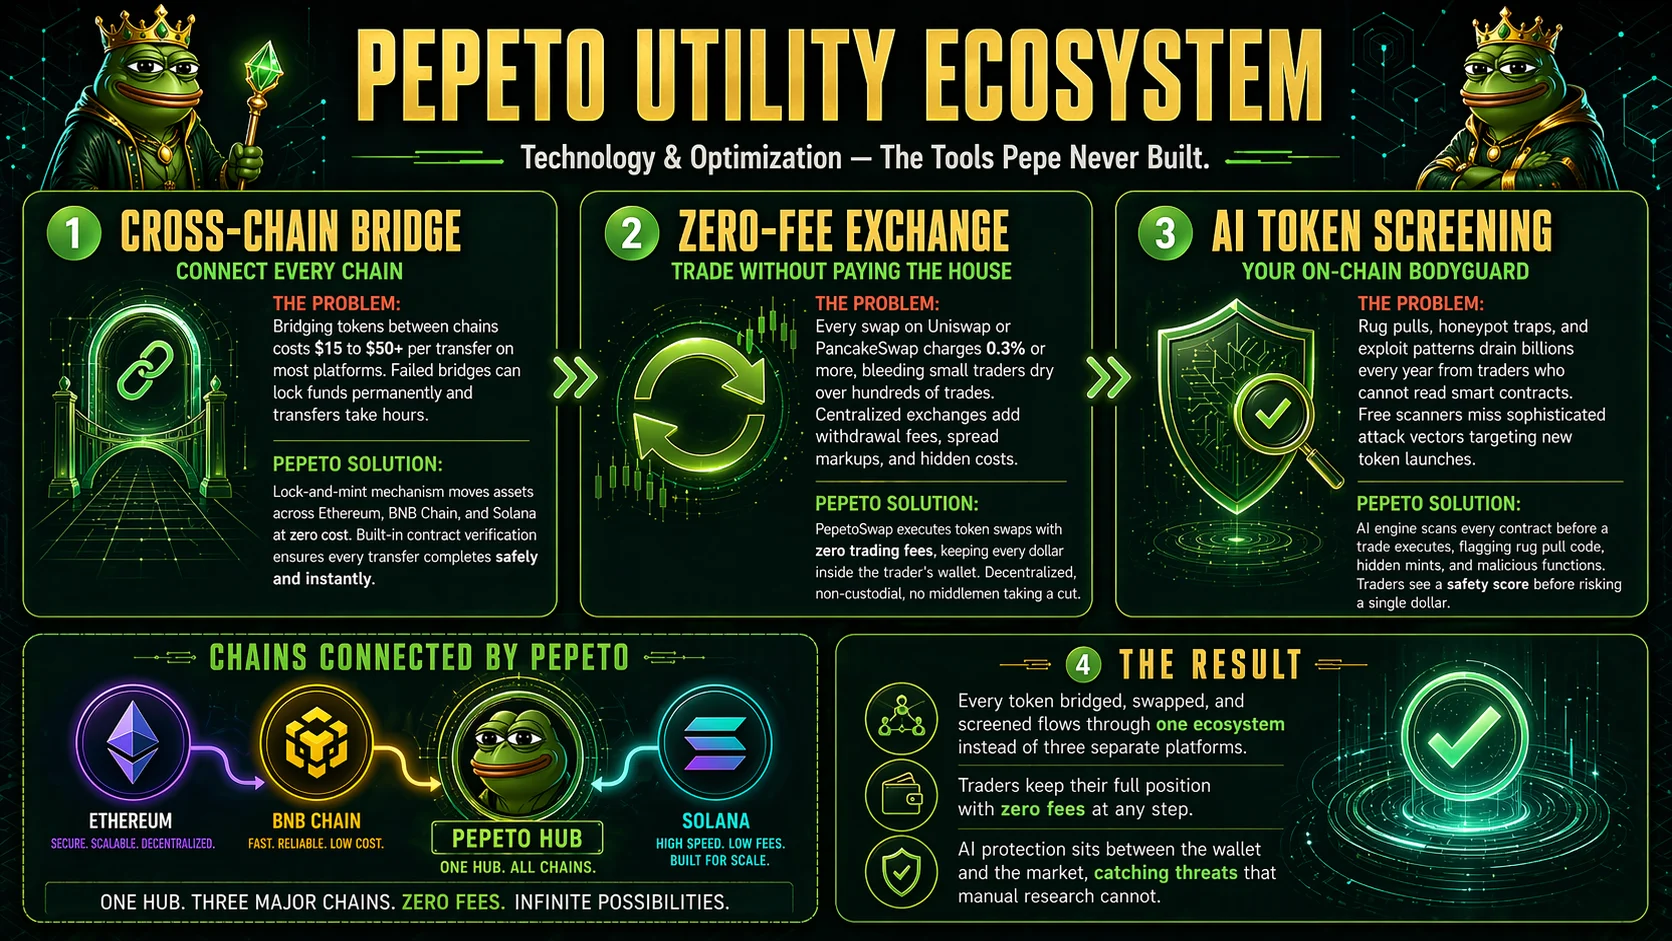
Every presale success story follows the same pattern: enter early, ride the move, take profit before the mainstream arrives. Pepeto fits all three conditions, and adds something those earlier tokens never offered. A working exchange with zero fee swaps, a cross chain bridge spanning Ethereum, BNB Chain, and Solana, and an AI scanner that spots dangerous contracts before capital touches them.
The developer who created the original Pepe token built this protocol from scratch, and a former Binance specialist runs the listing strategy toward an expected exchange debut.

SolidProof completed the audit before the raise opened, and more than $9.45 million has been committed while the Fear and Greed Index stays deep in fear, the same reading that pushed retail out before every previous major listing run.
Staking at 178% APY compounds daily while the XRP price prediction headlines play out on their own slow timeline. At $0.0000001866, the working exchange makes the listing target a floor rather than a ceiling. Wallets entering through the Pepeto official website now are positioning before the first public candle sets a price the presale will never see again.
XRP (XRP) Price at $1.42 as Triangle Squeeze Builds Near Breakout
XRP (XRP) trades at $1.42 on April 25, down 61% from its $3.65 all time high reached in July 2025, according to CoinMarketCap.
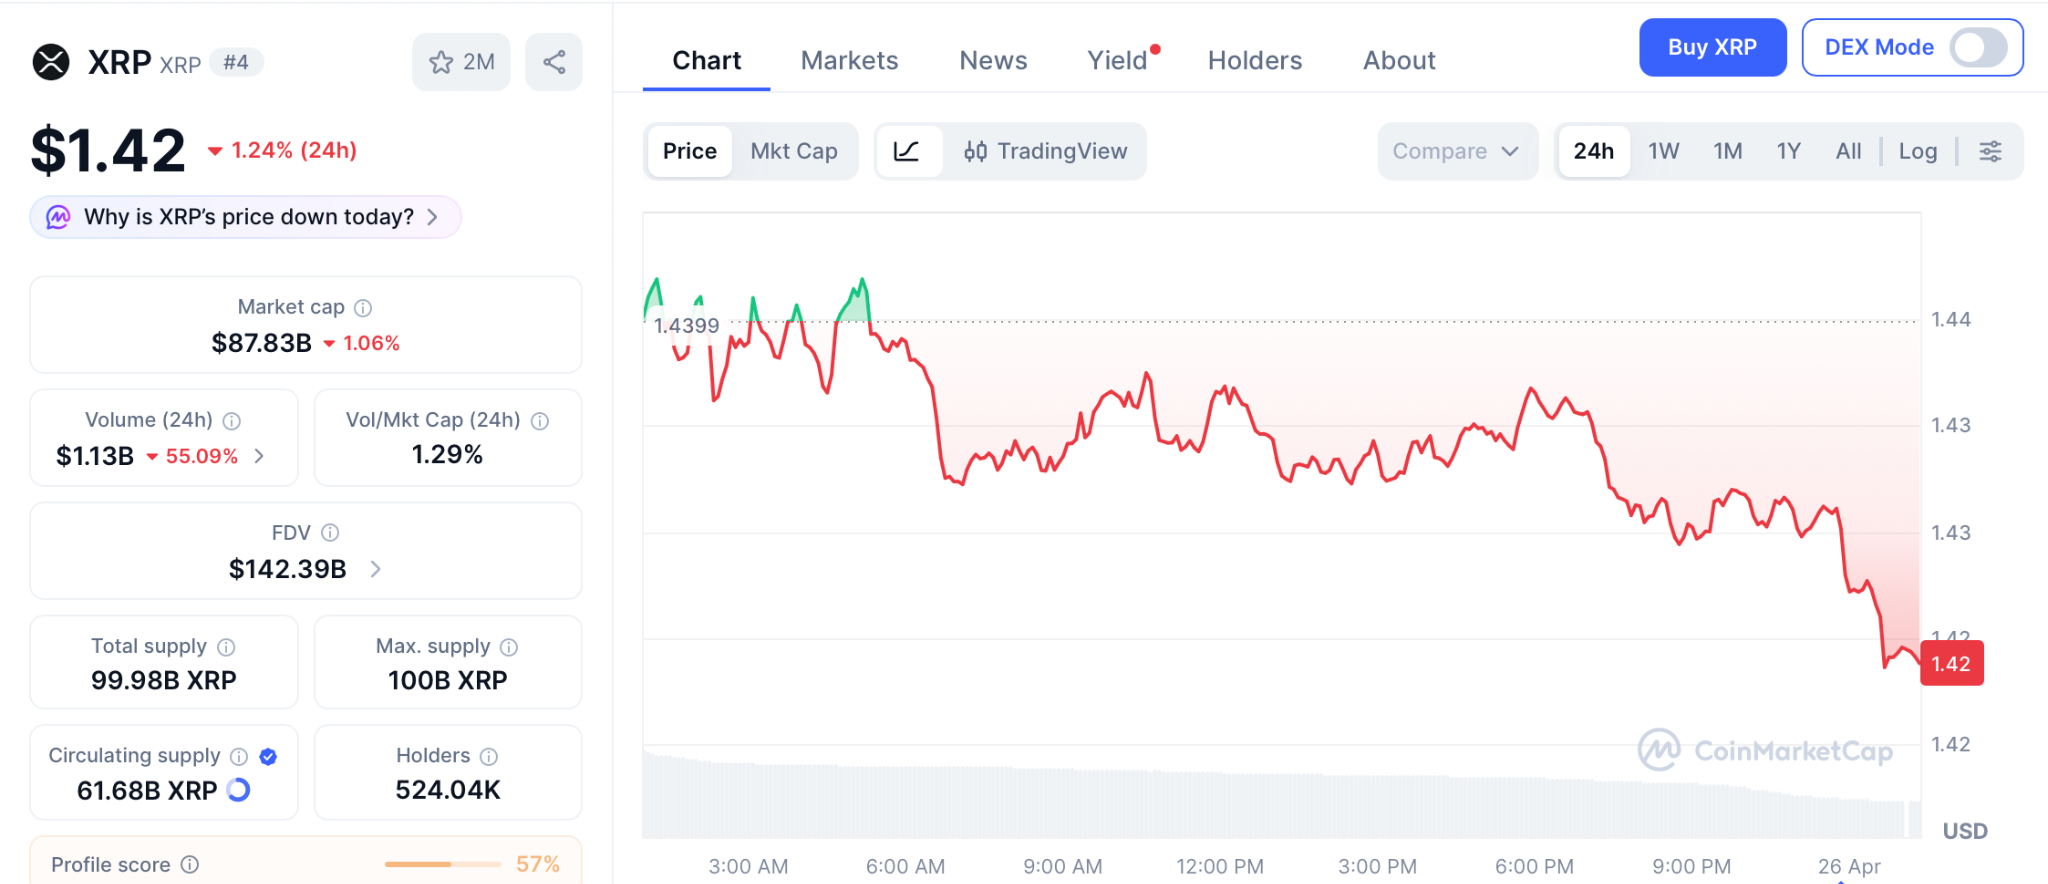
Spot XRP ETFs have attracted over $1.24 billion in inflows since late 2025, and the SEC classified XRP as a digital commodity in March 2026. But Ripple’s own stablecoin RLUSD threatens to replace XRP as a bridge currency. Support holds at $1.40 with resistance near $1.46, and roughly 60% of circulating supply sits at a $1.42 cost basis, creating a wall of sellers at every approach.
Conclusion:
Wallets adding Pepeto at presale pricing are positioned for the kind of returns the XRP price prediction needs years to deliver. The presale winner story follows the same pattern every time: a small group gets in early, the entry disappears, and the rest of the cycle is spent calculating what slipped away.
Pepeto carries the same BNB-era demand structure at presale pricing, paired with meme coin momentum no established token has offered this early in a cycle. The CoinMarketCap listing shows the Binance opening is close, the raise is at $9.45 million with 178% APY staking running daily, and the entry through the Pepeto official website is still open. Secure the position before the window closes.
Click To Visit Pepeto Website To Enter The Presale

FAQs
What is the XRP price prediction for 2026 after the 60% drop from all time highs?
The XRP price prediction for 2026 remains uncertain as the token trades at $1.42 with resistance at $1.46 and 60% of supply held at break even levels creating constant selling pressure. The Motley Fool warns investors to wait for a major bank partnership before buying.
Why is Pepeto drawing attention over large cap tokens like XRP right now?
Pepeto offers a presale entry at $0.0000001866 with an expected Binance listing, three working exchange tools, and a SolidProof audit, creating presale to debut returns that XRP at 61% below its all time high cannot generate from current levels.
Disclaimer: This is a Press Release provided by a third party who is responsible for the content. Please conduct your own research before taking any action based on the content.
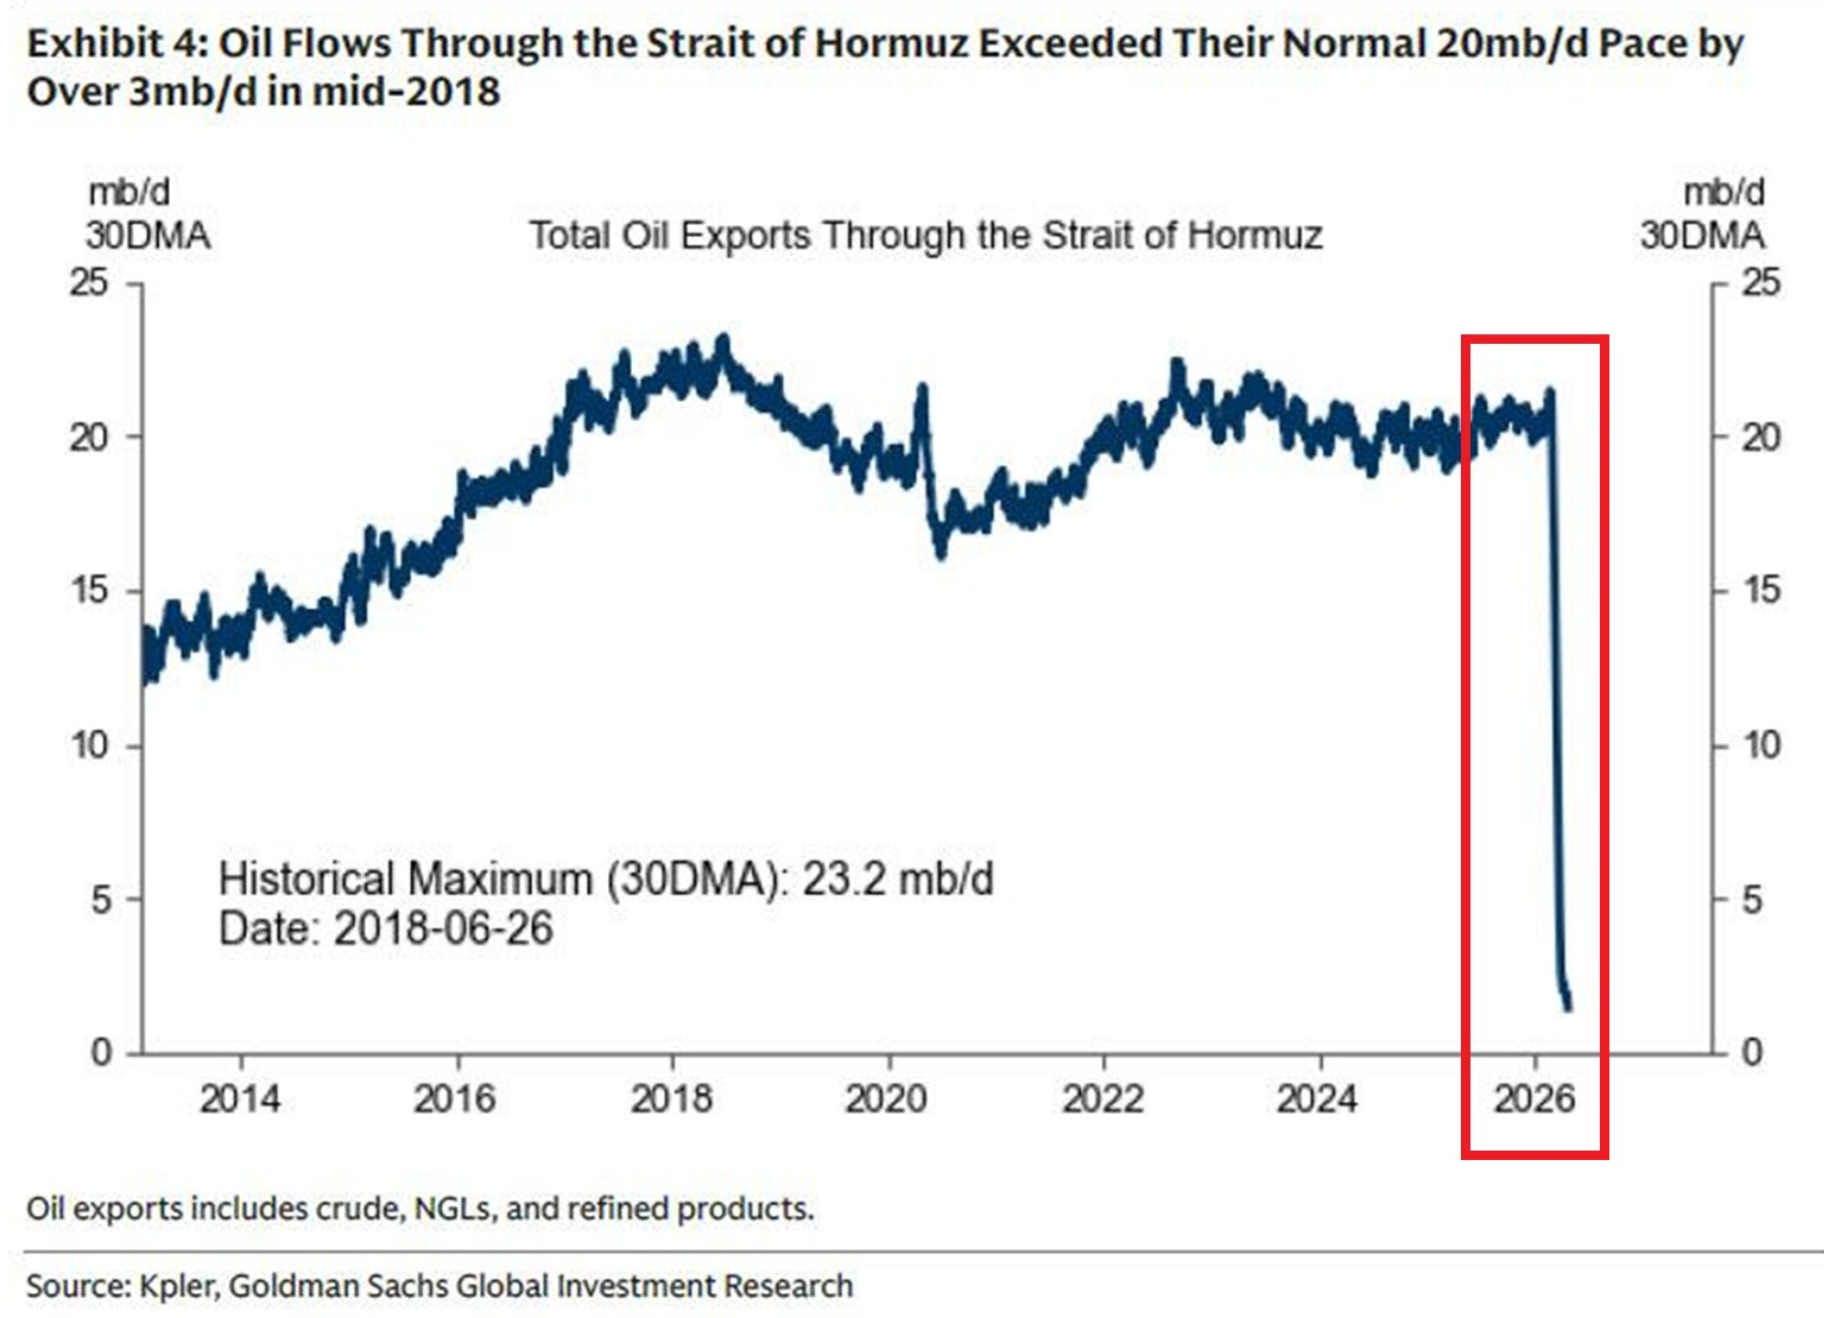
Iran’s parliament speaker pushed back at U.S. claims of energy leverage on Sunday, arguing Tehran still holds unplayed supply cards as Strait of Hormuz oil exports remain 95% below normal flows.
Mohammad Bagher Ghalibaf framed the standoff as a poker game of supply versus demand levers, taunting Washington that U.S. summer gasoline demand will amplify the price pain at home.
Ghalibaf Counters U.S. Bragging With Card-Counting Math
Ghalibaf is a hardliner and former Revolutionary Guards commander who often addresses global traders. His latest message answers Washington officials boasting about superior energy leverage.
He laid out a balance sheet equating supply cards with demand cards. Iran’s side covers the Strait of Hormuz, Bab el-Mandeb, and regional pipelines.
He marked Hormuz as partly played, while Bab el-Mandeb and pipelines remain unused. The U.S. side already deployed Strategic Petroleum Reserve releases and absorbed some demand destruction.
However, his sarcastic closer warned Americans will not cancel summer vacations, so the bill will land at the gas pump.
“Add summer vacation to the right unless they want to cancel it for the US!”
Per Ghalibaf, the punchline targets U.S. peak driving demand from May through September.
Goldman Sachs Confirms Historic Supply Shock
Goldman Sachs data showing the depth of the disruption. Total oil exports through Hormuz have collapsed roughly 95% from normal flows near 20 million barrels per day.

Gulf crude production has fallen by about 14.5 million barrels per day, or 57% versus pre-war levels. Available empty tanker capacity in the region is down by half, equal to about 130 million barrels of slack.
However, Goldman analysts caution that recovery hinges on pipeline capacity, available tankers, and well flow rates.
They estimate only 70% of lost supply returns within three months of any reopening, and 88% within six months.
Extended shut-ins risk reservoir damage, raising the chance that full restoration takes several quarters.
Trump Pitches U.S. Crude as Pain Drags Into Summer
Meanwhile, President Donald Trump has rejected the idea that Washington lacks leverage. He argues the U.S. produces more oil than Russia and Saudi Arabia combined and rarely imports through Hormuz.
Trump has urged China and European buyers to redirect orders to American producers. He has also told U.K. allies to drill in the North Sea, while defending his “Drill, Baby, Drill” agenda.
In contrast to past crises, he has warned voters that pump prices may stay elevated and could rise before the November midterms.
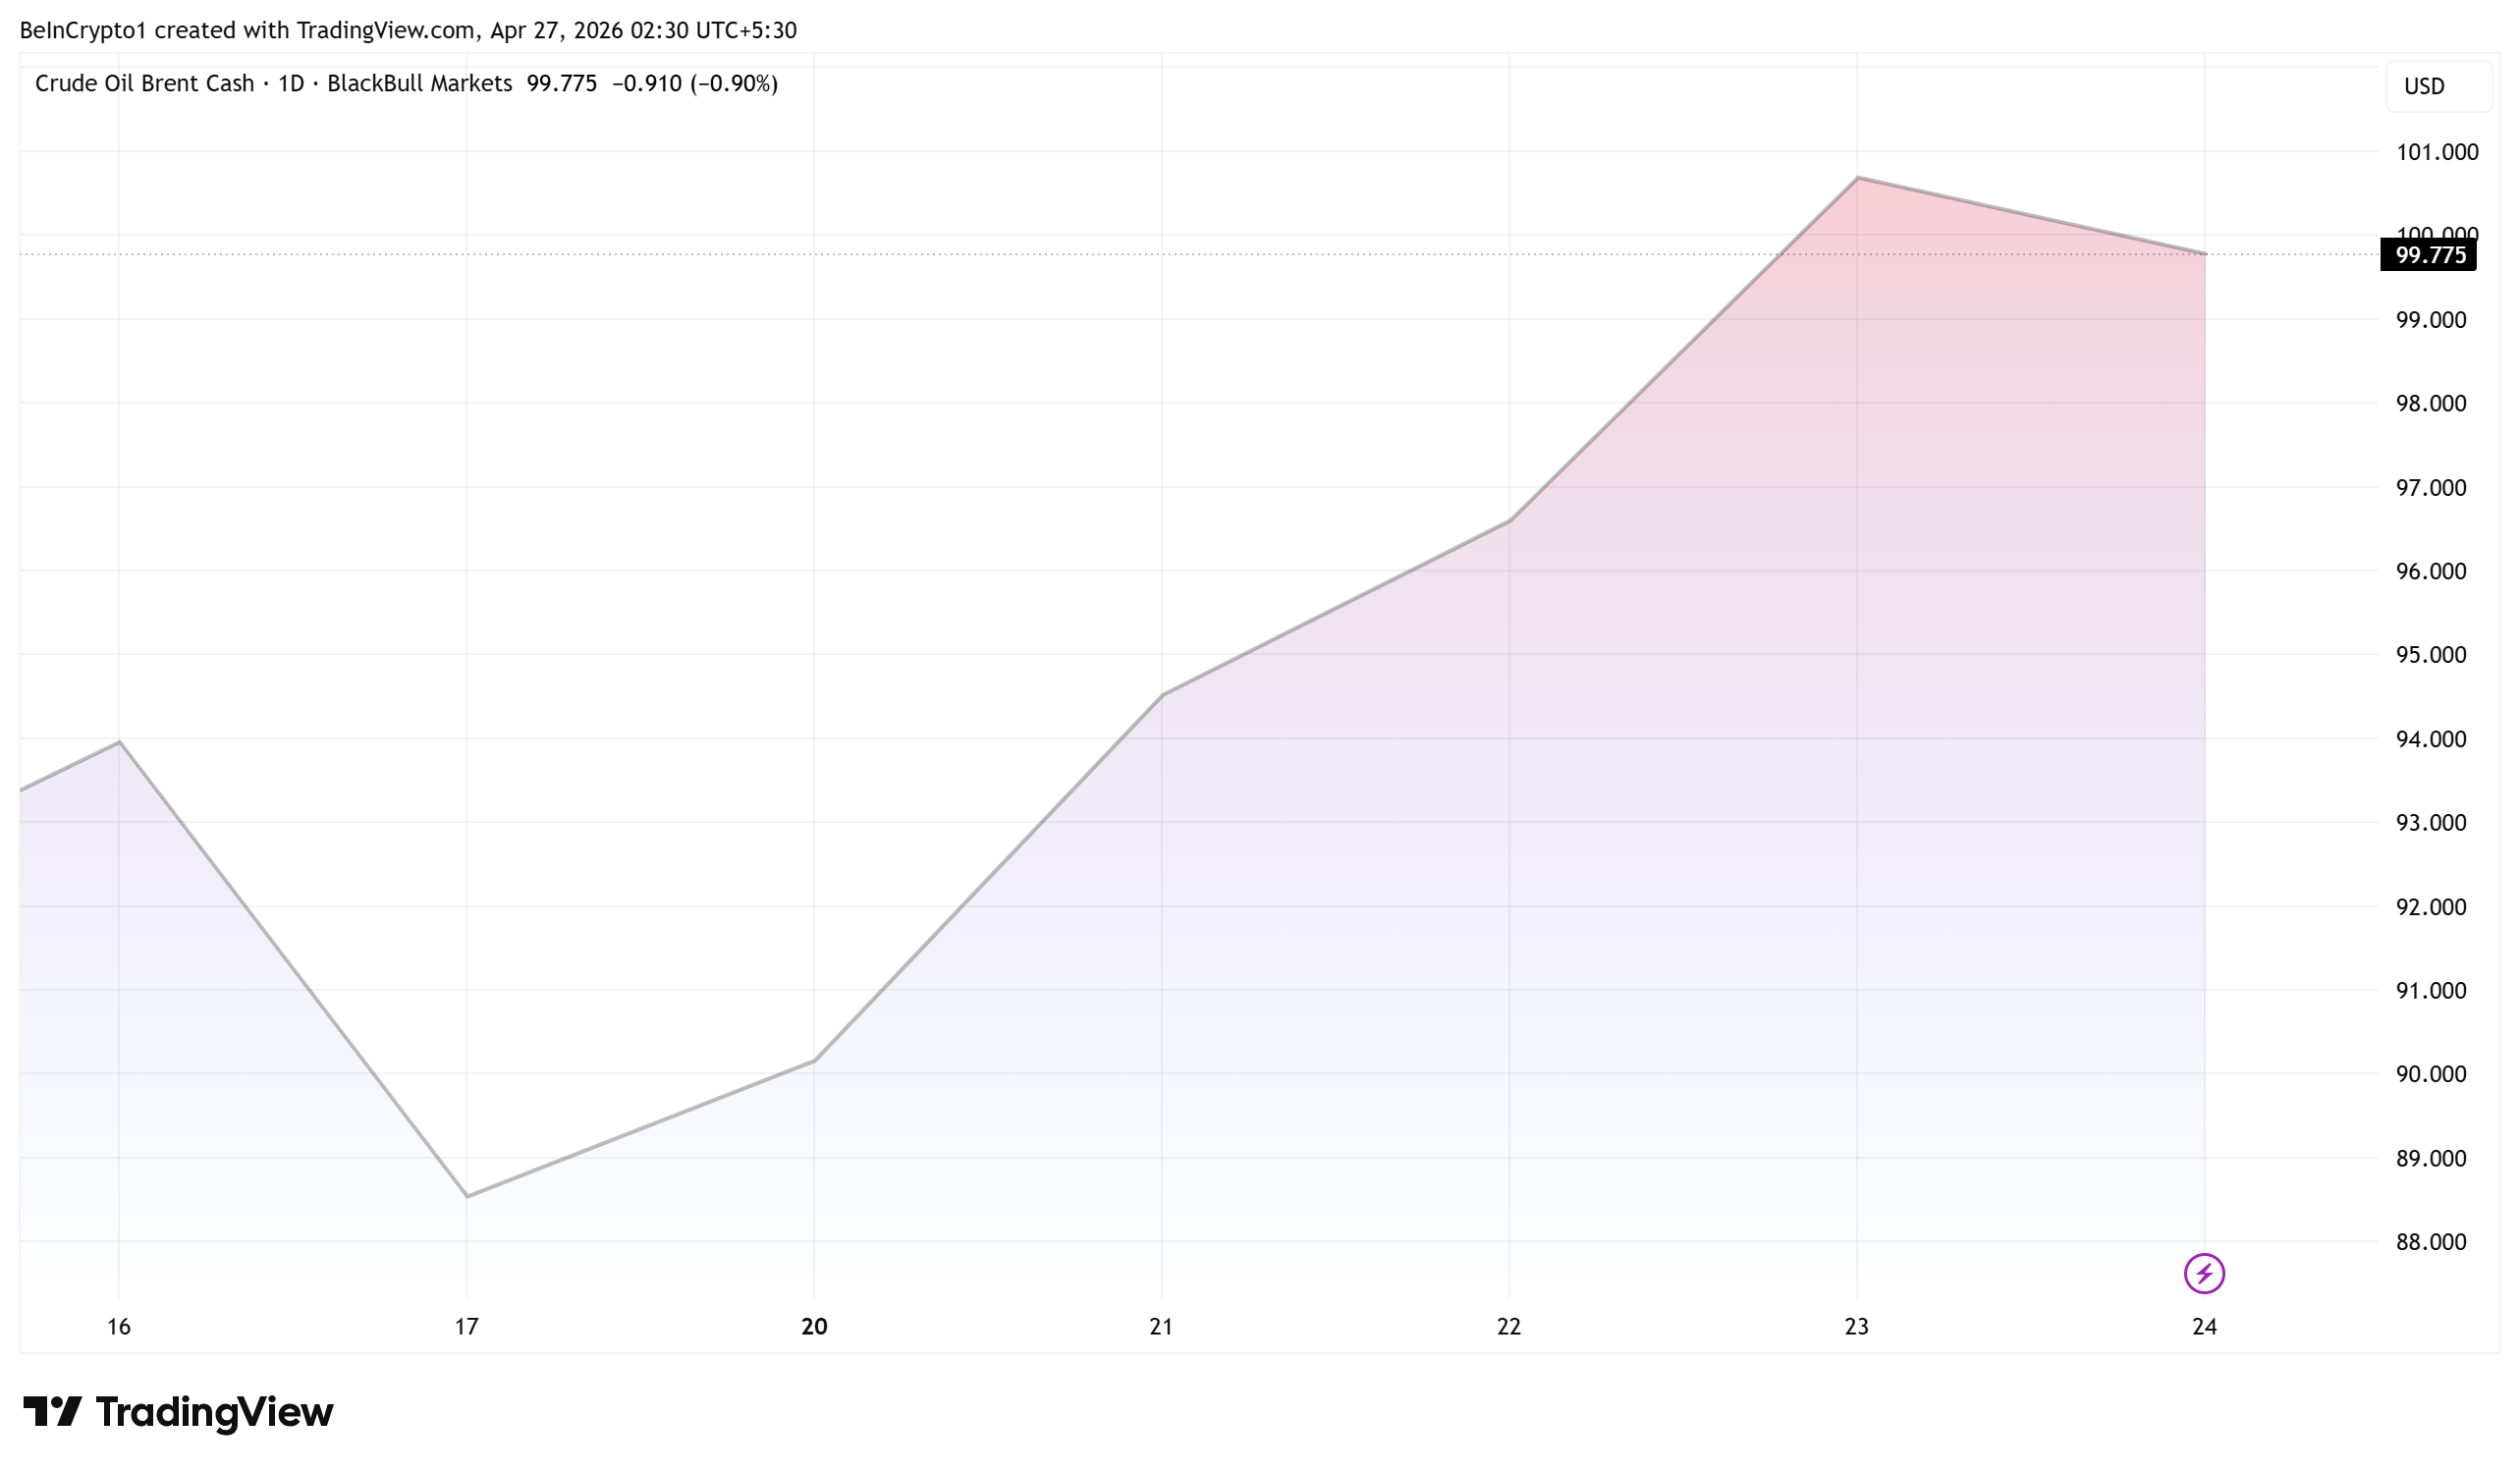
That message lines up with Ghalibaf’s taunt about peak gasoline season. Brent crude continues trading near $100 per barrel, with markets sensitive to any further escalation or inflation pass-through.
Tehran’s signal lands as physical supply realities harden. Whether Iran activates its remaining cards or keeps them in reserve will shape U.S. driving season prices in the weeks ahead.
Subscribe to our YouTube channel to watch leaders and journalists provide expert insights
The post Iran Claims Strong Oil Cards Ahead of Peak Gasoline Demand Season in the US appeared first on BeInCrypto.

How climate change threatens the economic backbone of the Pacific
Pi Network Leads Mobile Mining as Price Nears Breakout Ahead of Key Catalysts

Everyone is Wrong about Bitcoin
Manchester United reach agreement with Casemiro over contract clause amid transfer speculation

US brings back mandatory military draft registration

Steven Gerrard disagrees with Gary Neville over ‘shock’ Chelsea and Arsenal claim | Football


-

 Fashion2 days ago
Weekend Open Thread – Corporette.com
-

 Politics6 days ago
Gary Stevenson delivers timely reminder to register to vote as deadline TODAY
-
Crypto World1 day ago
Hyperliquid $HYPE Rally Builds Momentum as AI Sector Enters Prove-It Phase
-
Crypto World6 days ago
Bank of Hawai’i (BOH) Q1 2026: Net Income Drops to $57.4M as Net Interest Margin Expands
-

 Politics4 days ago
Making troops accountable for war crimes threatens US alliance, ex-SAS colonel warns
-

 Politics4 days ago
Disabled people challenge government SEND proposals over segregation concerns
-

 Business5 days ago
Rolls-Royce Voted UK’s Most Iconic Trade Mark as IPO Register Hits 150
-

 Politics4 days ago
Zack Polanski responds to home secretary’s taser threat
-
 Sports11 hours ago
IPL 2026: Ruturaj Gaikwad registers slowest fifty of the season, enters all-time unwanted list | Cricket News
-

 Business3 days ago
Patterson-UTI Energy, Inc. (PTEN) Q1 2026 Earnings Call Transcript
-

 Politics4 days ago
Starmer handler McSweeney to be dragged from shadows by Foreign Affairs Committee
-
Politics4 days ago
Wings Over Scotland | How To Get Away With Crimes
-
 Crypto World5 days ago
Five Value Stocks with Recovery Potential in 2026: PayPal (PYPL), Nike (NKE), and More
-

 Crypto World5 days ago
New York sues Coinbase, Gemini over prediction market offerings
-

 Politics4 days ago
‘Iran is still a nuclear threat’
-
 Sports4 days ago
Tim Bradley names the current best in the world: “Better than Inoue and Usyk”
-
 Business5 days ago
HCL Tech share price tank over 9% after weak Q4. JPMorgan, HSBC & 3 others cut target price
-

 NewsBeat15 hours ago
LK Bennett closes all stores after entering administration
-

 Crypto World5 days ago
Crypto’s great hope in Senate’s Clarity Act still has a path to survive tight calendar
-

 Fashion5 days ago
Kilkenny Design New Beauty Arrivals for Spring 2026
You must be logged in to post a comment Login