

Crypto World
Australian Police Seize $4.1M of Bitcoin in Major Darknet Bust
Cybercrime detectives in Australia seized 52 Bitcoin valued at 5.7 million Australian dollars ($4.1 million) in what they said is one of Australia’s largest crackdowns on an illegal darknet marketplace using cryptocurrency.
Strike Force Andalusia, a division of the State Crime Command’s Cyber Crime Squad, said they seized $4.1 million worth of cryptocurrency and arrested two suspects related to a darknet marketplace operating from Ingleburn in Sydney following a 15-month investigation, the New South Wales Police Force said Wednesday.
Police said two men, aged 41 and 39, allegedly had access to the cryptocurrency wallet. The 41-year-old is scheduled to appear in Campbelltown Local Court on May 13, while the 39-year-old is due in Batemans Bay Local Court on June 15.
Detectives executed a search warrant at a home in Ingleburn on May 4, where they seized electronic devices and allegedly uncovered 52.3 Bitcoin that police will allege are proceeds of illegal darknet activity.
The operation marks one of the largest reported darknet-related cryptocurrency seizures in Australia. It comes five years after Victoria Police seized cryptocurrency worth $6.2 million from an illegal darknet operation in August 2021, reported local news outlet 9News.
“This is one of the biggest cryptocurrency seizures in the nation’s history and a clear reminder that criminal activity on the darknet is not anonymous,” said Detective Superintendent Matt Craft, adding that dark net marketplaces remain “a key enabler of serious criminal activity.”
Cointelegraph approached NSW Police to ask whether investigators had obtained access to seed phrases or otherwise recovered control of the seized Bitcoin.

Cybercrime squad detectives seize crypto wallets belonging to alleged darknet marketplace operators. Source: NSW Police
Australia steps up AML supervision for crypto platforms
The seizure comes as Australia’s financial intelligence and Anti-Money Laundering regulator, the Australian Transaction Reports and Analysis Centre (AUSTRAC), has stepped up the supervision of the country’s digital asset sector.
On Friday, AUSTRAC said it launched two campaigns focused on virtual asset service providers (VASPs) offering over-the-counter crypto-to-cash services and local exchanges operating in the country.
As part of the reform, Australia also adopted the internationally used VASP term, replacing the previous narrower definition of digital currency exchanges (DCE).
Related: Australia fines local Binance unit $6.9M over client onboarding failures
The campaigns seek to assess and improve AML risk management within Australia’s virtual asset sector. It involves AUSTRAC engaging with 36 crypto businesses and 27 local crypto exchanges to revise and improve business models and the management of AML risks.
“AUSTRAC is checking how well crypto businesses in Australia are managing money-laundering risks, ahead of major new laws coming into force,” said AUSTRAC’s CEO, Brendan Thomas.
Australia has also passed the Corporations Amendment (Digital Assets Framework) Act 2026, which received Royal Assent on April 8 and will bring digital asset platforms and tokenized custody platforms into the financial services licensing regime from April 9, 2027.
Magazine: How crypto laws changed in 2025 — and how they’ll change in 2026


An overbought stock has risen sharply and may sit above its underlying value, while an oversold stock has fallen sharply and may sit below it. In technical analysis, these conditions are used to identify markets that may be approaching a pause, slowdown, or potential price reversal.
The oversold stock meaning refers to a market condition where selling pressure has pushed a stock’s price lower than its recent trading range or momentum may justify. Overbought conditions reflect the opposite scenario, where strong buying activity has driven prices rapidly higher.
To identify these market conditions, traders often use technical indicators such as the Relative Strength Index (RSI), Stochastic Oscillator, and MACD. This article explains what overbought and oversold stocks and stock CFDs are, how these indicators work, and the limitations traders should consider when interpreting their signals.
What Is an Oversold Stock?
Oversold stocks are shares that have fallen sharply in price, often below what their fundamentals warrant. The condition typically reflects excessive selling pressure rather than a fair reassessment of value.
Several factors can lead to a stock becoming oversold. For instance, bad news about a company, such as a missed earnings report or legal troubles, can cause investors to sell off shares quickly. Broader market events, like economic downturns or changes in industry regulations, can also drive prices down across the board. Sometimes, even strong stocks get caught up in these waves of negativity.
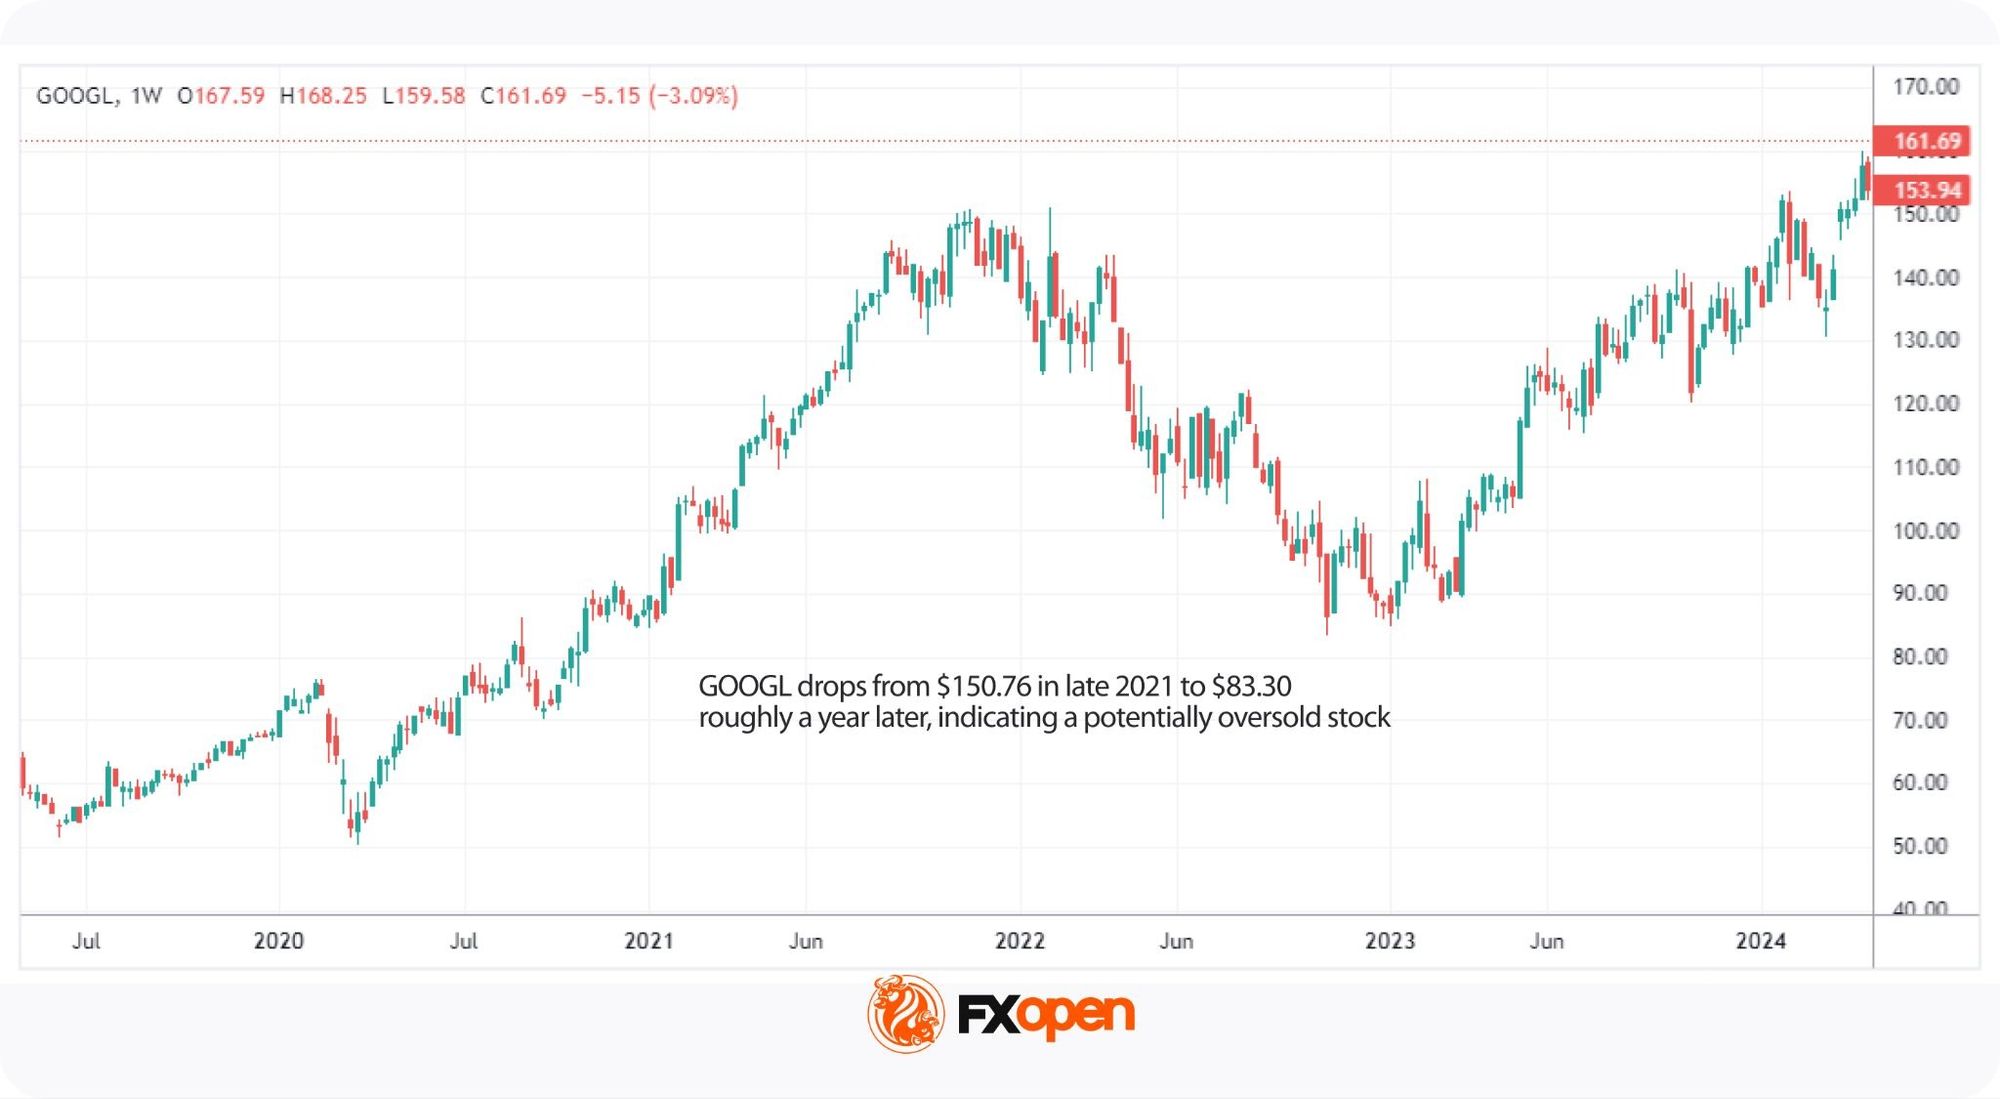
A clear example is the March 2020 market sell-off, when widespread panic during the early stages of the pandemic pushed stocks down across nearly every sector. Many recovered within months as fundamentals held up.
Overselling reflects more than a falling price, though, because it also points to the potential for a reversal once selling pressure fades.
What Is an Overbought Stock?
Overbought stocks are shares that have risen sharply in price, often above what their fundamentals warrant. The overbought condition typically reflects strong buying activity rather than a fair reassessment of value.
Several factors can lead to an overbought market. Sometimes, positive news about a company—such as strong earnings, new product launches, or positive analyst reports—can spark a wave of buying. Market-wide optimism, particularly during bullish phases, can also lead to an overbought stock market. Speculative buying, where traders hope to capitalise on short-term price movements, can further inflate the price.
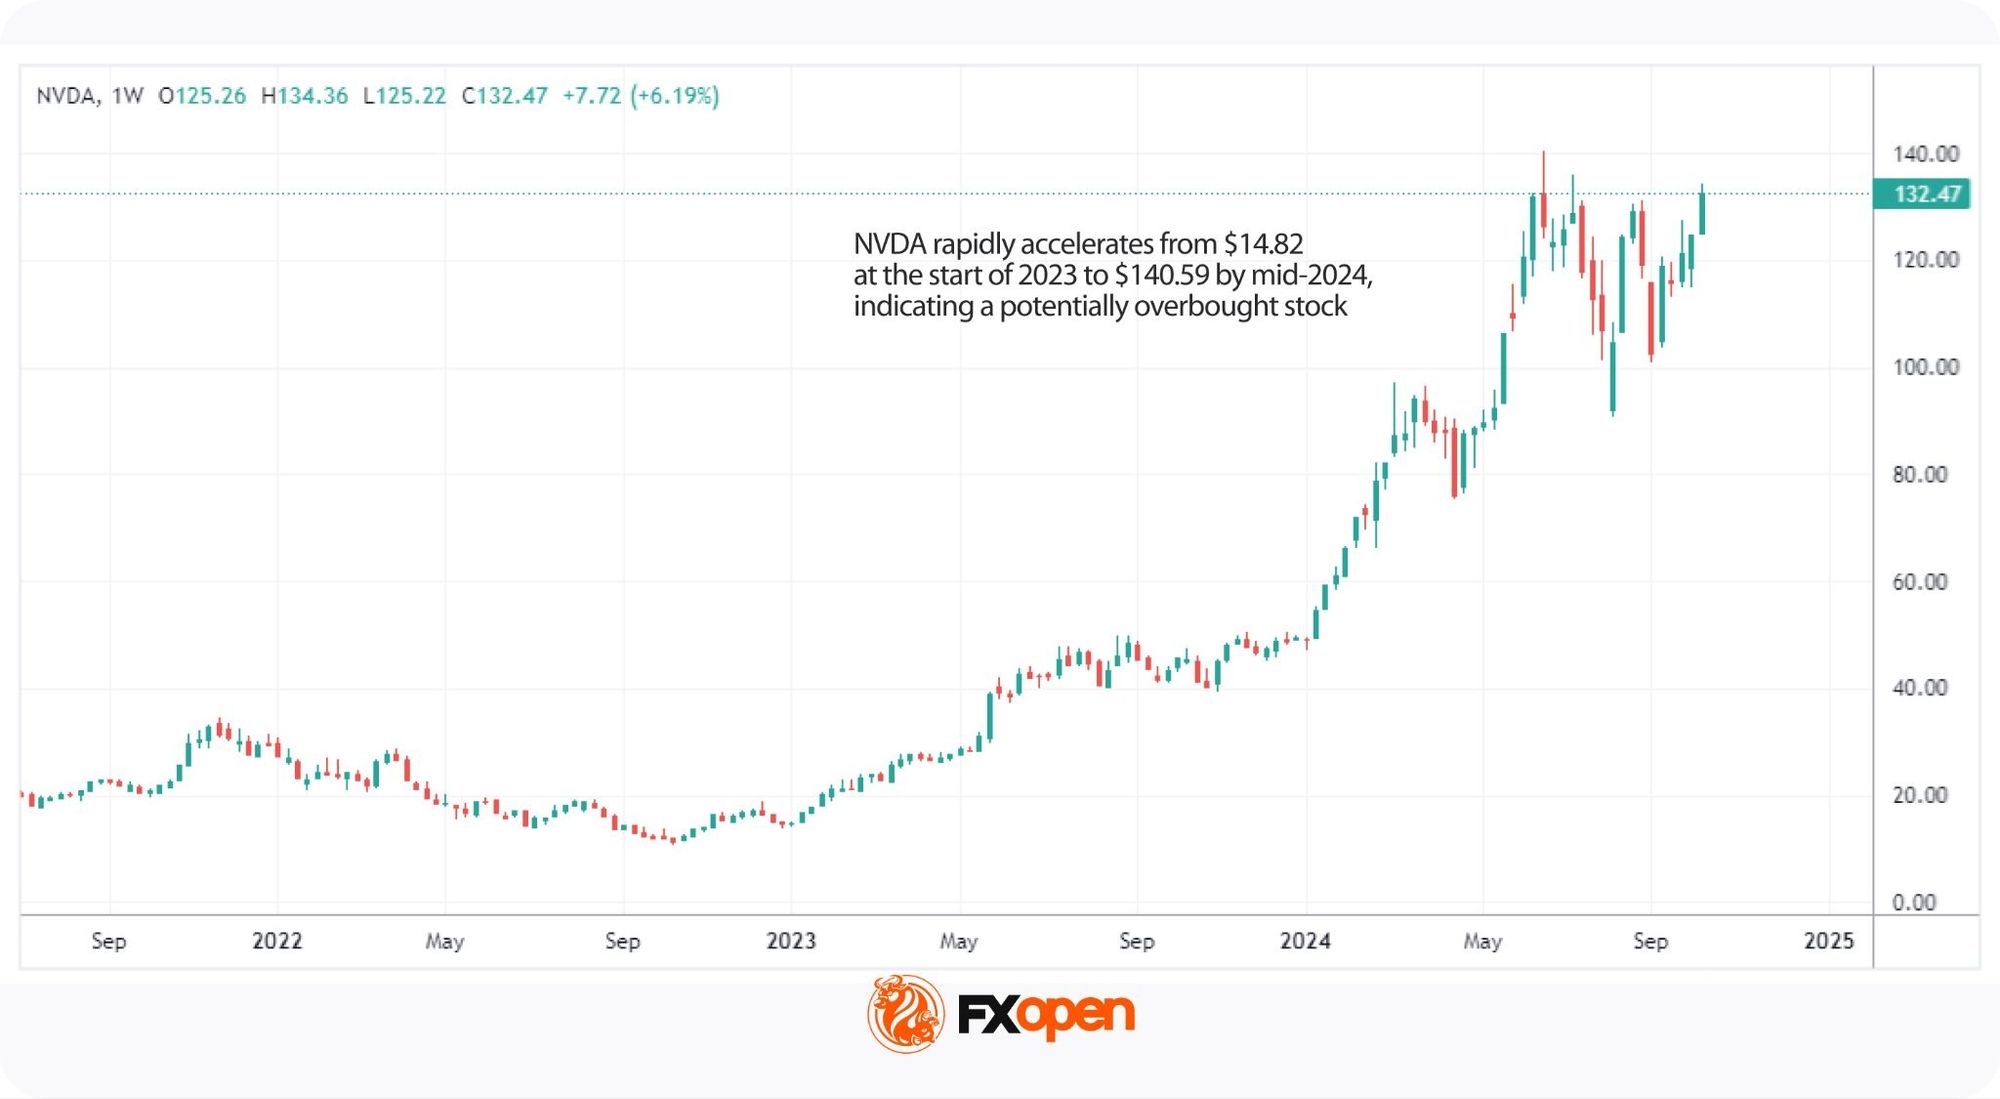
A notable example is the AI-driven rally in mega-cap technology stocks during 2024, when names like Nvidia spent extended periods in overbought territory as enthusiasm around generative AI pushed valuations to record highs.
Being overbought does not guarantee an immediate correction, though it does signal that the price may have moved too high, too quickly.
Overbought vs Oversold: Key Differences
The overbought vs oversold distinction often hinges on sentiment as much as fundamentals. The distinction matters because each condition reflects opposite market behaviour. Overbought signals downside pressure ahead while oversold points to potential upside, so traders position differently for each.
The two conditions compare as follows:
Recognising the difference between overbought stocks and oversold stocks may help traders align analysis with prevailing conditions, though neither signal guarantees a reversal and confirmation from other tools still matters.
Indicators for Oversold and Overbought Stocks
Traders use overbought and oversold indicators to assess whether a stock has moved too far in one direction. Most of these tools are momentum oscillators that measure the speed and magnitude of price changes.
The three most common are:
- Relative Strength Index (RSI)
- Stochastic Oscillator
- MACD (Moving Average Convergence Divergence)
Each oscillator works in a different way, but they share a common purpose: flagging when price action looks stretched relative to recent history. When a stock has moved too far from its typical range, the reading may signal a possible reversal, helping traders identify potential entry or exit points.
Now, let’s break down some of the most popular momentum indicators in trading used for this purpose. To see how they work for yourself, consider following along in FXOpen’s TickTrader trading platform to access a world of stock CFDs.
Relative Strength Index (RSI)
The Relative Strength Index (RSI) is a momentum oscillator that measures the speed and magnitude of recent price changes by comparing the average size of recent gains to recent losses over a set period. The standard look-back is 14 periods, with readings on a scale of 0 to 100.
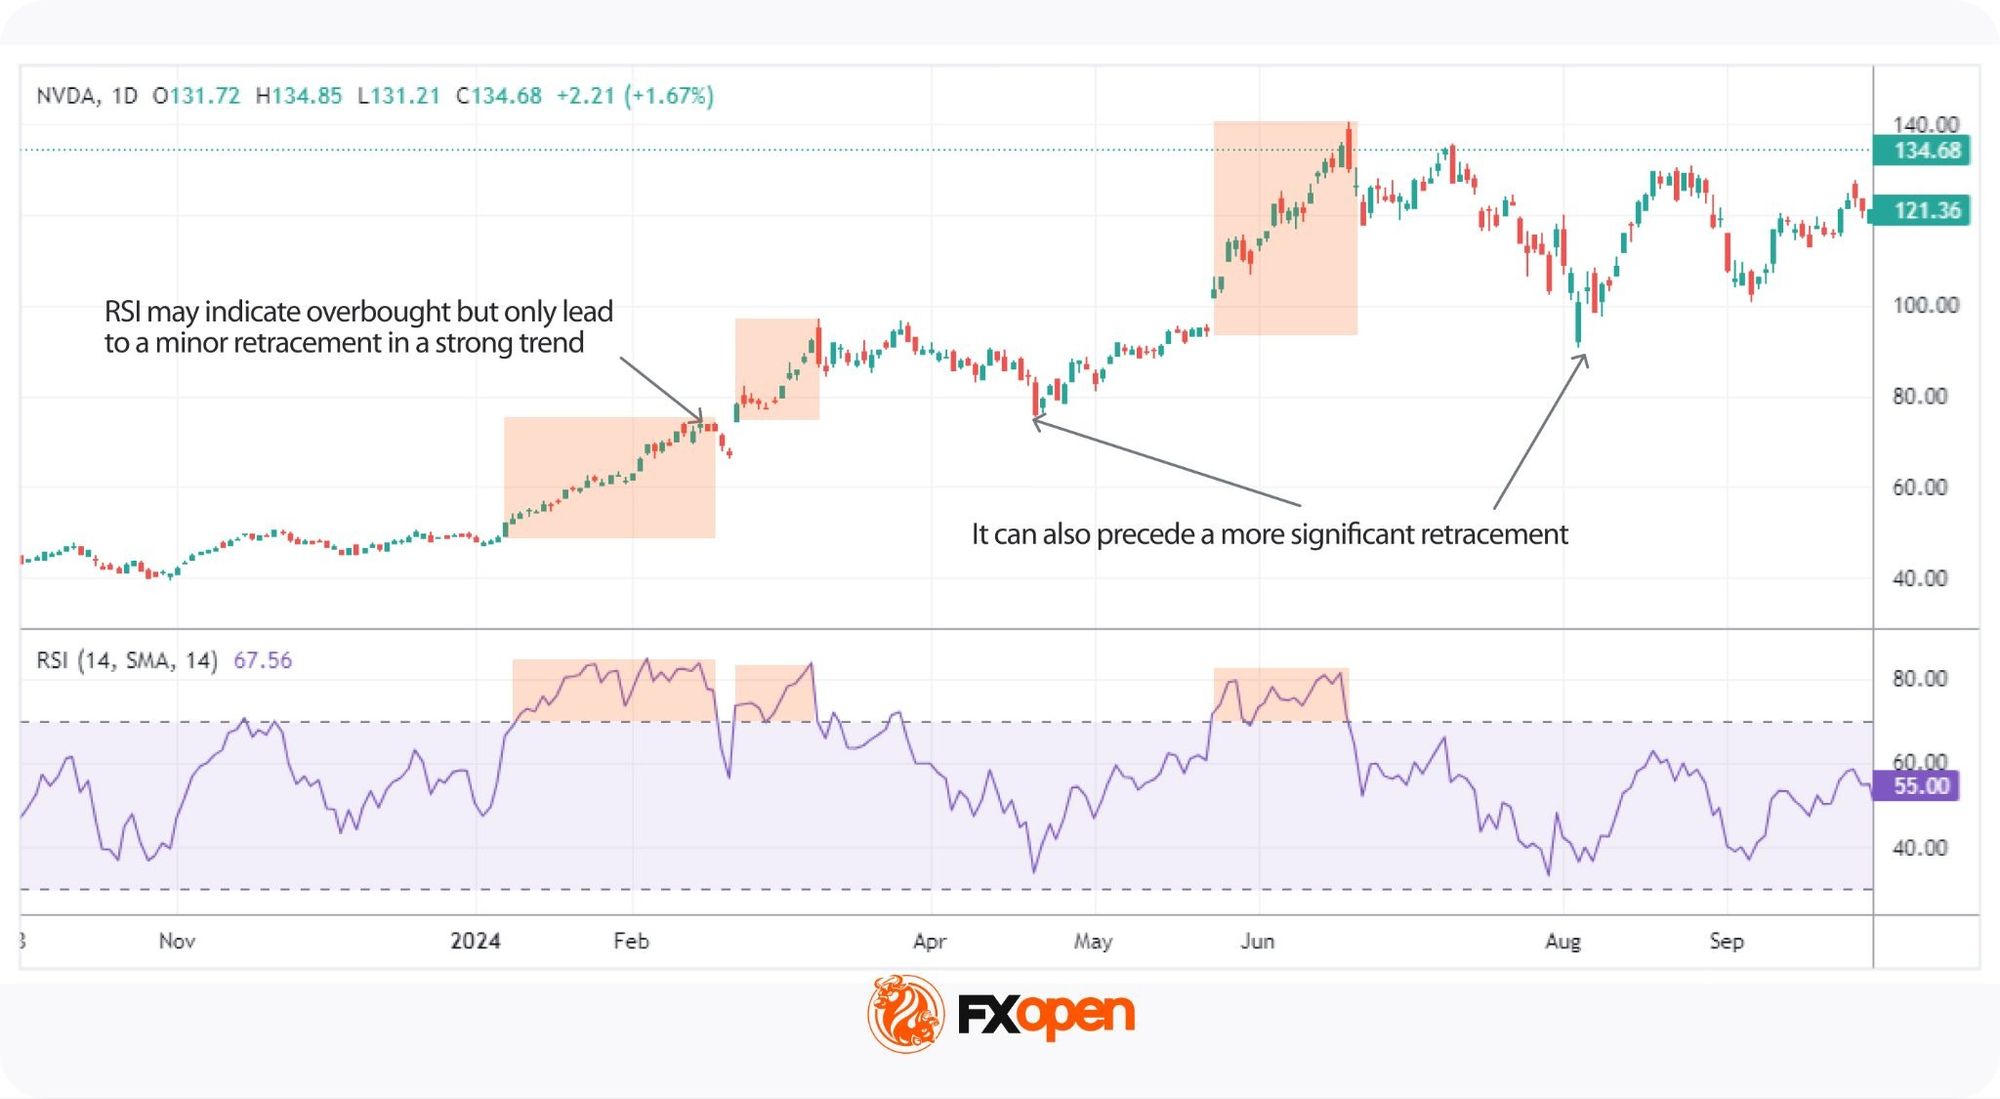
The RSI oversold level is seen as below 30 and indicates the stock may be undervalued and due for a bounce. Meanwhile, the RSI overbought level sits at 70 and above, which often precedes a pullback.
For example, when a stock falls 12% over two weeks and its RSI drops to 25, traders watching for reversals would mark this as a potential setup. The same logic applies in reverse when RSI spikes above 70 after a strong rally.
Context still matters, though. In a strong bull market, a stock may stay overbought for weeks, and during a downturn, stocks can remain oversold longer than many traders expect.
Stochastic Oscillator
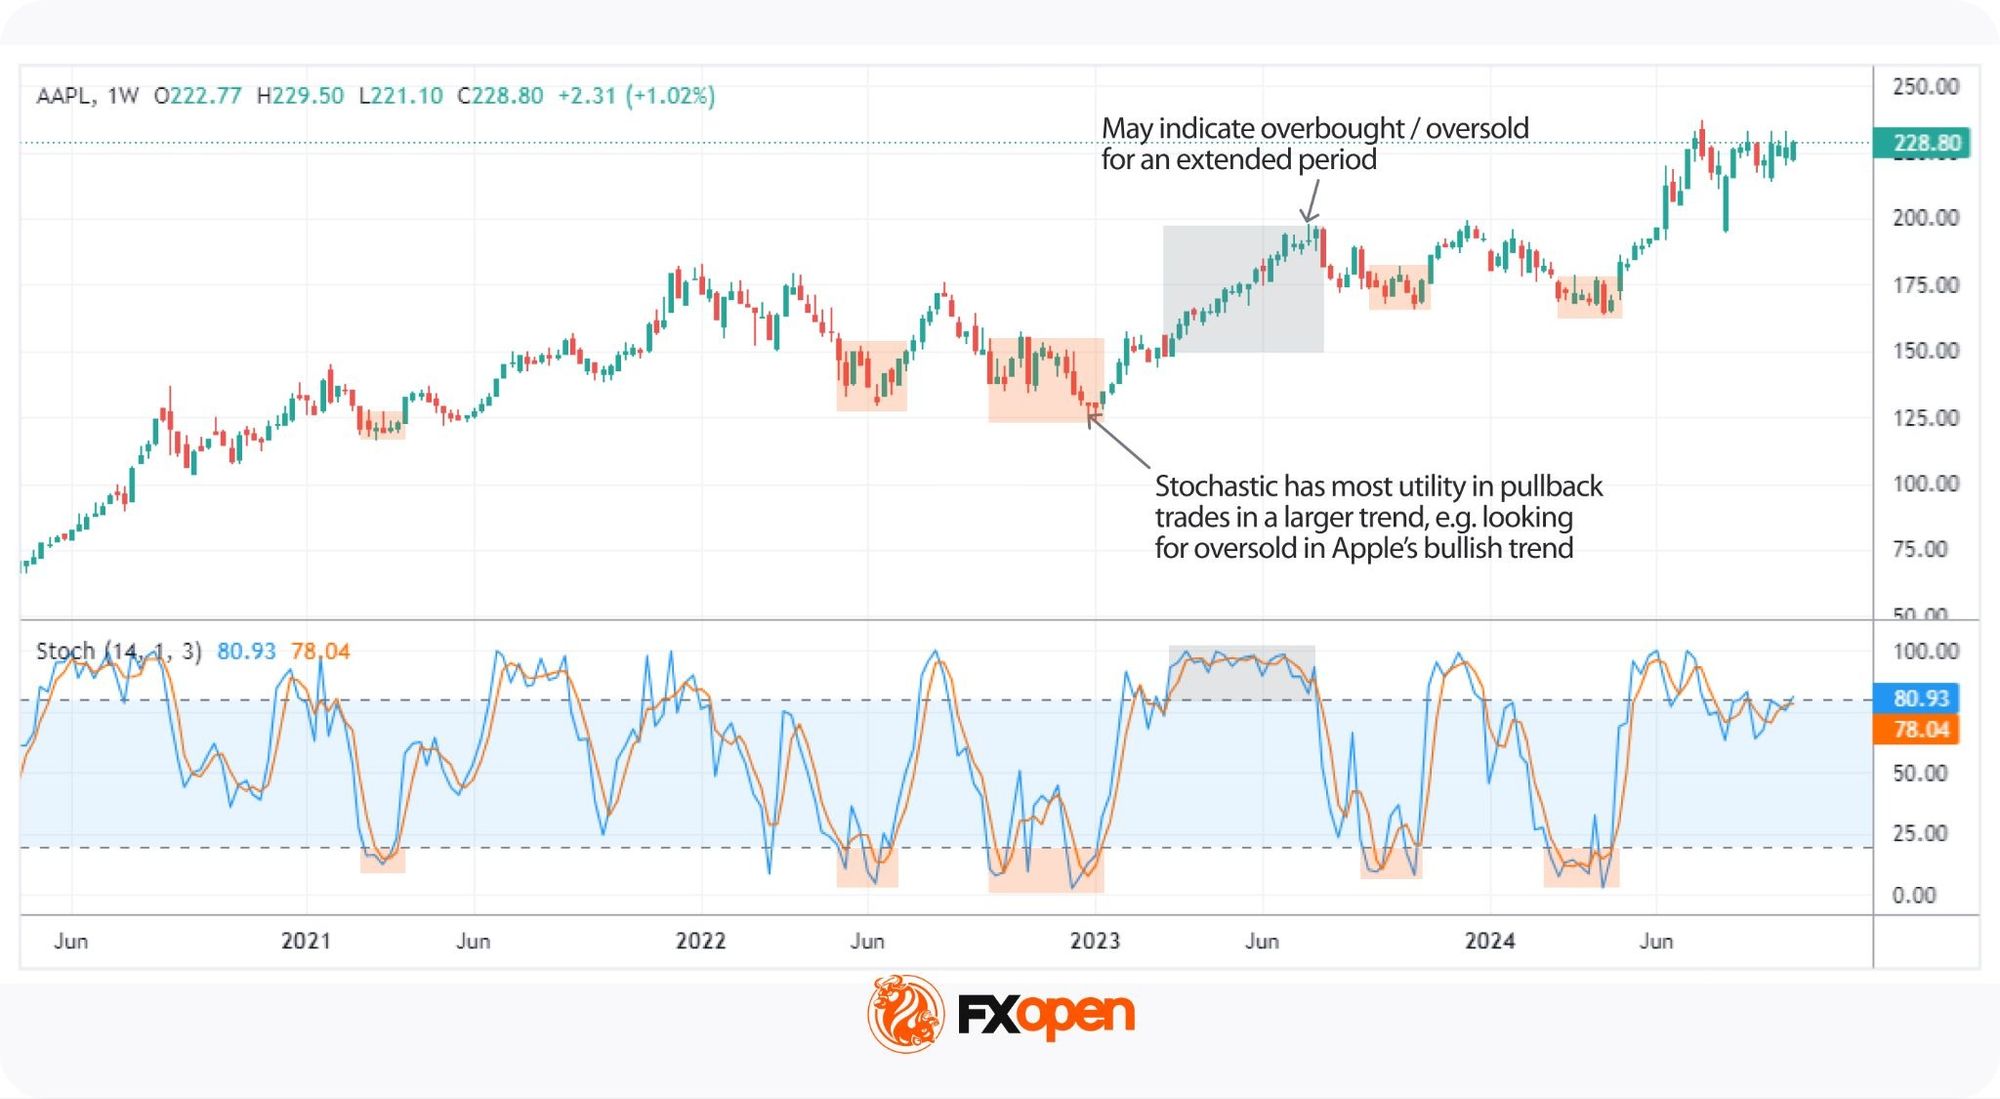
The Stochastic Oscillator is a momentum indicator that compares a stock’s closing price to its price range over a defined period.
The main difference from RSI is sensitivity, because the Stochastic focuses on closing price relative to recent range, which makes it react faster to shorter-term reversals.
The Stochastic plots two lines: %K reflects the current closing position within the recent range, and %D smooths %K with a short moving average. A reading above 80 marks an overbought zone, while a reading below 20 marks a Stochastic Oscillator oversold zone.
For instance, when a stock closes near its weekly high every day for two weeks, %K typically pushes above 80, and given its sensitivity, the Stochastic can stay extended for long periods during strong trends. This makes it more prone to false signals than the RSI or MACD indicator and typically more useful for trading pullbacks in a broader trend.
MACD (Moving Average Convergence Divergence)
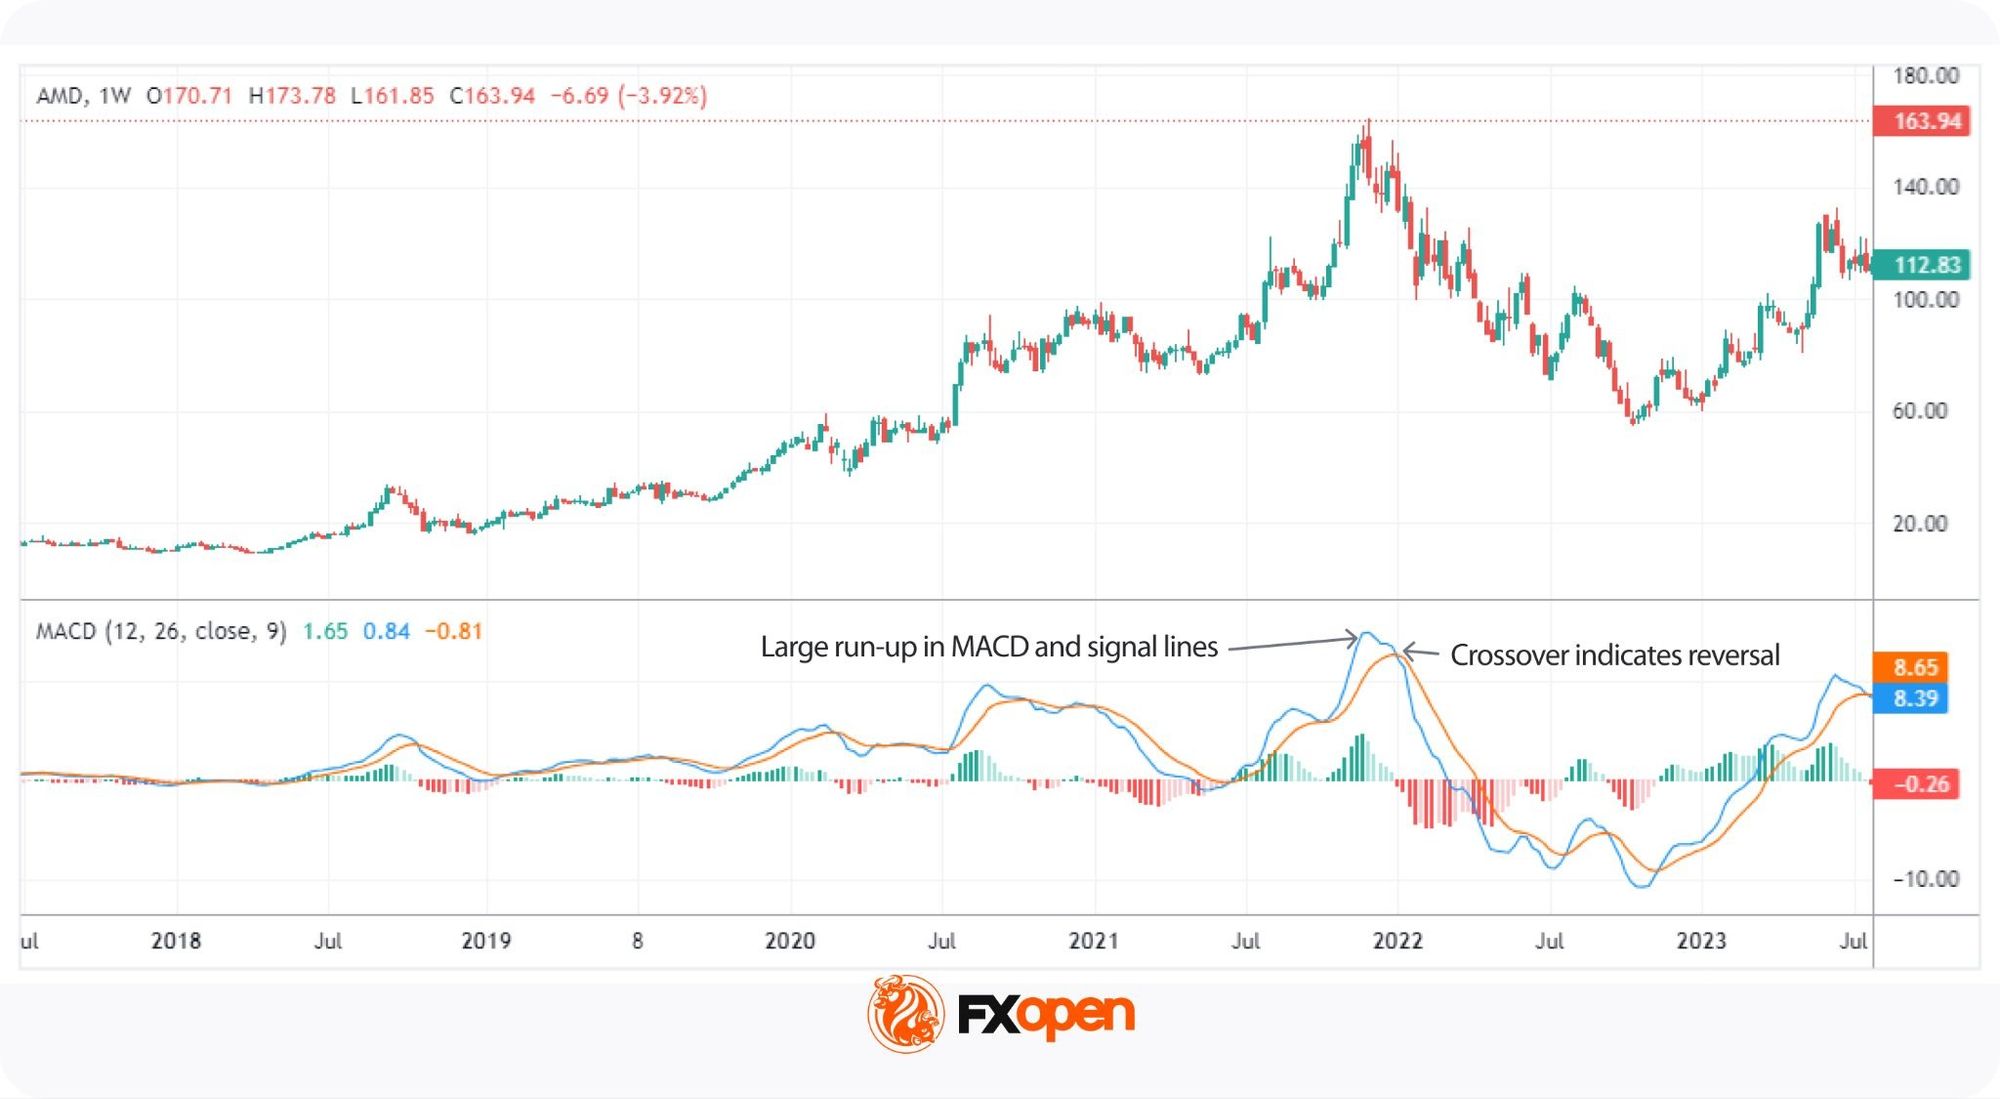
The Moving Average Convergence Divergence (MACD) is a trend-following momentum indicator that compares two moving averages of a stock’s price. Unlike RSI or Stochastic, MACD is not a pure overbought or oversold indicator, since it highlights momentum shift and trend direction instead.
The MACD line tracks the gap between two exponential moving averages, typically the 12-period and 26-period, while a 9-period moving average of the MACD line forms the signal line. When the MACD line crosses above the signal line, it points to a potential bullish reversal, and a cross below points to a bearish reversal.
Traders can still gauge stretched conditions through MACD momentum signals, because when both lines sit far from the 0 midpoint and historical averages, the move may be overextended.
Limitations of Overbought and Oversold Signals
Momentum indicators help traders spot overextended conditions, but they carry limitations. A reading at an extreme tells you the move has been strong, though it does not tell you the move is finished. Traders who treat overbought and oversold levels as automatic triggers tend to fail.
The main limitations include:
- A low oscillator reading does not guarantee a price reversal
- Strong trends can keep readings extended for far longer than expected
- Different timeframes produce different signals on the same stock
- Single indicators offer no confirmation, raising the risk of poor entries
False signals in stocks are the most common pitfall. Two practical filters reduce this risk: divergence analysis and multi-timeframe confirmation.
Divergences
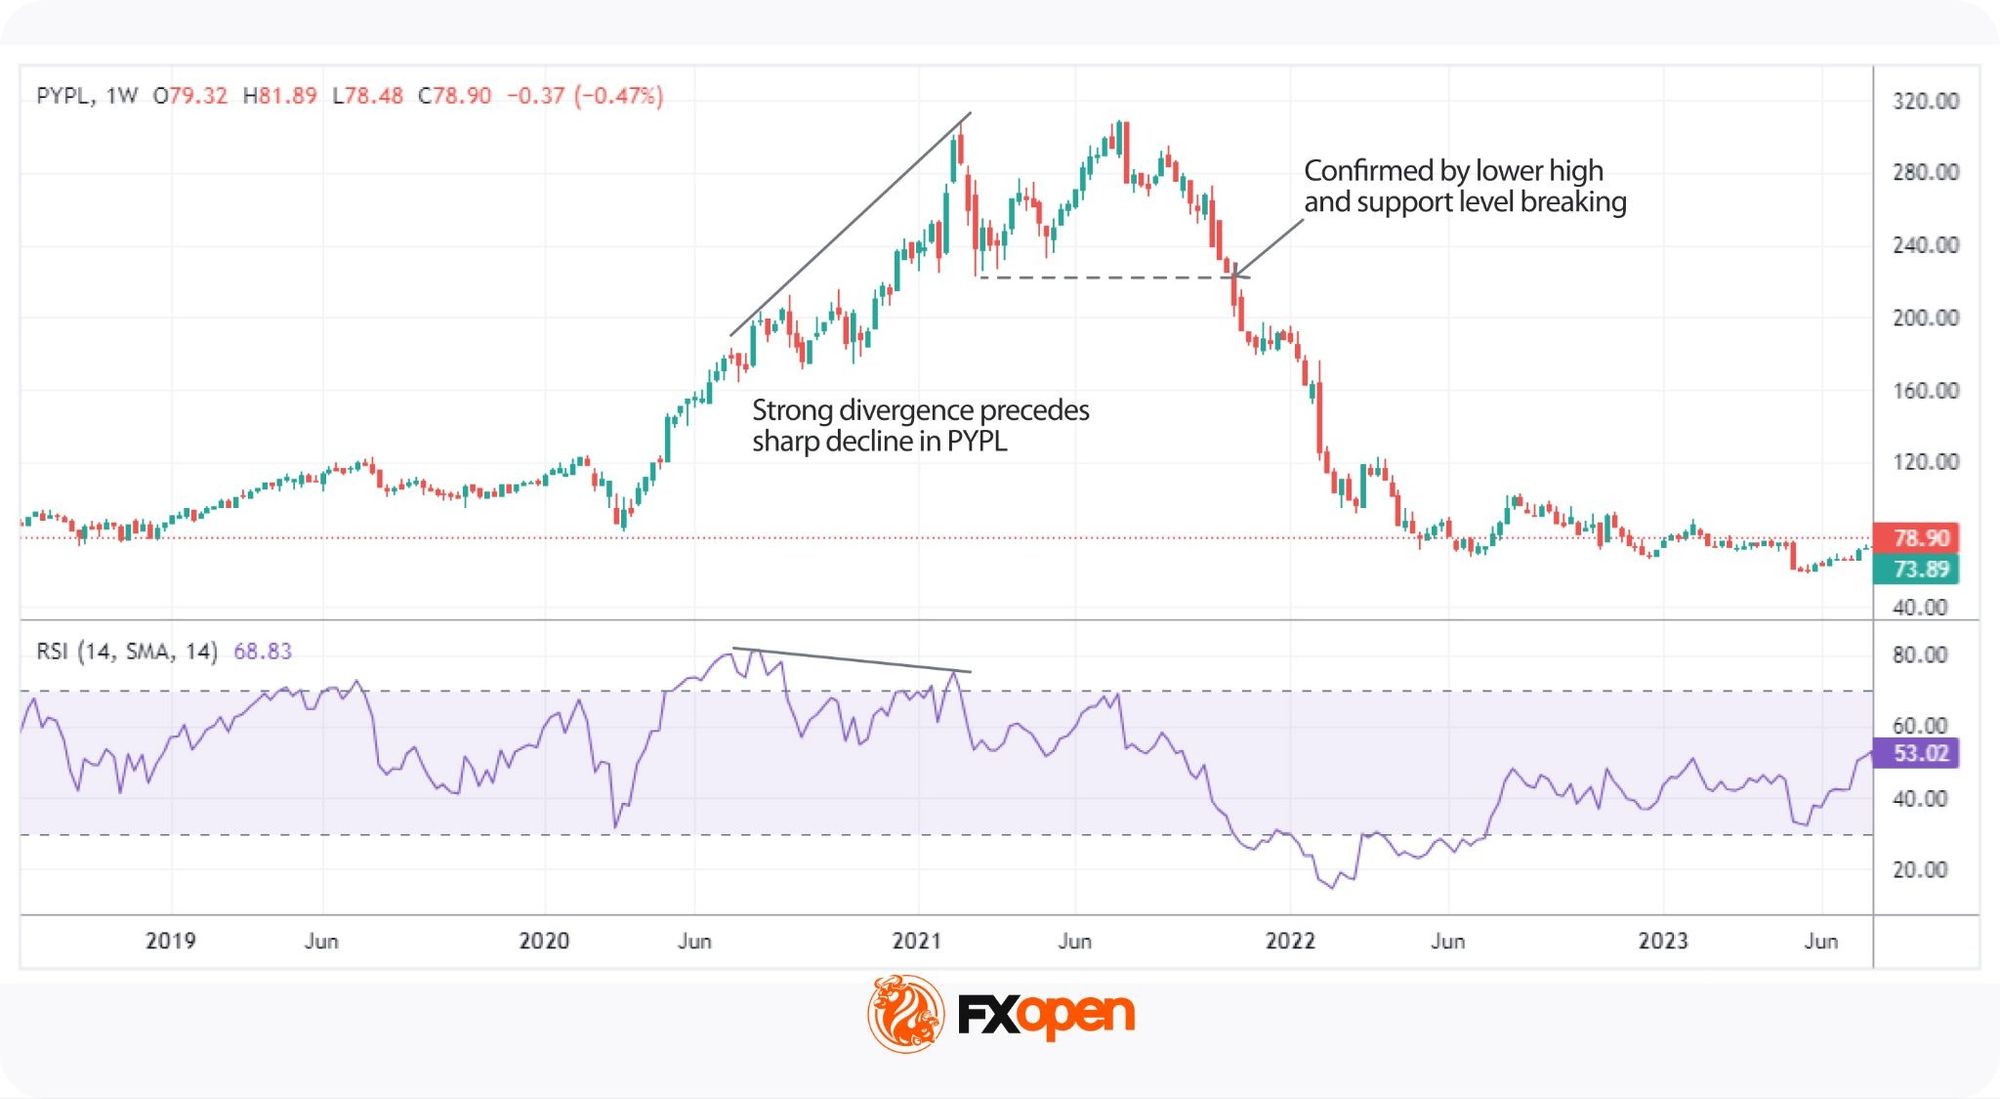
Divergence describes a price move that runs against its indicator, such as a stock pushing to a new high while RSI prints a lower high, which signals weakening momentum and a possible turn. Traders typically use divergence as a confirmation tool rather than a standalone trigger, because pairing it with a price action signal reduces the risk of acting on a false reading.
Timeframes
Timeframe selection shapes how overbought and oversold signals appear on a chart, because daily and weekly views can disagree on the same stock, with the daily flashing oversold while the weekly remains neutral. Traders match the timeframe to their strategy, whether short-term or long-term.
Many traders apply a top-down approach, confirming the higher timeframe direction first before refining entries on lower timeframes. This multi-timeframe check may support market analysis when readings conflict.
Risks of Trading Oversold and Overbought Stocks
Trading overbought and oversold stocks carries risks beyond standard market exposure, because the signals can flag setups that never play out, and the indicators can stay at extremes for far longer than traders expect. Robust risk management practice may potentially reduce exposure to each pitfall below.
- False signals: an oversold or overbought reading does not guarantee a reversal, because prices can keep rising or falling despite the indicator, and treating every extreme reading as a trade trigger leads to poor outcomes.
- Extended trends: during strong runs, stocks can stay extended for weeks, and acting too early often produces premature losses.
- Market sentiment: news events or macroeconomic shifts can overpower technical signals, with strong optimism or fear keeping a stock in overbought or oversold territory longer than expected.
- Lack of confirmation: relying on a single indicator carries higher risk, so many traders combine technical and fundamental analysis, or stack multiple stock technical analysis indicators, before acting on an extreme reading.
The Bottom Line
Understanding overbought and oversold stocks, along with the indicators used to identify them, can help traders spot trend changes. While these conditions may signal a reversal, it’s important to recognise there is no one best overbought and oversold indicator and use multiple tools for confirmation.
To put this knowledge into practice, you can consider opening an FXOpen account, which offers access to stock CFDs and advanced trading platforms.
FAQ
What Is Overbought and Oversold?
Overbought and oversold are terms used to describe extreme price movements in markets. A stock is considered overbought when its price has risen rapidly and above its underlying value, which potentially makes it overvalued. It’s oversold when the price has fallen sharply and below its underlying value, which makes it undervalued. These conditions can signal that a price reversal may be coming, though they don’t guarantee it.
What Is an Overbought Stock?
The overbought stock meaning refers to a stock that has increased quickly and is potentially trading higher than its actual value. This often occurs due to strong demand or market optimism. Overbought conditions might signal that the price is at risk of a pullback.
What Is an Oversold Stock?
The oversold stock meaning refers to a stock that has dropped significantly and may be below its true value. This often happens when there’s been excessive selling, and it could suggest that its price is due for a rebound.
How Can You Find Oversold Stocks?
Traders often use technical indicators like the Relative Strength Index (RSI) to find the most oversold stocks. An RSI reading below 30 typically suggests that a stock is oversold and may present a buying opportunity. Other indicators, like the Stochastic Oscillator, are also commonly used to identify oversold conditions.
What Is the Difference Between Overbought and Oversold?
The difference between overbought and oversold lies in direction. An overbought stock has risen too far and may face downward pressure, while an oversold stock has fallen too far and may rebound. Both flag possible reversals.
Which Indicators Identify Oversold Stocks?
Common indicators include the Relative Strength Index, Stochastic Oscillator, and MACD, with an RSI reading below 30 or a Stochastic below 20 typically pointing to oversold conditions. Traders often combine indicators for confirmation.
Can a Stock Stay Overbought or Oversold?
Yes, a stock can stay overbought or oversold for weeks during strong trends. In such a case, indicator readings may sit at extreme levels for long. Traders use confirmation tools to avoid premature entries.
This article represents the opinion of the Companies operating under the FXOpen brand only. It is not to be construed as an offer, solicitation, or recommendation with respect to products and services provided by the Companies operating under the FXOpen brand, nor is it to be considered financial advice.
Hyperliquid’s native token, HYPE, extended its surge into a new weekly high, gaining more than 23% in the last 24 hours and approaching $47. The move places HYPE at its strongest level since October 2025, underscoring a renewed wave of institutional interest and supportive macro developments around the Hyperliquid ecosystem.
Analysts say the catalysts are multi-fold: the arrival of US-listed Hyperliquid exchange-traded products (ETPs) and a spate of structural tailwinds from major crypto finance players. While the near-term upside is clear, traders are weighing whether the rally can be sustained beyond launch-week hype, especially if the price action peters into a pattern that could portend a larger, technical correction.
Key takeaways
- This week saw the debut of two US-listed Hyperliquid ETFs, strengthening the token’s institutional-demand narrative.
- Coinbase’s role as the official treasury deployer of USDC on Hyperliquid adds a structural revenue and liquidity tailwind for HYPE.
- Progress on the CLARITY Act in the US Senate has buoyed market sentiment, signaling potential clearer regulatory boundaries for digital assets.
- On-chain chatter and a rising wedge on the HYPE/USD chart imply risks of a deeper correction if the pattern breaks downward, while a decisive breakout could extend gains.
ETFs anchor a fresh wave of institutional demand
The immediate spark behind HYPE’s rally appears to be the launch of US-listed Hyperliquid ETFs, which give traditional investors regulated exposure to the token. Bitwise began trading its spot Hyperliquid ETF, BHYP, on the NYSE this week, with a sponsor fee set at 0.34% and a full fee waiver for the first month on assets up to $500 million. The product aims to stake a portion of its holdings through Bitwise’s own staking unit, providing a familiar on-ramp for institutional buyers.
Earlier in the week, 21Shares unveiled its Hyperliquid ETF, THYP, on Nasdaq. Combined, the two listings are designed to channel more traditional capital into the Hyperliquid ecosystem, potentially lifting liquidity and broadening exposure for investors who have previously traded only through crypto exchanges.
On-chain analytics firm Lookonchain flagged a notable uptick in accumulation prior to the ETF launches, reporting that wallets linked to venture-capital powerhouse a16z had accumulated roughly $67.5 million worth of HYPE in the month leading up to the listings. While attribution to a single fund is not definitive, the disclosure underscores the growing interest from prominent crypto backers in Hyperliquid’s flagship token.
Market trackers show that as of Friday, the US-listed ETFs managed about $3.17 million in assets, according to SoSoValue data. While this is still modest relative to broader ETF markets, the inflows could compound if the strategy proves durable and attractive relative to other DeFi-focused vehicles.
USDC deployment by Coinbase fuels structural incentive
Another pivotal development for HYPE came when Coinbase announced it had become the official treasury deployer of USDC on Hyperliquid. The arrangement strengthens USDC’s role as a core collateral and quote asset across Hyperliquid’s on-chain markets, reinforcing the protocol’s liquidity backbone.
USDC already accounts for a sizable slice of Hyperliquid’s stablecoin supply, now estimated at roughly $5 billion, per DefiLlama. The arrangement sits within the AQAv2 framework, under which Coinbase is expected to share most of the reserve-yield revenue generated by USDC deployed on Hyperliquid with the protocol.
Circle is also stepping into the arrangement as Hyperliquid’s technical deployer for USDC and has committed to stake 500,000 HYPE tokens. Industry observer Aylo noted that this alignment could be a pragmatic way to harness Hyperliquid’s dominant position in perpetuals trading, potentially widening revenue streams for the protocol and providing a backing for HYPE buybacks. “We should see an increase of ~$140 million in annualized revenue, which will be used to buy back HYPE,” the analyst added in a volatility-focused thread.
Regulatory tailwinds slightly brighten the macro backdrop
Beyond market mechanics, regulatory progress in the United States provided a tailwind for crypto sentiment. The US Senate Banking Committee advanced the CLARITY Act in a 15–9 vote, a step toward clearer delineation of when digital assets fall under securities or commodities rules. The move did not enact law, and the bill now advances to the Senate for broader consideration, where bipartisan support will be crucial to overcome procedural hurdles and potential House–Senate reconciliations before any passage to the president.
While CLARITY Act talk commonly correlates with improved sentiment in the sector, investors are watching how quickly a finalized framework could materialize into concrete compliance requirements and market structure changes. As with many regulatory efforts in crypto, timing and scope remain uncertain, and the ultimate impact will depend on legislative alignment across chambers and executive sign-off.
Technical backdrop: a rising wedge with a caveat
From a charting perspective, HYPE has been tracing a rising wedge pattern, defined by converging upward-sloping boundaries. Analysts caution that such formations often precede a bearish break: a move below the lower trend line could target a retreat to roughly $26.50 to $31.20, representing a 30% to 45% pullback from current levels, depending on where a potential breakdown occurs within the structure.
Conversely, a decisive breakout above the wedge’s upper boundary could invalidate the bearish setup and push HYPE toward the $59–$60 zone, aligning with key Fibonacci retracement levels. The asset’s momentum indicators, including the daily RSI, remain below the overbought threshold of 70, suggesting room for further upside before nearing overextension.
What readers should watch next
The coming weeks will be pivotal for HYPE as ETF inflows unfold and regulatory chatter continues to influence market temperament. Key questions include whether ETF launches translate into sustained capital allocation beyond initial hype, whether Coinbase and Circle’s structural incentives translate into higher reserve yields and broader adoption, and how the regulatory process ultimately shapes DeFi market access and custody standards. Technical traders will be watching whether the price can sustain above the wedge’s upper boundary or succumb to a corrective move back toward the lower band. As ever in crypto, the balance between institutional demand and regulatory clarity will likely determine how far HYPE can extend its current momentum.
Source links and further reading: Bitwise’s BHYP NYSE listing announcement; 21Shares THYP Nasdaq debut; Lookonchain analysis on a16z-related accumulation; SoSoValue ETF asset figures; Coinbase’s Hyperliquid USDC treasury deployment; DefiLlama USDC supply on Hyperliquid; AQAv2 framework details; CLARITY Act coverage in crypto press.
What’s next: monitor ETF inflows, USDC deployment economics, regulatory milestones, and the evolving price structure to gauge whether HYPE can sustain its uptrend or faces a deeper corrective phase.
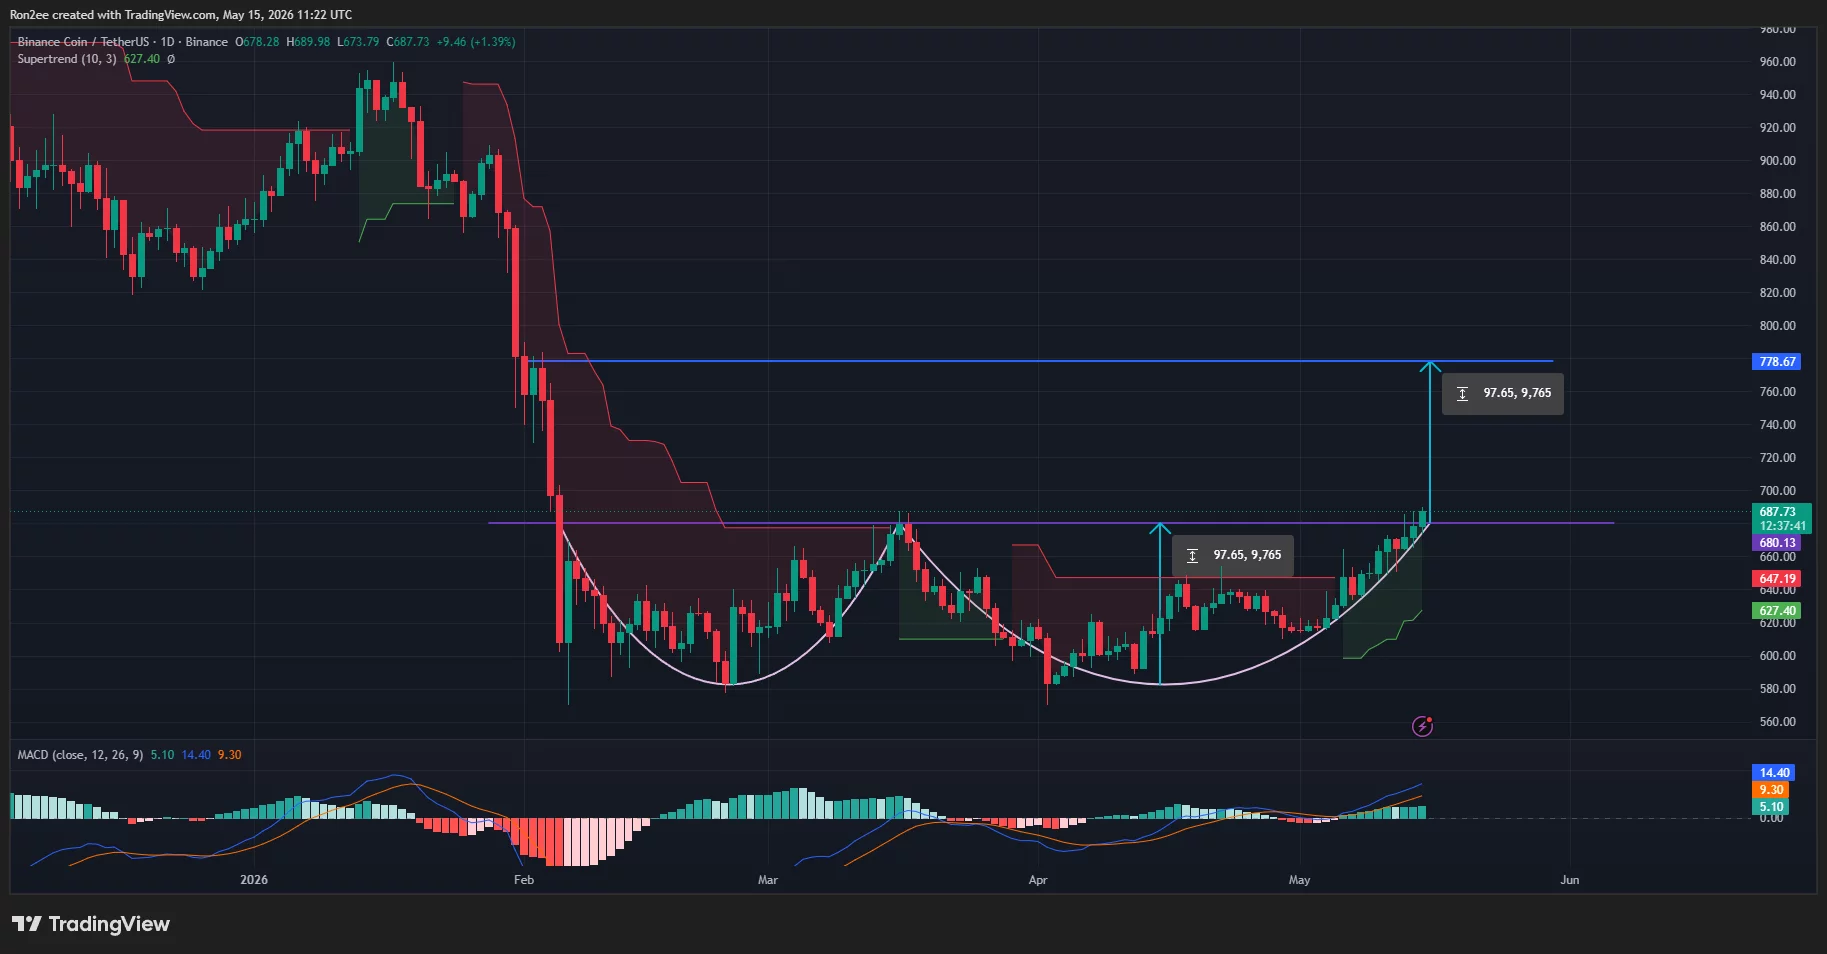
BNB price continued climbing this week as bulls attempted to confirm a breakout above a key neckline resistance zone, with a bullish double bottom structure on the daily chart signaling the potential for a larger upside move toward the $750 region.
Summary
- BNB price climbed toward the key $680–$690 neckline resistance as a bullish double bottom pattern signaled potential upside toward $750–$780.
- Growing optimism around spot BNB ETF proposals and rising institutional activity on BNB Chain helped strengthen investor sentiment.
- CoinGlass data showed rising open interest and positive funding rates, signaling that traders continue building bullish positions on BNB.
According to data from crypto.news, BNB (BNB) price traded around $687 at press time on May 15 after briefly rallying above $690 earlier in the session. The token has now recovered nearly 18% from its April lows near $580 as sentiment surrounding the Binance ecosystem continued improving.
BNB’s latest rally appears to have been fueled by a combination of institutional, ecosystem, and regulatory catalysts unique to the token.
One of the biggest drivers remains growing market optimism surrounding pending spot BNB ETF proposals tied to asset managers seeking broader institutional exposure to the token. Investor sentiment also strengthened after the recently launched leveraged Teucrium 2x Long Daily BNB ETF continued attracting attention from traditional market participants looking for amplified exposure to Binance Coin.
At the same time, BNB Chain has continued expanding its role within the tokenized real-world asset sector. Recent integrations involving institutional tokenization initiatives and stablecoin infrastructure on the network have reinforced expectations that BNB Chain could become a larger player in blockchain-based financial settlement systems.
The network has also benefited from improving on-chain activity in recent weeks. Decentralized exchange volumes, stablecoin transfers, and BNB Chain ecosystem participation have all shown signs of recovery alongside the broader crypto market rebound.
Meanwhile, investor sentiment toward Binance itself has improved modestly after months of pressure tied to U.S. regulatory and compliance scrutiny earlier this year. The fading intensity of those concerns appears to have helped reduce bearish pressure on BNB during the latest recovery phase.
Derivatives positioning has additionally turned increasingly bullish. CoinGlass data showed rising open interest and positive funding rates over recent sessions, signaling that traders continue building long exposure as momentum strengthens.
BNB price analysis
On the daily chart, BNB appears to be forming a bullish double bottom pattern with two major lows established near the $580 support region over the past several months.

The neckline of the pattern sits near the $680–$690 resistance zone, which bulls are currently attempting to reclaim decisively. A confirmed breakout above the neckline would validate the pattern and could potentially trigger a measured move toward the $780 region by adding the height of the formation to the breakout level.
The current setup also shows BNB gradually reclaiming higher lows while continuing to trade firmly above the Supertrend indicator near the $627 region, signaling that buyers currently maintain broader trend control.
Momentum indicators continue to support the bullish outlook. The MACD recently completed a bullish crossover while the histogram continues printing expanding green bars, suggesting upside momentum remains intact despite short-term consolidation below resistance.
Meanwhile, the broader recovery structure remains constructive as long as BNB holds above the key $650 support zone. A successful breakout above the neckline resistance could strengthen momentum toward the psychological $700 level, followed by the $750–$780 region.
However, failure to hold above current support levels could weaken the bullish setup and potentially trigger a pullback toward the $627 and $600 support zones, where buyers previously reentered aggressively.
Disclosure: This article does not represent investment advice. The content and materials featured on this page are for educational purposes only.
Crypto World
Global Bond Markets Are Imploding: But What Are They Saying About China, Oil, and the Economy?
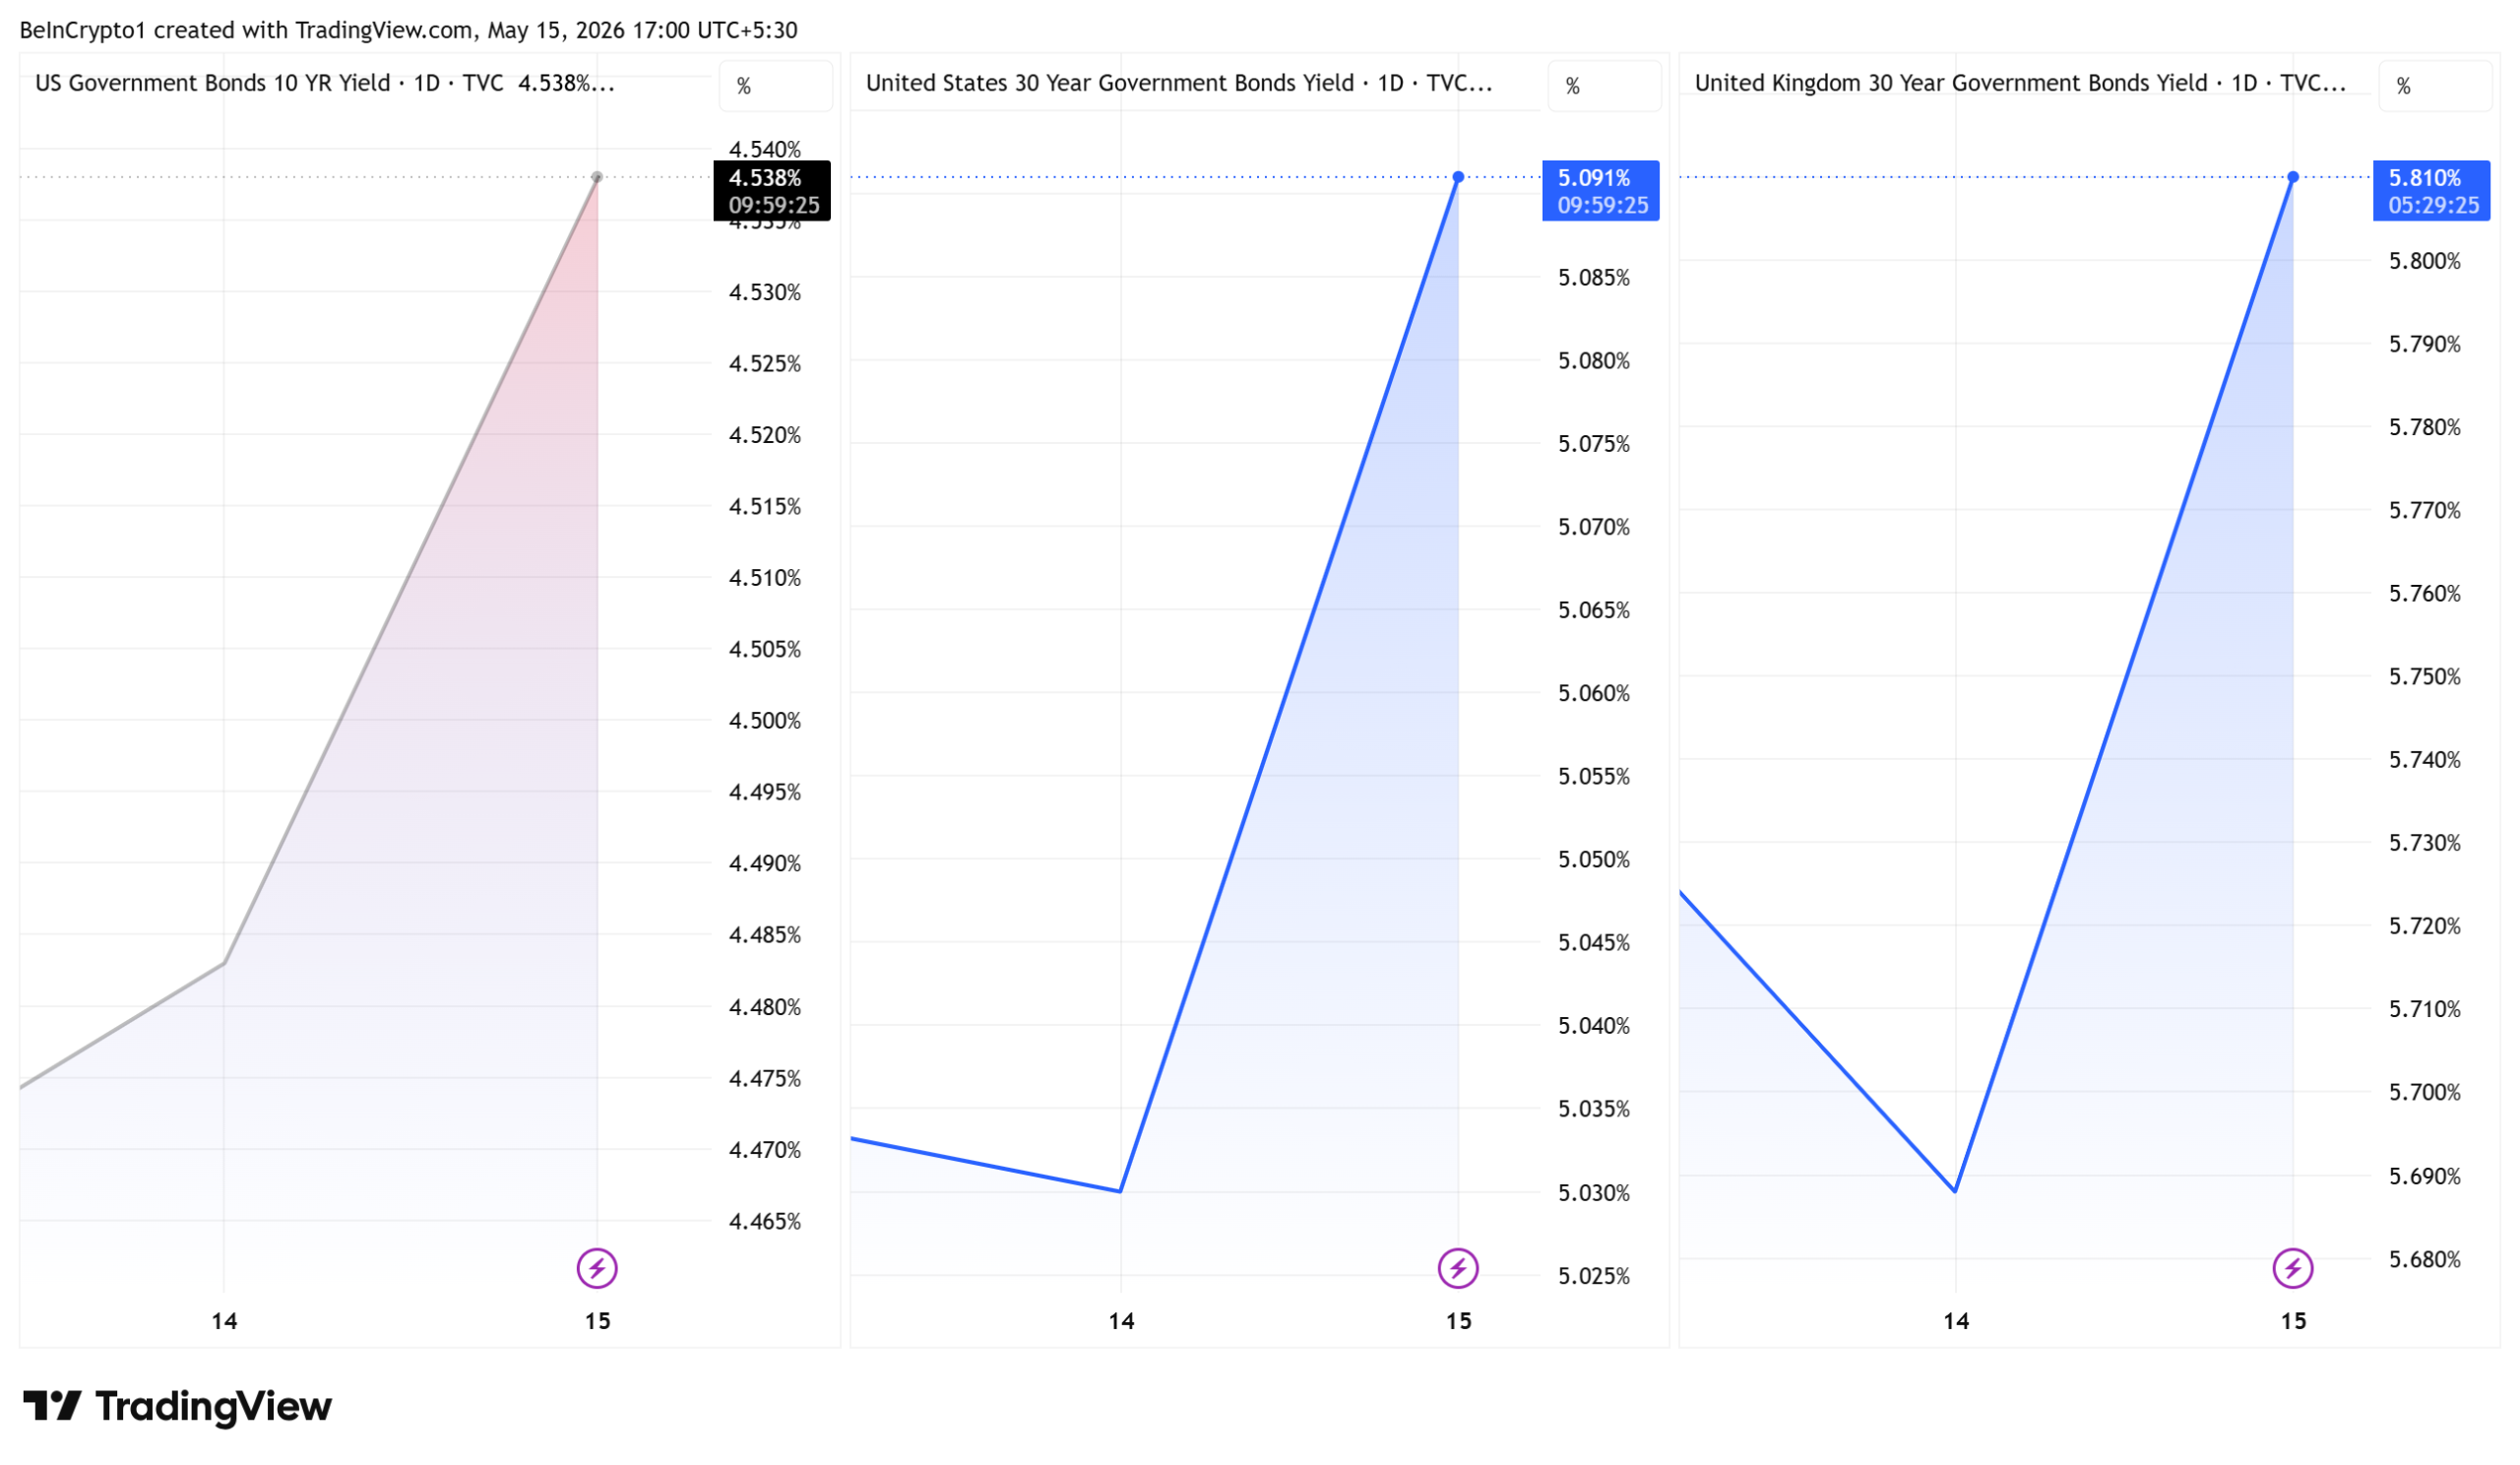
Global bond yields jumped on Friday as oil prices climbed. The UK 30-year gilt hit 5.82%, its highest level since 1998.
The selloff hit US Treasuries, UK gilts, and Japanese government bonds. Traders are now asking what fixed income is signaling about China, oil supply, and government deficits.
A Synchronized Yield Spike Across Major Economies
Allianz chief economic adviser Mohamed El-Erian said the move was driven by the oil jump. Japan’s producer price data also came in hotter than expected.
The 30-year Japanese yield traded at 4% for the first time since 1999. The UK 10-year sat near 5.14% and the German 10-year added 7.5 basis points to 3.12%.
US Treasury yields climbed in tandem. The 10-year held near 4.54%, the 20-year at 5.10%, and the 30-year at 5.09%.

“Every maturity is rising at the same time,” trader Bull Theory highlighted.
Stocks brushed it off. The S&P 500 hovered near a record 7,501 on AI optimism. The S&P earnings yield now sits well below the 10-year, a rare setup last seen in 2003.
“Bond yields do not care about AI. They care about a $2 trillion annual deficit, oil at $100, persistent inflation and a government borrowing more money every single day to fund a war,” Bull Theory added.
What Yields Are Saying About China and the Economy
On China, the signal is skepticism. Mad Money host Jim Cramer said equity markets assume China’s leader Xi Jinping will absorb the oil disruptions tied to President Donald Trump.
He flagged no firm trade commitments. Bond traders appear less convinced.
On the economy, bonds are pricing higher-for-longer inflation. They also reflect swelling deficits and central banks unable to cut quickly.
UK gilts are flagging fiscal stress. Japanese long bonds mark the end of decades of yield repression as the Bank of Japan normalizes policy.
Fixed income is pricing limited diplomatic relief from China, an oil-driven inflation pulse, and higher borrowing costs. Stocks are still pricing AI-driven earnings strength.
Both views cannot stay right indefinitely. The next moves in oil, Bank of Japan signals, and any Trump-Xi follow-up will likely decide which side breaks first.
The post Global Bond Markets Are Imploding: But What Are They Saying About China, Oil, and the Economy? appeared first on BeInCrypto.

Bitcoin was built to move money, not host home videos. Yet for more than a decade, developers, artists, and trolls have smuggled animated images and video clips into on-chain transaction data.
Tens of thousands of archival nodes around the world download them, validate them, and store them or their ownership certificates on hard drives indefinitely. Some of it’s art. Most of it’s just silly.
The methods range from elegant to absurd. Some formats wrap a file inside a single transaction’s witness data or stamp pixels into transaction outputs. Other methods slice files into bizarre private keys.
A few stash content in Counterparty servers or other pointer-type certificates of ownership.
No matter the methodology, one unifying feature is permanence. Once miners confirm a video clip or its metadata within a block, no one can scrub it out.
Below is one example per format type. Each video paid a BTC transaction fee to be mined as a consensus-valid transaction. Each will sit on every archival Bitcoin node for as long as the network exists.
Read more: Bitcoin mining industry mostly uninterested in spam controversy
Bitcoin’s first GIF was a Pepe
Long before the words “NFTs” or “Ordinals” entered the crypto industry, Counterparty was sliding arbitrary data into Bitcoin transactions.
By 2016, a user known only as Mike began issuing Rare Pepe digital trading cards on the protocol. Series 1, Card 37, UFOPEPE, is widely recognized as the first known GIF on Bitcoin, although only part of it actually resided on-chain.

An early protocol by hobbyists, Counterparty users didn’t store all data for each image and GIF video on the blockchain, but rather relied on third-party storage services. Ownership and links to any hosting service did, however, transfer on-chain.
The card shows Pepe the Frog in a flying saucer. The Rare Pepe directory’s submission rules explicitly permitted animated GIFs up to 1.5 megabytes.
That’s how a cartoon frog with extraterrestrial ambitions became one of the earliest moving images permanently encoded into Bitcoin lore.
A bird having a good time forever
Inscription 2, inscribed onto Bitcoin’s blockchain using a novel technique in December 2022, is an animated GIF attached to Bitcoin’s blockchain via Casey Rodarmor’s Ordinals protocol.
Like Counterparty, Ordinals inscriptions require the user to run specialized software to interpret Bitcoin’s blockchain in a way that renders the image by default.
Still, the entire image is there, on the blockchain, with no third-party hosting service.

It depicts a colorful bird looping through a dance move. It landed on the blockchain a month before Rodarmor formally released ORD software version 0.4.0 in January 2023, the version he marketed as ready for mainnet inscriptions.
That release listed only HTML, CSS, JavaScript, SVG, MP3, PNG, and JPEG as supported content types.
Undeterred, a sophisticated early inscriber tested the boundary by publishing a GIF anyway. The protocol accepted it. The network mined it.
Although Bitcoin Core software doesn’t render Ordinals as images by default, the bird has been vibing on tens of thousands of nodes for years.
A frog tailslide
By 2025, ORD software added mainstream support for video files, and someone in the Rodarmor’s Hell Money Podcast orbit took advantage.
Inscription 84,106,770, mined in February 2025, within Bitcoin block 881,921, is an MP4 file of a skateboarder grinding a backside tailslide with a green cartoon frog head hovering over his face.

The clip lives contiguously inside a single Taproot transaction’s witness data. Like all Ordinals-based inscriptions, Bitcoin Core software doesn’t render the video by default, yet all the data to render it exists on Bitcoin’s blockchain.
Pixel-art animations stamped into UTXOs
Bitcoin Stamps pushed permanence further. The SRC-20 protocol, launched by a pseudonymous developer who goes by “Mike in Space,” encodes base64 image data directly into Counterparty-like transaction outputs.
Unlike Taproot witness data, nodes cannot prune those outputs without breaking consensus.
One of the earliest video stamps is Stamp 54, created on March 18, 2023. The file is very small, just 213 bytes, which renders below.

Although Bitcoin Core doesn’t render STAMP videos by default, like Ordinals videos, anyone can download Stamps software to view the Bitcoin blockchain and render these images from the data on any full node.
Stamps supports PNG, JPG, GIF, SVG, and HTML files up to 65 kilobytes. That leaves room for short looping animations.
There are other artisanal methods to publish full videos on the Bitcoin network that skip easy-to-use protocols like Counterparty, Ordinals, or STAMPS.
In early 2026, for example, Bitcoin developer Martin Habovštiak showed that he could pack a 66 kilobyte picture into one Bitcoin transaction without going near OP_RETURN or Taproot witness data.
His trick was to craft the raw transaction so that its bytes also happened to be a valid image. The maneuver which used a bizarre yet valid private key sailed past every standardness filter the conservative Knots crowd had shipped.
Habovštiak’s tactic intentionally landed in the middle of infighting over a chain fork proposal to ban such arbitrary data storage at the consensus layer.
Although clever and obviously intended to troll Luke Dashjr, developer of Bitcoin node software Knots whose mempool filters arbitrary data more aggressively than Bitcoin Core, this bypass failed to gain much real world utility.
It also uses a non-standard transaction type, i.e. not propagated by Bitcoin Core’s default mempool, and thus requires higher fee payments and manual routing of each transaction to a miner.
Protos was unable to find an example of a GIF or MP4 file using Habovštiak’s bypass, but it’s possible that one exists on-chain, and anyone could craft such a transaction and pay a miner to mine it.
If any exist, like all on-chain files on the famously restricted Bitcoin network, it would have to be very small.
Habovštiak has admitted a ceiling of 66 kilobytes for his method, although other methodologies might be possible to accommodate larger files.
Got a tip? Send us an email securely via Protos Leaks. For more informed news and investigations, follow us on X, Bluesky, and Google News, or subscribe to our YouTube channel.


Hyperbridge has launched a public bug bounty program on HackenProof, offering rewards of up to $50,000 for critical vulnerabilities.
Summary
- Hyperbridge offers $50,000 rewards for critical bugs as researchers review cross-chain messaging and fund safety.
- The program follows April’s fake DOT exploit that exposed proof verification risks across Hyperbridge systems.
- HackenProof rules require proof-of-concept reports while banning live attacks and third-party exploit testing by researchers.
The program invites independent security researchers to review the protocol codebase and submit reports through the security platform.
The HackenProof page lists the Hyperbridge Protocol program as live and active. It describes Hyperbridge as a system that lets blockchains communicate and transfer assets through consensus and state proofs, rather than older bridge models that rely on multisig committees.
Rewards cover key bridge risks
Hyperbridge said rewards start at $200 for low-severity reports and rise to $2,000–$5,000 for medium findings. High-severity bugs can earn $5,000–$15,000, while critical vulnerabilities can receive up to $50,000.
The scope covers the full Hyperbridge protocol repository. The team said researchers can report logic flaws, access-control issues, reentrancy, cross-chain message spoofing, state manipulation and any flaw that could affect message or fund integrity.
April exploit pushed security review
The program follows an April exploit in which an attacker minted roughly 1 billion fake DOT-equivalent tokens on Ethereum through Hyperbridge’s cross-chain gateway. Crypto.news reported that the attacker gained admin control through a forged cross-chain message and extracted about $237,000 in ether.
The same report said the fake supply affected the bridged DOT representation, while Polkadot’s native network remained technically unaffected. It also linked the case to wider bridge risks, where forged messages and weak verification checks remain common attack paths.
In addition, Hyperbridge said testing must happen on local forks only. Live infrastructure attacks, social engineering and third-party exploits are outside the program’s scope.
The HackenProof page also requires proof-of-concept submissions and lists rules against service disruption, personal data access, spam, DDoS testing and reports that rely only on theory. It says researchers must stay within scope and avoid public disclosure without approval.
Cross-chain use case remains active
Hyperbridge had already appeared in crypto.news coverage before the exploit. In May 2025, Enjin Blockchain used Hyperbridge on testnet to support cross-chain stablecoin transfers involving USDC and USDT from Ethereum and BNB Chain.
That earlier setup showed why bridge security matters. Users lock tokens on one chain and receive a matching version on another network. When proof checks fail, the risk can move from one contract into a wider cross-chain system. The new bounty places Hyperbridge’s code under wider review as the protocol works to reduce repeat failures.

Your day-ahead look for May 15, 2026
Crypto World
Clarity Act Just Got Biggest Win Yet: Bitcoin Price Prediction Gave Back Half the Rally Day End

Bitcoin surged to $82,000 Thursday before pulling back to consolidate near $80,500, as a Senate committee vote on the long-awaited Clarity Act injected fresh regulatory optimism into crypto markets and fueled bullish price predictions.
The rally touched an intraday high of $82,000 before cooling, and the question now is whether BTC can hold its footing or whether that spike was just a headline trade.
The US Senate Banking Committee advanced the Clarity Act in a 15-9 vote, with two Democratic senators crossing party lines to support the bill on digital asset market structure.
BREAKING: — Bitcoin Magazine (@BitcoinMagazine) May 14, 2026
 Senate Banking Committee PASSES the Clarity Act in 15-9 vote.
The bill now goes to the full Senate. pic.twitter.com/TCs6T283y2
Markets responded immediately: Coinbase (COIN) jumped 8%, MicroStrategy (MSTR) added 7%, and Bitcoin ETFs absorbed $131.3 million in net inflows on May 14.
With the bill now moving to the full Senate, crypto markets are pricing in a structural shift. The next question is whether the price chart supports the headlines.
Bitcoin Price Prediction: Can Bitcoin Price Push Past $82,000 After the Clarity Act Catalyst?
Bitcoin price is trading at $80,500. Below it, the $80,000 level has become the defining psychological floor. BTC has bounced off it twice in the past week, signaling a degree of institutional bid support sitting beneath that mark.
Momentum has shifted cautiously bullish following the Clarity Act news, but the structure is not clean yet. Immediate resistance sits just above $82,000, precisely where the initial spike was sold.
Analysts identify $74,000 as the key downside test level if macro conditions deteriorate or the Senate bill stalls.
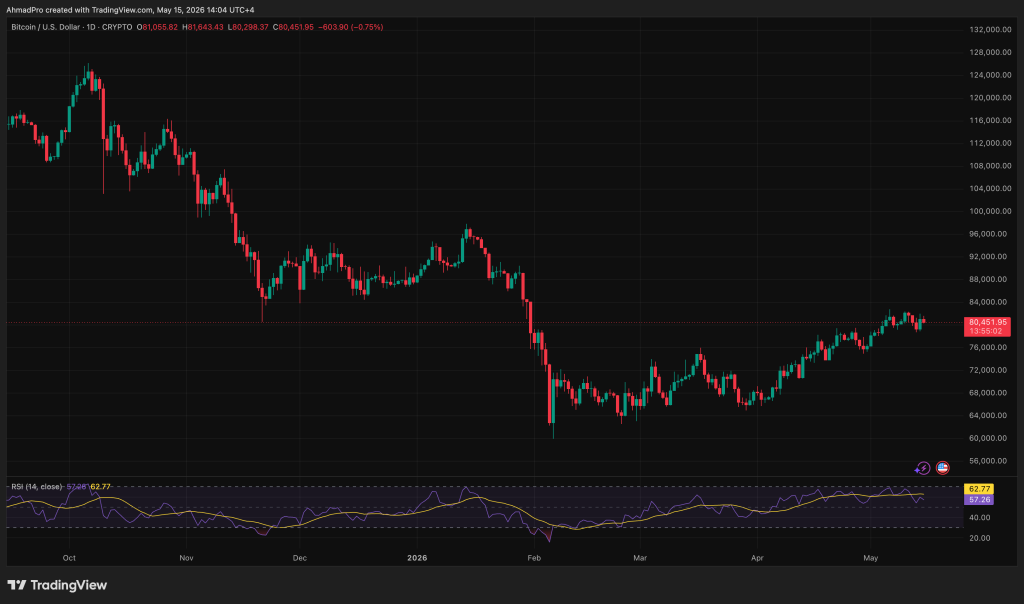
Clear $82,000 on sustained ETF demand and momentum traders target the $85,000 to $88,000 band as the next resistance zone.
Fail to break it, and price consolidates in the $79,000 to $82,000 range while the market waits for the full Senate vote and incoming macro data.
A close below $79,000 likely triggers a retest of $74,000, which analysts cite as a potential bear market support zone.
Post-halving dynamics remain a background factor. Binance notes the post-halving price move has not been dramatic so far, with regulation and macro sentiment flagged as the likely drivers of any next major leg.
The legislative tailwind is real. Whether it holds through a full Senate vote is the only question that matters right now.
Bitcoin Hyper Wants to be The Best 1000x Beta Play to Bitcoin Once Bullmarket Starts
BTC at $81,000 is encouraging, but a market cap already north of $1.6 trillion means the multiples that made early Bitcoin holders wealthy simply aren’t available here.
That’s the math that keeps rotating capital into early-stage infrastructure plays whenever BTC catches a bid. (And every cycle, that rotation has produced at least a handful of outsized winners.)
Bitcoin Hyper is one of the more technically differentiated presales in the current cycle. The project positions itself as the first Bitcoin Layer 2 with native Solana Virtual Machine (SVM) integration, targeting sub-second finality and low-cost smart contract execution while inheriting Bitcoin’s security layer.
The pitch is direct: break Bitcoin’s core limitations (slow transactions, high fees, no programmability) without abandoning the trust model that makes BTC worth building on.
Presale figures as of writing: price is $0.0136801 per $HYPER, with $32,687,617.54 raised in total. Staking is live with a high APY (specific rate disclosed on-platform), and key infrastructure includes a Decentralized Canonical Bridge for BTC transfers.
As with any early-stage token, smart contract risk and post-listing volatility are real considerations; DYOR applies here more than anywhere.
The post Clarity Act Just Got Biggest Win Yet: Bitcoin Price Prediction Gave Back Half the Rally Day End appeared first on Cryptonews.


- XDC climbed over 10% to surpass $0.037 on May 15, reaching its highest level since early March.
- Catalysts include potential DTCC integration and Bitcoin rally.
- The technical picture highlights resistance at $0.040.
XDC Network price climbed double digits to above $0.037 on May 15, with the uptick pushing the token’s value to its highest level since early March.
XDC now hovers near the key resistance line formed since late January 2026, but can it go higher?
XDC edges higher as market sentiment improves
As noted, XDC rallied sharply on May 15, rising more than 10% intraday as buyers re-entered the market.
The move lifted the token to levels not seen since early March, placing it directly beneath a horizontal supply zone near $0.040.
Trading volumes rose alongside the advance, signalling conviction among participants who are testing whether the late-January resistance can be turned into support.
But why did the XDC Network price surge in the past 24 hours?
The XDC rally coincides with broader strength in the crypto market, led by Bitcoin’s reclaiming of the $80,000 mark.
That recovery prompted many altcoins to retrace losses they incurred during a macro-driven sell-off this week, creating a risk-on backdrop that supported XDC.
Beyond market-wide tailwinds, several project-specific catalysts likely have recently helped to amplify demand.
This includes the potential adoption as a key digital asset of the Depository Trust & Clearing Corporation.
DTCC, debuting trading in July ahead of full-scale launch in October 2026, has ignited interest in XDC alongside XRP, Chainlink, Quant, and Hedera (HBAR).
While XRP gains momentum as the top token for institutional post-trade settlement, XDC looks to stand out as the primary rail for tokenized bills of lading and letters of credit. XDC’s Contour acquisition, completed in 2025, cements this outlook.
XDC Network price forecast
The latest gains have pushed XDC price further from a descending wedge pattern that had compressed price action since late January.
Bulls are now confronting a horizontal supply zone around $0.040, which also aligns with the 200-day exponential moving average (EMA).

A decisive break and daily close above this level would likely confirm bullish momentum and could open up fresh bids around the $0.046-$0.052 supply zone.
The area marks the range that corresponds to prior congestion and could be the next resistance cluster.
However, bulls must first hold the recently breached $0.037 level. Failure to do so would raise the probability of a pullback to the 100-day EMA near $0.033.
On heavier selling, February’s lows near $0.029 become a plausible target for short-term sellers seeking to reassert control.
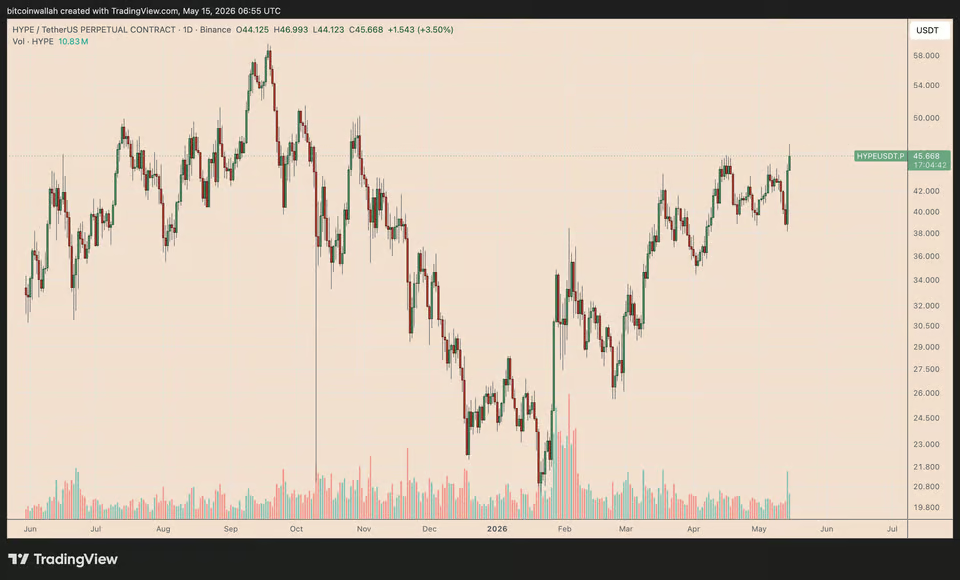
HYPE, the native token of decentralized exchange Hyperliquid, jumped more than 23% in the past 24 hours, climbing toward $47 on Friday to hit its highest level since October 2025.

HYPE/USDT daily chart. Source: TradingView
What is driving the sudden HYPE rally, and does the token have enough momentum to extend its bull run in the coming days?
Key takeaways:
- This week’s multiple US spot HYPE ETF launches have strengthened the token’s institutional-demand narrative.
- Coinbase becoming Hyperliquid’s USDC treasury deployer boosts HYPE prices.
HYPE ETF launches fuel institutional demand hopes
The biggest immediate catalyst behind HYPE’s rally appears to be the arrival of US-listed Hyperliquid exchange-traded products.
On Friday, Bitwise launched its spot Hyperliquid ETF, trading under the ticker BHYP on the NYSE.

HYPE/USDT daily chart. Source: TradingView
The fund gives investors regulated exposure to HYPE and intends to stake a portion of its holdings through Bitwise’s in-house staking division. Its sponsor fee is set at 0.34%, with a full waiver for the first month on the first $500 million in assets.
The launch follows 21Shares’ Hyperliquid ETF, THYP, which debuted on Nasdaq on Tuesday.
A day later, onchain data resource Lookonchain claimed that wallets linked to venture capital firm a16z had purchased nearly $67.5 million worth of HYPE tokens.

Source: X
The purchases reportedly took place in the month leading up to the ETF launches, adding to signs of growing institutional interest in Hyperliquid.
Sustained upside through May will likely depend on whether the HYPE ETFs attract meaningful inflows rather than simply generating launch-week speculation.
As of Friday, they were managing $3.17 million worth of assets, according to SoSoValue data.

US spot HYPE ETFs net flows. Source: SoSoValue
Coinbase, Circle deal adds structural tailwind for HYPE rally
HYPE’s rally also gained momentum after Coinbase announced on Thursday that it had become the official treasury deployer of USDC on Hyperliquid.
The deal strengthens USDC’s role as the main collateral and quote asset across Hyperliquid’s onchain markets.
The stablecoin already accounts for roughly $5 billion in supply on Hyperliquid, making it the dominant stablecoin in the ecosystem, according to DefiLlama.

Stablecoin market cap on Hyperliquid. Source: DefiLlama
Under the upgraded AQAv2 framework, Coinbase is expected to share the vast majority of reserve-yield revenue from USDC deployed on Hyperliquid with the protocol.
Circle will also serve as the technical deployer for USDC on Hyperliquid and has committed to stake 500,000 HYPE tokens.
“It’s an admission that Hyperliquid is too dominant in perps to displace, so better to align and capture distribution,” analyst Aylo said in a Thursday post, adding:
“We should see an increase of ~$140M+ in annualised revenue which will be used to buyback HYPE.”
CLARITY Act progress adds regulatory tailwind
HYPE’s rally also came as US crypto regulation showed signs of progress.
On May 14, the Senate Banking Committee advanced the CLARITY Act in a 15–9 vote, marking a key step for a bill that aims to define when digital assets fall under securities or commodities rules.
The update improved sentiment across crypto markets, sparking intraday rallies in Bitcoin, Ethereum, XRP and other top coins.
Still, the CLARITY Act is not law yet. The bill now heads to the Senate, where it will likely need broader bipartisan support to overcome procedural hurdles.
If it passes the Senate, lawmakers would still need to reconcile it with the House version before sending a final bill to President Donald Trump for approval.
HYPE rising wedge warns of 30% price correction
HYPE’s ongoing upside momentum remains inside what appears to be a rising wedge pattern, confirmed by the price trending inside two converging, upward-sloping trend lines.
In technical analysis, such a wedge typically plays out when the price breaks below its lower trend line and falls to the level at a length equal to the structure’s maximum height.

HYPE/USDT daily chart. Source: TradingView
Applying this rule to the HYPE chart brings its downside target to the $26.5–$31.20 range, depending on the potential breakdown point, as shown above. That means a potential 30%-45% correction by June or July.
Conversely, a decisive breakout above the rising wedge’s upper boundary may invalidate the bearish setup altogether, pushing HYPE’s price toward the $59–$60 range, aligning with the 1.0 Fibonacci retracement level shown below.

HYPE/USDT daily chart. Source: TradingView
HYPE’s daily relative strength index (RSI) also supports the short-term bullish case. The indicator remains below the overbought threshold of 70, suggesting the price still has room to extend its rally.

Ingredion in talks to buy Tate & Lyle

Overbought vs Oversold Stocks Explained
The Best WWII Movie of 2025 Also Gave Us the Genre’s Most Devious Villain in Decades
Manchester United reach agreement with Casemiro over contract clause amid transfer speculation

US brings back mandatory military draft registration

Steven Gerrard disagrees with Gary Neville over ‘shock’ Chelsea and Arsenal claim | Football


-

 Fashion7 days ago
Weekend Open Thread: Marianne Dress
-

 Fashion4 days ago
Coffee Break: Travel Steam Iron
-

 Fashion4 days ago
What to Know Before Buying a Curling Wand or Curling Iron
-

 Politics4 days ago
What to expect when you’re expecting a budget
-

 Tech5 days ago
Auto Enthusiast Carves Functional Two-Stroke Engine from Solid Metal
-
 Business6 days ago
Ignore market noise, India’s long-term story intact, say D-Street bulls Ramesh Damani and Sunil Singhania
-

 Politics6 days ago
Politics Home Article | Starmer Enters The Danger Zone
-

 Tech4 days ago
GM Agrees To Pay $12.75 Million To Settle California Lawsuit Over Misuse Of Customers’ Driving Data
-

 Crypto World5 days ago
CZ says US crypto rivals tried to block Trump pardon
-

 Crypto World6 days ago
PROS explodes 48% as Upbit and Bithumb listings ignite demand
-

 Entertainment7 days ago
YNW Melly Denied Bond Again Ahead Of Double Murder Retrial
-

 Tech4 days ago
GM agrees to $12.75M California settlement over sale of drivers’ data
-

 Crypto World7 days ago
Kraken Parent Seeks OCC Charter, Signaling Regulated Banking Access
-
Crypto World7 days ago
The Hantavirus Danger: Can a Potential Outbreak Spark a New Meme Coin Frenzy?
-

 Sports7 days ago
After Waka Waka, Shakira now drops first teaser for FIFA WC 2026 song | FIFA World Cup 2022
-
Crypto World2 days ago
Bitcoin Suisse expands with Digital Asset License and Investment Business Act Registration Approval in Bermuda
-
 Crypto World7 days ago
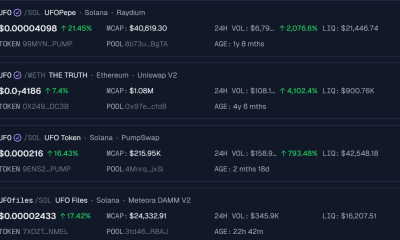
Solana UFO Meme Coins Surge After Pentagon Reveals Alien Files
-

 Entertainment7 days ago
Bethenny Frankel Says She Loves ‘Torturing’ Men
-

 Sports7 days ago
Why Nathan Mackinnon Remains the Hart Trophy Favourite over Connor McDavid and Nikita Kucherov | NHL
-

 Politics3 days ago
Pakistan to enter Chinese capital market as war inflation bites
You must be logged in to post a comment Login