
Crypto World
Berachain (BERA) is up 75%: here’s why the altcoin is rising


- Berachain’s strategic shift toward revenue-driven apps boosted long-term confidence.
- The successful mainnet launch and smooth token unlock have helped ease BERA’s selling pressure.
- Berachain’s token price needs to stay above $0.8318 for the bullish momentum to hold.
Berachain’s native token, BERA, posted a sharp 75% rally in 24 hours, drawing renewed attention from traders and long-term crypto investors alike.
The move comes after a prolonged period of weakness that pushed the token close to its all-time lows earlier this year, coinciding with the broader crypto market’s plunge.
This sudden reversal has not been driven solely by hype, but by a combination of structural, strategic, and market-specific developments that have shifted sentiment around the project.
Below is a breakdown of the key reasons behind BERA’s strong rebound and what it could mean going forward.
Strategic shift toward revenue-generating applications
One of the most important catalysts behind BERA’s rally is Berachain’s strategic pivot toward supporting applications that generate real, sustainable revenue.
In its end-of-year report, Berachain stated that it has moved away from heavy reliance on token incentives and emissions that often attract short-term liquidity but create long-term sell pressure.
Instead, the focus is now on encouraging builders to create businesses that generate fees, activity, and organic demand for the token.
This shift has resonated with the market because it addresses one of the biggest criticisms of many layer-1 projects, which is the lack of durable economic value.
By prioritising sustainable use cases, Berachain has improved investor confidence in the long-term utility of BERA.
This narrative change has helped reframe BERA from a speculative asset into a token with a clearer economic role within its ecosystem.
Token unlock passed without heavy selling pressure
BERA also benefited from a token unlock event that did not result in the aggressive selling many had anticipated.
According to data from Tokenomist, Berachain, on February 6, unlocked tokens worth around $24 million.
Token unlocks often lead to sharp declines as early holders rush to realise profits.
In this case, the market absorbed the additional supply relatively smoothly.
The lack of panic selling surprised traders and reinforced the idea that weaker hands had already exited during the long downtrend.
This dynamic contributed to a relief rally, as short sellers were forced to reconsider their positions.
As selling pressure failed to materialise, upward momentum accelerated.
Berachain mainnet launch
Berachain’s mainnet launch on February 6 marked a critical milestone for the project and laid the foundation for long-term ecosystem growth.
The launch was accompanied by a large airdrop that distributed a meaningful portion of the token supply to early users and contributors.
This helped decentralise token ownership and encouraged active participation across the network.
By rewarding testnet users and liquidity providers, Berachain strengthened its community and increased on-chain engagement.
The mainnet launch also made it easier for users to interact with the network through familiar wallet infrastructure.
Together, these developments increased visibility and usage, supporting the recent recovery in price.
BERA price forecast
From a technical perspective, the most important support level sits at $0.8318, which needs to hold to maintain the current bullish structure.
As long as BERA remains above this zone, buyers are likely to stay in control.

On the upside, the first major resistance level is located at $1.51, where profit-taking pressure could emerge.
A clean break and sustained move above $1.51 would open the door for a rally toward the next resistance at $1.86.
If bullish momentum continues and market conditions remain favourable, analysts say that the third resistance level to watch is around $2.19.
Failure to hold above the key support, however, could invalidate the bullish outlook and return BERA to consolidation.
But for now, the combination of improved fundamentals and constructive technical levels suggests that traders will remain closely focused on how price behaves around these zones.


Block co-founder Jack Dorsey and the company’s lead independent director, Roelof Botha, have laid out a forward-looking vision in which artificial intelligence could fundamentally change how work is coordinated. In a blog post published this week, they describe a model where AI would take on the tasks typically handled by middle managers—tracking projects, flagging issues, assigning work, and sharing critical information faster than human processes allow.
The post comes on the heels of Block’s previously reported workforce restructuring, part of a broader wave of AI-driven cost-cutting across the tech sector. Block disclosed that it cut roughly 4,000 jobs in February, an action Dorsey attributed to the rapid pace of AI adoption and the need to stay competitive. In March, some of the employees who had been laid off were quietly rehired, illustrating a cautionary approach to the current wave of optimization. The blog authors emphasize that AI’s role in the new model is evolving, not yet fully realized, and that Block remains in the “early stages” of testing how an intelligence-centric structure could function in practice.
“We’re questioning the underlying assumption: that organizations have to be hierarchically organized with humans as the coordination mechanism. Instead, we intend to replace what the hierarchy does. Most companies using AI today are giving everyone a copilot, which makes the existing structure work slightly better without changing it. We’re after something different: a company built as an intelligence, or mini-AGI.”
Key takeaways
- Block’s leadership proposes replacing traditional hierarchical management with an intelligence-driven framework that leverages AI to coordinate work and decision-making.
- The envisioned structure redefines roles around three pillars: individual contributors, directly responsible individuals, and player-coaches who mentor while continuing to contribute technically.
- AI would enable real-time visibility into what’s being built, what’s blocked, resource allocation, and overall product performance, potentially speeding up information flow beyond conventional managerial channels.
- Despite the AI emphasis, human involvement remains central to strategic and ethical decisions, signaling a blended governance approach rather than a pure automation model.
From hierarchy to intelligence: Block’s strategic shift
The core idea articulated by Dorsey and Botha is a pivot away from the familiar pyramid where instructions travel up and down through layers of management. In a remote-first, machine-readable environment, AI would continuously build and maintain a live picture of organizational activity: what’s in development, what’s blocked, where resources are needed, and what outcomes are proving effective or failing. The authors describe the aim as moving beyond “copilot” enhancements to a more transformative design—an organization that operates as an intelligence rather than a traditional hierarchy.
They emphasize that the pattern could reshape corporate operation across sectors, not just within Block. The argument rests on a simple premise: information flow drives speed and adaptability. If AI can handle the coordination overhead more efficiently than humans, the bottlenecks created by layers of management could recede, enabling faster iteration and more responsive leadership decisions.
To illustrate the proposed shift, Block outlines a three-tier talent model. Individual contributors would be responsible for building and maintaining the operating systems that power the company’s workflows. Directly responsible individuals would tackle specific problems and be empowered to marshal any resources necessary to resolve them. Between these layers, player-coaches would assume manager-like duties—mentoring and supporting others—while continuing to contribute code and substantive work themselves. In this arrangement, the traditional gatekeeping function of middle management would be distributed and augmented by AI-enabled visibility and automation.
People still in the driver’s seat
Even as AI takes on coordination tasks, Dorsey and Botha stress that human judgment remains indispensable. They acknowledge that AI can process information at a scale and speed far beyond human capability, but key business and ethical decisions will continue to require human insight. The blog notes that while AI can present a continuously updated view of operations, it cannot substitute for the values, prudence, and accountability that guide corporate governance.
This stance sits at an important crossroads for investors and workers alike. The acceleration of AI-driven restructuring has historically raised questions about job security, morale, and the long-term viability of new organizational paradigms. Block’s own experience—balancing a major layoff with later rehiring of some affected employees—illustrates a cautious, iterative approach rather than a speculative leap into a fully automated future. The authors’ framing suggests a model where AI acts as a force multiplier for human capabilities, rather than replacing people wholesale.
Why it matters for crypto-adjacent ventures
The broader crypto and fintech sectors have watched Block (the company behind the Cash App and a notable crypto-friendly stance) as a bellwether for technology-enabled financial services. If an AI-first, intelligence-driven corporate structure gains traction, it could influence how other blockchain and payments firms think about product development cycles, regulatory compliance, and governance practices. The potential impact extends to how quickly teams can respond to security risks, how product roadmaps are validated in real time, and how cross-functional collaboration is organized in a hybrid or fully remote environment.
From an investor perspective, the shift raises questions about how governance, risk controls, and performance metrics would be managed in an AI-augmented organization. Real-time visibility into development pipelines and resource allocation could improve transparency, but it also heightens sensitivity to data quality, AI oversight, and ethical considerations in automated decision-making. As with any large-scale adoption of AI in corporate governance, the outcomes will hinge on guardrails, accountability, and the ongoing calibration of human-in-the-loop processes.
Block’s announcement aligns with a wider industry conversation about whether AI can augment, or even replace, certain managerial functions. While the blog presents a staged, experimental path toward an intelligent enterprise, observers will be watching to see whether early pilots yield tangible improvements in productivity, risk management, and employee engagement. The balance between speed and governance will be particularly telling in sectors where regulatory scrutiny and customer trust are paramount.
What to watch next
The immediate questions center on execution and governance. How quickly will Block move from a conceptual framework to concrete organizational changes? What criteria will the company use to assess the success of its AI-driven coordination model? And how will Block address potential pitfalls, such as algorithmic bias, data silos, or accountability for automated decisions?
As AI continues to redefine work patterns across the technology landscape, Block’s approach could foreshadow a broader shift in corporate design. If the model proves adaptable and beneficial, it may prompt other firms to experiment with similar intelligence-driven structures, especially in environments that prize rapid iteration and remote collaboration.
Readers should monitor Block’s forthcoming updates and pilot implementations to gauge whether the vision moves from theory to practice and how those developments influence investor confidence, employee experience, and the broader discourse around AI-enabled governance.

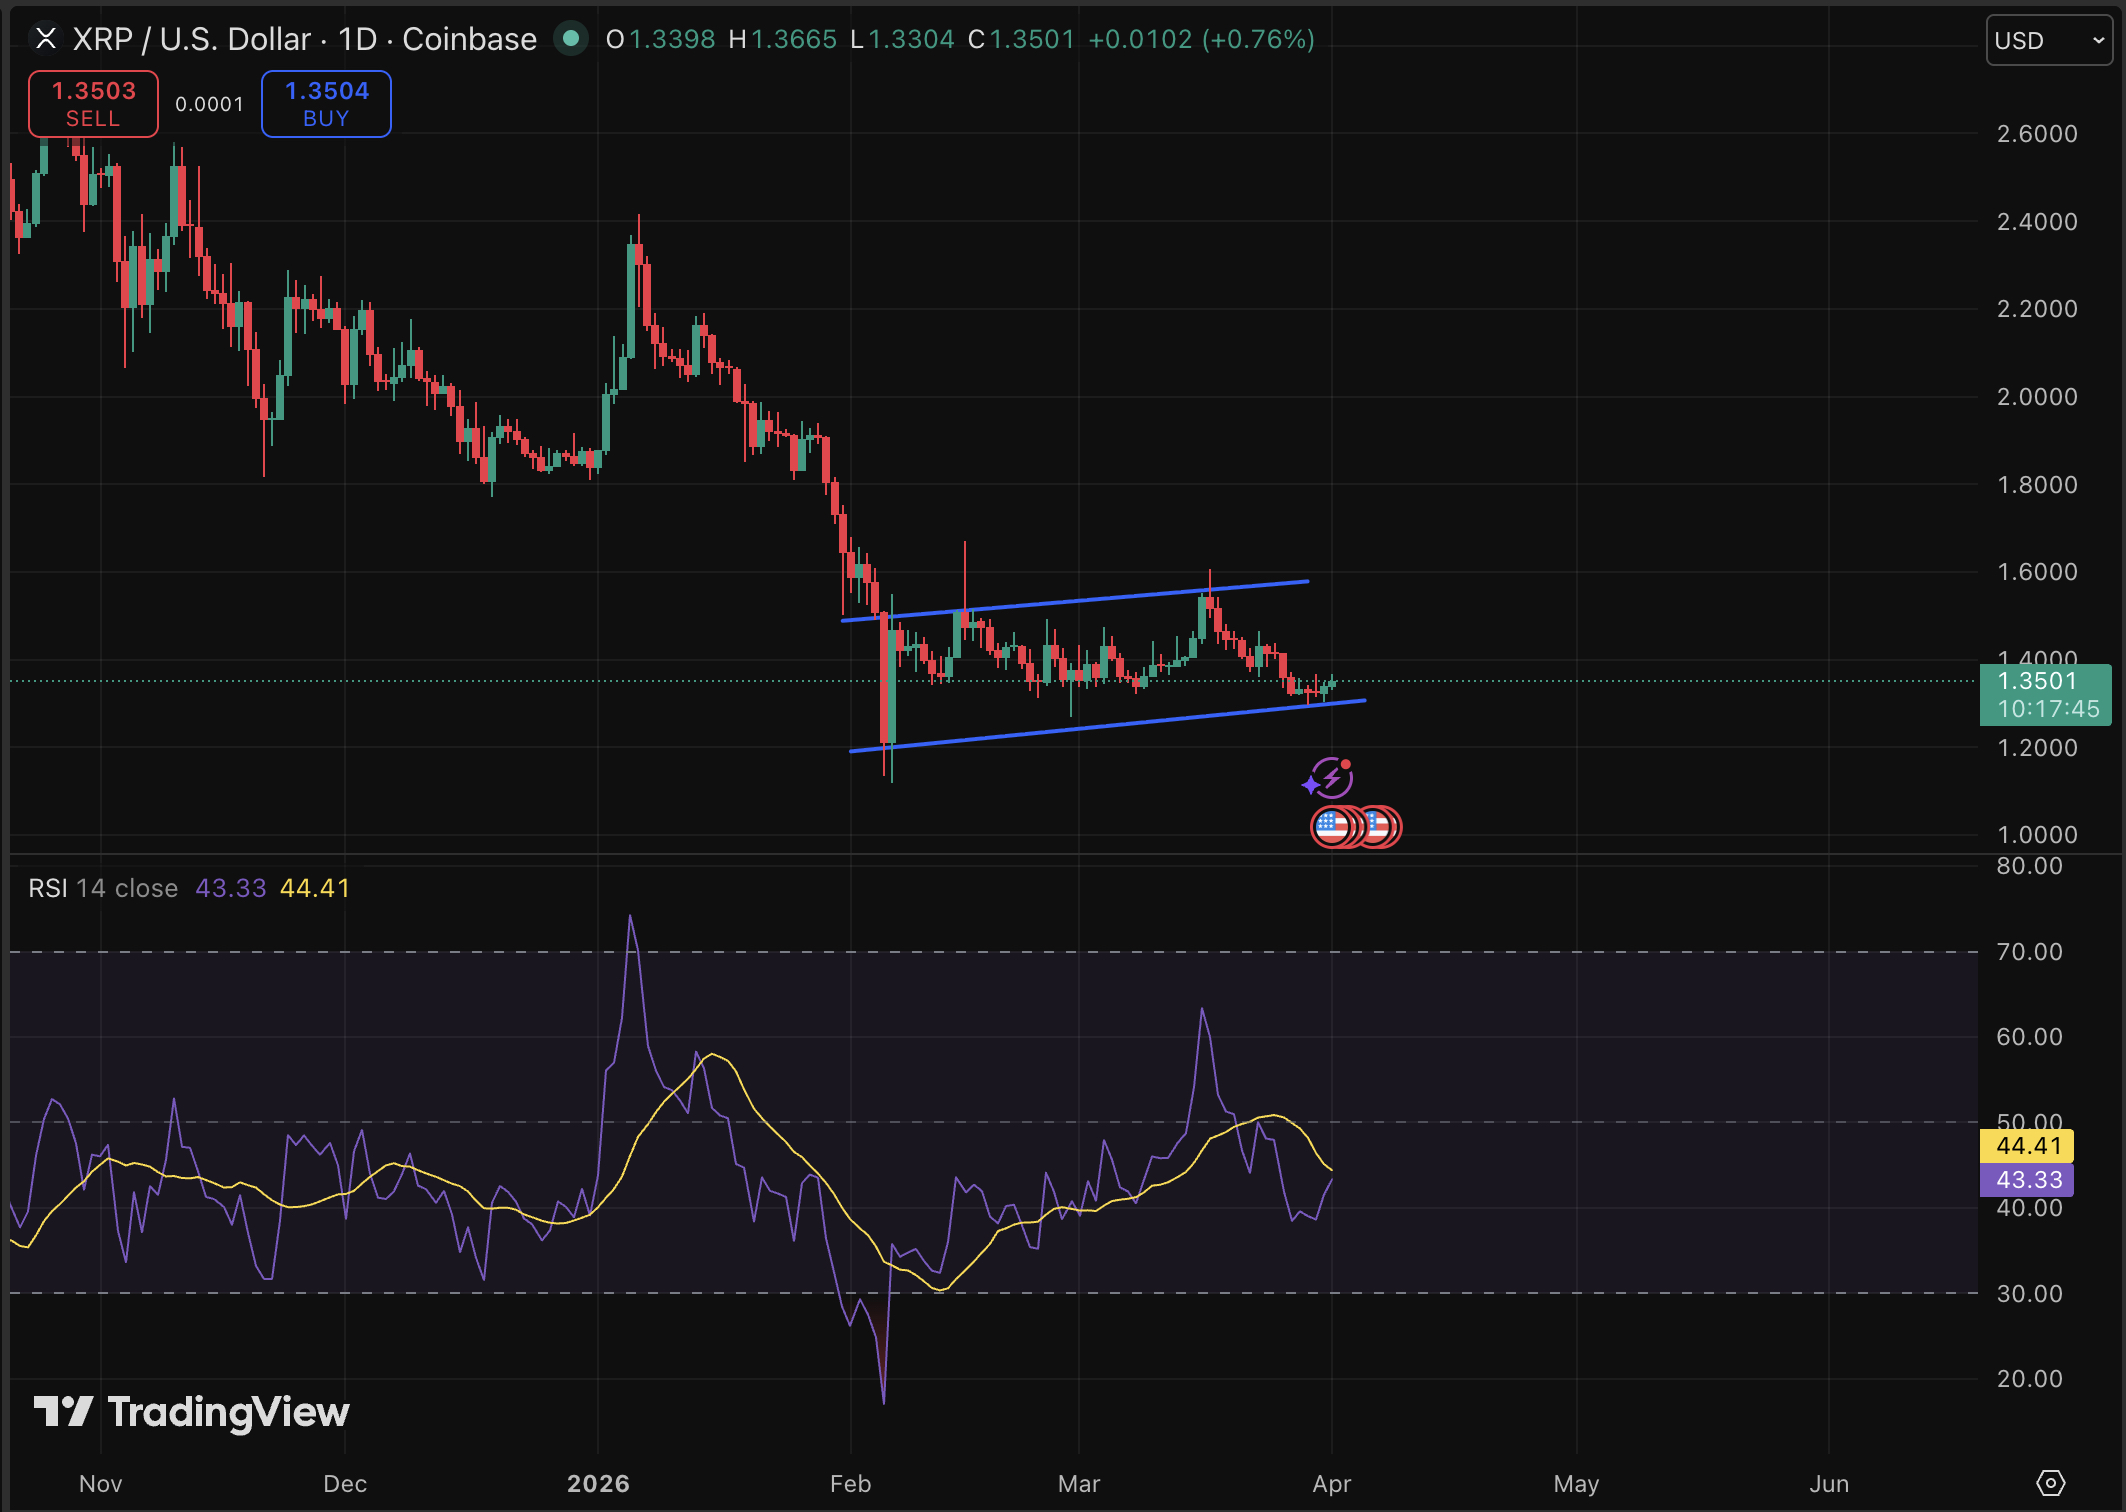
XRP is trading near $1.36 with modest 24-hour gains of up +2.6% in price, but the real story is regulatory, and it could reshape Ripple’s long-term value prediction entirely. The Office of the Comptroller of the Currency’s landmark final rule takes effect April 1, and Ripple is positioned squarely in its crosshairs.
The OCC’s final rule revises chartering regulations to allow national trust banks to conduct non-fiduciary activities alongside fiduciary ones, a structural change that opens the U.S. banking system to crypto-native operators at a federal level.
— JackTheRippler © (@RippleXrpie) March 31, 2026
 RUMORS: @Ripple will officially receive the approval to become a National Trust Bank tomorrow, April 1st. #XRP pic.twitter.com/pDpLpg70jG
Ripple’s conditional approval as a National Trust Bank was granted alongside approvals for BitGo, Fidelity, and Paxos, signaling this isn’t a one-off concession but a systemic policy shift. The full charter remains pending, but conditional approval already allows Ripple to custody client assets under federal oversight as a direct boost to institutional confidence in both XRP and the RLUSD stablecoin.
This development lands as U.S. regulators push crypto deeper into traditional financial infrastructure, making the timing anything but coincidental. The price, however, tells a more complicated story.
Discover: The best pre-launch token sales
XRP Price Prediction: Ripple to Reclaim $2.00 Amid Regulatory Tailwinds?
XRP 24-hour trading volume surging to $2.1 billion, even if conviction is mixed, it is still a notable volume spike. Support still clusters at $1.30 – $1.35, the range that has held through recent consolidation. Resistance begins at $2.20 and extends toward $3.30, the upper bound of recent 24-hour highs recorded on Binance.
XRP remains -63% off its 2025 all-time high of $3.65, with Standard Chartered having revised its 2026 XRP forecast down to $2.80 from an earlier $8.00 target, citing deteriorating market conditions.
April 1 OCC rule, however, can trigger institutional inflows with XRP reclaiming $2.20 resistance within 30 days as custody clarity drives TradFi adoption. But most likely, XRP price consolidates in the $1.35–$1.80 range through Q2 2026, with the full trust bank charter serving as the next catalyst.
The OCC news is structurally bullish for XRP long-term. Near-term price action, though, appears hostage to broader market sentiment until the full charter lands.
Discover: The best crypto to diversify your portfolio with
Bitcoin Hyper Eyes Infrastructure Upside as XRP Tests Critical Support
XRP’s regulatory breakthrough is real, but at a $83B+ market cap, the ceiling on percentage returns requires a specific kind of optimism. Traders hunting asymmetric upside in the current cycle are increasingly rotating toward earlier-stage infrastructure plays where the valuation gap is wider, and the catalyst timeline is front-loaded.
Bitcoin Hyper ($HYPER) is one project absorbing that attention. It positions itself as the first-ever Bitcoin Layer 2 with Solana Virtual Machine (SVM) integration, bringing sub-second smart contract execution to Bitcoin’s ecosystem without compromising the underlying security model. Bitcoin’s trust, Solana’s speed.
The presale has raised $32 million at a current token price of $0.0136, with 36% APY staking rewards available for early participants. Features include a Decentralized Canonical Bridge for BTC transfers, extremely low-latency Layer 2 processing, and high-speed, low-cost transaction execution that outperforms Solana itself on throughput metrics.
Research Bitcoin Hyper before the presale closes.
This article is for informational purposes only and does not constitute financial advice. Crypto assets are highly volatile. Always conduct your own research before investing.
The post XRP Price Prediction: Ripple to Become National Bank? appeared first on Cryptonews.
Crypto World
Solana (SOL) DeFi platform Drift investigates suspicious activity, tells users to halt deposits


Solana-based decentralized finance (DeFi) platform Drift said it is investigating “unusual activity” on its protocol, prompting concerns that the platform may have been exploited.
“We are observing unusual activity on the protocol. We are currently investigating. Please do not deposit funds into the protocol while we investigate,” Drift wrote in a post on X. “This is not an April Fools joke. Proceed with caution until further notice. We’ll provide additional updates from this account.”
The warning triggered speculation across the crypto community, with some users reporting irregular behavior tied to their positions.
Helius CEO Mert Mumtaz added to the concern in a separate X post, writing, “not 100% fully certain yet, but it seems drift might be getting exploited.” Helius is a key infrastructure provider on Solana, offering APIs and node services that developers and platforms rely on to access blockchain data.
If confirmed, an exploit could affect user funds and add pressure on Solana’s DeFi ecosystem, which has seen renewed growth in recent months.
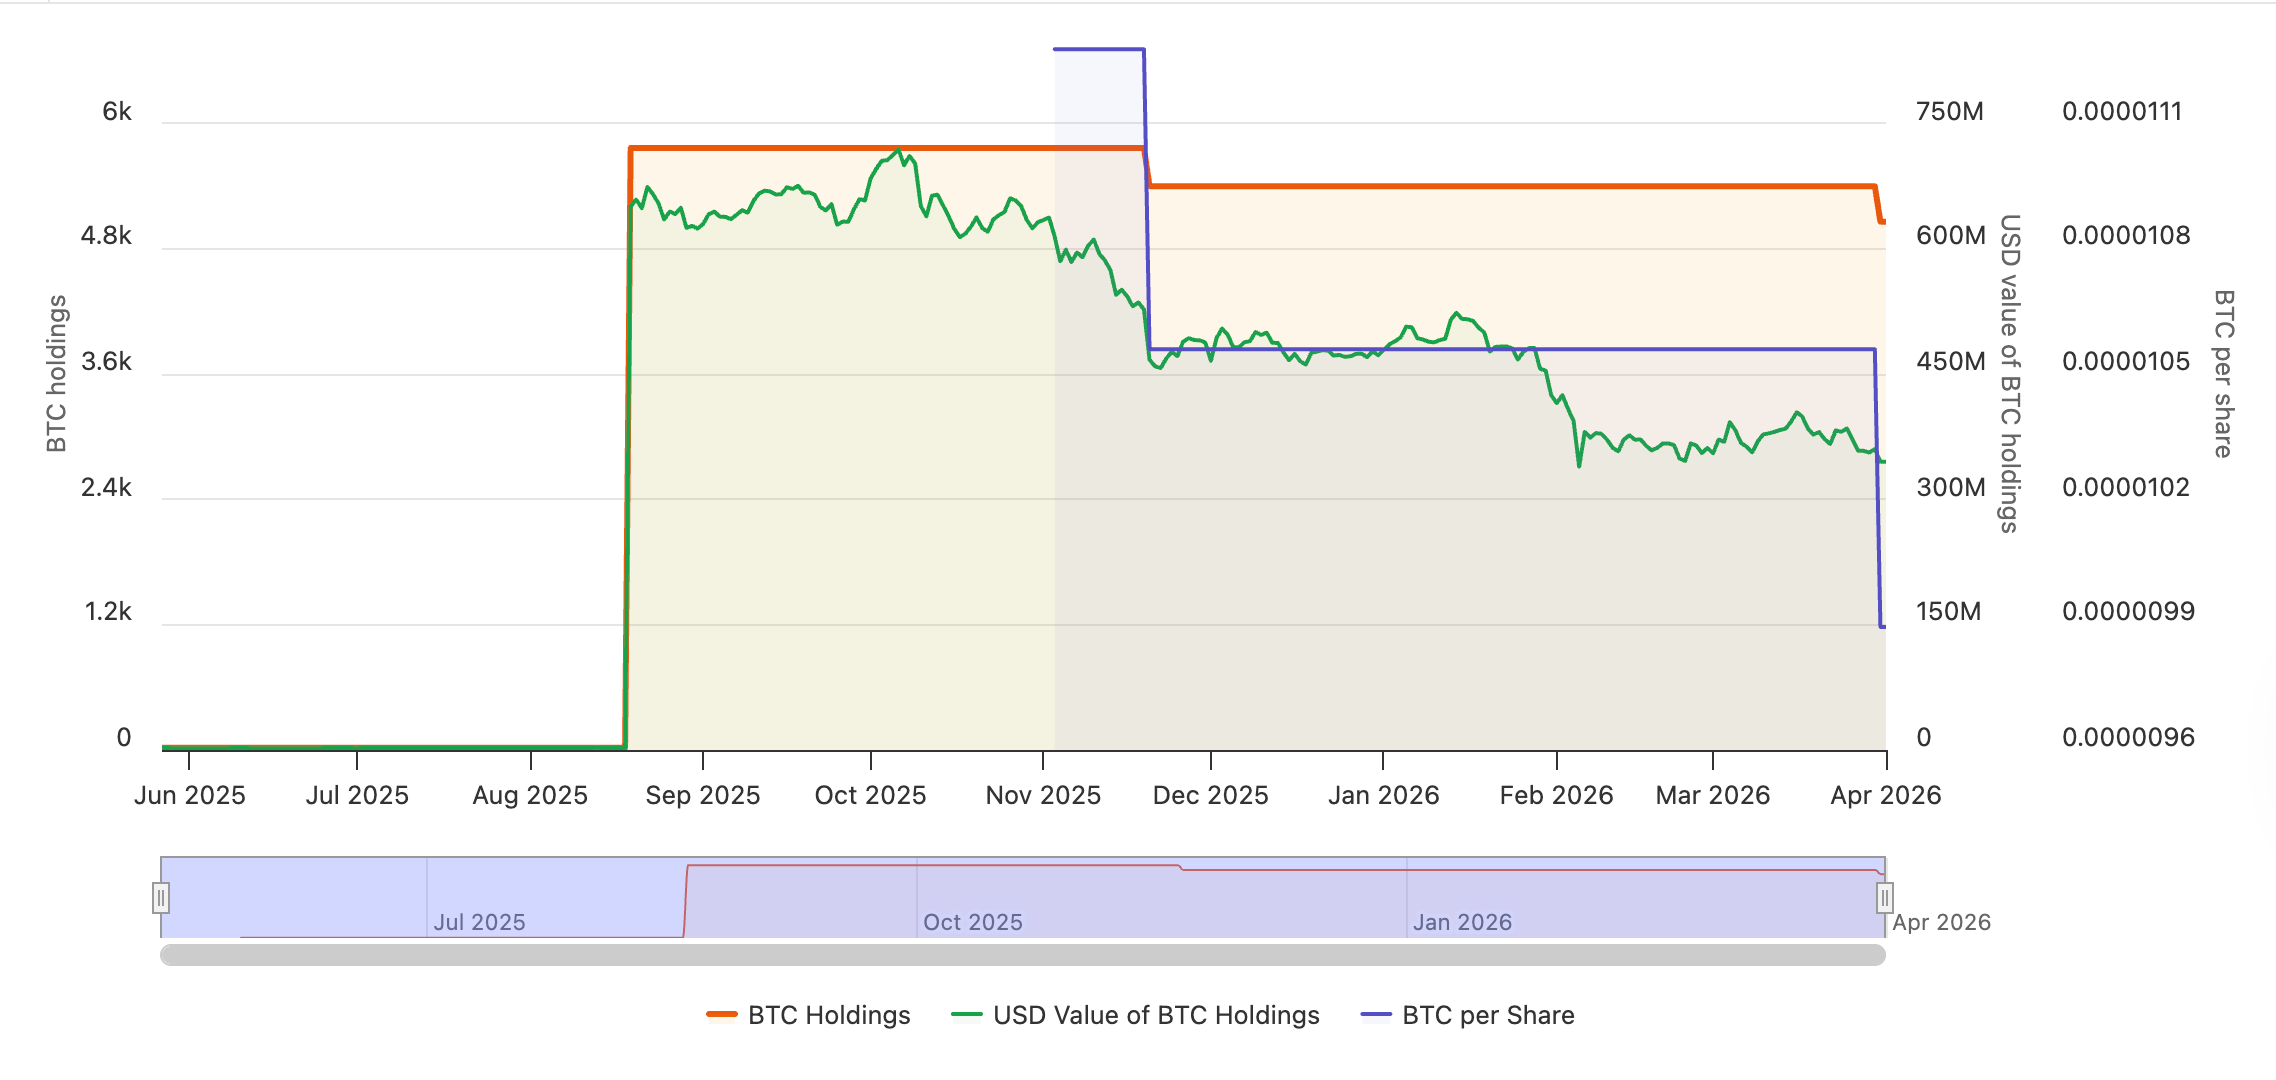
The value of the Bitcoin treasury company’s holdings peaked at over $711 million in October 2025, when BTC hit an all-time high of about $126,000.
Bitcoin (BTC) treasury company Nakamoto (NAKA) selling its BTC at a loss could signal capitulation of more crypto treasury companies and the start of a “contagion” that could spark a wave of forced selling, according to market analyst Nic Puckrin.
“Cracks are beginning to show in the digital asset treasury (DAT) market,” Puckrin said, adding that the war in the Middle East will likely place further pressure on Bitcoin’s price and treasury companies in a reinforcing cycle. He said:
“Price is likely to remain below $70,000 for some time and could fall further to a range around $55,700-$58,200 in the coming weeks. This ongoing weakness would put further pressure on DATs, which could in turn exacerbate the sell-off.”
Nakamoto sold 284 BTC in March for $20 million, implying a price of about $70,000 per coin; the company also reduced its stake in the publicly traded Bitcoin treasury company Metaplanet, selling shares at a loss.

At the end of 2025, the company valued its 5,342 BTC treasury at $467.5 million and recorded a $166.1 million loss on the fair value of its digital asset holdings in the fourth quarter, according to the company’s 10-K filing with the Securities and Exchange Commission (SEC).
The crypto treasury sector saw a collapse in net asset value premiums during Q3 2025, and stock prices declined even before the crypto market crash in October 2025, which sparked a prolonged bear market and a decline in digital asset prices.
Related: Bitcoin miners offload 15K BTC since October, with more sales expected
MARA also sells BTC in March as market rout continues
Bitcoin mining company MARA also sold 15,133 Bitcoin in March, valued at over $1 billion, to repurchase and retire about $1 billion in convertible debt.

MARA’s vice president for investor relations, Robert Samuels, said the sale does not signal a core shift in the company’s BTC treasury strategy, but is a short-term tactical move.
“We may buy or sell from time to time, subject to market conditions and our capital allocation priorities. It does not mean we intend to liquidate the majority of our reserves,” Samuels said.
Magazine: Bitcoin’s ‘biggest bull catalyst’ would be Saylor’s liquidation: Santiment founder

TLDR
- Arizona advanced Senate Bill 1649 to a full House floor vote after clearing the House Rules Committee.
- The bill would allow the state to create a Digital Assets Strategic Reserve Fund.
- The proposal permits Arizona to retain seized cryptocurrencies instead of auctioning them.
- The legislation names XRP, Bitcoin, Monero, NEAR Protocol, and Nano as eligible assets.
- Lawmakers set criteria to assess adoption levels and transaction activity for reserve assets.
Arizona lawmakers advanced Senate Bill 1649 to a full House vote after clearing the House Rules Committee. The proposal would allow Arizona to retain seized digital assets in a state-managed fund. The measure names XRP, Bitcoin, and Monero as eligible assets under defined standards.
Arizona Crypto Reserve Plan Names XRP as Eligible Asset
The House Rules Committee approved SB1649 with eight votes in favor. As a result, the bill now heads to the full House for consideration. Lawmakers introduced the measure to create a Digital Assets Strategic Reserve Fund. The proposal allows the state to keep digital assets obtained through forfeiture or surrender. Currently, agencies auction most seized cryptocurrencies.
State Senator Mark Finchem introduced SB1649 earlier this session. The Senate Finance Committee passed the bill with a 4–2–1 vote. Lawmakers set criteria to determine which assets qualify for the reserve. The criteria review adoption rates, annual transaction volume, and ecosystem development. The bill lists XRP, Bitcoin, Monero, NEAR Protocol, and Nano as eligible assets.
The proposal authorizes the State Treasurer to manage the reserve fund. The Treasurer may invest holdings to generate returns for the state. However, the bill requires that investment actions do not increase financial risk. Lawmakers included this provision to guide fund management practices.
If the House approves SB1649, the bill will move to the governor’s desk. The governor may sign the measure into law or veto it. Lawmakers placed the bill on the House calendar following the committee vote.
Bitcoin and Monero Included in Arizona Reserve Framework
SB1649 identifies Bitcoin as a primary digital asset for the reserve. Lawmakers also included Monero under the eligibility framework. The bill groups these assets with XRP under a defined fair value threshold. This threshold evaluates economic strength and technical performance.
Under the measure, Arizona may retain cryptocurrencies received through legal processes. Agencies would transfer those assets to the reserve fund instead of auctioning them. The Treasurer would then oversee storage and management of the holdings. Lawmakers structured the bill to formalize how the state handles digital assets.
The legislation forms part of broader digital asset discussions in Arizona. Lawmakers are also considering Senate Bill 1042. That proposal would allow the state to invest up to 10% of public funds in cryptocurrencies. SB1042 remains under review in the state legislature.
At the federal level, digital asset reserves have also entered policy debates. President Donald Trump signed an executive order establishing a Strategic Bitcoin Reserve. The order also created a broader digital asset stockpile framework. Lawmakers referenced these developments during state discussions.
The House will now determine the fate of SB1649 in a floor vote. If members approve the measure, it will proceed to final executive consideration. The legislative process continues as scheduled in the current session.

TLDR
- Cango received a notice from the New York Stock Exchange after its shares traded below $1 for 30 consecutive days.
- The company has six months to regain compliance and avoid suspension or delisting proceedings.
- Cango secured a $10 million convertible note agreement with DL Holdings to strengthen its balance sheet.
- The financing includes warrants that allow share purchases at $2.70 per share.
- Cango recently closed a $65 million strategic investment settled in USDT and issued over 49 million Class A shares.
Cango faces a potential New York Stock Exchange (NYSE) delisting after its shares traded below $1 for 30 consecutive days. The exchange issued a compliance notice and granted a six-month cure period. Meanwhile, Cango secured fresh funding to support operations and expansion plans.
Cango Receives NYSE Compliance Notice Over Share Price
The New York Stock Exchange notified Cango on March 10 about non-compliance with its minimum price rule. The exchange requires an average closing price above $1 over 30 trading days. Cango’s shares fell below that threshold and triggered the notice.
The company now has six months to restore compliance and avoid suspension proceedings. Cango stated that it will monitor market conditions and assess available options. It also confirmed that its shares will continue trading during the cure period.
Cango’s stock has declined more than 70% this year. The shares recently traded near $0.39 after starting January above $1.40. Sustained selling pressure pushed the stock under the exchange’s minimum listing standard.
Cango Secures $10 Million Convertible Note to Support Expansion
Cango entered a $10 million convertible note agreement with Hong Kong-listed DL Holdings. The company also issued warrants allowing share purchases at $2.70 per share. Cango paired the financing with a non-binding cooperation framework.
The framework outlines potential joint investments in crypto mining and AI infrastructure. Cango said it will allocate proceeds toward upstream acquisitions and computing infrastructure expansion. The company continues shifting focus beyond bitcoin mining operations.
Management has positioned its global mining footprint as a base for high-performance computing services. The company plans to repurpose or expand power capacity for AI-driven workloads. This strategy supports revenue diversification within computing infrastructure.
Cango recently closed a $65 million strategic investment round. Entities controlled by Chairman Xin Jin and Director Chang-Wei Chiu led the transaction. The deal was settled in USDT and concluded on March 31.
The company issued more than 49 million Class A shares under that agreement. Cango said the capital strengthens its balance sheet. It aims to support operations during ongoing market pressure.
Management stated that it seeks to stabilize finances while executing long-term plans. The company continues evaluating measures to regain compliance with NYSE rules. Cango confirmed that it remains focused on meeting the $1 minimum requirement.
The recent fundraising activity reflects immediate capital needs. Cango continues trading on the NYSE under existing ticker terms. The company has not announced a reverse split or other corporate action.
Cango confirmed that it will provide updates regarding compliance efforts. The company emphasized that the notice does not immediately affect trading. Shares last changed hands near $0.39, reflecting year-to-date losses above 70%.
TLDR
- Genius Group sold its entire Bitcoin holdings to fully repay $8.5 million in debt.
- The company said it plans to rebuild its Bitcoin treasury when market conditions improve.
- Genius Group previously held 440 Bitcoin as part of its Bitcoin-first strategy.
- A US court order restricted the company from raising funds or issuing shares.
- Nakamoto disclosed a $20 million Bitcoin sale earlier this week.
Genius Group has liquidated its remaining Bitcoin holdings to fully repay $8.5 million in debt, the company confirmed today. The NYSE-listed firm said it cleared the balance after selling all digital asset reserves. It also stated that it plans to rebuild its Bitcoin treasury when market conditions improve.
Genius Group and Bitcoin Strategy Shift
Genius Group adopted a Bitcoin-first treasury policy in late 2024 after Donald Trump won the US presidential election. The company committed to allocating at least 90% of its reserves to Bitcoin. By February 2025, it held 440 BTC as part of that strategy.
However, a US court order later blocked the company from raising funds or issuing shares. As a result, Genius Group began selling portions of its Bitcoin holdings. Last month, it sold about 86 BTC and retained around 84 BTC.
The company confirmed that it has now liquidated the remaining coins. It used the proceeds to fully repay its outstanding $8.5 million debt. Genius Group stated that it intends to rebuild its Bitcoin treasury when markets become favorable.
Corporate Bitcoin Sales Expand as Nakamoto and MARA Adjust Holdings
Genius Group was not alone in reducing its Bitcoin exposure. Nakamoto, led by Bitcoin advocate David Bailey, disclosed the sale of $20 million in Bitcoin earlier this week. The company did not provide further details about the transaction.
Meanwhile, MARA Holdings reported the sale of 15,133 Bitcoin valued at roughly $1.1 billion. The company said it used the proceeds to finance the buyback of its 2030 and 2031 convertible notes. These moves followed a broader pullback in corporate digital asset holdings.
Revenue Growth and Gross Profit Drive Operational Turnaround
Genius Group reported Q1 2026 operational revenue of $3.3 million. The figure marked a 171% year-over-year increase. Gross profit rose 228% to $2.0 million during the same period.
Net profit from operations reached $2.7 million, reversing a loss recorded in the prior year. The company attributed the turnaround to higher-margin educational programs and experiential learning initiatives. Adjusted EBITDA improved to $600,000.
The company also highlighted several recent initiatives. It launched Genius School as a model future school and expanded Genius City in Bali. It also introduced AI-powered Space Capsule learning pods and reported continued CEO investment in company shares.

Federal Reserve Governor Michelle Barr said on Tuesday that clearer U.S. stablecoin rules could accelerate the sector’s growth, but she warned that regulators must address money-laundering risks, bank-run concerns and consumer protection as they implement the GENIUS Act.
Speaking at a Federalist Society event on stablecoin regulation, Barr emphasized that the law would provide “needed clarity” for issuers. Yet she stressed that the ultimate impact will hinge on how federal and state agencies translate the statute into concrete rules.
Stablecoins are still primarily used for crypto trading and as a dollar-denominated store of value in certain foreign markets. Barr noted their potential to reduce remittance costs, speed up trade-finance processes and help firms manage treasury operations. She also highlighted risks, including bad actors acquiring stablecoins in secondary markets without identity checks, and the temptation for issuers to pursue yield in reserve assets in ways that could erode confidence during periods of stress.
Her remarks come as U.S. agencies shift from drafting legislation to writing rules. The Treasury Department opened a second round of public comment on implementing the GENIUS Act in September 2025, signaling the administration’s intent to craft a regulatory framework that fosters innovation while addressing illicit finance, consumer protections and financial stability concerns.
Key takeaways
- The GENIUS Act provides a federal framework and clarity for stablecoin issuers, but real impact depends on the specifics of forthcoming rulemaking by federal and state authorities.
- Regulators are prioritizing guardrails around reserve assets, anti-money-laundering checks, consumer protections and capital/liquidity requirements for issuers.
- The Treasury’s ongoing public consultation underscores a balance-driven approach: enabling innovation while mitigating systemic and illicit-finance risks.
- Past discussions of stability and trust in privately issued digital money inform the current stance, as officials warn against overreach that could undermine confidence in redemption at par during stress.
GENIUS Act’s framework under scrutiny
The GENIUS Act, signed into law on July 18, 2025, established a federal pathway for U.S. payment stablecoins, mandating one-to-one backing with reserve assets such as U.S. dollars and Treasury securities. The statute anticipated a phased rollout, taking effect 18 months after signing or 120 days after final agency rules are published, whichever comes later. The rulemaking process now centers on translating that framework into practical requirements for issuers, custodians, and the networks that support on-chain dollars.
Barr’s remarks reflect a broader tension in the policy agenda: while the law aims to reduce regulatory uncertainty and spur legitimate adoption, it also raises questions about how to supervise reserve management, ensure robust AML controls and prevent consumer harm if redemption experiences stress. In her view, clear guardrails are essential to prevent a repeat of past fragilities seen during financial upheavals when private money markets faced losses or liquidity strains.
The governance question is not purely theoretical. The act explicitly contemplates reserve-asset backing and the prudential requirements that might accompany it, including capital and liquidity standards. Barr cited the potential for regulatory arbitrage between federal and state authorities as a practical risk if rules are unevenly applied across jurisdictions, potentially fragmenting the market and complicating compliance for issuers operating nationwide.
Beyond issuance, the scope of control – such as whether regulators oversight beyond the mere act of minting stablecoins to include the management of reserves, settlement rails and treasury operations – remains a focal point for policy negotiators. Barr’s framing suggests that a comprehensive approach will be essential to maintain market integrity and reassure users that stablecoins remain a reliable, on-demand dollar proxy even under stress.
Safeguards, compliance frictions and market dynamics
One recurring theme in Barr’s remarks is the risk of illicit finance and the need for rigorous identity checks in secondary markets. The possibility that bad actors could circumvent oversight by acquiring stablecoins off-exchange underscores the demand for robust Know Your Customer and AML controls throughout the ecosystem. Regulators are weighing how to enforce identity verification without stifling legitimate financial activity or driving participants to opaque, cross-border channels.
Another area of focus is the management of reserve assets. The GENIUS Act envisions reserves that can include U.S. dollars and U.S. Treasuries, but the regulatory calculus around what constitutes acceptable collateral, how reserve liquidity is maintained and how stress scenarios are modeled remains unsettled. Barr pointed to the risk that issuers might pursue yields that look attractive in normal times but prove destabilizing when conditions tighten. These considerations are central to preserving confidence that stablecoins can be redeemed on demand at stable value.
The policy conversation is also being shaped by concurrent statements from other U.S. regulators. Fed Vice Chair for Supervision Michelle Bowman has indicated that capital and liquidity rules for stablecoin issuers are already in development, while the Federal Deposit Insurance Corporation chair has said the agency does not expect deposit insurance for stablecoins under the GENIUS framework. Taken together, the signals suggest a cautious but forward-moving rulemaking process designed to keep stablecoins within a managed risk envelope while supporting legitimate innovation.
From an investors’ perspective, the rulemaking trajectory matters for how quickly stablecoins can scale as a trusted payment instrument, and how exposure to reserve risk or issuer missteps is priced into the market. For users and builders—wallet providers, exchanges and on-chain infrastructure—the clarity around compliance expectations and reserve governance will influence product design, KYC workflows and treasury-management features. The line between activity that is permissible under the law and what would trigger supervisory action remains a critical area to watch as agencies publish draft rules and conduct public consultations.
What to watch next for the stablecoin voyage
With the GENIUS Act as the anchor, the regulatory timetable is shifting toward concrete rules that will define how stablecoins operate in the United States. The ongoing public-comment process signals a willingness to refine the framework to accommodate financial innovation while strengthening protections against financial crime and systemic risk. Key milestones to monitor include the issuance of final agency rules, the precise calibration of reserve-asset standards, and the delineation of permissible activities beyond straightforward issuance—such as on-chain settlement mechanics and intermediation functions by custodians.
Market participants should also gauge how other major economies approach stablecoins, as global operators weigh whether U.S. rules will remain the gold standard or push activity toward more permissive or restrictive jurisdictions. In the near term, investors may see a bifurcation: issuers that align quickly with evolving standards could gain faster access to U.S. markets, while those that lag might encounter higher compliance costs or restricted access to U.S. rails. For users, the prospect of stronger consumer protections and clearer redemption guarantees offers a more predictable environment, though it could come with increased onboarding checks and slower transactions in some cases.
Ultimately, Barr’s speech reinforces a central fact: the GENIUS Act is a landmark attempt to reconcile private, on-chain money with public safeguards. The outcome will hinge on the rigor of rulemaking and the resilience of the safeguards regulators implement. As the process unfolds, the industry will be watching not only how reserve assets are treated, but how the rules address specialized risks such as cross-border use, illicit financing channels and the potential for runs during shocks.
Readers should stay attentive to the pace of rule publication and the specifics agencies publish about capital, liquidity and AML standards, as those details will shape the feasibility and cost of compliant stablecoin programs in the United States.
The evolving regulatory backdrop underscores a broader theme for the crypto space: legitimate-scale adoption depends on credible assurances that stablecoins can deliver on the promise of speed, reliability and safety, without compromising financial stability or enabling misuse.
As policymakers refine the balance between innovation and protection, the market will likely respond with a mix of pragmatic partnerships, new compliance tooling and product innovations designed to navigate a tighter but clearer regulatory horizon.
What remains uncertain is how quickly final rules will land and how issuers, custody providers and exchanges will adapt to a potentially stricter regime. Still, Barr’s remarks emphasize a deliberate, risk-conscious path forward—one that could ultimately help stablecoins mature from niche tools into mainstream financial rails.


The $1.7 trillion asset manager will absorb the 250 Digital team and all liquid crypto strategies previously managed by CoinFund, targeting pensions and sovereign wealth funds.
TLDR
- Jamie Dimon said JPMorgan may enter the prediction markets sector in the future.
- He ruled out offering contracts tied to sports or political events.
- Goldman Sachs confirmed it is actively reviewing prediction market opportunities.
- Polymarket and Kalshi remain leading platforms as competition expands.
- Coinbase and Robinhood have added prediction trading to their services.
JPMorgan CEO Jamie Dimon said the bank may enter prediction markets as large institutions assess the fast-growing sector. He shared the update during a CBS interview on Tuesday. His remarks place JPMorgan alongside Goldman Sachs in reviewing potential offerings.
JPMorgan Reviews Prediction Markets Strategy
Dimon confirmed JPMorgan is studying the space but set clear limits. “It’s possible one day we’ll do something like that,” Dimon said. However, he ruled out markets tied to sports or politics.
He stressed that the bank would follow strict internal standards. “There’s a bunch of stuff we won’t do,” Dimon said. He added, “We have strict rules around insider information.”
Goldman Sachs has also advanced its review of prediction markets. CEO David Solomon addressed the topic during the bank’s January earnings call. He said the firm has engaged directly with industry leaders.
“I personally met with the two big prediction companies,” Solomon said. He said he spent hours learning about their models and leadership. He added that a team continues to evaluate the sector.
Neither bank has disclosed launch timelines. They have also not detailed technology choices or regulatory structures. However, their statements confirm active internal discussions.
Polymarket, Kalshi, and Rising Crypto Platforms
Prediction markets were once centered on two main platforms. Polymarket and Kalshi dominated the sector for years. Now, competition has expanded quickly across crypto and traditional firms.
Coinbase and Robinhood have integrated prediction market trading. These companies offer retail access through existing platforms. Their entry has increased user participation and market volume.
Polymarket operates on blockchain infrastructure using Polygon. Users deposit stablecoins and place outcome-based trades. Smart contracts record transactions and settle payouts automatically.
Kalshi uses a regulated exchange model without blockchain systems. It offers event contracts under centralized order matching. The platform handles settlement through traditional mechanisms.
Polymarket has secured partnerships and investment backing. It maintains ties with Intercontinental Exchange, which owns the New York Stock Exchange. The company holds an estimated $20 billion valuation.
Kalshi recently closed a funding round led by Coatue Management. The round valued the platform at about $22 billion. These figures reflect growing capital flows into prediction markets.
Regulation in the United States continues to evolve. Authorities assess how event contracts should be classified. Banks have indicated they will monitor policy developments closely.
Earlier this month, the Commodity Futures Trading Commission advanced oversight efforts. The agency outlined steps to build a regulatory framework. These actions mark the latest formal move shaping prediction markets in the U.S.

Dorsey unveils AI-driven workplace strategy after Block’s 40% cuts

Iraq journalist kidnapping shows double standards of US

Man City and Man United agent fees paid compared to Arsenal, Liverpool and Premier League rivals


-

 News Videos7 days ago
Parliament publishes latest register of MPs’ financial interests
-

 Business6 days ago
Instagram, YouTube Found Responsible for Teen’s Mental Health Struggle in Historic Ruling
-
 Tech6 days ago
Intercom’s new post-trained Fin Apex 1.0 beats GPT-5.4 and Claude Sonnet 4.6 at customer service resolutions
-

 NewsBeat5 days ago
The Story hosts event on Durham’s historic registers
-

 Sports5 days ago
Sweet Sixteen Game Thread: Tide vs Michigan
-
Entertainment2 days ago
Fans slam 'heartbreaking' Barbie Dream Fest convention debacle with 'cardboard cutout' experience
-
 Entertainment4 days ago
Lana Del Rey Celebrates Her Husband’s 51st Birthday In New Post
-
Crypto World1 day ago
Dems press CFTC, ethics board on prediction-market insider trades
-

 Sports1 day ago
Tallest college basketball player ever, standing at 7-foot-9, entering transfer portal
-

 Tech3 days ago
The Pixel 10a doesn’t have a camera bump, and it’s great
-

 Entertainment7 days ago
HBO’s Harry Potter Series Will Definitely Fail For One Big Reason, And It’s Not J.K. Rowling Or Snape
-

 Crypto World2 days ago
U.S. rule change may open trillions in 401(k) funds to crypto
-

 Tech1 day ago
EE TV is using AI to help you find something to watch
-

 Tech1 day ago
How to back up your iPhone & iPad to your Mac before something goes wrong
-

 Fashion6 days ago
En Vogue in Brown Leather and Tailored Neutrals by Atelier Savoir, Styled by J Bolin
-

 Politics2 days ago
Should Trump Be Scared Strait?
-

 Fashion6 days ago
What Are Your Favorite T-Shirts for the Weekend?
-

 Fashion5 days ago
Weekly News Update, 3.27.26 – Corporette.com
-

 Tech2 days ago
Apple will hide your email address from apps and websites, but not cops
-

 Tech2 days ago
Flipsnack and the shift toward motion-first business content with living visuals
You must be logged in to post a comment Login