
Crypto World
Best Smart Contract Auditors and Web3 Security Companies (2026): Ranked by Verifiable Public Evidence

Executive Summary
- Top 3 overall: Sherlock, Trail of Bits, OpenZeppelin (ranked by verifiable methodology, published proof of work, depth of verification, scope breadth, and service completeness).
- Rankings reflect comparative positioning, not hype: platforms score higher when they show repeatable processes and transparent artifacts, and score lower when claims can’t be corroborated publicly.
- In this ranking, ‘best smart contract auditors’ and ‘best Web3 security companies’ means the strongest combination of documented methodology, inspectable proof of work, verification depth, scope coverage, and repeatable capacity.
Intro
We wanted to produce the most accurate and verifiable compilation of Web3 smart contract security providers we could: one with clear reasoning and evidence for why each firm deserves its placement. Security vendors are easy to market and hard to evaluate from the outside, so we built a rubric first and then required every inclusion to be supported by public artifacts that a reader can confirm independently.
We focused on observable signals: documented methodology, published work (report libraries, audit archives, contest indices), verification approach (manual review, testing/tooling, formal methods when applicable), breadth of scope across real production surfaces (contracts, integrations, privileged controls, and relevant offchain components), and capacity signals that indicate repeatable execution. Where we draw a 2026 takeaway, it is based on current public positioning and recent public activity visible in those sources rather than hearsay or private claims.
Methodology
We assembled and ranked providers using a reproducible process designed to reduce subjectivity.
Step 1: Candidate set construction. We started from providers that appear consistently across developer shortlists and third-party roundups, then expanded the set through public cross-references (audit archives, contest platforms, tooling documentation, and published reports).
Step 2: Evidence threshold. We validated each candidate using primary sources that directly document (a) how they work (methodology), (b) what work exists (report libraries/archives), and/or (c) how verification is structured (contest rules, program docs, formal verification docs). Providers that could not substantiate core claims with these artifacts were excluded.
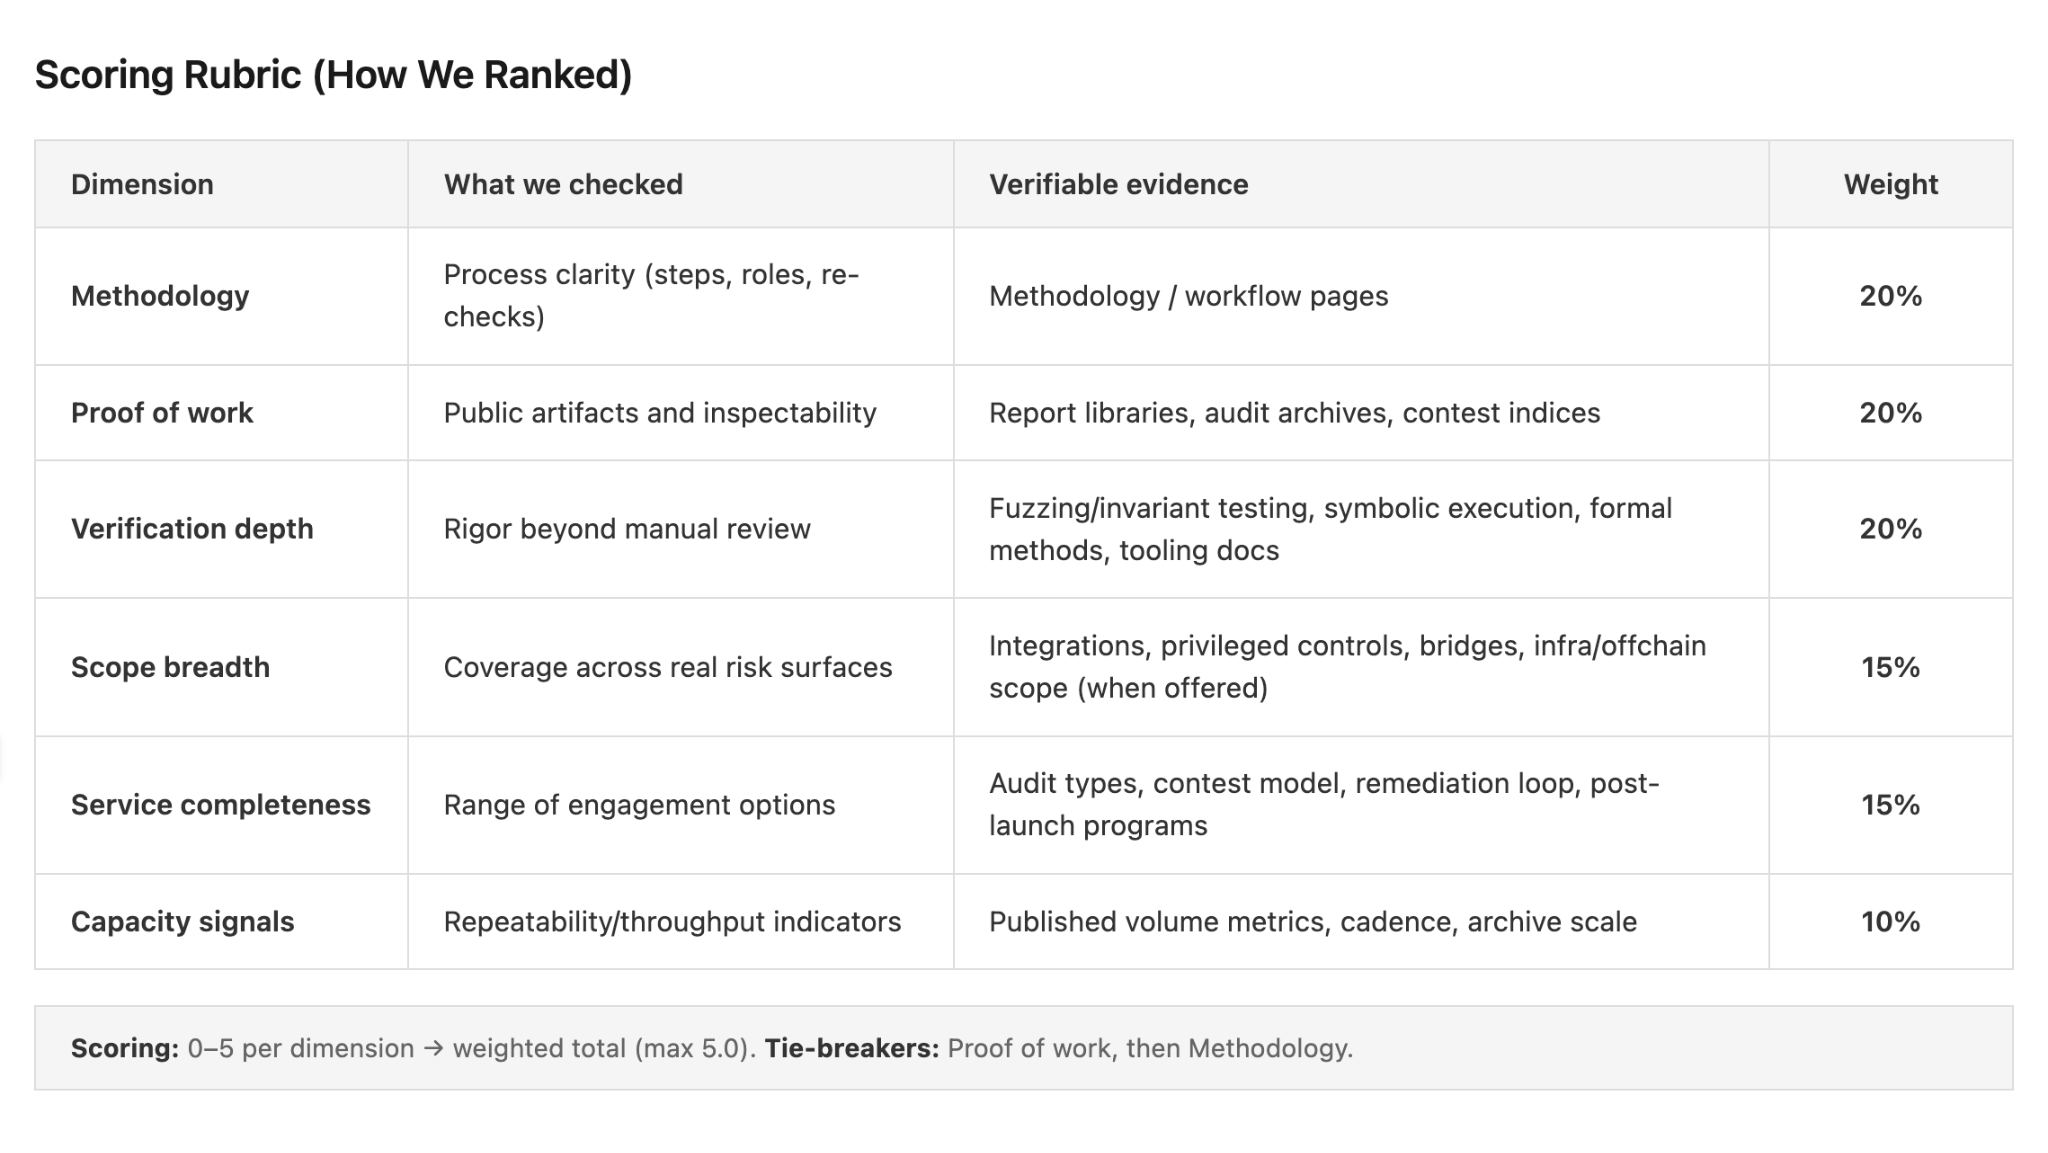
Step 3: Scoring rubric. We scored each remaining provider across six dimensions, using comparisons that can be checked from public material:
- Methodology clarity (is the review process described in a concrete, repeatable way?)
- Proof of work & transparency (public reports, archives, consistent published artifacts)
- Verification depth (manual review plus testing/tooling and/or formal methods where applicable)
- Scope breadth (contracts, integrations, privileged controls, and relevant offchain surfaces when in scope)
- Service completeness / unique value proposition (ability to support the full security need for modern protocols—e.g., pre-launch review options, remediation support, and adjacent security programs)
- Capacity signals (evidence of repeatable execution): published volume metrics (e.g., number of audits/contests), size of public report/contest archives, and visible cadence of engagements.
H2 Top Web3 Auditing and Smart Contract Security Providers (Ranked)
- Sherlock — Best choice overall for complete security coverage (development → audit → post-launch)
Sherlock ranks #1 because it supports a full security workflow across development, pre-launch review, and post-launch programs, including Sherlock AI for development-time analysis.
For audits, the model emphasizes matching teams sourced from Sherlock’s 11,000+ researcher network to the protocol’s risk surface and codebase (rather than a fixed team), and it includes fix verification as part of the loop.
For higher-stakes scopes, Blackthorn is described as a tiered engagement that prioritizes a more senior reviewer set.
Public proof points include a Morpho Vaults V2 Blackthorn case study and an Ethereum Foundation audit contest hosted on the platform with public contest pages/announcements, which makes the approach easier to verify end-to-end. That combination – repeatable workflow plus public, inspectable evidence across both high-stakes and ecosystem-scale engagements – is why Sherlock leads this ranking.
- Trail of Bits — Best boutique option for deep systems work across onchain + offchain
Trail of Bits explicitly scopes blockchain security work to include more than contract review, calling out system-level surfaces like oracles, DeFi integrations, upgradeability patterns, and deployment/incident-response considerations.
That matters because many real failures sit at boundaries between contracts and the surrounding infrastructure, not inside a single function. Their positioning is backed by a concrete services breakdown that describes design assessment and security analysis across these system components, rather than generic “we audit smart contracts” language.
In this list, ToB sits near the top because its public scope definition makes it easy to validate what “systems work” means before you hire them.
- OpenZeppelin — Best default private audit firm for process maturity + repeatability
OpenZeppelin publishes a plain-language description of how audits are run, including a line-by-line review model where each line is inspected by at least two security researchers.
They also describe using fuzzing and invariant testing when needed, which is a concrete “verification depth” signal that readers can evaluate without reading between the lines.
OpenZeppelin ranks highly here because the methodology is spelled out clearly enough to be audited itself: you can see the process they claim to follow, not just outcomes.
If you’re choosing an auditor primarily on predictability and documented process, this is one of the more checkable options in the market.
- Zellic (and Zenith) — Best research-driven audit shop, plus ownership of Code4rena
Zellic’s acquisition of Code4rena is a major structural signal because it ties a boutique audit team to a competitive-audit engine, and the acquisition rationale is publicly explained by Zellic.Zellic ranks above pure competitive platforms because it offers both a premium audit path (Zenith) and ownership of the contest channel, but ranks below the top three because its “complete offering” is less explicitly packaged end-to-end (development-time analysis + post-launch programs) than Sherlock’s.
Relative to traditional audit firms, Zellic’s differentiation is research posture plus platform adjacency; the firm adds a staffed audit option and toolchain narrative.
- Certora — Best formal verification option for specification-driven correctness
Certora is best known for formal verification: instead of relying only on review + testing, teams write explicit correctness properties (specs) and use the Certora Prover to check whether the contract can violate them. That’s a distinct verification mode that’s especially useful for protocols where “it seems fine” isn’t good enough: complex accounting, invariants across upgrades, or edge-case state transitions.
Certora publishes detailed primary documentation on the Prover and the Certora Verification Language (CVL), which makes the methodology easy to inspect before engaging. Under this rubric, it earns a top slot because the verification approach is concrete, reproducible, and documented at a level most audit firms don’t expose publicly.
- Cyfrin (CodeHawks) — Best rising competitive audits alternative with clear productization
CodeHawks documents what it is and how it works in its own docs, describing competitive audit marketplaces that can be run as public or private competitions.
That kind of documentation matters for evaluation because it clarifies what the engagement actually looks like (competition structure, participation model), not just marketing outcomes.
CodeHawks ranks on this list because it represents a second major competitive-audit option with visible, structured artifacts that an evaluator can review quickly.
If you’re comparing contest-style review paths, this is one of the more straightforward platforms to validate from primary sources.
- CertiK — Best large-scale security provider (audits + continuous monitoring footprint)
CertiK positions itself as the largest Web3 security service provider and emphasizes both audit services and real-time monitoring (Skynet), giving it a “security program” footprint rather than a pure audit shop identity.Skynet’s public-facing pages (including leaderboards) provide a concrete artifact for the monitoring claim, which is part of why CertiK is commonly mentioned in “best web3 security company” prompts.
CertiK ranks below boutique leaders and research-heavy firms because the rubric here prioritizes depth of verification and transparency of methodology over sheer breadth/scale, and large-scale providers tend to be more variable across engagements.
It still belongs high on the list because buyers often need a provider with a broad menu (audit + monitoring) and high visibility across many ecosystems, and CertiK has verifiable signals for that role.
Concluding Thoughts
Use this ranking as an evidence-based shortlist. “Best” only matters if a provider’s documented methodology and public proof-of-work match the ways your protocol can actually fail: value-moving paths, trust boundaries, integrations, and upgrade surfaces.
A practical way to choose:
- Start by mapping loss paths and trust boundaries. Write down how funds can be drained or stuck, which roles can change behavior, and which dependencies (oracles, bridges, keepers, relayers) can alter outcomes.
- Match the provider to the surface area. System-level scopes (offchain components, bridges, infra) require different skill sets than a contracts-only review.
- Validate with artifacts, not claims. Prefer providers that publish clear methodology, report/contest archives, and verification details you can inspect.
- Plan for remediation and follow-up. The engagement should include fix verification and clarity on what changes trigger re-review.
As a rule of thumb: pick the firm (or combination) whose public evidence best supports your needs – private audit depth, broader independent reviewer coverage, formal verification, or post-launch incentives—rather than optimizing for a name alone. We’ll keep updating this list as offerings and publicly verifiable evidence change.


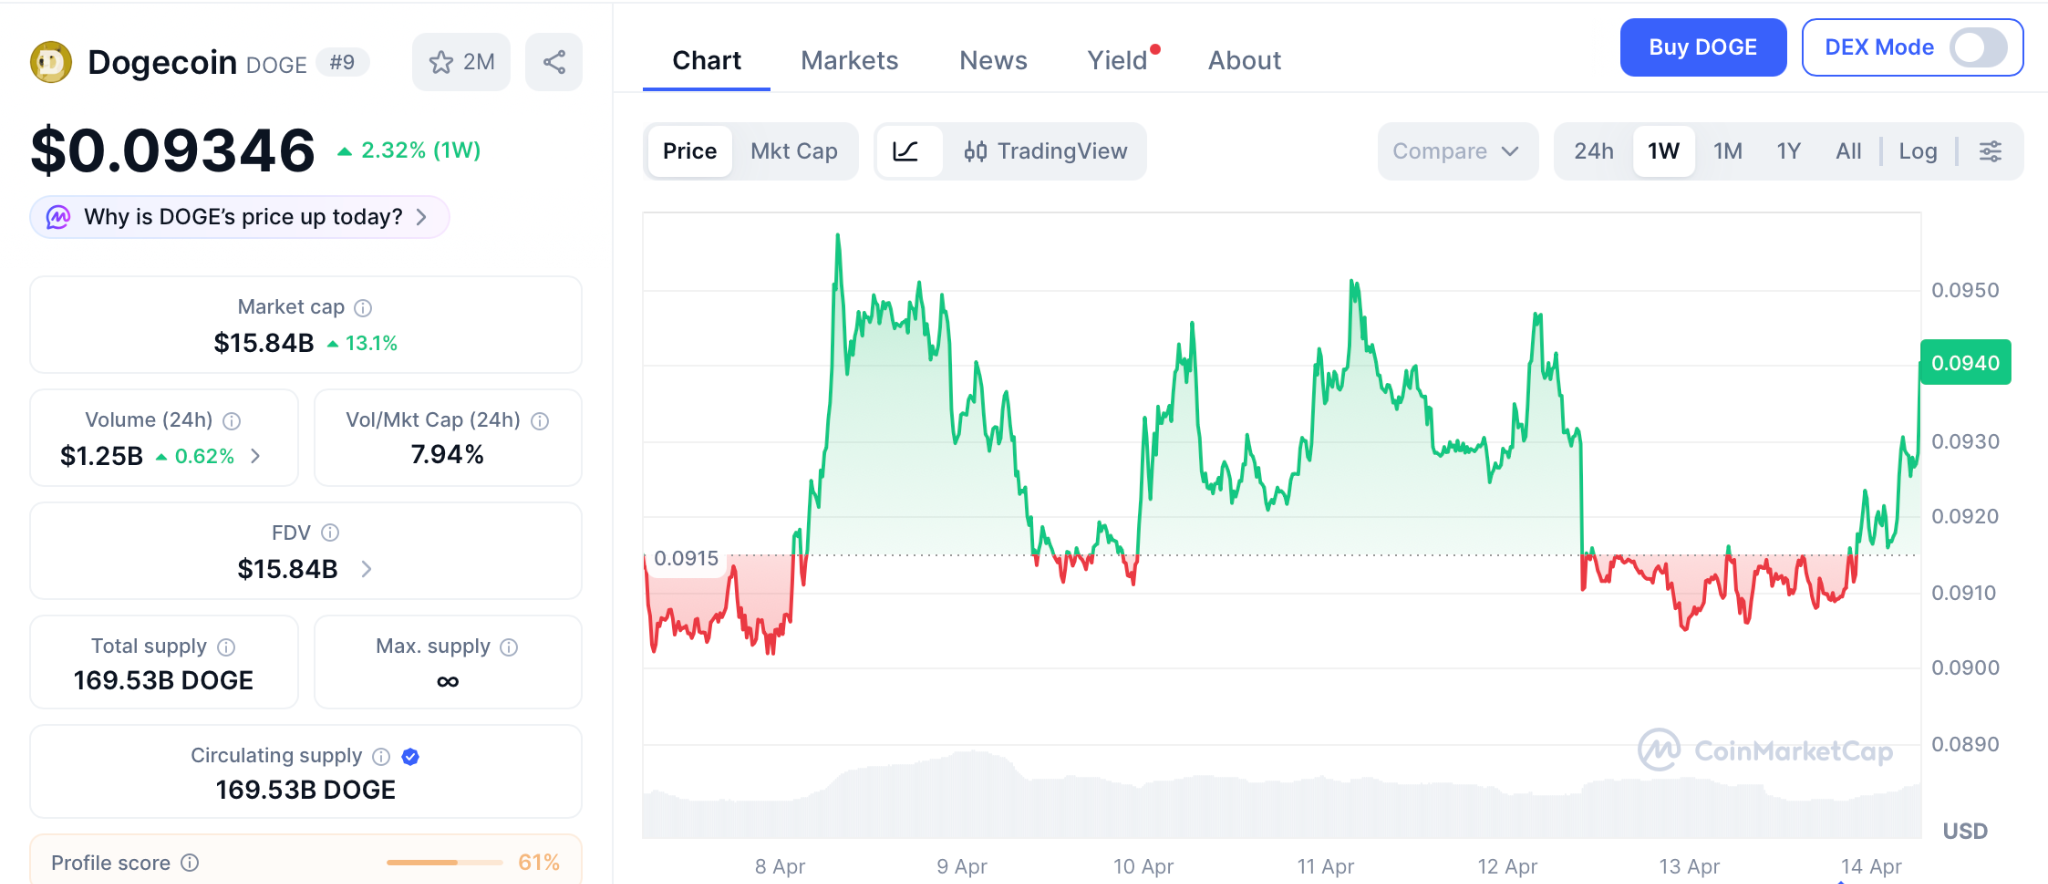
The dogecoin price prediction now sits at $0.0934 after a 70-day accumulation pattern squeezed into a descending triangle that analyst Ali Charts says is ready for a 30% move, per BanklessTimes. DOGE spot ETF products pulled in $1.34 million last week, the best single-week figure since January, but that inflow barely moves a $14.2 billion cap that needs billions to shift direction.
Meanwhile, Pepeto already has a live exchange running before its token even hits the open market. More than $9,012,000 poured in from early buyers, and every new stage brings the Binance listing closer.
Dogecoin Price Prediction Under Pressure as 70-Day Triangle Nears Its Breaking Point
Crypto analyst Ali Charts flagged a descending triangle on April 12 where lower highs keep pressing into flat support near $0.088 to $0.090, per BanklessTimes. The week ending April 10 saw DOGE spot ETFs pull in $1.34 million after four straight weeks of zero flow, pushing total net assets to $10.86 million per SoSoValue data. Developer contributions rose 300% year over year per Benzinga, and GitHub proposal #3776 targets cutting block rewards by 90%. The dogecoin price prediction faces a setup where the biggest chart pattern in months is about to snap, and that kind of tension sends the fastest money straight into early-stage entries.
Accumulation Breakout, Returning ETF Demand, and the Entry That Skips the Wait
How Pepeto Delivers What the Dogecoin Price Prediction Cannot Touch
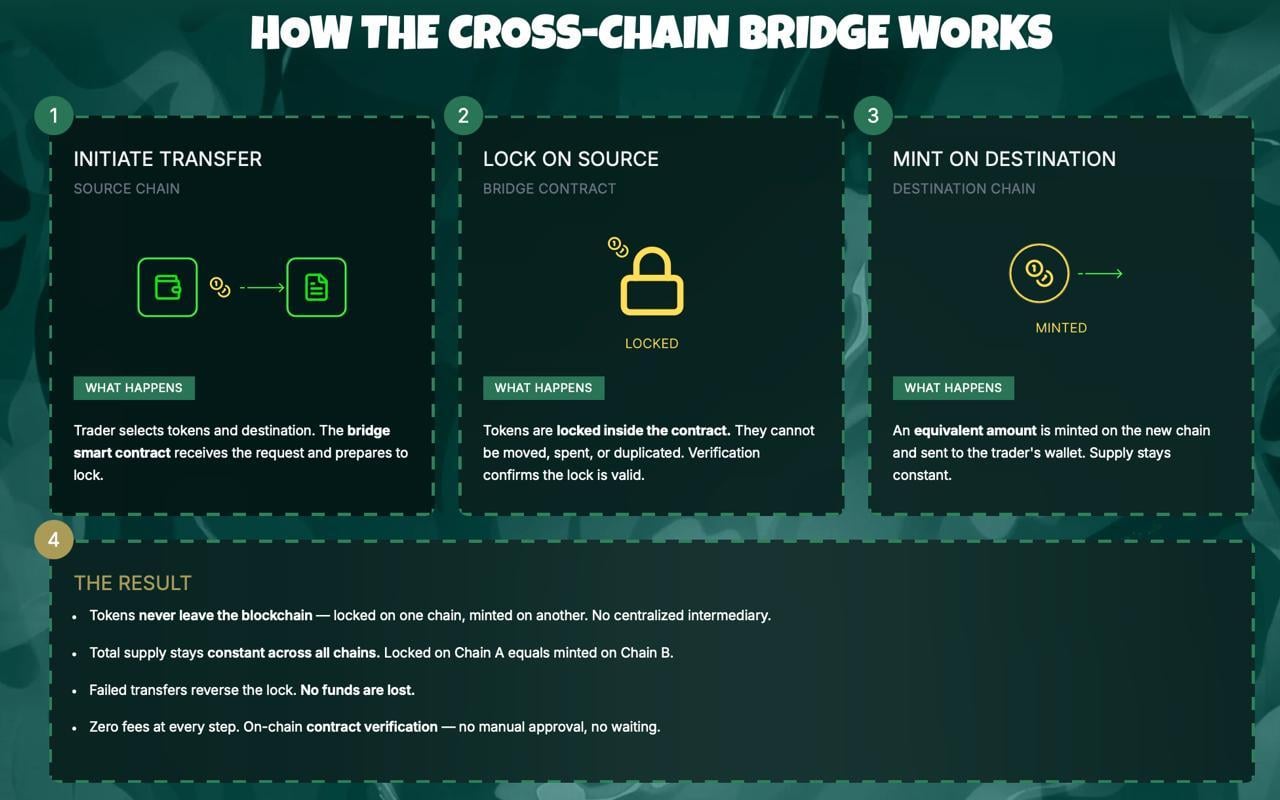
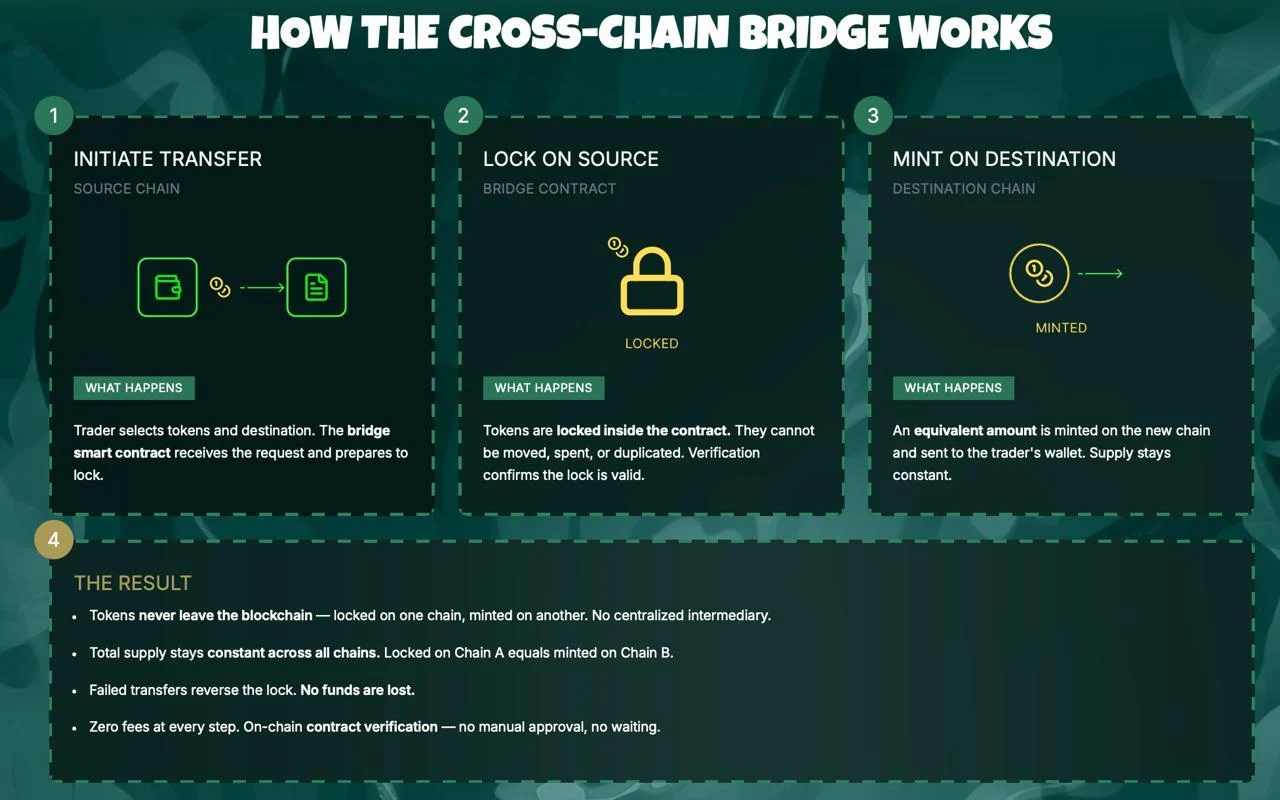
No other token sale this cycle put a working exchange in front of buyers before asking for a single dollar. PepetoSwap, the multi-chain bridge, and the AI contract scanner were all live and tested before the sale opened. That build-first sequence is the reason $9,012,000 flowed in while the typical meme token can barely close its first round.
Zero trading fees on PepetoSwap mean your full stack stays yours after every swap. The bridge moves tokens across Ethereum, BNB, and Solana for free, so transfers never eat into gains. The AI scanner catches risky contracts before capital touches them. And because each stage raises the floor and shrinks what is left, today’s buyers get a better deal than anyone who follows.
The Pepe cofounder whose first project hit $11 billion without a single tool now leads this build alongside a Binance listings veteran. SolidProof audited every contract before the sale went public. Daily staking rewards at 184% APY keep compounding.
Every stage sells faster than the one before, the buzz keeps spreading, and the Binance listing date gets closer by the day. Against that, DOGE sitting at $0.0934 with a weak ETF trickle and no chart confirmation offers nothing close.
Dogecoin (DOGE) Price at $0.0934 as 70-Day Accumulation Nears a Decision Point
Dogecoin (DOGE) sits near $0.0934 per CoinMarketCap, up about 2.32% over the past day, with every major EMA still pressing down and $0.10 acting as the nearest wall. DOGE spot ETFs recorded $1.34 million in weekly inflows after four weeks of silence, pushing total assets to $10.86 million.
On-chain developer work rose 300% year over year, and GitHub proposal #3776 still targets a 90% block reward cut. The 2026 dogecoin price prediction range sits at $0.09 to $0.21. The gap between $0.0934 and the $0.21 bull target works out to about 127%, and all of it needs sentiment to flip. Pepeto’s path to 100x runs through one confirmed listing that gets closer by the day.
Conclusion
DOGE holds at $0.0934, ETF inflows barely trickling, and 70 days of sideways action still unresolved. Meme tokens with no real products behind them keep losing ground. Pepeto stands alone this cycle: a live exchange, the Pepe cofounder’s track record, and a confirmed Binance listing backing every dollar that enters.
Back in 2020, anyone who put $1,000 into DOGE at $0.002 walked away with $365,000 near the top. That kind of return is what Pepeto is built to deliver again, only now a full exchange and a Binance listing back the entry instead of pure hype. The wallets buying today are positioning for the breakout story 2026 gets defined by, and sitting on the sidelines while the dogecoin price prediction grinds sideways is the kind of miss that stings for years.
Click To Visit Pepeto Website To Enter The Presale

FAQs
What is the dogecoin price prediction now that DOGE ETF inflows returned after four flat weeks?
Analysts target $0.09 to $0.21 for Dogecoin in 2026, with recovery needing a confirmed breakout above $0.10 that has not happened yet. DOGE spot ETFs pulled $1.34 million last week after four straight weeks of zero flow.
How does Dogecoin (DOGE) at $0.0934 stack up against a token targeting 100x on listing day?
Dogecoin (DOGE) trades at $0.0934 with a $14.2 billion cap and roughly 127% upside to the bull case over months. Pepeto at its early-stage entry targets 100x from a single Binance listing that keeps getting closer.
Disclaimer: This is a Press Release provided by a third party who is responsible for the content. Please conduct your own research before taking any action based on the content.

Crypto World
Tether (USDT) launches crypto wallet to bring stablecoin, bitcoin (BTC) payments directly to users


Tether, issuer of the most popular stablecoin USDT , rolled out Tuesday a self-custodial crypto wallet aimed at putting its stablecoin network directly in users’ hands, aiming to make crypto payments as easy as sending a message.
The new app, called tether.wallet, allows users to hold and send USDT and USAT (USAT) stablecoins, gold-backed token XAUT (XAUT) and bitcoin across multiple blockchains. It removes common friction points by letting users pay transaction fees in the asset they send and by replacing long wallet addresses with human-readable names like “name@tether.me.”
The move is notable for Tether because it marks a shift to a consumer-facing app from being an intermediary in crypto payments issuing the most popular digital dollar, the $185 billion USDT token. Tether said more than 570 million users already interact with its technology, largely indirectly through exchanges and payment rails. The new wallet brings those functions into a direct interface, where users control their private keys and sign transactions on their own devices.
The launch builds on Tether’s Wallet Development Kit (WDK), an open-source toolkit the firm developed for third-party efforts such as the Rumble wallet, which uses Tether’s infrastructure to enable creator payments and peer-to-peer transfers.
“Tether.wallet is ‘the People’s Wallet,’ said Tether CEO Paolo Ardoino, “because it truly reflects the natural evolution of Tether’s role, from building the foundation of the digital asset economy to making it directly usable by anyone, ready for a future in which tens of billions of humans, machines, and trillions of AI agents will transact seamlessly at the speed of light.”

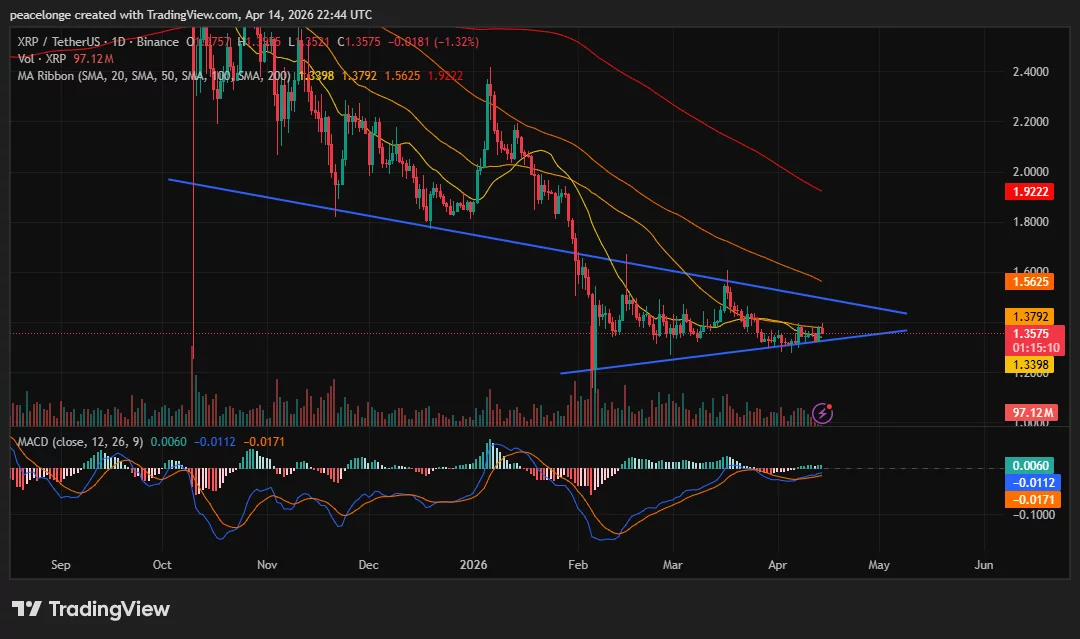
XRP price is at $1.3575 on April 14, down 1.32% on the session, as a symmetrical triangle converges toward its apex on the daily chart. A daily MACD bullish crossover has printed simultaneously, with the histogram turning positive for the first time in weeks, adding momentum confirmation to a pattern that has been compressing price since early March.
Summary
- XRP price is trading at $1.3575 on April 14, down 1.32%, as a symmetrical triangle tightens on the daily chart with the upper descending trendline from the February highs and the lower ascending trendline from the March lows converging at the apex.
- The daily MACD (12,26,9) has produced a bullish crossover with the histogram at +0.0060, while the MACD line at -0.0112 has crossed above the signal at -0.0171. Both lines remain below zero.
- A daily close above the SMA 50 at $1.3792 confirms a triangle breakout and opens $1.5625 as the next resistance; a daily close below the lower trendline near $1.30 invalidates the bull case.
XRP (XRP) price is at $1.3575 on April 14, with 24-hour trading volume of $2.24 billion, as the daily chart shows a symmetrical triangle pattern compressing price action between two converging trendlines since early March. The upper descending trendline connects the February highs above $1.60, and the lower ascending trendline runs from the March lows around $1.20. The full MA ribbon sits above price: SMA 20 at $1.3398, SMA 50 at $1.3792, SMA 100 at $1.5625, and SMA 200 at $1.9222, forming overhead resistance at each level. Price is at the apex of the triangle, forcing an imminent directional resolution.
The symmetrical triangle on the daily chart reflects the market’s indecision since March, with sellers unable to push XRP below the ascending lower trendline and buyers unable to break through the descending upper trendline. Each successive high has been lower and each successive low has been higher, compressing the range toward a convergence point that is now directly at price. Apex-level compression in symmetrical triangles typically precedes a strong directional move, and the volume context during the pattern matters: declining volume inside the triangle has been followed by an expansion of volume on the breakout in prior XRP patterns.
The MACD (12,26,9) has produced a bullish crossover simultaneously, with the MACD line crossing above the signal at the daily close. The histogram reads +0.0060, a positive reading for the first time since the pattern began. Both lines remain below zero, which means the macro trend is still bearish, but the crossover inside the triangle at the apex is the most constructive shortterm momentum signal XRP has produced in the current consolidation period. A KuCoin technical analysis published on April 8 noted that the MACD bullish crossover in XRP, when accompanied by expanding histogram bars, “could be a potential trend reversal signal” within the broader downtrend.
Key Levels: Support, Resistance, and Price Targets
The SMA 20 at $1.3398 is the immediate dynamic support, sitting just below current price. A daily close below $1.3398 signals that the SMA has failed to act as a floor and brings the lower trendline of the triangle near $1.30 into focus as the last structural support.
On the upside, the SMA 50 at $1.3792 is the first resistance and the level that must be cleared on a daily close basis to confirm a triangle breakout. A confirmed breakout above $1.3792 opens $1.5625 as the next target, where the SMA 100 sits. The extended bull case points to $1.9222, the SMA 200 level and the last major overhead reference before the February highs.
A daily close below the lower trendline near $1.30 breaks the symmetrical triangle structure and exposes $1.20 as the next support, consistent with the 1.0 Fibonacci level identified by analysts as the key floor below the current pattern.
Invalidation: a daily close below $1.30.
On-Chain and Market Data Context
XRP perpetual futures open interest fell sharply from a peak of $10.94 billion in July 2025 to approximately $2.45 billion currently, per Coinglass data, reflecting a significant deleveraging of speculative positioning over the past nine months. This reduction in open interest reduces the risk of a liquidation-driven breakdown and creates a cleaner setup for a technical breakout on lower leverage. XRP ETF inflows recorded approximately $3.3 million in net inflows on April 12, notably outperforming Bitcoin and Ethereum ETFs on the same session despite broader risk-off conditions.
The SEC CLARITY Act roundtable scheduled for April 16 is a nearterm catalyst that could introduce fresh directional volatility for XRP. The bill, which would establish XRP’s digital commodity status as permanent federal law, is expected to dominate market commentary heading into the session.
If XRP holds above $1.3398 on a daily close basis and the MACD histogram continues to expand, a test of the symmetrical triangle upper trendline and SMA 50 at $1.3792 becomes the primary nearterm target, with $1.5625 opening on a confirmed breakout above it.
Crypto World
Chainlink Price Prediction Targets $30 as US Commerce Department Joins LINK Network While Pepeto Presale Offers 100x
The chainlink price prediction just gained serious weight after Chainlink confirmed on April 12 that the US Department of Commerce, S&P Global Ratings, FTSE Russell, Deutsche Börse, and Tradeweb now distribute data through its oracle network.
LINK sits at $9.39 while a SWIFT and DTCC pilot using Chainlink hit 100% consensus on corporate actions across $58 billion in annual processing. Institutions do not wire this kind of infrastructure into a token they plan to abandon.
But the chainlink price prediction that matters most right now is not the slow climb to $30. It is whether the presale carrying a confirmed Binance listing can reshape a portfolio in weeks while the LINK forecast grinds through the rest of the year.
Chainlink Price Prediction After US Government Data Flows Through LINK Infrastructure
The US Department of Commerce, S&P Global Ratings, FTSE Russell, and Intercontinental Exchange now push data through Chainlink according to BanklessTimes. Total US LINK spot ETF assets crossed $93.78 million with zero net outflows since tracking began, and the reserve wallet holds 2.93 million LINK from protocol fees.
CCIP processes $18 billion in monthly cross-chain volume while securing $29.3 trillion in total value. With Coincub’s bull case at $85 and InvestingHaven at $30, the chainlink price prediction carries more real-world backing than most top-twenty tokens. But a $6.5 billion cap puts a ceiling on the kind of multiples that change lives, and the real 100x lives in a different entry entirely.
Chainlink Price Prediction and the Presale That Will Not Wait for It
Pepeto
Sitting on the LINK chart and hoping for $30 is the slow lane, and slow lanes cost portfolios the entries that actually print life-changing wealth. Pepeto is a fully operational exchange presale created by the same person who took Pepe from zero to $11 billion on 420 trillion tokens without a single working tool. A former Binance exchange engineer directs the technical side, and SolidProof verified every contract before the first dollar entered.
Capital crossed $9.01 million at $0.0000001863 and each round closes ahead of schedule because the wallets getting in already know what happens when this founder launches. PepetoSwap settles every swap without charging a fee so nothing gets skimmed from your bag, and the bridge connects ETH, BNB, and SOL at zero cost so every dollar lands whole.

The chainlink price prediction will print when the cycle turns, but the wallets loading right now are grabbing presale positions where 100x is basic arithmetic grounded in a founder who already delivered at $11 billion scale. Staking at 184% APY stacks tokens every single day while the majority sits frozen waiting for confirmation that whale wallets already gave months ago.
By the time LINK touches $30 and headlines call that a 3.4x win, the Pepeto listing will have already happened and the presale price will be the number that everyone who passed keeps bringing up for the rest of the cycle. That is how every missed presale ends, and that is exactly the window closing right now.
Chainlink (LINK) Price at $9.39 as Government and Institutional Data Partners Stack Up
Chainlink (LINK) trades at $9.39 according to CoinMarketCap, sitting 84% below its $52.88 all-time high with a market cap near $6.5 billion. A 72-day accumulation structure is forming on the chart, ETF net assets crossed $93.78 million, and the Bitwise CLNK fund on NYSE Arca now opens LINK to 401(k) and IRA accounts for the first time.
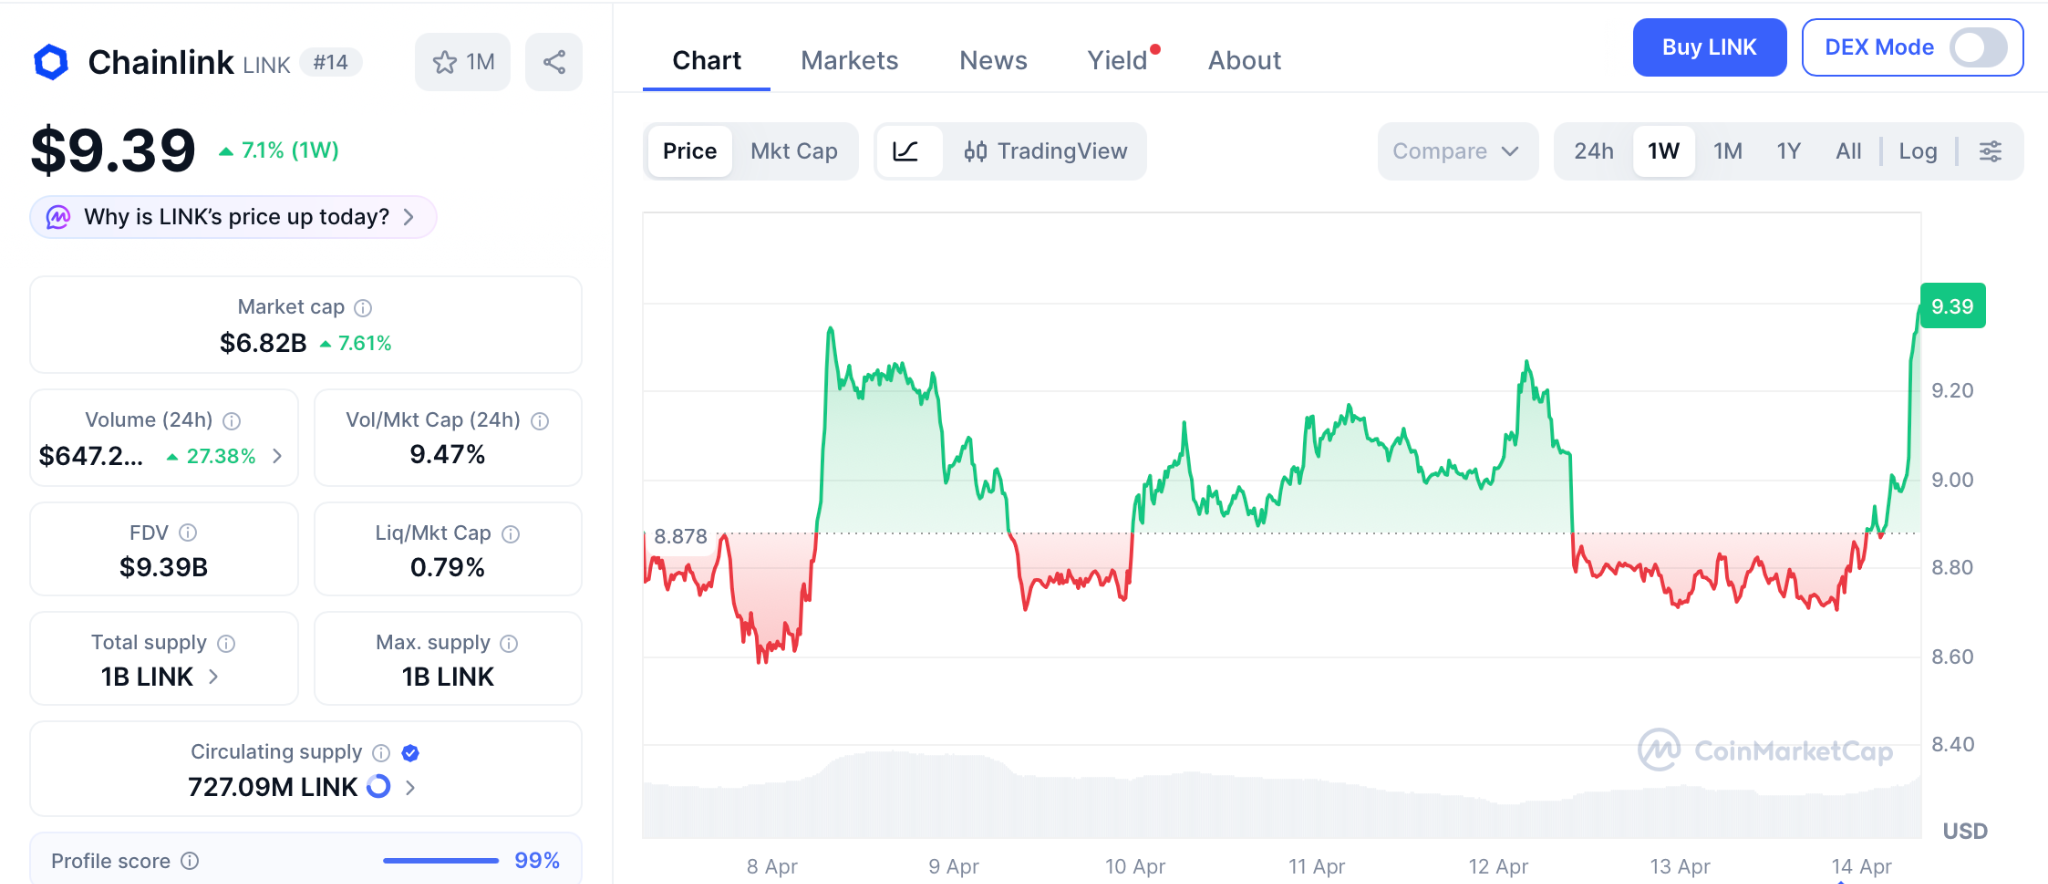
Analyst forecasts for 2026 range from $9.97 to $85 according to CoinCodex and Coincub. InvestingHaven holds $30, Coincub’s base hits $42, and the bull case reaches $85. Support holds at $8.20 with resistance at $9.55 to $10.40. Compressed Bollinger Bands point to an imminent breakout, but direction depends on broader market strength.
Even the most aggressive chainlink price prediction gives roughly 9x from here, a strong gain for an infrastructure token but nowhere near what presale entries paired with listing triggers can produce.
Conclusion
The chainlink price prediction will reward patient holders, and the infrastructure behind LINK is stronger than anything in the top twenty. But remember when LINK sat at $0.20 and zero institutions cared. No ETF existed. No government agency used the network. The wallets that entered that silence turned tiny positions into seven figures when LINK crossed $52, and most of the market never got in because they waited for proof that only arrived after the move was already over.
Those fortunes were not built by watching a $6.5 billion asset climb slowly. They were built by acting while the price was still a secret, and Pepeto is sitting in that identical window right now with $9.01 million raised, a confirmed Binance listing approaching, and a founder who already turned this exact model into $11 billion. The wallets that recognize this setup are locking entries today, and when the listing hits, the difference between acting now and waiting will be the difference between wealth and regret.
Click Here To Enter The Pepeto Presale

FAQs
What is the chainlink price prediction for 2026 after US government data joins the network?
Analyst targets range from $9.97 to $85, with InvestingHaven at $30 and Coincub reaching $85 in the bull case. CCIP processes $18 billion monthly across $29.3 trillion in secured value.
Can Pepeto beat the chainlink price prediction from presale pricing?
Pepeto at $0.0000001863 targets 100x once the Binance listing opens, compressing into days the returns the chainlink price prediction needs a full year to deliver.
Disclaimer: This is a Press Release provided by a third party who is responsible for the content. Please conduct your own research before taking any action based on the content.
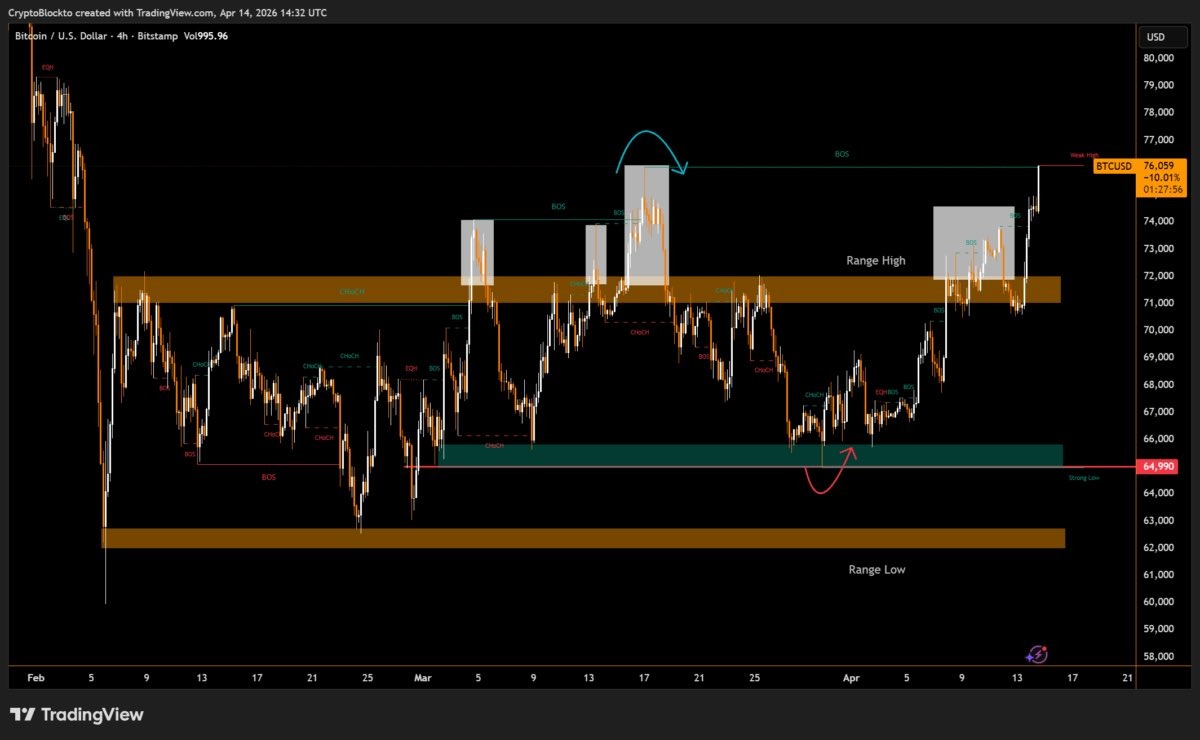
Market analysts say Bitcoin (BTC) is showing “renewed bullish momentum” after its 5% rally above $76,000 on Tuesday, with bulls eyeing further gains to $90,000 amid improving network activity.
Bitcoin price hits a 70-day high
Data from TradingView shows the BTC/USD pair rose over 5% on Tuesday to an intraday high of $76,120, levels last seen on Feb. 6.
The surge saw Bitcoin’s price reclaim key support levels, including the $75,000 zone where the 100-day exponential and simple moving averages converge.
“#Bitcoin surged above the $76,000 level, breaking above its March highs and signaling renewed bullish momentum,” analyst CryptoBlockto said in an X post on Tuesday.
The analyst pointed out that the next crucial resistance zone is $76,000 and that clearing it would confirm “a trend reversal and sustained upside momentum.”

From a technical perspective, Bitcoin is validating an ascending triangle after breaking above its upper trend line at $73,000 on Monday.
A daily candlestick close above the moving averages at $75,000 would confirm the breakout, with the next line of resistance being the psychological level at $80,000.
Above that, bulls could push the BTC price toward the triangle’s measured target of $89,050, 18% above the current price.

The daily relative strength index has increased to 63 from oversold conditions at 15 reached on Feb. 6, suggesting increasing bullish momentum.
“#Bitcoin is #trading within the horizontal supply zone of an ascending triangle pattern. The 100MA is also acting as a resistance barrier above the current price action,” analyst CryptOpus said in a recent X post, adding:
“A strong breakout above both the #pattern and the 100MA would confirm a #bullish rally in the market.”
As Cointelegraph reported, a close above $76,000 would complete a bullish ascending triangle pattern, clearing the path for a potential rally to $84,000.
Bitcoin’s transaction activity hits 17-month highs
The strength in BTC price is reflected in onchain activity, with Bitcoin’s daily transaction count rising by 62% in 2026 to 765,130 million on April 5.
This metric was last at these levels in November 2024, when the hype around the 2024 US Presidential Election pushed Bitcoin price above $100,000 for the first time in history.
“$BTC daily transaction count is higher than when $BTC was $120K,” analyst CW8900 said in an X post on Tuesday, adding:
“The network is showing bull market behavior.”

Bitcoin’s total fee volume has also climbed, increasing by 4% over the last week to $153,700, indicating “heightened onchain demand,” Glassnode said in its latest Market Pulse report, adding:
“This increase implies an uptick in network activity, potentially signalling a shift in user willingness to pay for transaction priority.”

Bitcoin’s increasing transaction count and fees mean that more users are interacting with the network. It suggests high network activity, which is often correlated with increased interest and market confidence.
This article is produced in accordance with Cointelegraph’s Editorial Policy and is intended for informational purposes only. It does not constitute investment advice or recommendations. All investments and trades carry risk; readers are encouraged to conduct independent research before making any decisions. Cointelegraph makes no guarantees regarding the accuracy or completeness of the information presented, including forward-looking statements, and will not be liable for any loss or damage arising from reliance on this content.


Someone built a money-losing Polymarket bot that only spends money on “No” trades, i.e. bets that events won’t occur.
It is a little-known fact that approximately three-quarters of all Polymarket bets resolve to a No outcome.
Artist and former Apple researcher Sterling Crispin turned that statistic into a trading bot and open-sourced its code. He published the bot, dubbed Nothing Ever Happens, on April 12, warning his followers to watch the journey, but not to expect profits.
The announcement went viral.
“Why predict the future when 73.4% of all Polymarkets resolve as No?” Crispin wrote. “Stop over thinking it. Nothing Ever Happens.”
That number is pretty close. Polymarket’s own accuracy page put the resolution split at 73.3% No and 26.7% Yes across all resolved markets. In other words, the thesis does come straight from the platform, in a way.
Read more: Assassination markets are legal now but Trump doesn’t have to worry
Probabilities do not guarantee profits
However, knowing that three-quarters of outcomes resolve to No doesn’t necessarily produce a profitable strategy on its own.
Polymarket event contracts open for trading with built-in Yes and No contract prices, adjusted for other odds of an idiosyncratic event occurring.
Consider a No opening for trading at $0.75, for example, which return $1 on a win. That 2,500 basis point profit barely covers the 26.7% of the time the bet is likely to lose entirely.
Crispin appears to understand this. After the original post went viral, he acknowledged “this has to buy below $0.73 long term, the bot has a configurable ceiling set at $0.65 and checks for new markets buying closer to $0.50.”
A ceiling of $0.65 means the bot only buys when No is priced on Polymarket at or below 65%. It hunts for markets where the crowd hasn’t yet priced in the base rate likelihood of a No resolution.
The GitHub repository carries a disclaimer in bold italic: For entertainment only, use at your own risk.
A dashboard screenshot attached to the original post showed a portfolio of $2,859 mostly for demonstration purposes. The code repository has attracted over 400 stars and ships under a public domain copyright license.
Yet another bot losing money on Polymarket
On-chain analysis of 2.5 million wallets by researcher Andrey Sergeenkov found that 84.1% of wallets that have traded on Polymarket have lost money. Only 0.033% have earned more than $100,000.
The simplest possible strategy — to bet on No and walk away — outperforms most of the platform’s users.
Polymarket has leaned into the premise for media attention. Incredibly, the platform hosts a “Nothing Ever Happens” series of parlay markets.
These parlays bundle unlikely events (China invades Taiwan,bitcoin hits $1 million, Trump acquires Greenland) and let traders bet that none of them occur.
A 2026 annual edition carries $489,000 in volume with “Nothing” priced at 56%.
Unsurprisingly, the parlays haven’t paid off. The Jerome Powell Edition resolved to “No,” meaning something did happen. So did the US Strike Edition, after US military action met one of its trigger conditions.
Crispin isn’t a typical crypto trader. He describes himself as a conceptual artist and software engineer and previously spent years at Apple contributing to neurotechnology patents for the Vision Pro headset.
Got a tip? Send us an email securely via Protos Leaks. For more informed news, follow us on X, Bluesky, and Google News, or subscribe to our YouTube channel.


Paxos Labs has raised $12 million in a strategic funding round led by Blockchain Capital to scale Amplify, a modular platform designed to bring crypto yield, lending, and stablecoin issuance into a single, developer-friendly integration. The Amplify stack comprises three modules—Earn, Borrow, and Mint—built to help platforms convert idle digital-asset balances into revenue-generating financial services while offering a unified path for onboarding and deployment. In the project’s public announcement, Paxos described Amplify as a single SDK with configurable controls, with Paxos handling liquidity provisioning, counterparty vetting, and backend operations, and sharing a portion of generated revenue with integrating partners.
Early adopters include Aleo, Hyperbeat, and Toku, with Hyperbeat reporting more than $510,000 in assets under management since its April 9 launch. The funding round also featured participation from Robot Ventures, Maelstrom, and Uniswap. Paxos Labs operates as an incubated unit within Paxos, a firm that has processed more than $180 billion in tokenization volume for institutional clients, according to the company.
The Amplify initiative is aimed at platforms that already offer crypto custody or trading, seeking to turn passive digital-asset holdings into active, revenue-generating financial products through a streamlined, turnkey integration.
Key takeaways
- Amplify bundles Earn, Borrow, and Mint into a single developer SDK, enabling yield generation, crypto-backed lending, and branded stablecoins without multiple disparate integrations.
- The $12 million strategic round signals investor confidence in modular on-chain financial primitives, with Blockchain Capital leading and backers including Robot Ventures, Maelstrom, and Uniswap.
- Early traction from partners like Hyperbeat, which has accumulated over half a million dollars in AUM since its launch, suggests real-world demand for integrated yield and lending capabilities on user-held assets.
- The move sits within a broader industry push toward yield-bearing crypto products and a shifting regulatory backdrop that debates how such offerings should be overseen in the United States.
Amplify’s modular toolkit and how it works
Earn, Borrow, and Mint form a cohesive suite intended to unlock additional value from digital assets. Earn enables platforms to generate yield on user-held tokens, Borrow provides crypto-backed lending facilities, and Mint allows for the issuance of branded stablecoins. Paxos commits to liquidity management, counterparty vetting, and backend operations, while sharing a portion of the proceeds with integrating partners. The approach is designed to reduce integration complexity for exchanges, wallets, and other crypto service providers that want to augment their offerings without building each component from scratch.
According to the official announcement, Amplify delivers a single, configurable SDK that can be embedded into a platform’s existing stack. Paxos’ role as a liquidity and operational partner aims to streamline onboarding and improve risk controls, enabling tighter integration and faster time-to-market for new financial products tied to digital assets.
Backers, traction, and what it signals for the market
The round’s backers underscore strategic interest in enabling on-chain financial services through interoperable primitives. Blockchain Capital led the fundraising, with participation from Robot Ventures, Maelstrom, and Uniswap, highlighting a mix of traditional crypto-focused investors and prominent DeFi players recognizing Amplify’s potential to scale revenue opportunities tied to user-held digital assets.
Hyperbeat’s reported AUM of over $510,000 since its April 9 launch provides a tangible early signal of demand for yield- and lending-enabled products across partner platforms. Paxos’ longstanding activity in the asset-tokenization space—more than $180 billion in tokenization volume for institutional clients—underpins the credibility of a platform designed to connect custody, trading, and on-chain finance through a unified interface.
Industry context: yield, lending, and regulatory chatter
The Amplify announcement arrives amid a broader wave of platforms expanding beyond custody and trading into yield generation and lending for user-held assets. Notable moves include Kraken’s March integration of a structured products platform from STS Digital to offer options-based strategies on BTC and ETH, and Coinbase’s launch of a tokenized Bitcoin Yield Fund on its Base network to give institutions on-chain access to yield-bearing crypto exposure. In addition, both exchanges have begun offering yield on stablecoins, often by linking to on-chain lending markets.
Institutional-focused providers have also advanced lending against assets held in custody. For example, Anchorage Digital announced a collaboration with Kamino and Solana Company to enable institutions to borrow against staked SOL without moving assets, while Lombard and Bitwise Asset Management teamed up to offer yield and borrowing on Bitcoin through on-chain lending infrastructure.
Beyond product development, policy discussions remain active. The Digital Asset Market Clarity Act has grown as a framework proposal to regulate digital assets in the U.S., with industry observers weighing potential implications for yield-bearing products. The American Bankers Association has argued that permitting stablecoin yields could accelerate deposit outflows from smaller banks and raise funding costs, a tension that lawmakers and market participants continue to watch closely.
What to watch next for Amplify and the broader market
Amplify’s success will likely hinge on how quickly more platforms adopt the toolkit and scale deployments across custody and trading ecosystems. The combination of a streamlined SDK, managed liquidity, and revenue-sharing could lower barriers to offering on-chain yield and lending, potentially turning idle balances into recurring revenue streams for a broader slice of the crypto economy. Investors will be watching partner sign-ups, actual yield performance, and how regulatory developments shape the feasibility and design of these products as the market seeks to balance innovation with risk controls.
As platforms experiment with asset-backed lending, yield-bearing stablecoins, and branded on-chain instruments, the market will also assess counterparty risk, liquidity depth, and the sustainability of revenue-sharing models. The coming quarters should reveal whether Amplify’s modular approach translates into broader adoption and meaningful revenue uplift for platforms and their users.
Readers should keep an eye on announcements from Paxos Labs for new partner integrations, updates on liquidity arrangements, and any shifts in regulatory guidance that could impact the deployment of yield and lending features across the crypto ecosystem.
This article was originally published as error code: 524 on Crypto Breaking News – your trusted source for crypto news, Bitcoin news, and blockchain updates.


Bitcoin shot to a one-month high above $75,000 in early U.S. trading hours on Tuesday, now up 6% over the past 24 hours at $75,300.
The move is drawing increased attention from analysts, who told CoinDesk the level could mark a key shift in the market’s current rangebound structure.
“A clean break above $75,000 wouldn’t just be another move higher; it would represent a structural breakout from consolidation and likely shift the market into a new upward trend,” said Mati Greenspan, founder of Quantum Economics and a former senior market analyst at eToro.
Greenspan said the significance of going beyond the $75,000 level lies less in a brief move about it and more in whether bitcoin can sustain those gains.
“The key question isn’t whether we briefly trade above $75,000, but whether we can hold it,” Greenspan said, noting that acceptance above that threshold would signal strength and draw in new capital.
A downside would be limited anyway
However, he said, a failure to hold would risk turning the move into a bull trap, though the broader market structure remains strong. He also believes that even in a negative scenario, the downside would likely be limited because of existing established support. “If it doesn’t hold, then we still have strong support at $65,000.”
Kevin Murcko, a crypto analyst and founder and CEO at crypto exchange Coinmetro, said round-number levels like $75,000 can act as focal points for market participants and could create supply as investors who recently entered positions look to take profit.
“Traders, especially those that aren’t that experienced, generally trade around round numbers,” Murcko said, adding that levels such as $25,000, $50,000 and $75,000 tend to draw in buying and selling interest.
Whether bitcoin can move decisively beyond that level will depend on the broader backdrop at the time, including the news flow driving markets, Murcko said.
“In most cases, if we see news pushing price to around $75,000, that same momentum can push it past,” Murcko said, emphasizing that price levels alone are less important than the balance between supply and demand and the strength of buying pressure.
BTC could rise to $85,000
Han Tan, chief market analyst at Bybit Learn, said bitcoin is now re-entering a key battleground between bulls and bears, with the $75,000 region acting as a strong resistance in recent weeks.
He believes a meaningful break above that level would draw sidelined buyers back into the market and potentially clear the path upward to the mid-$80,000 level. However, Tan said such gains would likely depend on a supportive macro backdrop, including easing geopolitical tensions and continued ETF inflows.
Other analysts, however, believe $75,000 may be more of a psychological milestone than a genuine structural pivot.
Dessislava Ianeva, an analyst at Nexo Dispatch, said that while a move above $75,000 could draw in momentum buyers, stronger confirmation would come at higher levels.
She said, “$75,000 is psychologically significant, but $79,000 is the level that matters structurally,” pointing to the 100-day moving average and a prior rejection zone. Ianeva also said a sustained move above roughly $74,000 on a daily closing basis would provide an early signal that the breakout has “structural legs.”
The market intelligence research analyst noted that current market positioning appears relatively stable, reducing the likelihood of a sharp reversal. Funding rates remain muted, and bitcoin has absorbed recent selling pressure, including exchange-traded fund (ETF) outflows, without breaking lower, a behaviour that is not typical of a market on the verge of a major pullback.
U.S. Spot bitcoin ETFs did not see inflows until March, when these investment instruments recorded $1.32 billion in net inflows, ending a four-month outflow streak.
Altering how bitcoin behaves
Broader structural changes in the market may also be altering how bitcoin behaves during the current cycle, according to Jason Fernandes, a market analyst and AdLunam co-founder.
“Bitcoin isn’t trading like a purely retail-driven cycle,” Fernandes said, citing persistent ETF inflows, reduced free float and stronger holder cohorts.
Fernandes said that while BTC can still see sharp downside moves during liquidity shocks, it tends to recover based on expectations around central bank policy and liquidity conditions, often ahead of traditional risk assets.
“Rising oil prices and geopolitical stress keep inflation expectations elevated and delay policy easing,” he said. “That tightens financial conditions in the short term, but once real yields roll over or liquidity stabilizes, crypto tends to reprice quickly and generally ahead of traditional risk assets.”


The XRP Ledger added native support for zero-knowledge (ZK) proof verification by integrating with Boundless, a ZK proving network, in what the company claims is the first deployment of its kind on the ledger.
The move is designed to let financial institutions transact privately on the public blockchain while meeting regulatory requirements.
It addresses a specific barrier to institutional adoption that has persisted across every public blockchain. Transaction flows, treasury positions, and counterparty relationships are visible by default on public ledgers. For a bank settling cross-border payments or a fund managing OTC positions, that transparency creates competitive risk.
Zero-knowledge proofs solve this by allowing one party to prove a statement is true without revealing the underlying data. It’s like passing a credit check, where the bank confirms an individual qualifies for a loan without telling the lender specifics about income, debts or account balance.
In practice on XRPL, this means a payment can be verified as valid, correctly funded, and compliant without exposing the amount, the sender, or the receiver to the public ledger.
XRPL already has institutional traction that most layer-1 blockchains do not. SBI Holdings in Japan, Zand Bank in the UAE, Archax in the U.K. and Guggenheim Treasury Services in the U.S. all use the network.
More than $550 million has been deployed into XRPL ecosystem initiatives. The connection to Boundless gives those institutional users a path to privacy they did not previously have on the ledger.
The timing is notable given the broader conversation around blockchain cryptography this month.
Google’s quantum computing paper forced every major chain to evaluate its cryptographic assumptions. ZK proofs are built on different mathematical foundations than the elliptic curve cryptography that quantum threatens, and several ZK proof systems are already considered quantum-resistant or can be upgraded to post-quantum constructions more easily than traditional signature schemes.
Adding ZK infrastructure now positions XRPL to build on cryptographic foundations that may age better than the ones the quantum debate is focused on.


The payments-focused blockchain plans to expand its validator set with additional partners as it progresses toward fully permissionless validation.
Payments-focused blockchain Tempo has added Visa, Stripe and Zodia Custody by Standard Chartered as its first external validators, the network announced on Tuesday.
The trio collectively process trillions of dollars in payments each year across nearly every country. Their validator nodes are responsible for verifying, sequencing and finalizing transactions on the network, bolstering operational resilience for stablecoin-based settlements.
Visa’s node was configured and managed entirely in-house following six months of collaboration with Tempo’s engineering team, according to a press release from the payments giant. The company is serving as an “anchor validator” during this initial phase.
“We’ve spent years building our expertise in blockchain, and now we’re expanding that work by running critical blockchain infrastructure ourselves,” said Cuy Sheffield, Visa’s head of crypto.
Validators on Tempo are rewarded in stablecoins for serving as “lead validators” who package transactions into blocks. Visa also serves as a Super Validator on the Canton Network, making it one of the very few traditional payments firms running blockchain infrastructure across multiple chains.
Tempo said it plans to continue expanding the validator set with additional partners as it progresses toward fully permissionless validation.
Institutional Momentum
The validator additions cap a rapid buildup for the Ethereum-compatible Layer 1, which was first reported in August 2025 before Stripe and Paradigm officially unveiled the project the following month.
Tempo raised $500 million in a Series A led by Thrive Capital and Greenoaks in October 2025 at a $5 billion valuation, launched its public testnet in December with partners including UBS and Kalshi, and went live on mainnet in March alongside the Machine Payments Protocol, an open standard for AI agent-to-service payments co-authored with Stripe.
Still, Tempo faces skepticism from decentralization advocates who question whether a corporate-backed L1 can deliver on its permissionless promises. Whether onboarding institutional validators satisfies those concerns or reinforces them will depend on how quickly Tempo opens participation beyond its hand-picked partners.
This article was written with the assistance of AI workflows. All our stories are curated, edited and fact-checked by a human.

Lookman Fires Atlético Madrid into Champions League Semi-Finals
John Deere Pays $99 Million To Settle ‘Right To Repair’ Class Action
Anas Sarwar promises to lift over 100,000 children out of poverty if he becomes First Minister


-

 Politics4 days ago
US brings back mandatory military draft registration
-
 Sports4 days ago
Man United discover Nico Schlotterbeck transfer fee as defender reaches Dortmund agreement
-

 Fashion4 days ago
Weekend Open Thread: Veronica Beard
-

 Politics5 days ago
Malcolm In The Middle OG Turned Down ‘Buckets Of Money’ To Appear In Reboot
-

 Politics2 days ago
World Cup exit makes Italy enter crisis mode
-

 Crypto World5 days ago
Canary Capital Files SEC Registration for PEPE ETF
-

 Business4 days ago
Tesla Model Y Tops China Auto Sales in March 2026 With 39,827 Registrations, Beating Cheaper EVs and Gas Cars
-

 Crypto World1 day ago
The SEC Conditionalises DeFi Platforms to Be Avoided for Broker Registration
-

 Crypto World1 day ago
SEC Signals Exemption for Crypto Interfaces From Broker Registration
-

 Crypto World6 days ago
Bitcoin recovers as US and Iran Agree a Ceasefire Deal
-
 NewsBeat2 days ago
Pep Guardiola and Gary Neville agree over Arsenal title problem that benefits Man City
-

 Business5 days ago
OpenAI Halts Stargate UK Data Centre Project Over Energy Costs and Copyright Row
-

 Business3 days ago
Ireland Fuel Protests Enter Day 5 as Blockades Spark Shortages and Government Prepares Support Package
-

 Politics5 days ago
LBC Presenter Mocks Trump Over Iran War Failures
-

 Crypto World4 days ago
Federal judge blocks Arizona from bringing criminal charges against Kalshi
-
 NewsBeat3 days ago
JD Vance announces ‘no agreement’ with Iran over nuclear weapons fear
-

 Tech5 days ago
A version of Windows 10 released a decade ago is now eligible for additional security patches
-

 Business4 days ago
IMF retains floor for precautionary balances at SDR 20 billion
-

 Crypto World19 hours ago
SEC Proposes Certain Crypto Interfaces Don’t Need to Register as Brokers
-

 NewsBeat15 hours ago
Trump and Pope Leo: Behind their disagreement over Iran war
You must be logged in to post a comment Login