
Crypto World
Tempo Onboards Visa, Stripe and Zodia Custody as Validators


The payments-focused blockchain plans to expand its validator set with additional partners as it progresses toward fully permissionless validation.
Payments-focused blockchain Tempo has added Visa, Stripe and Zodia Custody by Standard Chartered as its first external validators, the network announced on Tuesday.
The trio collectively process trillions of dollars in payments each year across nearly every country. Their validator nodes are responsible for verifying, sequencing and finalizing transactions on the network, bolstering operational resilience for stablecoin-based settlements.
Visa’s node was configured and managed entirely in-house following six months of collaboration with Tempo’s engineering team, according to a press release from the payments giant. The company is serving as an “anchor validator” during this initial phase.
“We’ve spent years building our expertise in blockchain, and now we’re expanding that work by running critical blockchain infrastructure ourselves,” said Cuy Sheffield, Visa’s head of crypto.
Validators on Tempo are rewarded in stablecoins for serving as “lead validators” who package transactions into blocks. Visa also serves as a Super Validator on the Canton Network, making it one of the very few traditional payments firms running blockchain infrastructure across multiple chains.
Tempo said it plans to continue expanding the validator set with additional partners as it progresses toward fully permissionless validation.
Institutional Momentum
The validator additions cap a rapid buildup for the Ethereum-compatible Layer 1, which was first reported in August 2025 before Stripe and Paradigm officially unveiled the project the following month.
Tempo raised $500 million in a Series A led by Thrive Capital and Greenoaks in October 2025 at a $5 billion valuation, launched its public testnet in December with partners including UBS and Kalshi, and went live on mainnet in March alongside the Machine Payments Protocol, an open standard for AI agent-to-service payments co-authored with Stripe.
Still, Tempo faces skepticism from decentralization advocates who question whether a corporate-backed L1 can deliver on its permissionless promises. Whether onboarding institutional validators satisfies those concerns or reinforces them will depend on how quickly Tempo opens participation beyond its hand-picked partners.
This article was written with the assistance of AI workflows. All our stories are curated, edited and fact-checked by a human.

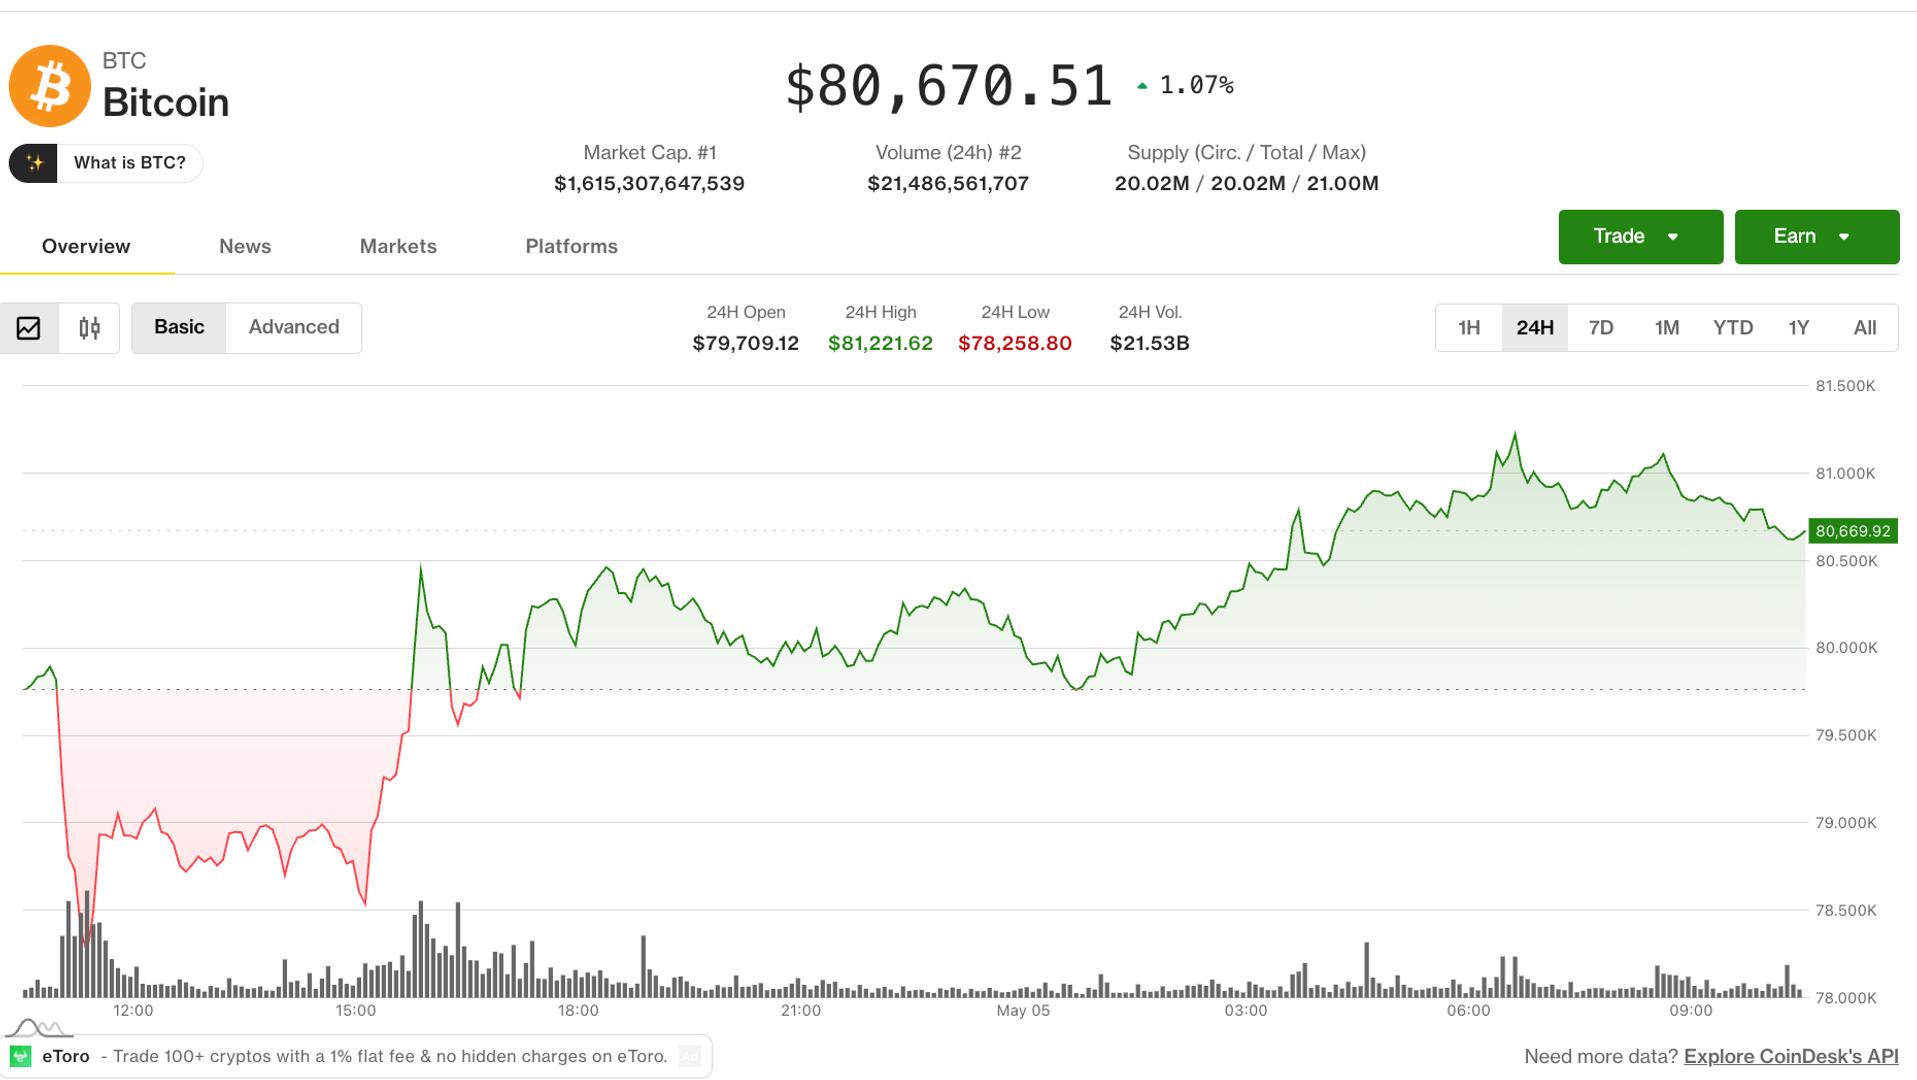
Expectations around U.S. monetary policy are shifting, but bitcoin appears increasingly indifferent. The cryptocurrency has pushed past the $80,000 mark, signaling that macro headwinds tied to interest rates may be losing their grip on price action.
A growing number of major brokerages now expect the Federal Reserve to hold rates steady through the year, a marked change from the earlier expectations of at least two rate cuts. Barclays joined peers in scrapping its earlier forecast for a rate cut on Monday, pointing to persistently high energy prices linked to geopolitical tensions involving Iran as an inflationary development. Other global firms, including JPMorgan, have similarly pushed back against expectations of policy easing.
Under normal circumstances, a higher-for-longer rate outlook would weigh on risk assets. Still, BTC continues to gain ground. Some analysts argue the asset is increasingly being treated as a hedge against inflation, supported by continued inflows into spot ETFs even as inflation fears mount. Others remain skeptical, attributing the rally more to strength in equities than to any structural shift in crypto demand.
For now, momentum appears to favor the bulls.
“From a market structure standpoint, we are seeing traders closely watch the $81,500 resistance level, while the CME futures gap around $84,000 remains a key zone for potential upside. These technical levels, combined with macro developments, will likely guide near-term price action,” said Ashish Singhal, co-founder of the FIU-registered CoinSwitch exchange.
Technical indicators reinforce that view. The 200-day simple moving average (SMA), which is often seen as a dividing line between longer-term bearish and bullish trends, is located near $83,430. So, a decisive move above it could strengthen the case for further upside.
The broader market is also showing signs of selective strength. Bitcoin’s roughly 2% gain to around $80,700 has been accompanied by outsized moves in certain altcoins. Toncoin (TON) has surged about 35%, while MORPHO and PENGU have gained 11% and 9%, respectively. On the weaker side, Dash has slipped slightly. Larger tokens such as ether, XRP, and solana have largely tracked bitcoin’s modest advance.
At the same time, sentiment is sitting at a critical juncture. The Crypto Fear and Greed Index has climbed to 50, right at the midpoint of its range, a level last seen in mid-January.
“The market is approaching a significant turning point. Since last October, there have been only brief surges in sentiment to higher levels, but these have provided excellent opportunities for bears to sell at higher prices,” said Alex Kuptsikevich, chief market analyst at FxPro. Stay alert!
Read more: For analysis of today’s activity in altcoins and derivatives, see Crypto Markets Today . For a comprehensive list of events this week, see CoinDesk’s “Crypto Week Ahead.”
What’s trending
Brent holds near $114 a barrel as Middle East tensions rage on (Reuters): Brent crude futures eased 93 cents, or 0.8%, to $113.51 per barrel after settling up 5.8% on Monday. West Texas Intermediate crude fell $2.16, or 2%, to $104.26, after gaining 4.4% in the previous session.
Maersk says ship passed through Strait of Hormuz under U.S. military protection (CNBC): Maersk said one of its commercial vessels, stranded at sea since the start of the war on Feb. 28, successfully transited through the strategically vital Strait of Hormuz under U.S. military protection.
‘A deal is a deal’: Von der Leyen hits back at Trump’s latest tariff threat (euronews): The European Union is “prepared for every scenario” if Donald Trump unilaterally hikes tariffs on EU-made cars, says Ursula von der Leyen.
China steps up U.S. sanctions fight, defying blacklisting over Iranian oil (The Wall Street Journal): China escalated its fight against the U.S. over Iranian oil, defying American sanctions in a show of resistance ahead of President Trump’s visit to Beijing planned for next week.
Today’s signal

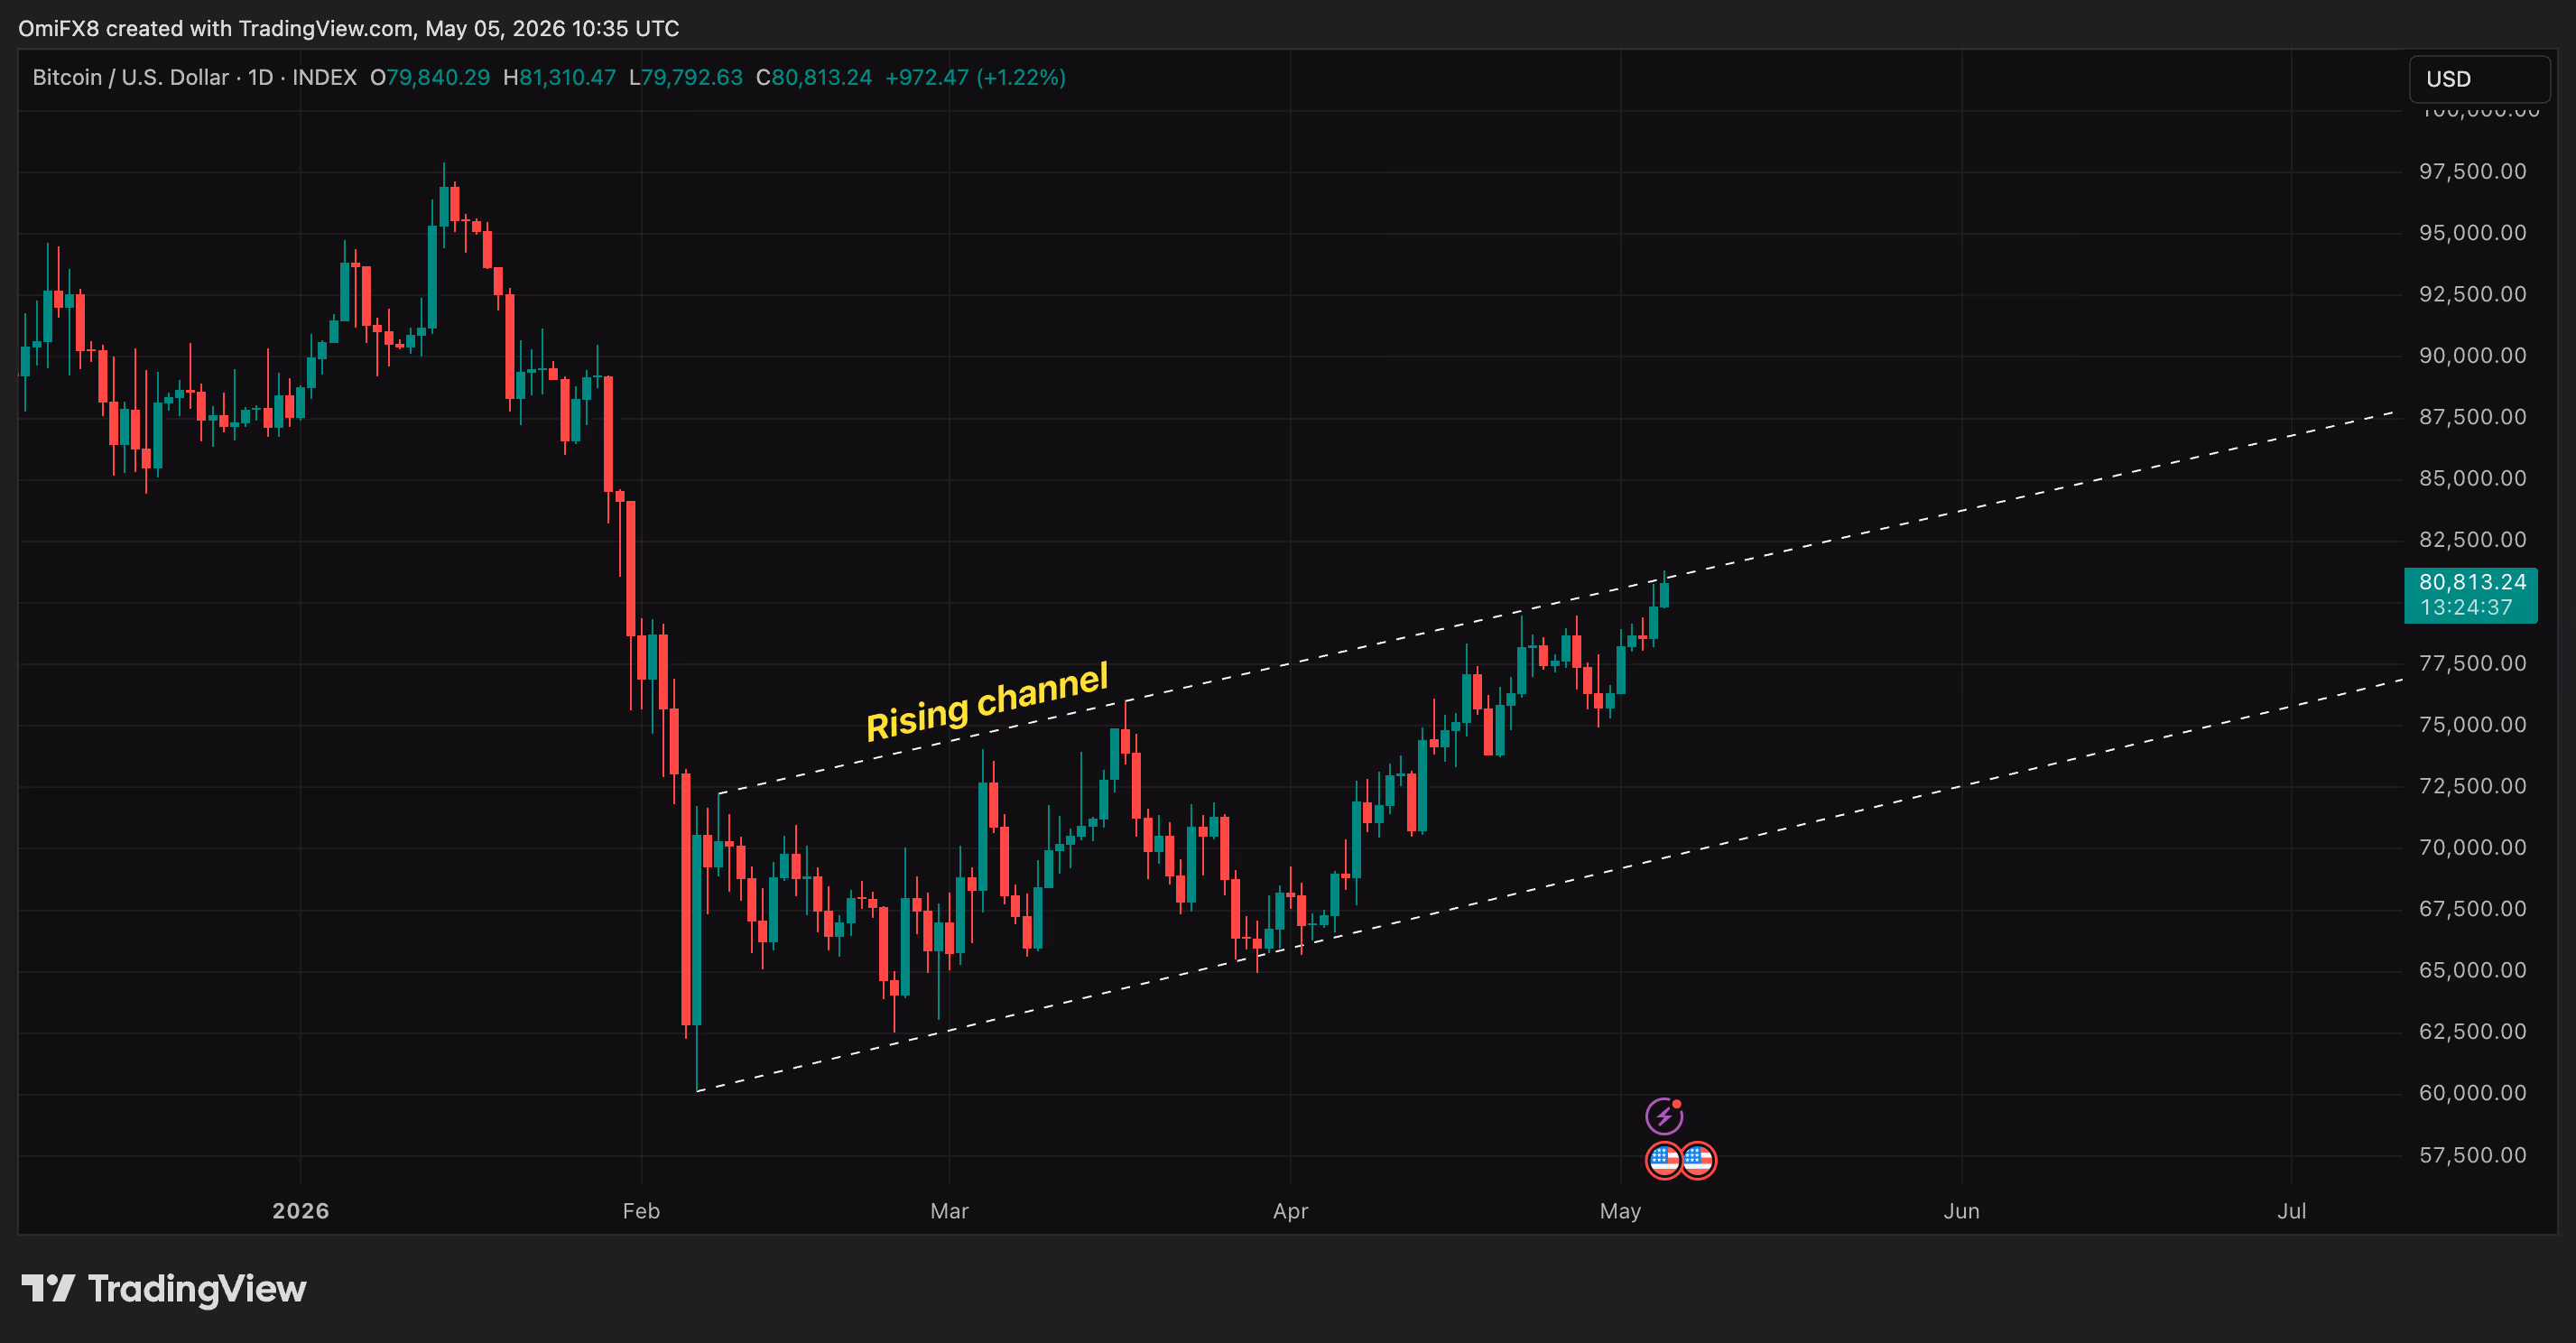
After a sharp sell-off to nearly $60,000 earlier this year, bitcoin has steadily climbed back above $80,000 within a well-defined, textbook rising channel, marked by a consistent pattern of higher lows and higher highs.
Prices are now pushing against the upper boundary of that channel, a level that can act as short-term resistance where rallies can stall or pull back.
A decisive breakout above the upper boundary could trigger stronger momentum and potential speculative frenzy toward $100,000. However, repeated rejection at this level could send prices back toward $70,000 or lower.
In short, bulls are in control right now, with prices nearing a key technical test.

Crypto World
Coinbase latest crypto firm to slash staff citing market conditions and AI shift. Reduces it by 14%.


Brian Armstrong, CEO and co-founder of Coinbase, announced Tuesday on X that his company is slashing its workforce by roughly 14%, or 660 employees, citing negative market conditions and AI challenges.
“Today I’ve made the difficult decision to reduce the size of Coinbase by ~14%,” said Armstrong in an X post he said was also the email sent to all the crypto exchange’s employees. In it, he explained the “two forces” that converged in his firm’s decision to slash staff.
“While we’ve managed through that cyclicality many times before and come out stronger on the other side, we’re currently in a down market and need to adjust our cost structure now so that we emerge from this period leaner, faster, and more efficient for our next phase of growth,” said the CEO of the Nasdaq-listed company.
The second reason is AI, and how it is changing the way Coinbase operates, he said. “Over the past year, I’ve watched engineers use AI to ship in days what used to take a team weeks,” Armstrong stated, adding that “the pace of what’s possible with a small, focused team has changed dramatically, and it’s accelerating every day.”
The Coinbase CEO said that employees laid off in the U.S. will receive a minimum of 16 weeks’ base pay, plus 2 weeks of severance pay for every year they were employed by the company. He also said that those not in the U.S. would receive similar support under local law.
“Over the past 13 years, we have weathered four crypto winters, gone public, and built the most trusted platform in our industry,” he said.
A wave of crypto layoffs this year has highlighted the gap between two convenient narratives: macro headwinds and AI transformation. Algorand cut its staff by 25% in late March, citing “the uncertain global macro environment” and a broader crypto downturn. In February, Gemini Space Station (GEMI) said it would eliminate roughly 200 positions, about a quarter of its staff, a figure that had grown to 30% by mid-March. On Thursday, Crypto.com said it is trimming 12% of its workforce, about 180 roles.
All but Algorand pointed directly to macro conditions, weak token prices and a pivot toward greater use of AI in the workflow.
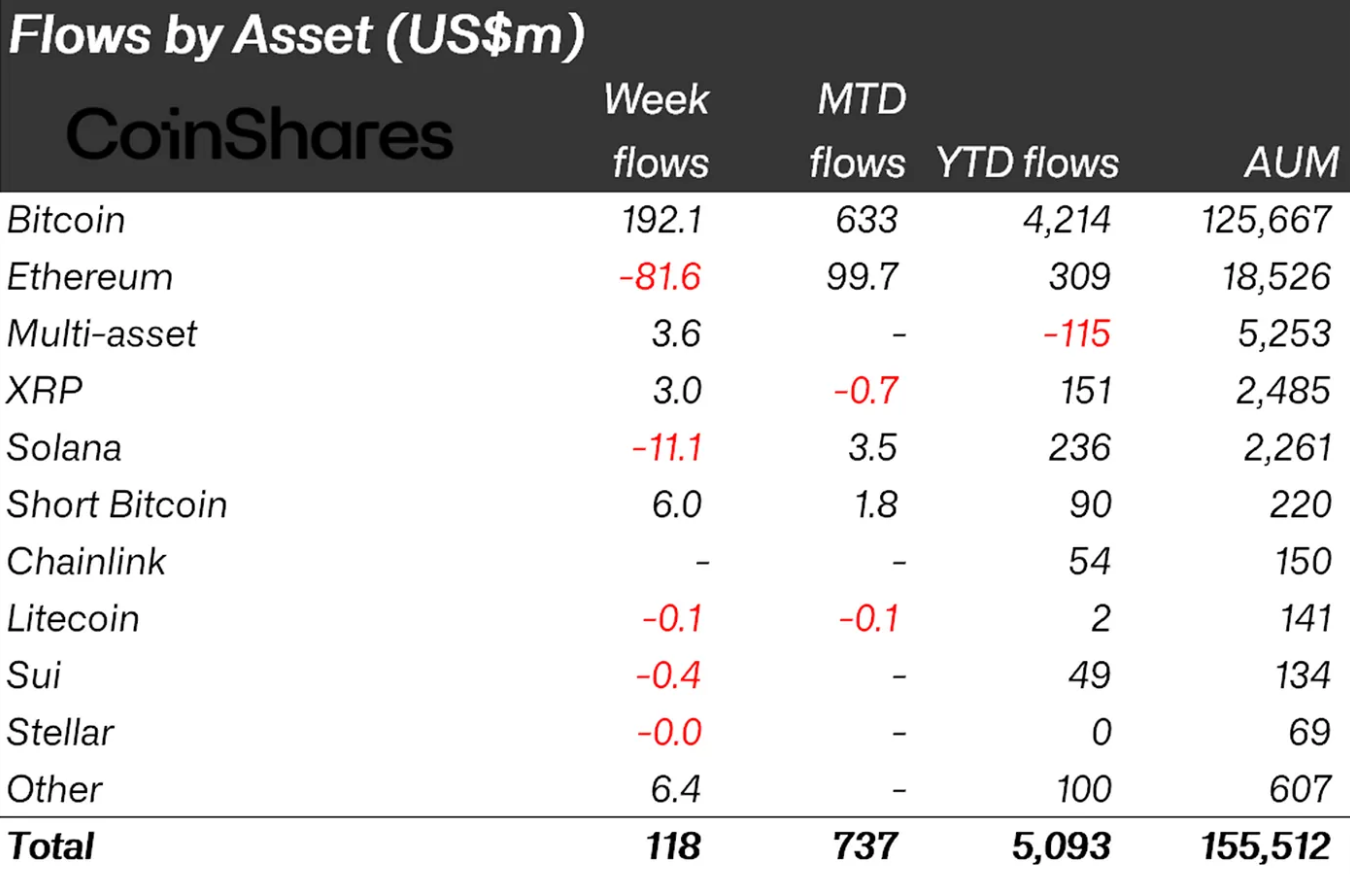
Ethereum funds shed $81.6 million in outflows last week. The drop ended a three-week streak that had averaged above $190 million in inflows, CoinShares reported.
The reversal narrowed asset participation across digital asset products. Meanwhile, only four cryptocurrencies attracted positive flows versus nine a week earlier. The wider category still booked its fifth consecutive week of net inflows.
Ethereum Funds Stand Out as Markets Snap Back Friday
Total digital asset funds attracted $117.8 million for the week, the slimmest figure of the current run. Combined assets under management held steady near $155 billion, broadly flat versus the prior reading.
However, the headline number hides a sharp swing within the period. Products bled $619 million from Monday through Thursday. A single Friday session then pulled in $737 million, flipping the tape positive.
“The Friday figure ranks among the largest single-day inflows of 2026, likely reflecting a sharp improvement in risk appetite. Total AuM stood at $155 billion, broadly unchanged,” read an excerpt in the latest Coinshares report.
Bitcoin funds, by contrast, absorbed $192.1 million, lifting year-to-date inflows to $4.2 billion. The weekly figure trailed the roughly $1 billion average set across the prior three weeks. Short-bitcoin products added $6 million.

Regional flows tilted away from the United States. The country contributed just $47.5 million after $1.1 billion the prior week.
Germany led with $43.8 million, and Canada added $16 million. European appetite held firmer through the soft patch.
Institutional Bid Tests the Crypto Spring Thesis
Meanwhile, US spot ETF data already shows the bid returning at the asset level. SoSoValue figures for May 4 showed US Bitcoin spot ETFs taking in $532 million. That marked a third consecutive day of inflows. Ether ETFs added $61.3 million in the same session.

Fundstrat’s Tom Lee called the setup the start of a “Crypto Spring.” He cited progress on the CLARITY Act and Ethereum’s dual tailwinds from tokenization and artificial intelligence.
Beyond ETFs, sentiment data echoed the shift. Crypto Twitter analytics platform Cookie DAO flagged Bitcoin and ether as the week’s largest mindshare gainers.

The trigger was JPMorgan Chase moving to accept both assets as collateral for institutional loans, including home mortgages.
“We’re so back! BTC and ETH are the biggest mindshare gainers on CT this week,” Cookie DAO indicated.
However, Ethereum’s negative fund tally and stronger ETH ETF demand into the weekend create a tension.
The coming week becomes a clean test. Another Friday-style rebound would strengthen the case that institutions, not retail, are driving the bid.
The post Ethereum Sheds $81.6 Million in Funds as Crypto Snaps Mid-Week Risk Off appeared first on BeInCrypto.
Crypto World
Bitcoin tops $81K as ETF inflows and sentiment recovery signal potential push toward $90K


Key takeaways
- Bitcoin briefly topped the $81,000 mark on Tuesday, the highest level in three months.
- Crypto sentiment improves, with inflows into US-listed spot ETFs totaling $154 million last week.
Bitcoin (BTC) is hovering just below the $81,000 mark on Tuesday after adding 1% to its value in the last 24 hours.
The broader crypto market remains constructive, with Ethereum (ETH) and XRP (Ripple) posting mild gains, reflecting a steady improvement in overall sentiment.
Sentiment improves as capital flows return
Market confidence is gradually recovering, supported by rising inflows into digital asset investment products. The Crypto Fear & Greed Index has climbed to 47 from 29 a day earlier — a sharp rebound, though still within the “fear” zone. Notably, this marks a significant improvement from last month’s average of 11, which signaled extreme fear.
If this upward trend continues, it could reinforce expectations for Bitcoin to reclaim $80,000 as support and potentially grind higher toward the $90,000 level.
Spot Bitcoin ETFs recorded their fifth consecutive week of inflows, adding $154 million through Friday. While this is down from the prior week’s $824 million, the data still highlights sustained investor appetite for crypto exposure — even amid geopolitical tensions such as the ongoing US–Iran situation.
Cumulative ETF inflows now stand at $58.72 billion, with assets under management averaging $103.78 billion, underscoring persistent institutional demand.
Bitcoin’s recent move above $81,000 triggered notable liquidations. Short positions took the largest hit, with approximately $138 million wiped out, compared to around $46 million in long liquidations.
Bitcoin eyes the $90k psychological level
The BTC/USD 4-hour chart is bullish and efficient as Bitcoin is trading above $80,800. While the price has reclaimed this long-term support, it remains capped below the 100-week EMA at $82,352, and the 50-week EMA at $85,777These levels continue to act as key resistance zones, limiting a full bullish breakout for now.
Momentum indicators suggest a market in recovery mode. The RSI on the daily chart sits near 48, close to neutral territory, while the MACD remains positive, signaling improving — but not dominant — bullish momentum.

If the rally persists, key resistance levels to watch include $82,352 (100-week EMA) and $85,777 (50-week EMA).
However, if the bears regain control, key support levels would be seen at $68,061 (200-week EMA) and $65,981 (trendline level).
A sustained weekly close above the upper resistance band would be needed to confirm a stronger medium-term bullish shift.
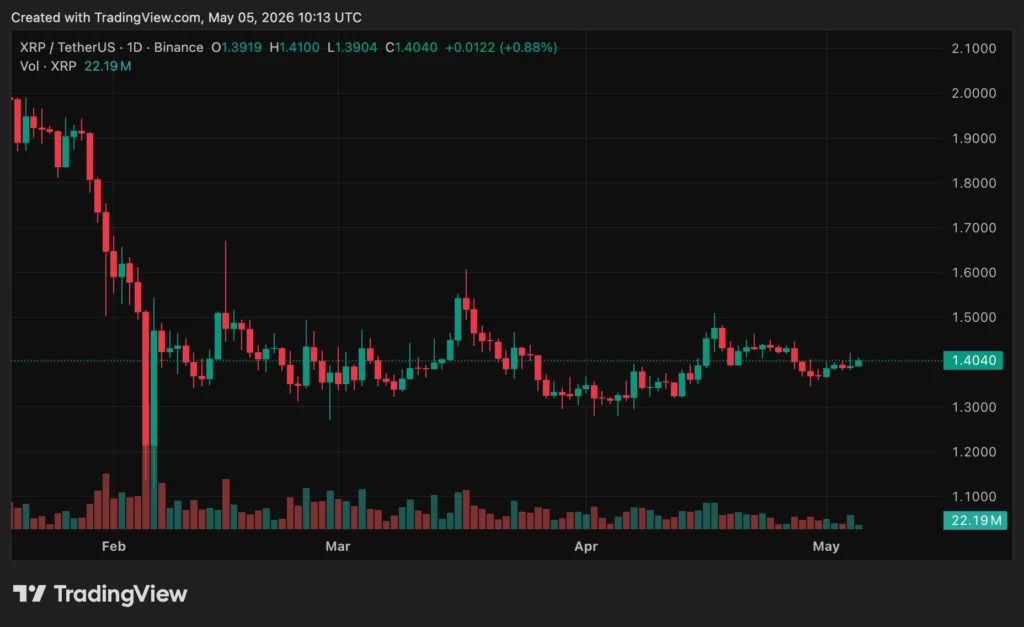
- XRP rose above $1.40 as Bitcoin surpassed $81,000.
- A 23% surge in daily trading volume suggests sellers are active.
- The CLARITY Act, ETF inflows, and regulated exposure are likely to aid bulls further.
XRP trades near the $1.40 resistance level, with recent upward momentum pushing the cryptocurrency above a key level amid overall market enthusiasm.
While the uptick has stalled following Bitcoin’s breakout to above $81,000 and slight retreat, a pause could act as a base for fresh consolidation before XRP ticks up.
The Ripple-linked asset looked to have shrugged off news that a key insider trimmed their holdings in favour of the Ripple stock.
XRP price today
XRP is trading near the $1.40 resistance, with price action stalling at the level after the latest push higher amid Bitcoin’s spike to above $81,000.
The Ripple-linked cryptocurrency could eye an upside extension. However, it also risks a pullback on potential profit-taking across the market.
A 23% increase in daily volume suggests that sellers are active, with bulls now in need of a decisive breakout to retain control.
Ripple CTO trimmed XRP holdings
Ripple’s Chief Technology Officer Emeritus, David Schwartz, has publicly admitted he holds little XRP, saying he has moved most of his assets away from crypto exposure.
He revealed this via X, noting he recognizes crypto offers “a once-in-a-generation” wealth opportunity. However, Schwartz says he is choosing peace of mind over the potential windfall that crypto promises.
In this case, he has decided to buy Ripple stock for exposure to the company’s fortunes without worrying about the massive volatility characterizing cryptocurrencies.
“I don’t have that much left anymore. I’ve tried to get most of my assets (other than Ripple stock) away from crypto exposure. As I’ve said, I really don’t like risk even though pretty much every risk I’ve taken has worked out amazingly well for me,” he noted.
XRP price outlook
The technical picture for XRP shows that the price continues to grind sideways, currently above the middle of the channel range formed since the February 2026 lows. Buyers have typically absorbed supply at $1.35 in recent weeks, with further support around $1.30.

Despite seller participation remaining steady, bulls could be positioning for a breakout above $1.50.
Meanwhile, the upsloping RSI at 52 on the daily chart supports this outlook. The daily RSI, sloping upward at 52, bolsters this view, indicating building momentum without overbought conditions.
External catalysts like the CLARITY Act, growing ETF inflows, and expanding regulated access further empower bulls.
Notably, Russia’s Moscow Exchange (MOEX) will launch four new crypto indexes next week.
Going live on May 13 are indexes for XRP, Solana (SOL), Tron (TRX), and Binance Coin (BNB). MOEX is looking to enhance institutional visibility and liquidity.
Innovation City, a Ras Al Khaimah-based free zone focused on artificial intelligence and Web3, has launched what it claims is the first blockchain-based digital business identity system.
According to a Monday release shared with Cointelegraph, every company registered in Innovation City receives a sovereign, cryptographically verifiable identity issued on OPN Chain, the public blockchain infrastructure developed by United Arab Emirates-based IOPn.
The release said this turns the business license from a static PDF or database entry into a dynamic onchain asset designed to reduce reliance on centralized intermediaries and cut verification uncertainty.
The move reflects a broader push in the UAE to replace traditional business registries with blockchain-based identity systems and AI-driven workflows, which proponents say could streamline verification and enable more seamless digital operations. By embedding onchain identity directly into company registration, Innovation City is testing a model that goes beyond most existing digital ID frameworks, but its impact will depend on whether external institutions adopt it.
How the onchain business IDs work
Jimi Ibrahim, co-founder and chief operating officer of IOPn, told Cointelegraph that at launch, the onchain identity framework is intended to extend across Innovation City’s existing client base of over 1,000 companies, with immediate live utility within the free zone’s own digital ecosystem.
He said the core value is not simply issuing a digital certificate, but giving each company a cryptographically verifiable business identity to use for access and verification across Innovation City touchpoints, such as the business center and selected ecosystem services, expanding to partners, such as technology, marketing and legal providers, over time.
Ibrahim described OPN Chain as a public network where validator participation is open to institutions, infrastructure partners and governance-approved node operators. He said the network uses a hybrid data model that keeps core transaction data and proofs onchain while handling sensitive or large datasets offchain.
He argued this setup differs from existing digital identity or verifiable credential schemes, such as Estonia’s e-residency program, because the onchain identity is established as the native business registration primitive for all companies in the free zone, rather than as an optional overlay on top of a conventional registry.
However, he did not name specific banks, regulators or exchanges that currently accept or verify these onchain identities, leaving questions about external integrations, dispute resolution, and how quickly credentials can be corrected or revoked once third parties are involved.
AI security and geopolitical risks
Recent exploits in which AI agents were socially engineered into authorizing crypto transfers from wallets they controlled have highlighted how autonomous systems can be manipulated, raising questions about the resilience of AI-driven workflows like these.
Ibrahim said that every agentic workflow built on these identities will require “human-in-the-loop authorization for consequential actions,” and that the agent layer is designed with adversarial scenarios as “a first principle, not an afterthought.”
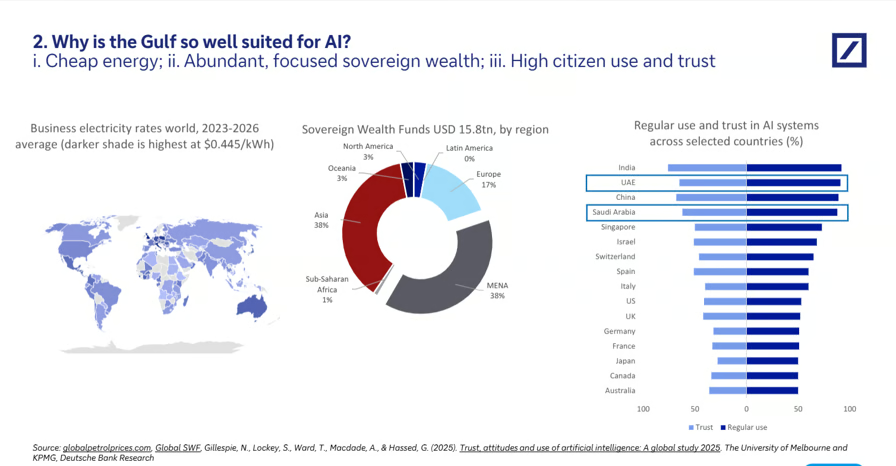
The launch also comes against the backdrop of regional conflict and fresh attacks involving the UAE on Monday. Recent eToro data cited by Cointelegraph found that UAE investors have been adding to positions in AI infrastructure, software and crypto-linked assets during the conflict rather than cutting exposure, despite the heightened volatility. An April 13 Deutsche Bank report said that the conflict is more likely to sharpen demand for AI rather than derail it.

Why is the Gulf so well-suited for AI? Source: Deutsche Bank
Ibrahim called the UAE one of the most “institutionally stable jurisdictions” and said that OPN Chain’s distributed validator network means no single regional event creates a failure point for the identity infrastructure these companies rely on.
Market Moves: Why is Ethereum Foundation selling? BTC futures warning signs
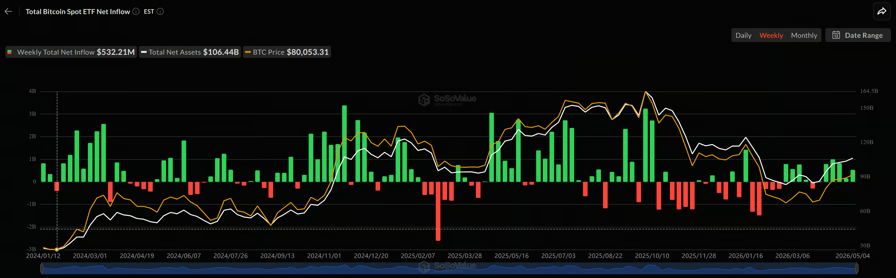
US spot Bitcoin ETFs recorded $532.21 million in net inflows on Monday as Bitcoin pushed back above the $80,000 mark amid improving risk sentiment following the ceasefire agreement between the US and Iran.
BlackRock’s iShares Bitcoin Trust (IBIT) led the pack with $335.49 million in daily inflows, followed by Fidelity’s Wise Origin Bitcoin Fund (FBTC) with $184.57 million, according to SoSoValue data. Morgan Stanley’s Bitcoin ETF (MSBT) was the only other fund to post positive flows on the day, adding $12.16 million. The remaining funds recorded no new inflows.
Monday’s inflows extended a three-day winning streak. On Friday, the funds pulled in $629.73 million, while Thursday saw a modest $14.76 million. The streak came after three consecutive days of outflows in which funds shed $490.63 million, the heaviest sustained redemption period in recent weeks.

Spot Bitcoin ETFs weekly inflows. Source: SoSoValue
The inflow surge comes as Bitcoin surges above $80,000 for the first time in more than three months. The leading cryptocurrency is currently trading at around $81,029, up 1.5% over the past day, according to data from CoinMarketCap.
Related: Bitcoin ETFs snap nine-day inflow run as BTC slips below $77K
Bitcoin reclaims $80,000 on post-ceasefire bounce
In a recent note, Bitunix analysts said that the surge comes as Bitcoin continues to extend “its post-ceasefire recovery in risk appetite.” According to the analyst, BTC reclaimed the key $80,000 psychological level after a concentrated short-side liquidity squeeze in the $79,500-$81,000 range, with the $77,000-$78,000 zone now acting as the primary support for leveraged longs.
However, the bigger picture is more complicated, the Bitunix analysts said, adding that macro and geopolitical forces are increasingly driving crypto price action. The US military’s launch of “Operation Freedom,” deploying 15,000 personnel to secure shipping lanes through the Strait of Hormuz, has rattled nerves, with Iran warning the move could violate the existing ceasefire framework.
At the same time, this week’s US Non-Farm Payrolls report and Federal Reserve commentary are expected to set the tone for risk assets broadly. If inflation expectations stay elevated, the Fed could hold rates higher for longer, squeezing crypto valuations. Softer data, on the other hand, could trigger a rotation back into tech and digital assets.
“Overall, BTC is no longer being driven solely by internal crypto-market sentiment, but has entered a phase jointly priced by ‘macro events + liquidity structure,’” the analyst said.
Related: Bitcoin ETFs Post Strong April Inflows as Ether Turns Positive
Spot Ether ETFs rebound
Spot Ether ETFs also saw $61.29 million in net inflows on Monday. This followed an even stronger session on Friday, which brought in about $101.18 million, helping push cumulative net inflows above $12 billion.
The new streak comes as late April saw notable outflows, including $87.73 million on April 29 and $75.94 million on April 23, alongside smaller negative days like April 28 and April 30.
Asia Express: North Korea denies crypto hacks, Upbit’s bank tests Ripple

The crypto market is in a buoyant mood after bitcoin broke out above $80,000 during the Asian morning Tuesday.
BTC currently trades at $80,690 having risen by more than 1% since midnight UTC. Ether (ETH), meanwhile, is at $2,370 after it failed to break April’s high of $2,460.
U.S equities are up in pre-market trading, with Nasdaq 100 futures and S&P 500 futures increasing by 0.5% and 0.3% respectively on Tuesday, spurred by investors buying the dip after jitters on Monday in relation to the Strait of Hormuz.
Precious metals gold and silver also ticked higher on Tuesday but remain significantly lower than the speculative blow off top in early March.
Derivatives positioning
- Futures tied to Cardano’s ADA are seeing record participation. Open interest (OI), the total number of active futures contracts, has surged more than 18% to 2.17 billion tokens, surpassing the previous peak from January.
- Despite this buildup, positioning in ADA does not appear excessively overheated. Perpetual funding rates are running at an annualized 9%, which signals bullish sentiment but not extreme leverage. Meanwhile, ADA has posted one of the highest cumulative volume deltas (CVD) over the past 24 hours among major tokens. It means that buyers are driving trading activity by placing more market orders than sellers, rather than using passive limit orders.
- TON is another standout. Open interest has jumped 40% to a record 200.2 million tokens. It also shows the strongest CVD among the top 30 cryptocurrencies, pointing to aggressive buying pressure. However, funding rates remain slightly negative, an unusual combination. This suggests a more nuanced positioning: traders may be buying TON in the spot market while simultaneously shorting futures to hedge, rather than outright speculative long positioning.
- There is one broader caution signal. Despite bitcoin’s breakout above $80,000, the OI-adjusted 24-hour CVD is negative for bitcoin and most major tokens, with the exception of ADA, TON and M. This indicates that the rally is not being strongly supported by aggressive derivatives buying, raising the risk that price gains could lack follow-through if spot demand weakens.
- Looking more closely at bitcoin, its open interest has risen about 3% to 785,000 BTC, approaching the recent record near 800,000 BTC. In contrast, derivatives activity in ether, XRP and solana has been relatively muted over the past 24 hours, suggesting a more selective market rather than a broad-based altcoin expansion.
- Volatility is also starting to stir. Bitcoin’s 30-day implied volatility index (BVIV) jumped 5% on Monday to move back above 40%, the sharpest one-day increase since mid-March. This rebound from multi-month lows is worth watching closely. A continued rise in implied volatility can signal growing demand for hedging or expectations of larger price swings, and in some cases may coincide with risk aversion and unwinding of recent gains. Ether’s equivalent measure (EVIV), however, has yet to show a similar pickup.
- In traditional markets, there are also early signs of hedging demand. Social media chatter points to large purchases of call options on the VIX — Wall Street’s “fear gauge,” which typically moves inversely to the S&P 500.
- Otions markets on Deribit show that risk reversals for both bitcoin and ether remain skewed toward puts across maturities. This means downside protection is still priced at a premium relative to upside exposure. Rather than outright bearishness, this likely reflects a shift in market structure: institutions are playing a larger role, and they tend to systematically hedge downside risk or generate yield by selling calls. The result is a market that is less euphoric, more hedged than in previous crypto cycles.
Token talk
- CoinDesk’s DeFi Select Index (DFX) is the best performing benchmark on Tuesday, rising by 2.7% since midnight UTC after ethena (ENA) and ONDO surged by 6.8% and 3.7% respectively.
- The CoinDesk 5 (CD5) is the worst performer, notching a 0.5% gain as investors appear to be rotating into more speculative bets as opposed to crypto majors.
- CoinMarketCap’s altcoin season indicator is at 41/100 showing neutral but warming sentiment towards the sector following a multi-month downtrend.
- Toncoin (TON) is the top performing altcoin among the CoinDesk 100 (CD100), rallying by 8.1% since midnight UTC and 28% over the past 24 hours following an announcement from Telegram CEO Pavel Durov, who said that Telegram will replace the Ton Foundation as the driving force behind the network.

Key Highlights
-
ASST experiences pre-market gains following Strive’s addition of 444 BTC to corporate reserves.
-
Company’s Bitcoin reserves exceed 15,000 BTC milestone after $33.9M acquisition.
-
Average acquisition price reaches $76,307 per Bitcoin in recent treasury transaction.
-
Company announces 18.7% year-to-date BTC Yield amid ongoing treasury expansion.
-
SATA preferred stock issuance reinforces Bitcoin-centered capital allocation framework.
Shares of Strive Asset Management (ASST) experienced upward movement in pre-market hours following the company’s announcement of Bitcoin treasury expansion beyond the 15,000 BTC threshold. Trading at $16.54 during pre-market sessions, ASST registered a 1.13% increase from its previous closing price of $16.36. This acquisition reinforces Strive’s commitment to its Bitcoin-centered capital allocation approach.
Company Acquires 444 Bitcoin in Recent Treasury Expansion
Strive completed a purchase of 444 Bitcoin valued at approximately $33.9 million, based on recent SEC documentation. The transaction averaged $76,307 per Bitcoin. As a result, the firm’s aggregate Bitcoin reserves have crossed the 15,000 BTC threshold.
This acquisition comes on the heels of a significant April 24 disclosure, when Strive reported holdings of 14,557 BTC following a 789 Bitcoin purchase at $77,890 each. The recent transaction marks a continuation of the company’s sustained accumulation pattern over several months.
Strive now maintains one of the most substantial publicly held corporate Bitcoin treasuries. The estimated market value of its Bitcoin position approaches $1.2 billion, positioning the company among enterprises utilizing Bitcoin as a fundamental balance sheet component.
ASST Shares Advance Following Treasury Announcement
Following the Bitcoin treasury disclosure, ASST stock demonstrated positive momentum. Pre-market trading showed a 1.13% uptick after marginal gains in the prior session. The market response indicates heightened investor focus on Strive’s capital framework.
Current disclosures reveal 15,000 Bitcoin in reserves alongside a quarter-to-date BTC yield of 4.3%. The firm’s year-to-date BTC yield stands at 18.7%. SATA issuance for April 2026 totaled 584,730 shares, representing a 43% amplification ratio.
Management has centered its approach on Bitcoin per share metrics, which serve as the foundation for capital deployment and treasury development. Consequently, the company continues aligning balance sheet growth with Bitcoin acquisition and structured financing mechanisms.
Preferred Stock Instrument Reinforces Bitcoin Treasury Framework
Strive’s regulatory filings revealed $97.9 million in cash and cash equivalents. Additionally, the company disclosed a $50.4 million allocation in Variable Rate Series A Perpetual Stretch Preferred Stock, connecting Strive to Strategy-linked preferred equity instruments.
In January 2026, Strive completed a $225 million preferred stock raise that was significantly oversubscribed, with demand surpassing $600 million. The instrument offered an approximately 13% annualized yield. Furthermore, company statements indicated the product maintained its peg throughout a significant Bitcoin price correction.
The company bolstered its Bitcoin position through the January 2026 acquisition of Semler Scientific, which elevated Strive’s reported holdings to 12,798 BTC at that time. Subsequently, the firm has accumulated over 2,200 additional BTC, substantially enhancing its corporate treasury footprint.

Ripple CTO Emeritus David Schwartz said on May 5, 2026, that his remaining crypto exposure is now almost fully tied to XRP and Ripple equity.
Summary
- David Schwartz said he has virtually no crypto exposure left beyond XRP and Ripple equity.
- Schwartz said his XRP-heavy position was not fully planned, despite his long role at Ripple.
- He also said diversification can be rational when investors cannot clearly identify future winners.
His comment came during a fresh online discussion about investment choices and XRP loyalty. Schwartz wrote: “Yeah, that’s true now. I have virtually no crypto exposure left except XRP and Ripple.” He also said the position was not fully planned, adding: “I’m not sure I really planned it that way, though.”
Despite his concentrated exposure, Schwartz did not present XRP-only investing as a general rule. He said diversification can make sense when an investor believes a sector may grow but cannot yet identify the clear winners.
“I think it’s rational to spread investment throughout a space if you think that space is likely to be successful in the future and don’t believe that you can personally pick the winners and the losers yet,” He wrote.
His comments place his personal portfolio apart from his broader market view. Schwartz said he now holds little crypto outside XRP, but his explanation showed that he still sees a case for spreading risk across a sector.
Recent XRP debates add context
The comment followed several recent debates involving Schwartz, XRP expectations and older public posts. As noted in our May 3 coverage, Schwartz denied claims that a gag order or non-disclosure agreement controls his comments about Ripple or XRP. He said no NDA forces him to mislead the XRP community.
Moreover, Schwartz also questioned extreme XRP price forecasts. He argued that if wealthy investors saw even a small chance of XRP reaching $10,000, they would likely push the price much higher today.
As outlined in our May 1 article, Schwartz said old XRP comments about liquidity were not a promise of future price levels. He said the debate was about market depth and transaction size, not a guaranteed target.
Old comments remain in focus
In our April 27 update, we covered Schwartz’s response to claims that he misled XRP holders with a 2017 discussion about XRP price and liquidity. He said the post explained how liquidity works when large transfers move through a market.
As highlighted in our April 24 article, Schwartz also rejected claims that XRP has hidden government or central bank deals. He said Ripple’s non-disclosure agreements relate to normal business activity, not secret XRP adoption plans.
At press time, Ripple’s native token (XRP) traded at around $1.4, up slightly in the past 24 hours and over 1% in the past 7 days (per crypto.news data)


Tuesday’s Workwear Report: Fei Tie-Front Organic Cotton Dress

Axolotl Infinite Money Glitch?!
Four Cambs Post Office branches targeted by thieves over bank holiday weekend
Manchester United reach agreement with Casemiro over contract clause amid transfer speculation

US brings back mandatory military draft registration

Steven Gerrard disagrees with Gary Neville over ‘shock’ Chelsea and Arsenal claim | Football


-

 Business7 days ago
Most Commercial Energy Audits Miss the Real Losses
-

 Fashion7 days ago
Kylie Jenner’s KHY Enters a New Era with ‘Born in LA’
-

 NewsBeat2 days ago
Channel 5 – All Creatures Great and Small series 7 new post
-
 Tech4 days ago
Trump’s 25% EU auto tariff breaches Turnberry Agreement that also covers semiconductors and digital trade
-
 Sports4 days ago
Paul Scholes issues Marcus Rashford reality check as agreement emerges over Man United star
-

 Crypto World7 days ago
CFTC’s AI will review U.S. crypto registration applications, chairman tells CoinDesk
-

 Business6 days ago
Barclay Brothers Avoid Bankruptcy: HSBC Drops High Court Petitions After IVA Deal
-
 Business6 days ago
Tesla Officially Registers Elon Musk’s Stock: What Investors Need to Know
-

 Tech7 days ago
Get Ready for More Brain-Scanning Consumer Gadgets
-

 Business5 days ago
Two Powerball Tickets Split $143 Million Jackpot in Indiana and Kansas
-

 Tech6 days ago
Texas Instruments made a new flagship graphing calculator: the TI-84 Evo
-
 Crypto World5 days ago
CoreWeave (CRWV) Stock Climbs 8% Despite $45M Insider Share Dump
-
Business2 days ago
Winning Numbers Drawn as Jackpot Resets to $20 Million
-
Crypto World6 days ago
Securitize and Computershare Enable Tokenized Equity Issuance for Over 25,000 U.S.-Listed Stocks
-

 Crypto World6 days ago
Gibraltar Proposes Tokenized Funds Regulation to Bolster Compliance
-

 Entertainment5 days ago
Celebrities Who Are Attending the 2026 Met Gala Event
-

 Business6 days ago
Alexandria Real Estate Equities, Inc. (ARE) Q1 2026 Earnings Call Transcript
-

 Fashion3 days ago
Mary J. Blige Vegas Residency Looks: Crystal-Embellished Fjolla Haxhismajli, Todd Fisher, and More!
-

 Tech5 days ago
Official SAP npm packages compromised to steal credentials
-

 Sports6 days ago
Antrim GAA: Hurlers cancel training as row with board deepens
You must be logged in to post a comment Login