
Crypto World
Big Demand Zone Below $2K Signals ETH’s Next Move
Ether faced resistance to hold above $2,000 on Tuesday as market sentiment cooled, and a 31% drop in 2026 has drawn comparisons to price fractals seen in prior bull markets. The slide to roughly $1,736 underscored a broader consolidation, with traders weighing the risk of further draws versus the potential of a patient, bottoming process. On-chain watchers have repeatedly highlighted a defined demand zone spanning approximately $1,300 to $2,000, a band that could attract buyers if price action continues to meander lower. The narrative here centers on whether Ether can form a durable base or slip into a protracted period of range-bound trading that delays a meaningful breakout. For context, market participants continue to monitor liquidity flows, derivative risk, and evolving network fundamentals that often foreshadow macro moves.
Key takeaways
-
ETH’s drop to about $1,736 may mark the initial low in a broader consolidation phase rather than a final bottom.
-
On-chain cost-basis data clusters between $1,300 and $2,000, reinforcing this range as a potential demand zone.
-
A fractal comparison of the 2021–2022 cycle with 2024–2025 suggests a pattern where an early bottom is followed by retests to lower levels before a durable base forms.
-
UTXO Realized Price Distribution (URPD) points to meaningful overhead resistance near $2,822 and $3,119, concentrations that could cap rallies unless substantial demand emerges below current levels.
-
Derivatives data show concentrated long-liquidation risk around $1,455 from $1,700, while more than $12 billion in short liquidity sits up to $3,000, implying a potential shift in momentum once downside liquidity is absorbed.
Tickers mentioned: $ETH
Sentiment: Neutral
Price impact: Neutral. Near-term risk remains balanced by base-building signals and a defined demand zone.
Market context: The broader crypto backdrop continues to digest on-chain signals alongside macro risks. Ethereum withdrawals from exchanges have spiked to the highest levels since October 2025, with net outflows exceeding 220,000 ETH, and Binance alone recording roughly 158,000 ETH in daily net outflows—the largest since August 2025. These flows coincided with ETH trading in a $1,800–$2,000 range, suggesting a combination of accumulation and risk-off repositioning. Meanwhile, stablecoin activity on Ethereum has risen markedly, with stablecoin transaction volume up about 200% over the past 18 months even as the price has lagged. This divergence can foreshadow a re-rating if network fundamentals and liquidity conditions align with price action.
Why it matters
The unfolding pattern matters because it frames Ether’s potential trajectory in the context of a longer base-building phase rather than a quick recovery. If the fractal framework holds, the asset could spend more time coiling within a defined band, testing lower supports before a durable upside breakout emerges. This matters for traders and risk managers who must gauge how much exposure to maintain during a broad consolidation while tracking evolving on-chain activity and derivatives signals that historically precede major moves.
From a broader market perspective, the interaction between on-chain demand zones and subtle shifts in exchange flows could signal how liquidity is reallocated as institutions and retail participants reassess risk. The observed uptick in stablecoin settlements and the outflows from centralized venues imply a transfer of risk away from exchanges in favor of self-custody and potentially longer-duration holding patterns. If this trend persists, it could set the stage for a renewed bid when price action tests critical levels in the $1,500s or higher.
Additionally, the ongoing dialogue around whether Ether is capitulating or merely consolidating highlights the nuanced nature of market cycles. The fractal approach, which aligns current action with prior periods of broad basing, suggests that patience and disciplined risk management may be more prudent than chasing short-term rallies during uncertain liquidity regimes. Independent observers are watching for confirmations from on-chain metrics and derivatives markets that could either reinforce a gradual re-rating or expose the market to sharper, faster moves once liquidity conditions flip.
What to watch next
-
Price tests of the $1,500–$1,600 zone and whether buyers re-emerge at the lower end of the demand band.
-
Verification of key URPD levels around $1,237 and $1,881 as potential cycle floors and pockets of demand if price retraces further.
-
Monitoring long versus short liquidity dynamics, including long-liquidation risks around $1,455 from the $1,700 area and substantial short liquidity up to $3,000, which could shape the slope of any ensuing rally.
-
Trends in exchange withdrawals and stablecoin turnover on Ethereum, which may presage shifts in market participation and risk tolerance.
-
Derivative market signals, including any evolving bias after absorption of near-term liquidity pressures, to gauge whether the market transitions from distribution to accumulation.
Sources & verification
- Ether UTXO Realized Price Distribution (URPD) data and interpretations from Glassnode.
- Rising Ethereum withdrawals from exchanges and related net flows, with Binance’s outflows highlighted as a notable datapoint from CryptoQuant.
- Derivatives risk indicators, including the Cuingood-style liquidation heat map from Coinglass, detailing long-liquidation risk levels and short liquidity concentrations to $3,000.
- Weekly chart framing and fractal comparisons published with reference to ETHUSDT data on TradingView (Cointelegraph/TradingView).
- Ethereum Foundation SEAL collaboration articles on wallet security and related efforts to curb drainers.
Ether fractal signals an extended base-building phase
Ether (CRYPTO: ETH) has again drawn analysts to a familiar price-action pattern where a pronounced dip is followed by a prolonged period of range-bound activity rather than an immediate leg higher. On the weekly chart, a move toward the $1,730 area resembles a “first low” rather than a definitive market floor, echoing structures seen during the 2021–2022 period when ETH spent roughly a year consolidating near a first low of approximately $1,730 and a broader support band around $885. These historical touchpoints, when viewed through a fractal lens, suggest the current cycle may unfold similarly: a first phase of downside risk that yields to a more extended base-building phase before demand returns with greater resilience. The weekly framing in this narrative is anchored by the ETHUSDT pair on TradingView, which has provided the visual reference for these comparisons. The fractal interpretation is not a guarantee, but it offers a framework for interpreting the sequence of on-chain activity and price movements against the backdrop of a market still digesting liquidity and macro cues.
In the near term, the market’s focus shifts to whether Ether can sustain a bid above the immediate support around $1,500–$1,600 or if price testing compounds the pressure toward the $1,237 level, a region that previous analyses identify as a potential cycle floor. The on-chain support is reinforced by URPD observations, which show substantial realized price concentration at higher levels, underscoring a stubborn overhead that could keep rallies in check unless fresh demand emerges. At the same time, the index of supply concentration at $2,822 and $3,119 constitutes a ceiling that traders must clear to generate meaningful upside momentum. These resistance pillars remind investors that any attempt to re-rate Ether will require a combination of technical durability and sustained capital inflows.
Meanwhile, market participants should monitor the interplay between on-chain signals and derivatives dynamics. The heat map of long liquidations suggests a risk horizon near $1,455 when price drifts from $1,700, while a large pool of short liquidity up to $3,000 implies a potential upside framework once sellers exhaust liquidity pressure. The balance between these forces—realized price levels, withdrawal trends, and the evolving derivative landscape—will shape whether Ether can complete a longer, steadier base or remains vulnerable to periodic risk-off episodes that push the price toward the lower bound of the current range.
As observers parse these signals, one constant remains: the market’s attention to demand zones and supply barriers. The convergence of on-chain data with macro risk sentiment can either reinforce a patient, base-building narrative or catalyze a more decisive move if new catalysts emerge. The evolving ecosystem continues to attract attention from developers and investors who watch for signs of renewed network activity, institutional participation, and regulatory clarity that could shift the risk calculus in Ether’s favor.

Crypto World
Fed Governor Miran still backs cuts, says interest rates could be ‘about a point’ lower this year

Federal Reserve Governor Stephen Miran on Monday continued his campaign for lower interest rates, telling CNBC that policymakers should disregard the current energy price spike unless there are signs it will have longer-lasting impacts.
“If I saw a wage-price spiral, or I saw evidence that inflation expectations are starting to pick up, then I would get worried about it,” he said during a “Squawk on the Street” interview. “There’s no evidence of it thus far, and you can move the monetary policy rate all you want — today tomorrow — but it’s not going to affect inflation the next couple of months.”
Citing market-based indicators, Miran said inflation expectations remain well anchored, despite the jump in oil to more than $100 a barrel and a price shock at the pump that has pushed gasoline higher by more than $1 a gallon.

Monetary policy works with a lag and isn’t geared toward short-term market gyrations, he added.
Miran has dissented at each of the meetings he has attended since September 2025. He told CNBC that he continues to think “we could be about a point easier, gradually done over the course of a year.”
The fed funds rate is currently targeted in a range between 3.5%-3.75%. Market pricing is implying no moves in either direction before the end of the year.
Miran’s term has expired, but he continues to serve as the nomination of former Federal Reserve Governor Kevin Warsh is held up in the Senate Banking Committee. If confirmed, Warsh will take over as chair for Jerome Powell when the latter’s term expires in May.

A new generation of investors is drawing crypto deeper into mainstream portfolios, even as it grapples with the asset class’s well-known volatility. Gen Z’s appetite for risk and its digital-native approach to money are shaping both the demand for cryptocurrencies and the conversation around how to manage that risk within a diversified portfolio. Findings from survey data and market commentary point to a multi-faceted dynamic: strong interest in crypto, tempered by an awareness of risk and a heavy influence from social platforms and online narratives.
According to Betterment’s 2025 Retail Survey, 64% of Gen Z and 49% of millennials say they are willing to take on more investment risk. This willingness to push the envelope aligns with a broader tilt toward crypto among younger cohorts. Separately, YouGov’s 2025 US Investment Trends report highlights that nearly two-thirds of Gen Z plan to invest in cryptocurrencies like Bitcoin this year, underscoring crypto’s rising status as a core consideration for younger investors. The combination of greater risk tolerance and a crypto-forward mindset suggests a structural shift in how Gen Z approaches wealth-building, beyond mere speculation.
That said, the Gen Z approach is not blind to risk. Crypto volatility remains a central concern for many, and the generation is keenly aware that price swings occur around the clock. Investopedia notes that while crypto is widely recognized as risky and volatile, many Gen Z investors continue to participate, viewing volatility as part of an entry price rather than a barrier to participation. In other words, recognition of risk does not appear to suppress the impulse to participate; it may even be embedded in the way they frame potential returns.
Key takeaways
- 64% of Gen Z and 49% of millennials are willing to take on more investment risk, according to Betterment’s 2025 Retail Survey.
- YouGov’s 2025 US Investment Trends report finds that nearly two-thirds of Gen Z intend to invest in cryptocurrencies this year.
- 84% of Gen Z acknowledge that cryptocurrencies are risky and volatile, yet they continue to invest, signaling a structural willingness to tolerate risk for potentially outsized gains.
- Financial FOMO drives behavior: about 70% of Gen Z report feeling financial FOMO while scrolling social media, and roughly half have made an investment influenced by that feeling, often in crypto or memecoins.
- For many young investors, crypto remains a digital-native asset class with appeal tied to high-growth narratives, but concerns about transparency and regulation persist as the market evolves.
Gen Z’s risk calculus in a digital era
Crypto’s appeal to Gen Z appears inseparable from the broader online ecosystem that shapes their financial world. Gen Z has grown up with the internet, digital wallets, and instant access to markets, which makes digital assets feel native rather than futuristic. The survey data illustrate a generation that is comfortable testing new assets, even as it calibrates its risk exposure to reflect a volatile, 24/7 market environment. The correlation between online influence and investment behavior becomes especially salient when considering how financial guidance is consumed. A notable share of younger investors turns to social platforms for insights, which elevates the importance of evaluating the quality and accountability of information accessed through these channels.
One dimension often cited in this context is how young investors source financial advice. Kiplinger’s coverage notes that about one in four Gen Z Americans obtain financial guidance from TikTok, a statistic that signals the growing role of “finfluencers” in shaping investment decisions. That dynamic, combined with the rapid dissemination of memes and viral narratives, helps explain why certain crypto stories gain outsized attention—even when the underlying fundamentals are murkier than traditional investment vehicles. In this environment, investors must balance curiosity with due diligence and a clear understanding of risk rewards.
Volatility, FOMO and the memecoin cycle
Volatility remains the price of admission for crypto, and Gen Z is not naïve about it. The generation’s understanding of risk reflects a paradox: while they recognize the inherent instability of digital assets, they are drawn by the prospect of outsized profits in a relatively new asset class. The tension between risk awareness and aspirational returns is compounded by social dynamics. Empower’s research on financial FOMO shows that 70% of Gen Z feel this pressure while scrolling social media, and a CFA Institute study cited in the broader discussion indicates that about 50% of Gen Z investors say they have made an investment driven by FOMO, often in crypto or memecoins. In other words, fear of missing out is translating into real capital allocation decisions, particularly toward assets that can deliver rapid visibility and engagement on social platforms.
The memecoin phenomenon sits at the intersection of virality, community hype, and speculative appetite. These tokens are designed to capture attention and momentum, delivering quick, event-driven price action that can attract new participants while amplifying the narrative around crypto’s potential. While this dynamic can drive activity and liquidity, it also raises questions about sustainability, risk management, and the long-term viability of such assets in a diversified portfolio. The cycle—rapid gains followed by swift corrections—has repeatedly underscored the risks associated with chasing headlines rather than fundamentals. As a result, even as crypto admissions rise among younger cohorts, memecoins can reinforce a broader skepticism about the safety and reliability of digital assets as a standalone investment thesis.
Beyond the hype, the behavioral profile of Gen Z investors highlights a broader diversification conversation. Some observers point to crypto as a potential portfolio diversifier, particularly as parts of the traditional market landscape exhibit different risk and return drivers. Yet the same conversations underscore real caveats: during periods of systemic stress, crypto has shown correlations with high-growth equities and even, at times, with traditional safe-haven narratives like gold. That raises practical questions for portfolio construction: if crypto participates in downside markets or moves in tandem with riskier equities, its diversification benefits may be more nuanced than initially assumed. For any investor, understanding when crypto serves as a genuine diversifier versus when it behaves as a high-beta, risk-on asset is essential to avoid overexposure or misaligned expectations.
Another critical theme is the lack of universal transparency and a clear regulatory framework across crypto markets. As a technology- and asset-class experiment in real-time, digital assets have not always benefited from the disclosures and governance that accompany traditional securities. MDPI’s analysis of cognitive biases, including the Dunning-Kruger effect, suggests that younger investors may overestimate their understanding of crypto and underestimate the risks, underscoring the need for robust education and clear regulatory guardrails. In the absence of consistent reporting standards and enforcement, the allure of quick profits can eclipse prudent risk assessment, increasing the likelihood of regrettable losses for inexperienced participants.
Regulation, transparency and the road ahead
While Gen Z’s crypto engagement signals a maturation of digital assets within the retail space, observers agree that regulatory clarity and improved transparency are critical for sustaining long-term participation. The tension between a rapidly evolving technology stack and the slower, more deliberate pace of policy development creates a dynamic where innovation can outpace guardrails, at least in the near term. As policymakers and industry participants negotiate better disclosure, custody standards, and product-level protections, the trajectory of Gen Z’s crypto involvement will hinge on how effectively those guardrails translate into real-world investor protections without stifling innovation.
Some researchers and market observers frame this moment as a test of crypto’s legitimacy as an investable asset class for a new generation. If regulators deliver calibrated, investor-centric rules and platforms improve transparency, crypto could expand from being a niche interest to a more mainstream, risk-aware component of diversified portfolios. Conversely, persistent gaps in transparency or regulatory uncertainty could amplify the very volatility and hype-driven dynamics that have driven memecoin cycles, potentially eroding trust among young buyers who expect clarity and accountability from market participants.
Related coverage in the broader crypto media ecosystem has noted regulators’ concerns about finfluencers and the need for responsible information dissemination, particularly as Gen Z ownership grows. For readers tracking the evolution of this space, pay attention to shifts in regulatory posture, custody and exchange standards, and how platforms adapt to the dual pressures of innovation and investor protection. As the market evolves, the balance between opportunity and risk will likely redefine crypto’s role in Gen Z portfolios.
Investors should watch how education, transparency, and policy alignment impact Generation Z’s crypto participation. The coming months may reveal whether this generation’s early-adopter behavior becomes a durable, risk-aware investment habit or whether volatility and information gaps pull the brakes on broader adoption.
Alex Tsepaev, chief strategy officer at B2PRIME Group, offers this perspective: crypto’s journey into mainstream investing is less about a single narrative of boom-and-bust and more about how a new generation learns to navigate risk, trust, and accountability in a rapidly changing financial landscape.
This opinion piece reflects the author’s view and is not an endorsement of any specific asset. Readers should conduct their own research and consider regulatory developments, platform protections, and risk management practices before making investment decisions.


Cameron and Tyler Winklevoss lent their own crypto exchange, Gemini, thousands of bitcoin (BTC) and ether (ETH) through Winklevoss Capital Fund (WCF), their private investment company. Gemini then pledged that crypto as collateral with Galaxy Digital and NYDIG to raise dollar loans.
When the exchange went public in September 2025 at $28 per share, it converted $695.6 million of WCF debt into super-voting Class B stock at a 20% discount, giving the twins 94.7% of Gemini’s voting power.
Gemini’s 10-K, filed yesterday, spelled out the entire structure. Social media users have called it a circular scheme.
The Winklevoss Capital Fund lending carousel
Here’s the basic tale of how the money flowed. The Winklevii’s WCF lent BTC and ETH to Gemini through open-term agreements, i.e. with no fixed maturity.
Gemini then posted that borrowed crypto as collateral with third-party lenders. Galaxy Digital extended $116.5 million in loans at 11-12% interest rates, collateralized at 145-155%. NYDIG provided $75 million through a repurchase agreement at 8.5%.
Gemini used the dollars for operations and regulatory capital requirements.
When the IPO closed on September 15, 2025, the exchange repaid Galaxy’s $116.5 million from $456 million in net proceeds from the IPO.
Gemini now trades on the Nasdaq under symbol GEMI.
The exchange also repaid $238.5 million under a warehouse credit facility with Ripple, though $154 million remained outstanding to Ripple at year end.
The twins’ own debt didn’t get cash repayment, however.
Gemini converted $200 million in WCF convertible notes and $475 million in WCF term loans, plus accrued interest, into 31.1 million supervoting Class B shares at $22.40 apiece.
That conversion price was 20% below what retail investors paid for otherwise equivalent Class A shares on the same day.
Class A and B stock differ only in their voting power and ownership distribution. Otherwise, they have the same par value, rights to dividends, and liquidation preference.
Class B shares are convertible into Class A on a one‑for‑one basis.
Retail paid $28 with the Winklevii at $22.40
The discount is where the circularity inflicted pain on regular shareholders.
WCF lent Gemini crypto. Gemini then pledged the crypto that it had borrowed to get even more loans. Specifically, Galaxy and NYDIG lent Gemini dollars which it used to operate.
Gemini then handed WCF equity at a discount funded by the same IPO that brought retail in 20% higher.
Read more: Sources say Winklevoss twins withdrew $280M from Genesis before it collapsed
The SEC Form 10-K confirms that Gemini still owed WCF 4,619 BTC as of December 31, 2025. That balance was worth roughly $400 million.
Gemini paid WCF $24.2 million in loan fees in 2025.
In summary, Gemini is simultaneously debtor, custodian, and a “controlled company” according to Nasdaq corporate governance standards.
Despite being publicly traded, Gemini’s co-founders still control a majority of its voting power.
Moreover, WCF holds roughly 8,757 BTC in Gemini Custody addresses, according to Arkham Intelligence data cited by crypto researcher Emmett Gallic.
Deloitte signed off clean
Deloitte has issued clean audit reports on Gemini. This is despite the reality that WCF could demand repayment of its 4,619 BTC loan at any time.
The twins could destabilize the exchange they control with a single written notice.
Gemini’s public stock now trades 88% below its IPO price. “Gemini Space Station,” its legal and rocket-based name that it certainly has not lived up to, opened at $37.01 per share on its IPO day.
It’s worth $4.42 today.
Gemini priced its IPO at $28 on September 11, 2025. It opened at $37.01 the next day and hit $45.89 before beginning a relentless decline. The stock closed at $4.42 on March 31, 2026, down 88% from the opening price, after touching a 52-week low of $3.91 this Monday.
The company’s market cap has collapsed from over $3.8 billion to roughly $520 million. Citigroup, Cantor, Truist, and Evercore downgraded the stock to a Sell rating.
A class action lawsuit alleges the company misled investors about its strategy.
Got a tip? Send us an email securely via Protos Leaks. For more informed news, follow us on X, Bluesky, and Google News, or subscribe to our YouTube channel.

EUR/USD is recovering losses from 1.1450. USD/JPY is correcting gains from 160.50 and might decline further below 158.00.
Important Takeaways for EUR/USD and USD/JPY Analysis Today
· The Euro struggled to stay in a positive zone and declined below 1.1600 before finding support.
· There is a key bearish trend line forming with resistance at 1.1575 on the hourly chart of EUR/USD at FXOpen.
· USD/JPY rallied significantly before the bears appeared near 160.45.
· There is a major bearish trend line forming with resistance near 159.20 on the hourly chart at FXOpen.
EUR/USD Technical Analysis
On the hourly chart of EUR/USD at FXOpen, the pair started a fresh decline from 1.1640. The Euro declined below 1.1600 and 1.1520 against the US Dollar.
The pair even declined below 1.1500 and the 50-hour simple moving average. Finally, it tested the 1.1445 zone. A low was formed at 1.1443, and the pair is now recovering losses. There was a move above 1.1500 and the 50-hour simple moving average.
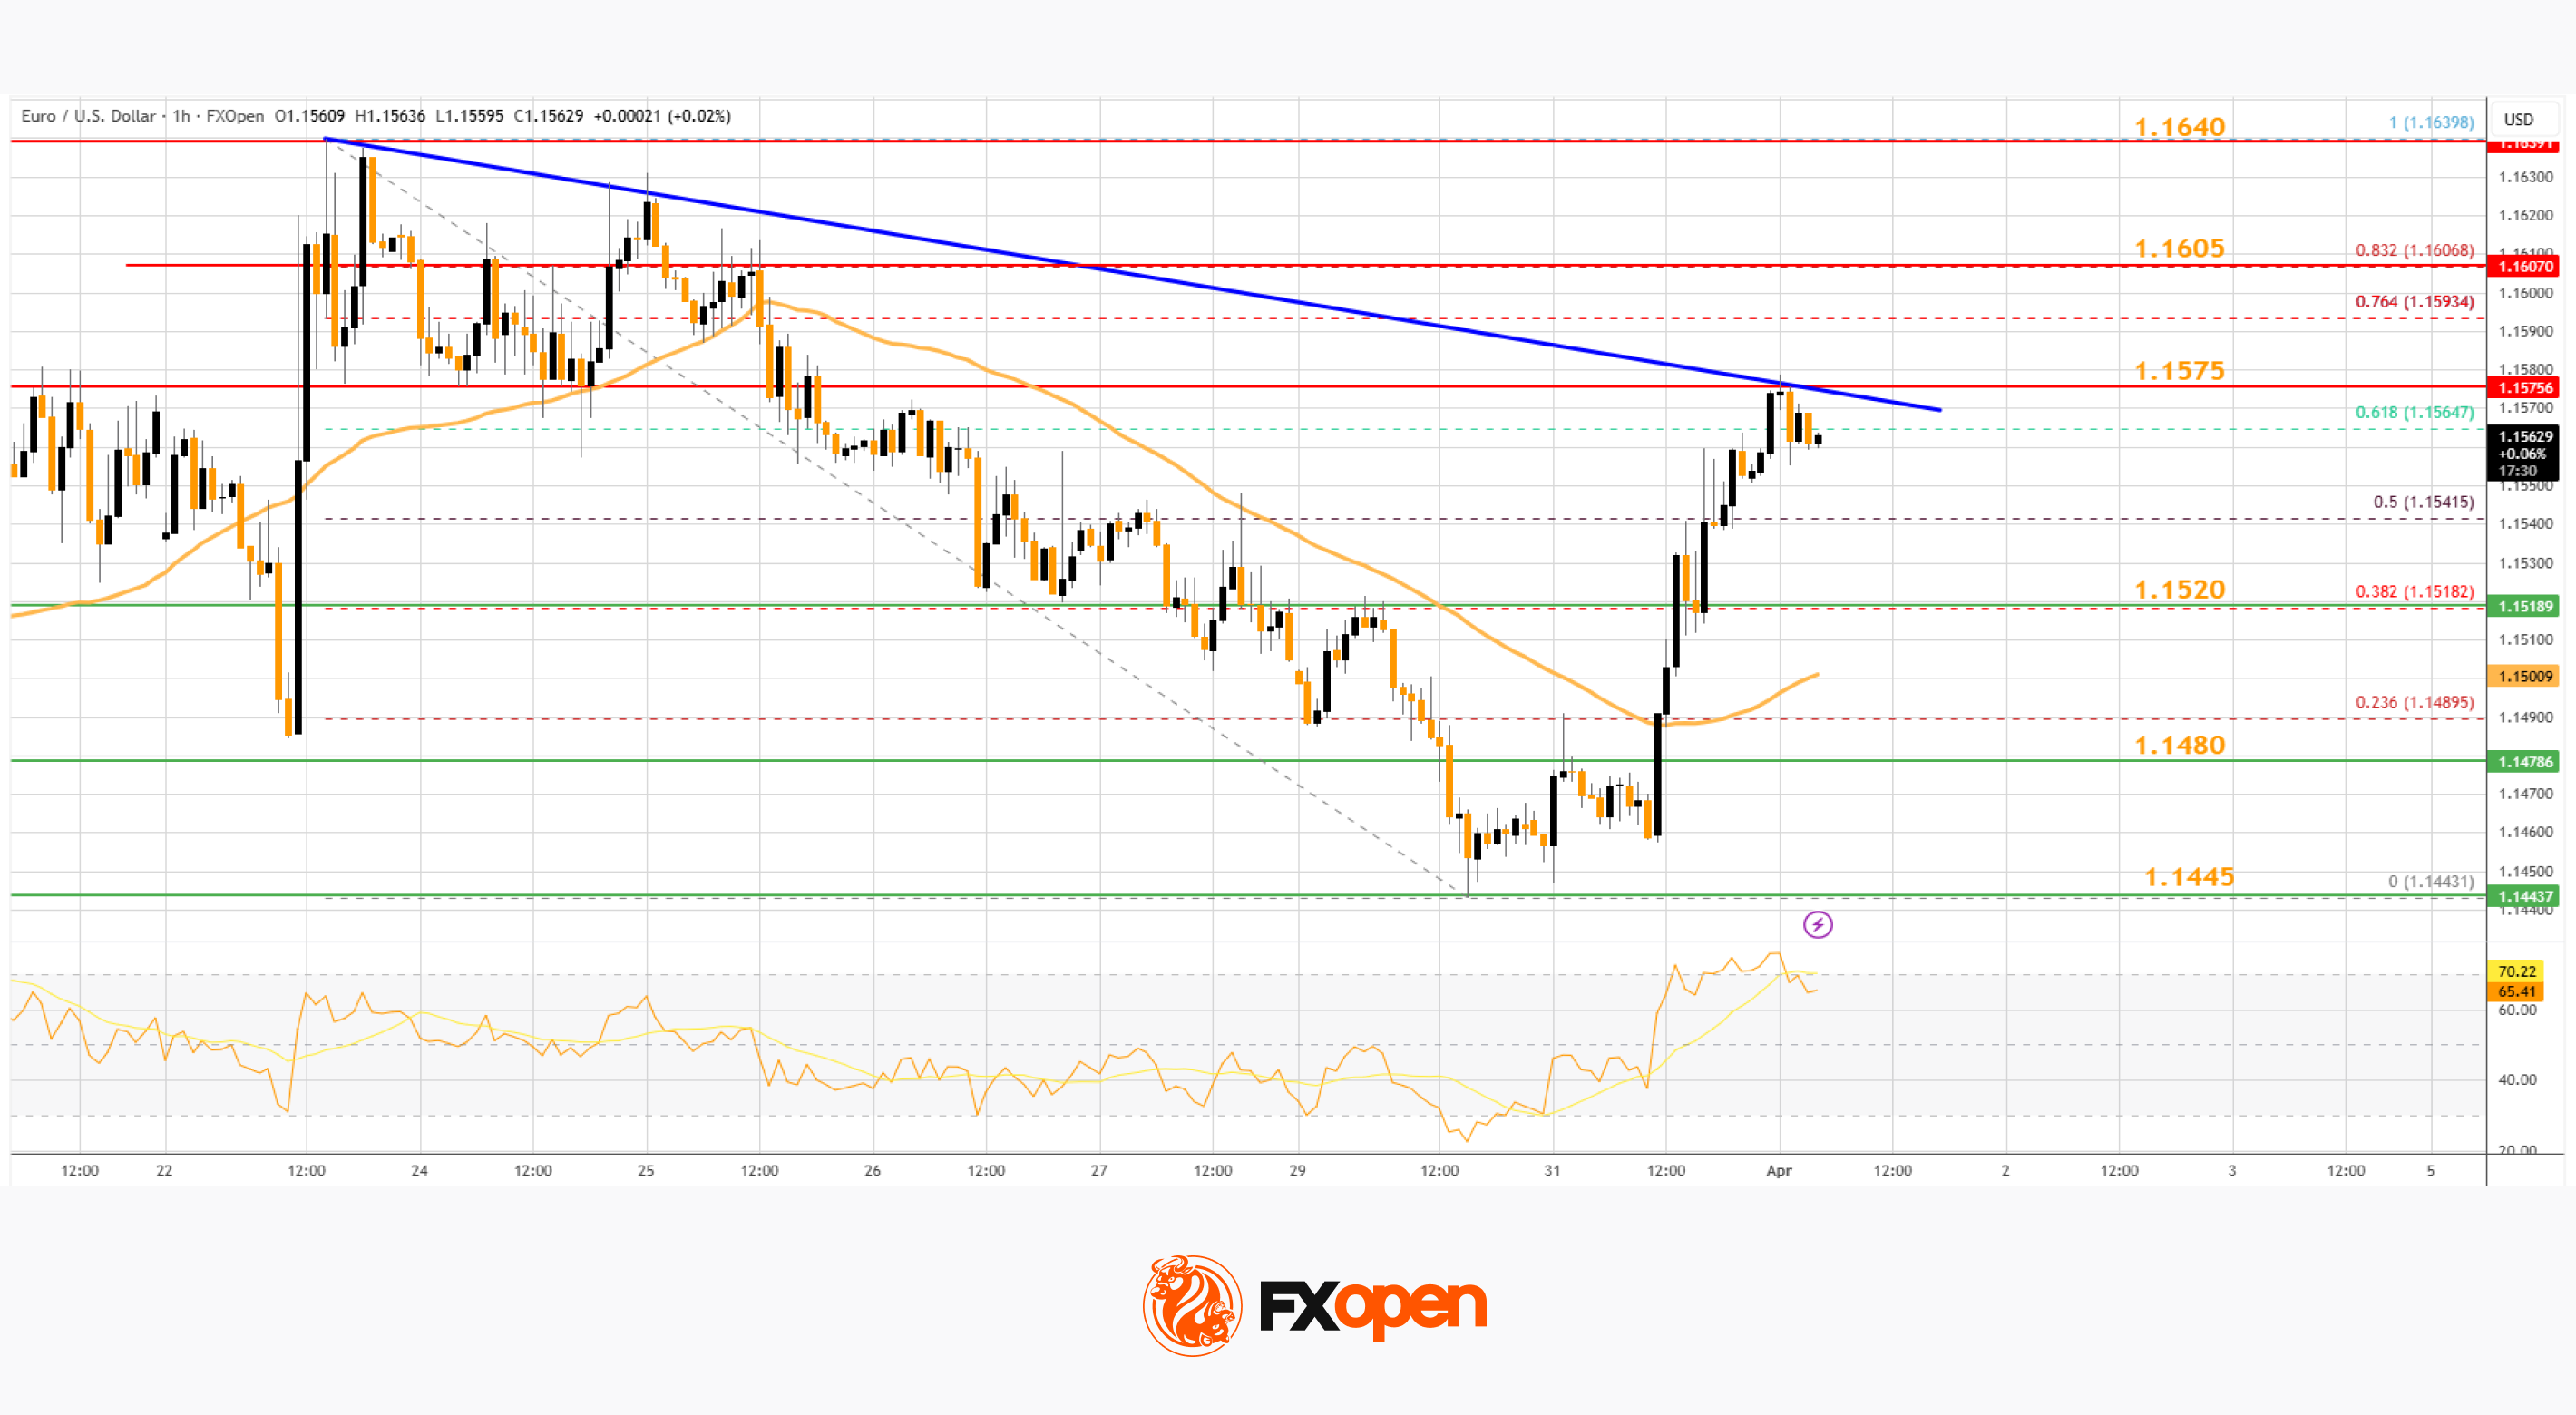
The pair surpassed the 50% Fib retracement level of the downward move from the 1.1639 swing high to the 1.1443 low. On the upside, the pair is now facing resistance near the 61.8% Fib retracement and 1.1575. There is also a key bearish trend line forming with resistance at 1.1575.
The first major hurdle for the bulls could be 1.1605. An upside break above 1.1605 could set the pace for another increase. In the stated case, the pair might rise toward 1.1640.
If not, the pair might drop again. Immediate support is near 1.1520. The next key area of interest might be 1.1480 or the 50-hour simple moving average. If there is a downside break below 1.1480, the pair could drop toward 1.1445. The main target for the bears on the EUR/USD chart could be 1.1400, below which the pair could start a major decline.
USD/JPY Technical Analysis
On the hourly chart of USD/JPY at FXOpen, the pair started a steady decline from well above the 160.00 zone. The US Dollar gained bearish momentum below 159.50 against the Japanese Yen.
The pair even settled below 159.00 and the 50-hour simple moving average. A low was formed at 158.44, and the pair is now consolidating losses. On the downside, the first major support is near 158.45.
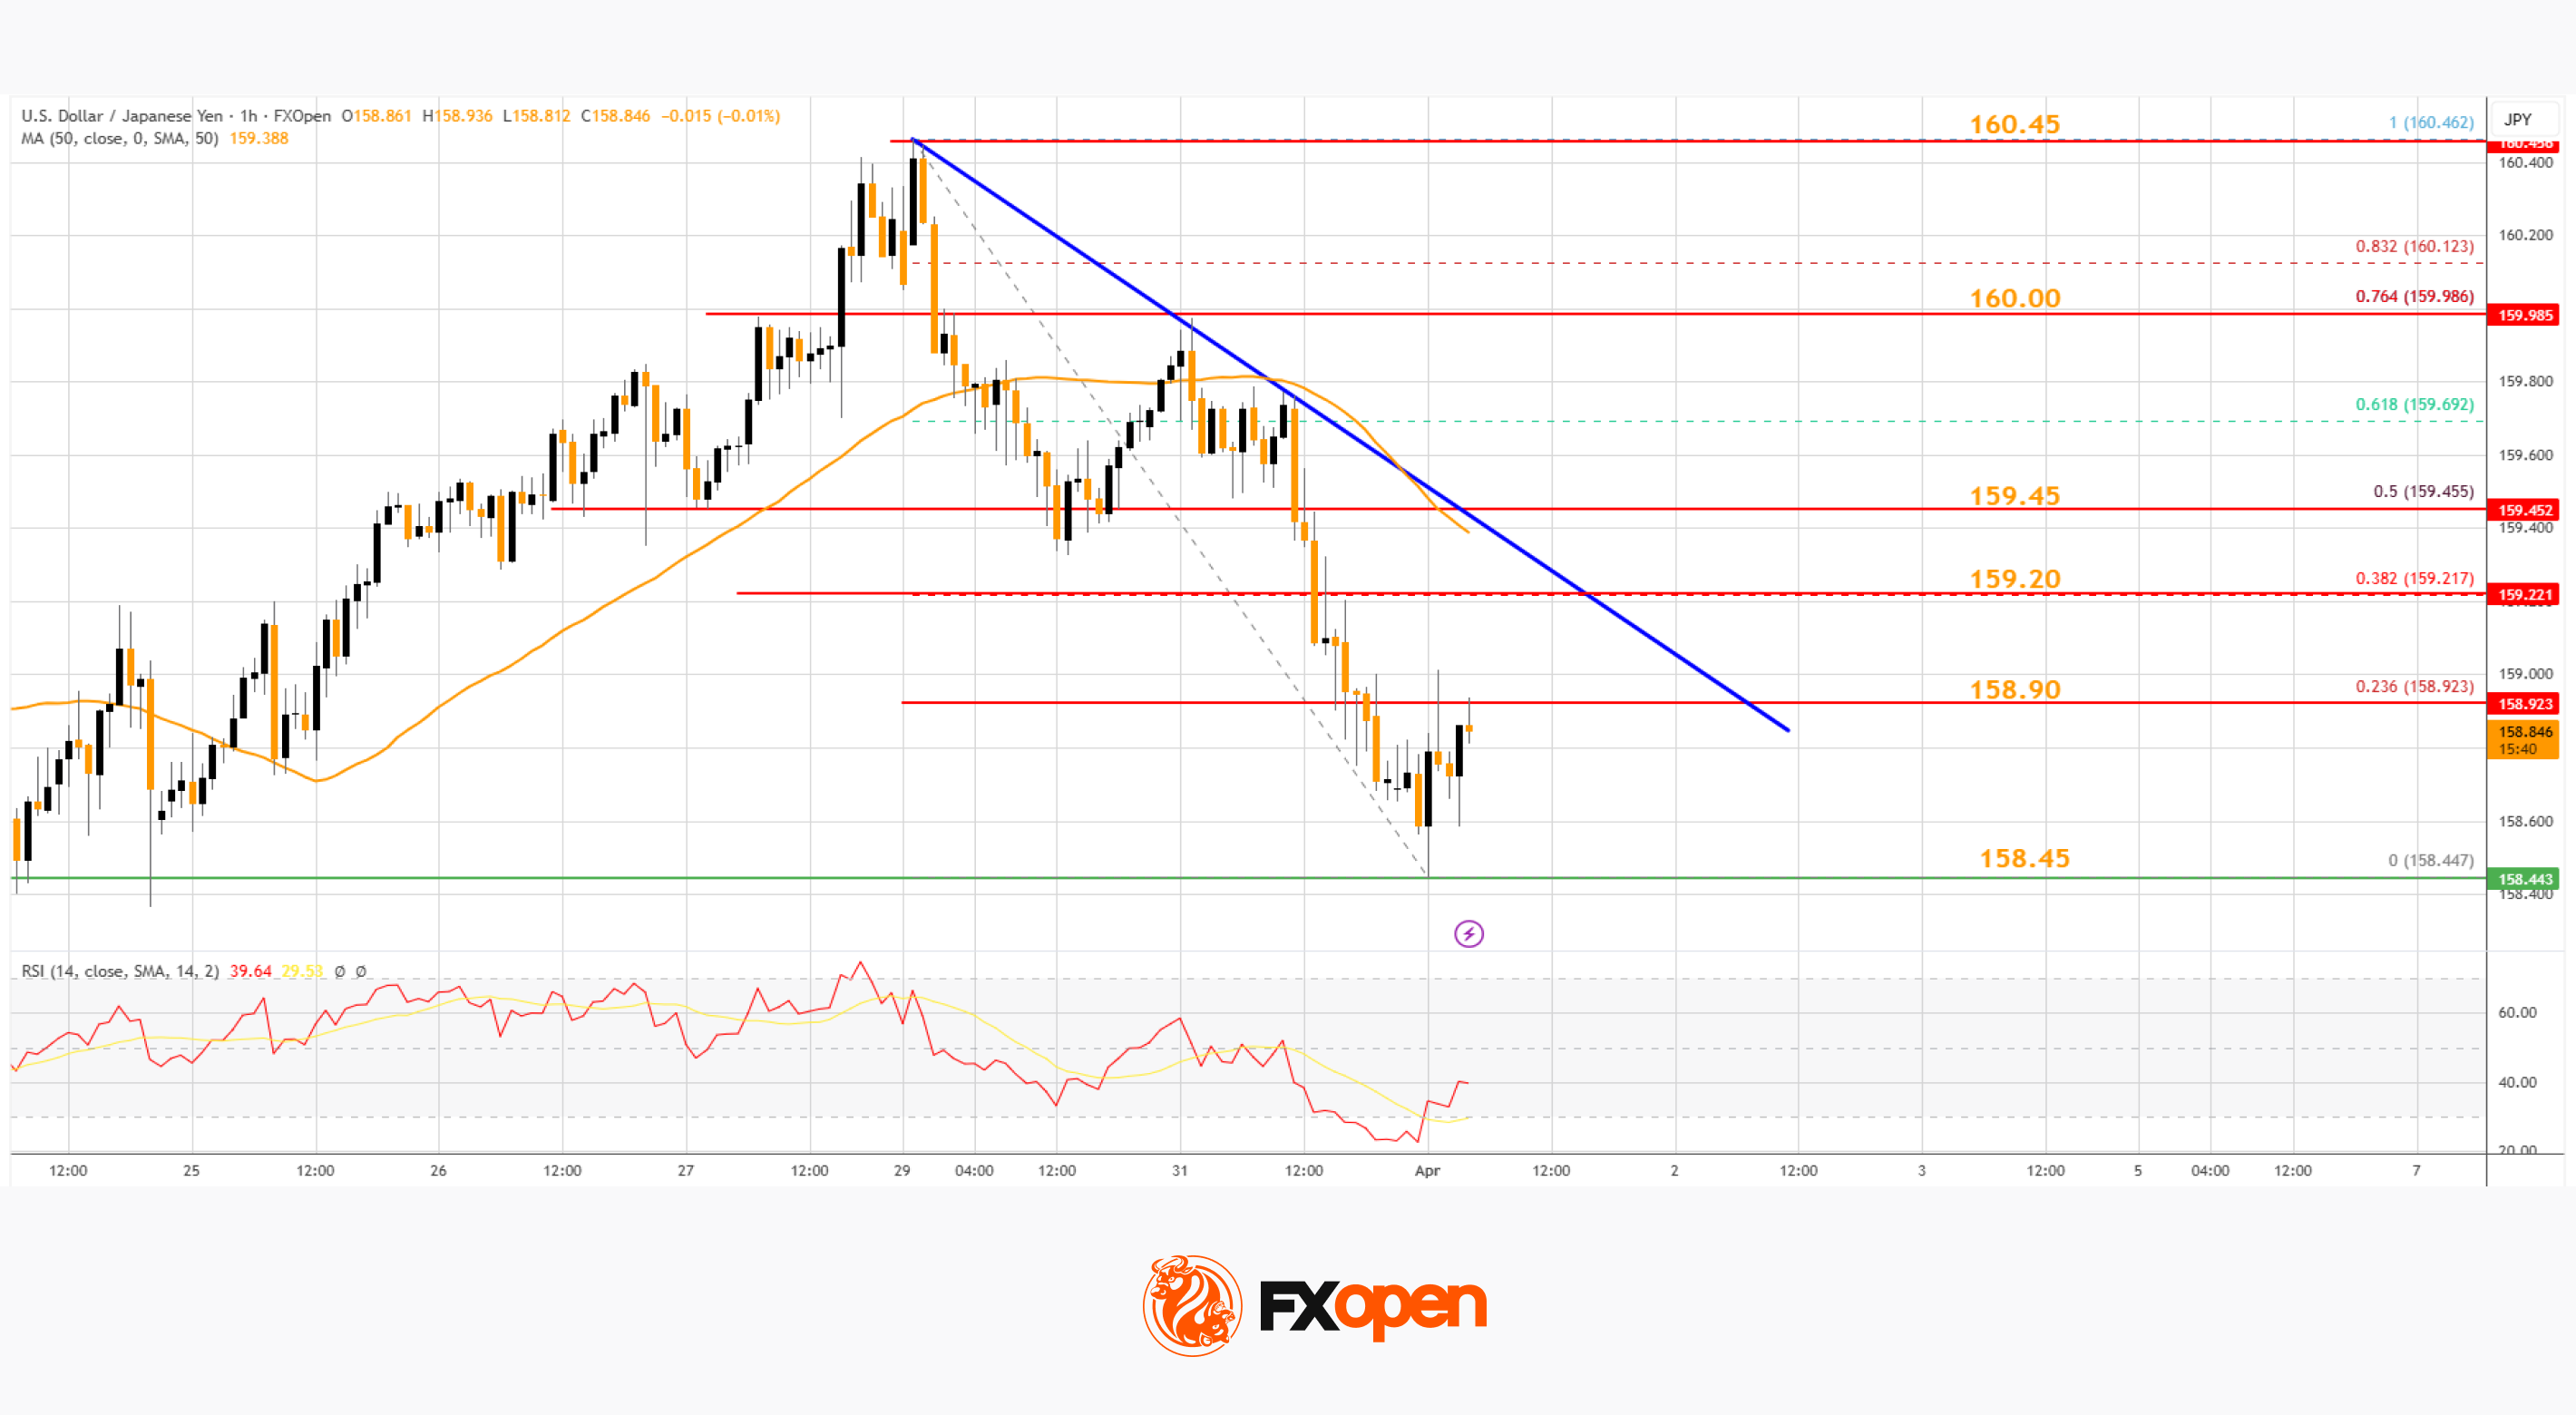
The next key region for the bulls might be 158.00. If there is a close below 158.00, the pair could decline steadily. In the stated case, the pair might drop toward 156.80. Any more losses might send the pair toward 155.00.
Immediate resistance on the USD/JPY chart is near the 23.6% Fib retracement level of the downward move from the 160.46 swing high to the 158.44 low at 158.90.
If there is a close above 158.90 and the hourly RSI moves above 50, the pair could rise toward 159.20. There is also a major bearish trend line forming with resistance near 159.20. The next major barrier for the bulls could be near the 50% Fib retracement level at 159.45, above which the pair could test 160.00 in the coming days.
Trade over 50 forex markets 24 hours a day with FXOpen. Take advantage of low commissions, deep liquidity, and spreads from 0.0 pips (additional fees may apply). Open your FXOpen account now or learn more about trading forex with FXOpen.
This article represents the opinion of the Companies operating under the FXOpen brand only. It is not to be construed as an offer, solicitation, or recommendation with respect to products and services provided by the Companies operating under the FXOpen brand, nor is it to be considered financial advice.

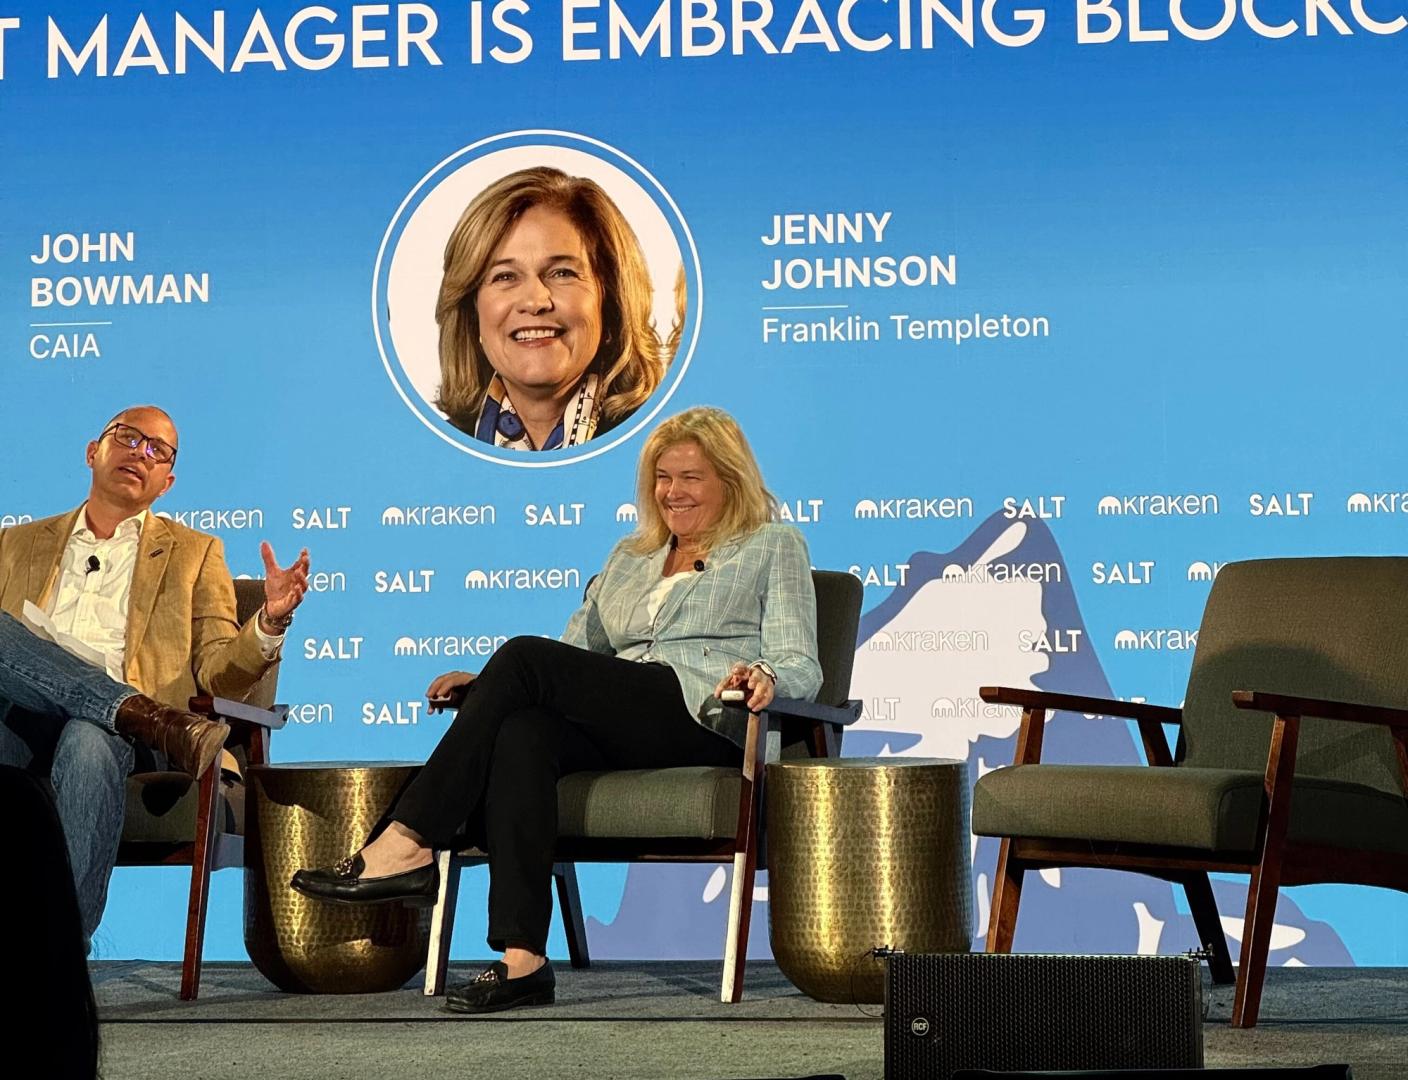
Wall Street asset management giant Franklin Templeton is launching a dedicated cryptocurrency division as it deepens its push into digital assets, anchored by a planned acquisition of crypto investment firm 250 Digital.
The new unit, called Franklin Crypto, will bring together the 250 Digital team and its liquid crypto strategies — previously managed by CoinFund — under one structure aimed at institutional investors, the firm said Wednesday.
Former CoinFund executive Christopher Perkins will lead the division, with Seth Ginns serving as chief investment officer alongside Franklin Templeton digital assets executive Tony Pecore. The group will report to Sandy Kaul, the firm’s head of innovation.
The move builds on Franklin Templeton’s existing digital asset business, which manages about $1.8 billion, and signals a shift toward offering more active crypto investment strategies alongside its current products.
“This is an exciting addition for Franklin Templeton,” CEO Jenny Johnson said, adding that the deal strengthens the firm’s ability to deliver dedicated crypto expertise to clients globally.
The launch of Franklin Crypto reflects a broader trend among large asset managers that are moving beyond passive exposure, such as exchange-traded funds, toward building in-house capabilities.
Perkins said the effort is aimed at meeting that demand. “Crypto’s institutional moment has arrived,” he said, pointing to growing interest from large investors seeking structured exposure to digital assets.
The transaction also includes an experimental element: part of the consideration will be paid using BENJI tokens, linked to Franklin Templeton’s on-chain U.S. Government Money Fund. The fund uses blockchain infrastructure to process transactions and record ownership.
That approach suggests early steps toward conducting mergers and acquisitions using tokenized assets, with settlement occurring more directly on blockchain rails.
The acquisition is expected to close in the second quarter of 2026, subject to approvals and other conditions. Financial terms were not disclosed.
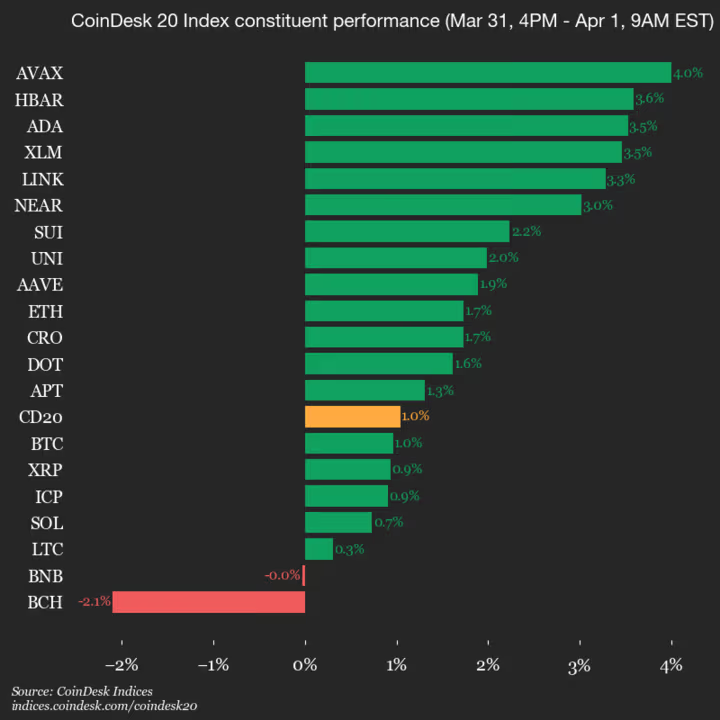
CoinDesk Indices presents its daily market update, highlighting the performance of leaders and laggards in the CoinDesk 20 Index.
The CoinDesk 20 is currently trading at 1968.28, up 1.0% (+20.29) since yesterday’s close.
Eighteen of 20 assets is trading higher.

Leaders: AVAX (+4.0%) and HBAR (+3.6%).
Laggards: BCH (-2.1%) and BNB (+0.0%).
The CoinDesk 20 is a broad-based index traded on multiple platforms in several regions globally.
Bitcoin (BTC) closed March in green, ending the longest monthly losing streak since 2018. Data suggests that the coming months may prove to be profitable for BTC.
Key takeaways:
-
Bitcoin ended March 2% higher, marking the first green monthly close in six months.
-
A similar streak in 2018/2019 led to an over 316% BTC price rebound over five months.
-
Bitcoin price faces stiff resistance at $70,000-$72,000, where key trend lines converge.
Past multi-month downtrends were followed by 300% price gains
Historical price data from CoinGlass confirms Bitcoin printed its first green monthly candle in six months, closing March 2% higher after five straight months of losses.
“This is a massive dose of hopium,” analyst Ash Crypto said in an X post on Wednesday.
The analyst was referring to a possible shift in momentum, which might lead to a sustained recovery, as seen in previous cycles.
Related: Crypto Fear & Greed Index stuck on ‘extreme fear,’ but is there a silver lining?
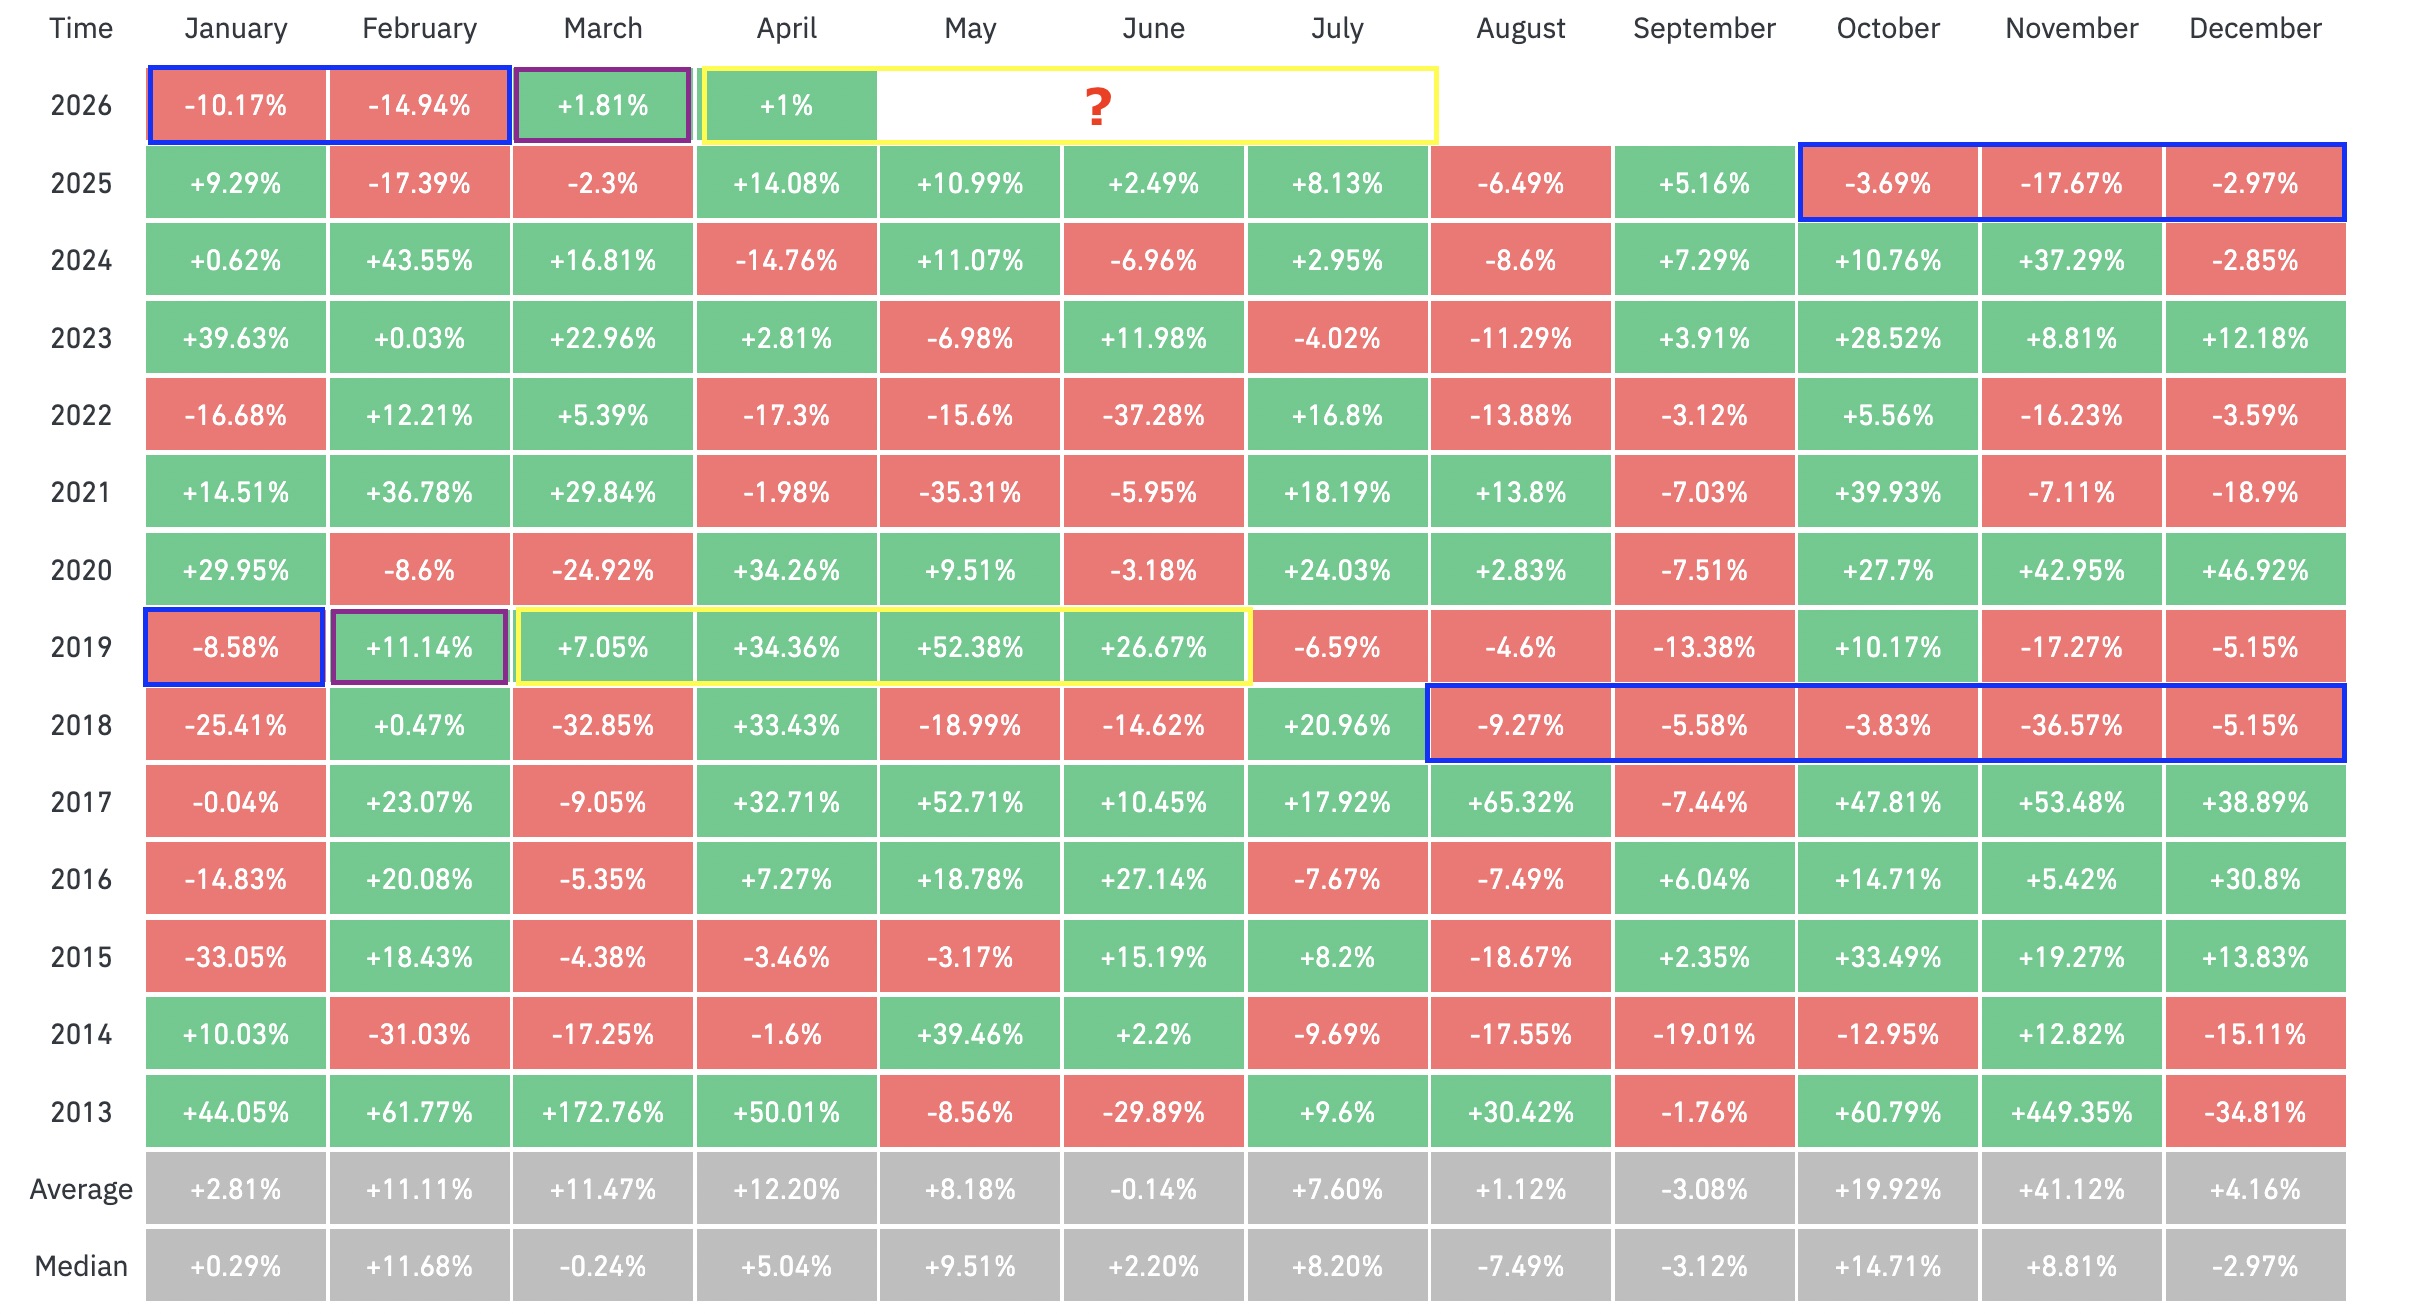
The last time this happened was in 2018/2019 when BTC closed February 2019 in green, after six consecutive red months, as shown in the figure below.
This led to a reversal with over 300% returns the following five months, as Bitcoin recovered from the 2018 bear market.
“Last time BTC dumped 6 months in a row, it pumped the following 5 months in a row that came after!” trader Satoshi Flipper said in a Wednesday post on X.

If history repeats itself, the reversal may continue in April, suggesting that BTC price may have bottomed at $60,000.
Bitcoin’s bullish monthly close is a ”catalyst for fresh inflows into early April,” Trader Caleb said, adding:
“April starts with momentum.”
Bitcoin has a well-established tendency for significant price swings in April.
Since 2013, April has been a green month for eight of the past 13 years, with average returns of about 12.2%
However, Bitcoin also tends to move in the opposite direction to March in April, and this is true for nine out of the past 13 years.
In recent years, Bitcoin dropped in April after closing March in green, three out of four times between 2021 and 2024.
Therefore, while the end of past multi-month drawdowns suggests a rebound is due, data demonstrates that BTC price could also slide in April.
Watch these Bitcoin price levels next
Data from TradingView shows BTC price up 2.5% on the day to trade at $68,470 as the $69,000-$70,000 resistance remains in place.
Analysts expect Bitcoin’s range-bound price action to continue for longer, with important price levels to look for in case of a breakout.
These include the $70,000-$72,000 supply zone, coinciding with the 50-day simple moving average (SMA), the 50-day exponential moving average (EMA) and the 1w–1m cohort cost basis.
This is also where investors acquired approximately 650,000 BTC, marking a potential point of sell pressure, according to the cost-basis distribution data from Glassnode.
Breaking above this level could see BTC/USD revisit the $76,000 range high and eventually the $80,000 psychological level.

Zooming out, trader Sheldon Diedericks said Bitcoin could “push into resistance” at $83,000 on the monthly time frame, a key support level from April 2025. The 200-day EMA is also close to this area.

On the downside, the 200-week EMA at $68,300 and the 200-week SMA at $59,400 remain key levels to watch. Below that, the next major level is Bitcoin’s realized price around $54,000.
As Cointelegraph reported, Bitcoin’s bear market bottom could be formed once BTC price drops toward or below its realized price.
This article is produced in accordance with Cointelegraph’s Editorial Policy and is intended for informational purposes only. It does not constitute investment advice or recommendations. All investments and trades carry risk; readers are encouraged to conduct independent research before making any decisions. Cointelegraph makes no guarantees regarding the accuracy or completeness of the information presented, including forward-looking statements, and will not be liable for any loss or damage arising from reliance on this content.
Crypto World
OpenAI Secures Historic $122B Investment Round, Reaching $852B Valuation with Amazon and Nvidia Support

Key Highlights
- OpenAI secured $122 billion in funding, achieving an $852 billion post-money valuation
- Major investors include Amazon, Nvidia, and SoftBank, with continued support from Microsoft
- The company reports $2 billion in monthly revenue and serves 900 million weekly active ChatGPT users
- Development underway for an integrated AI “superapp” merging ChatGPT, Codex, and web browsing capabilities
- Credit facility enhanced to $4.7 billion, remaining untapped at present
OpenAI has successfully completed a monumental $122 billion investment round, establishing a new benchmark as the largest private capital raise in corporate history. This extraordinary financing values the artificial intelligence leader at $852 billion following the transaction, positioning it as the highest-valued privately-held company globally.
The investment was spearheaded by technology and investment heavyweights Amazon, Nvidia, and SoftBank. Microsoft, a longstanding strategic partner, maintained its participation in this latest round. SoftBank shared co-leadership responsibilities with a16z, D.E. Shaw Ventures, MGX, TPG, and T. Rowe Price-advised accounts.
The comprehensive investor consortium features prominent names including BlackRock, Blackstone, Fidelity, Sequoia, Temasek, Coatue, ARK Invest, Thrive Capital, and Insight Partners, alongside numerous other institutional backers.
In an unprecedented move, OpenAI made this funding opportunity accessible to retail investors through banking partnerships, successfully securing over $3 billion from individual participants alone. Additionally, OpenAI will gain exposure through inclusion in multiple ARK Invest exchange-traded funds.
The company reports current monthly revenue of $2 billion. This represents substantial acceleration from the $1 billion quarterly run rate recorded at 2024’s conclusion, demonstrating remarkable revenue expansion in a compressed timeframe.
ChatGPT’s user base has surpassed 900 million weekly active participants, complemented by more than 50 million paid subscription accounts. OpenAI maintains that its platform receives six times the monthly web traffic compared to its closest AI application competitor.
Enterprise clients now contribute over 40% of total revenue streams. According to company projections, enterprise revenue is positioned to match consumer revenue contributions by the conclusion of 2026.
The company’s application programming interfaces handle over 15 billion tokens every minute. Codex, its specialized coding assistant, supports more than 2 million weekly users—a fivefold increase achieved within a mere three-month period.
Vision for an Integrated AI Superapp
OpenAI has announced ambitious plans to construct a comprehensive AI superapp platform that consolidates ChatGPT, Codex, web browsing functionality, and autonomous agent capabilities into a singular, cohesive product offering. This strategic initiative aims to simplify widespread adoption and utilization of its artificial intelligence models.
The organization emphasizes computational infrastructure as a critical strategic priority. Cloud computing partnerships span Microsoft, Oracle, AWS, CoreWeave, and Google Cloud. Semiconductor collaborations encompass Nvidia, AMD, AWS Trainium, Cerebras, alongside proprietary chip development in partnership with Broadcom.
Enhanced Credit Arrangements and Market Position
OpenAI has simultaneously expanded its revolving credit arrangement to approximately $4.7 billion. This facility receives backing from leading financial institutions including JPMorgan Chase, Citi, Goldman Sachs, Morgan Stanley, Wells Fargo, and additional major banks. Notably, the entire facility remains untapped as of March 31.
With an $852 billion valuation, OpenAI commands a worth approximately equivalent to Berkshire Hathaway. The company’s value surpasses the market capitalizations of major corporations including Visa, JPMorgan Chase, and Samsung.
OpenAI has recently introduced GPT-5.4 to the market. The company’s API infrastructure continues expanding, processing billions of tokens per minute across both enterprise and consumer deployment scenarios.

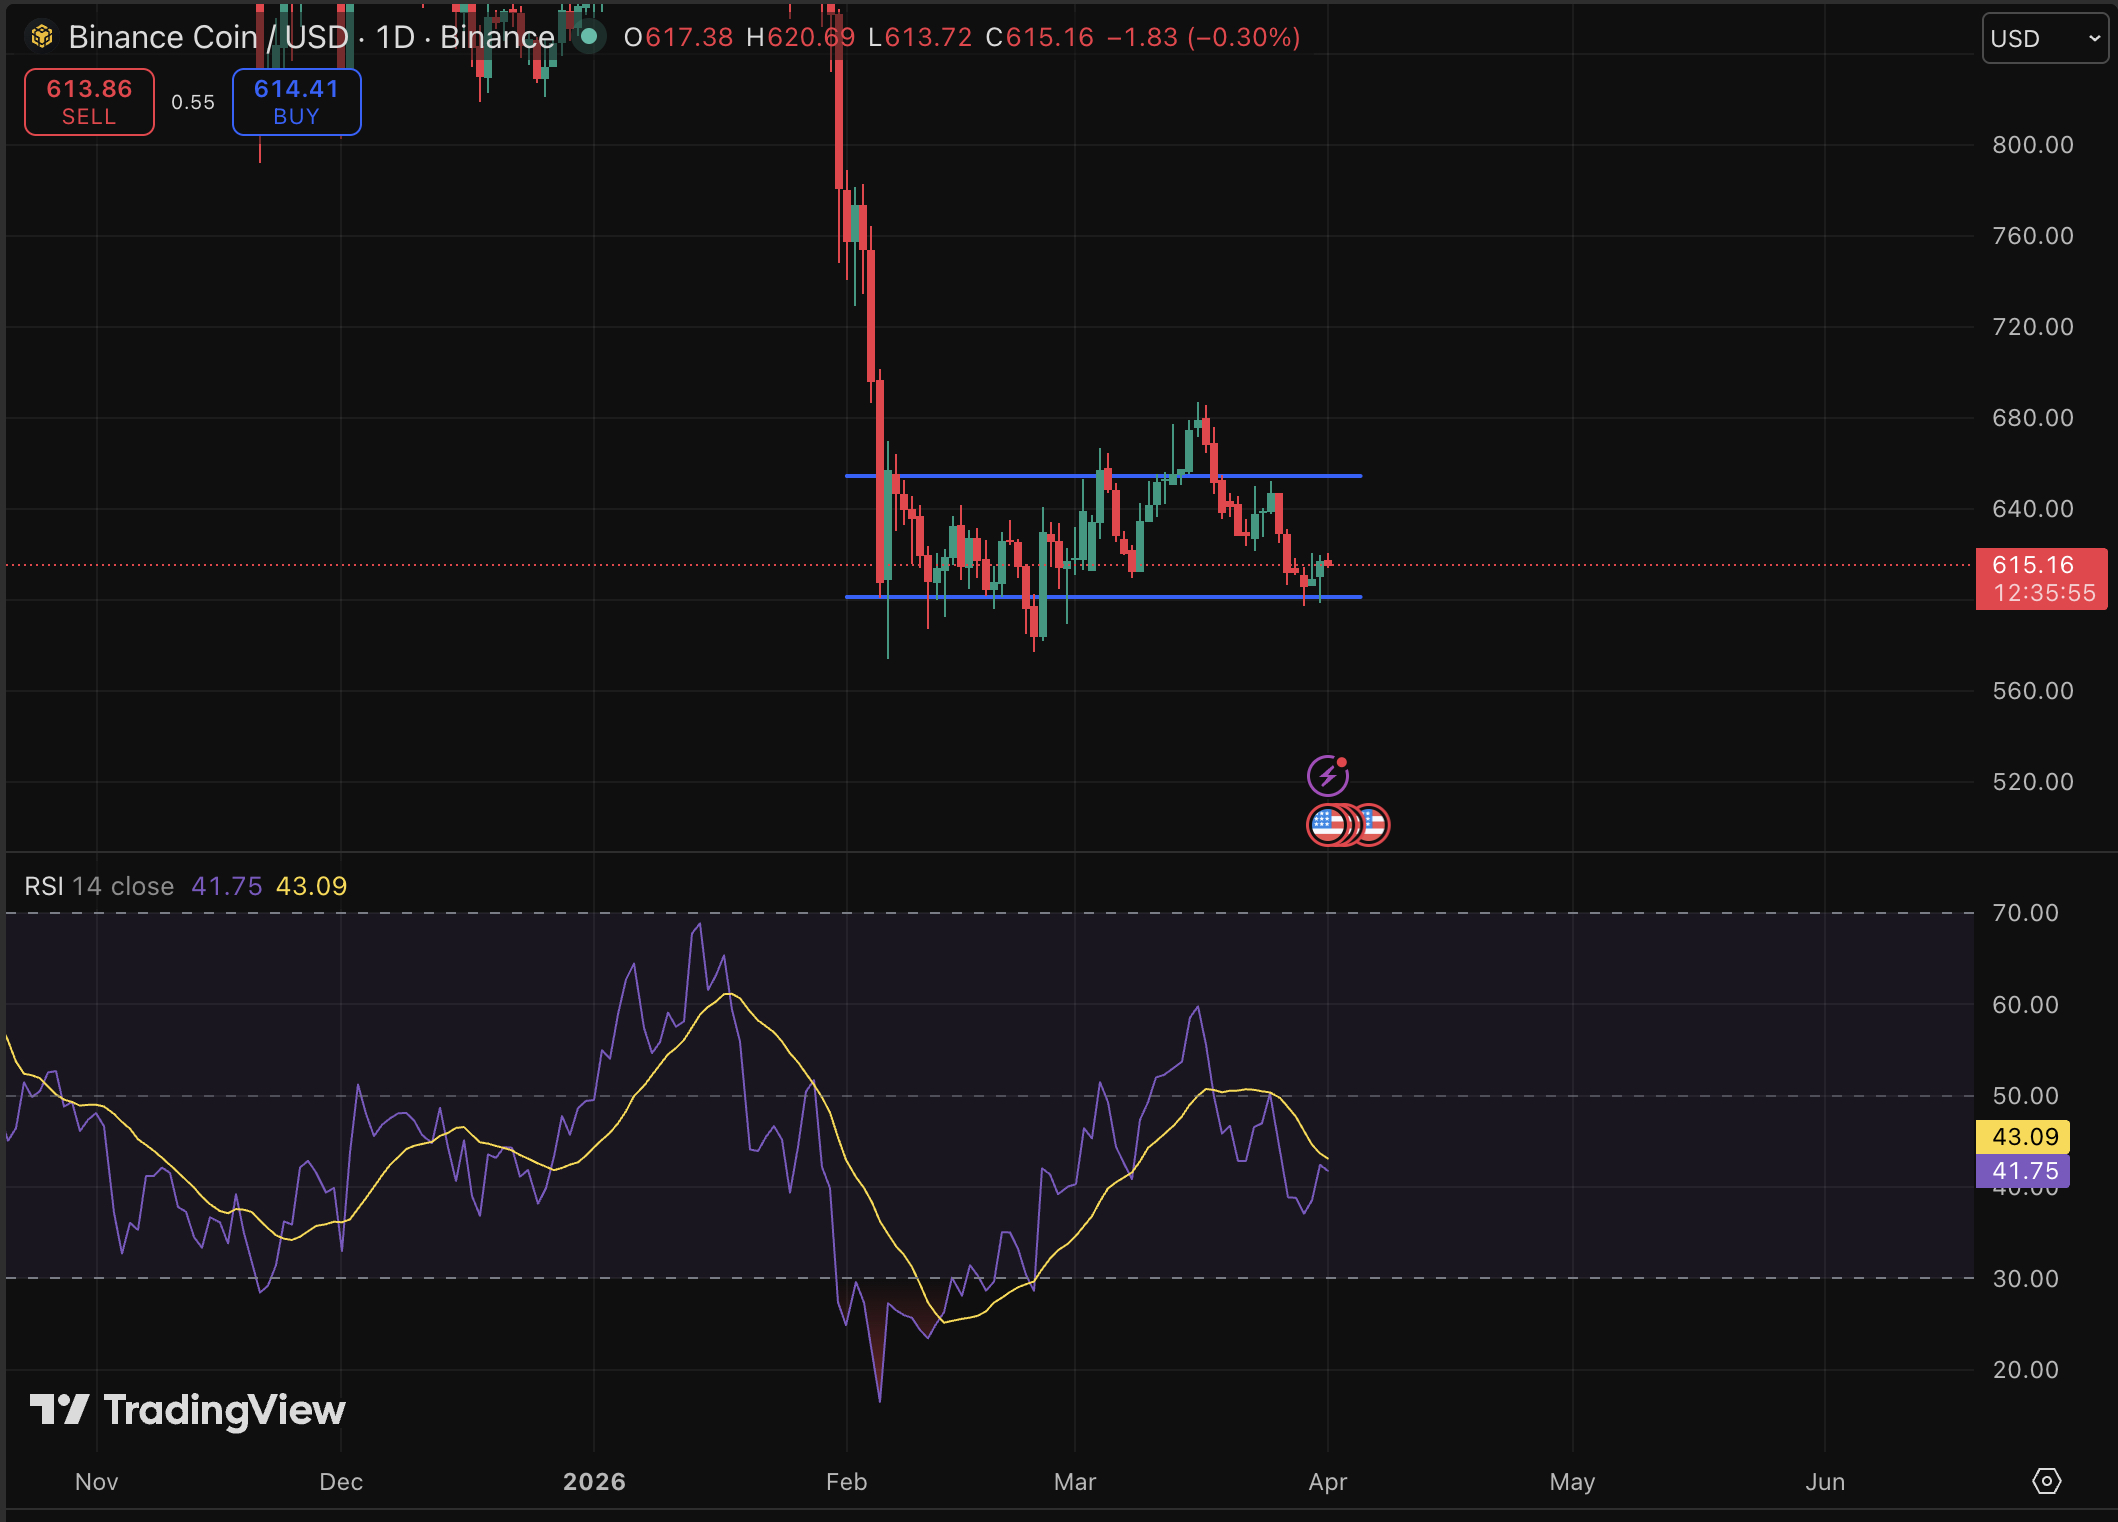
BNB is holding a critical psychological price threshold, trading at $614 after a 1.7% gain in 24 hours, and our prediction since last week is getting bullish. As a catalyst, Binance’s newly announced prediction market feature can add enough utility to the equation.
Binance confirmed Yesterday it is rolling out an integrated prediction market directly inside its self-custody wallet, partnering with third-party providers, including Predict.fun, to let users bet on politics, sports, and crypto events without leaving the app.
— BSCN (@BSCNews) March 31, 2026
 JUST IN: BINANCE WALLET TO LAUNCH PREDICTION MARKET FEATURE
Binance Wallet (@BinanceWallet) is introducing a new prediction market tool. The feature will allow users to bet on future outcomes. Categories include sports, economics, world events, and crypto.
Binance will not… pic.twitter.com/lmMV53hEyX
The feature may also tie into BNB Chain’s yield-generating staking mechanics, potentially creating new organic demand for the token. Regulatory guardrails around prediction markets remain in flux, which adds a layer of uncertainty, but institutional interest in the sector is clearly accelerating, with Coinbase and Crypto.com both expanding into similar territory in recent months.
Discover: The best pre-launch token sales
BNB Price Prediction: Can It Hit $660 This Week?
BNB is consolidating in a narrow band near its lower Bollinger Bands, with RSI sitting at a neutral-to-weak 41-43, showing convergence but not yet confirmation of a reversal.
Key support sits at $600 level, with a secondary floor at $580. On the upside, resistance clusters at $640, $660, and the upper Bollinger Band at $680.
For the price, prediction market utility drives fresh BNB demand; the price can reclaim the $649 SMA and test the $660–$680 resistance zone within days. But a break below $600 support opens the door to the $420 accumulation zone.
On-chain activity at roughly 1 million active addresses and consistent token burns provide a structural floor. Broader altcoin season dynamics will likely determine whether BNB’s next meaningful move is up or down from here. Watch this current level closely; it has held twice in 48 hours, but a third test rarely ends the same way.
Discover: The best crypto to diversify your portfolio with
Bitcoin Hyper Targets Early Mover Upside as BNB Tests Key Levels
BNB is offering a range-bound trade with meaningful upside capped at $680 in the near term. For traders who want asymmetric exposure during this uncertain window, early-stage infrastructure plays are drawing attention, particularly those targeting Bitcoin’s own scaling limitations.
Bitcoin macro conditions remain a dominant force across the entire market, and projects building directly on BTC infrastructure are positioned to capture that gravity.
Bitcoin Hyper ($HYPER) is positioning itself as the first Bitcoin Layer 2 with Solana Virtual Machine (SVM) integration, combining Bitcoin’s security and trust with smart contract performance that exceeds Solana’s own throughput.
The presale has raised more than $32 million at a current token price of just $0.0136, with staking rewards live for early participants. Core features include a Decentralized Canonical Bridge for BTC transfers, sub-second finality, and low-cost transaction execution, targeting the exact bottlenecks (slow speeds, high fees, no programmability) that have historically kept institutional capital off Bitcoin’s base layer.
This article is for informational purposes only and does not constitute financial advice. Cryptocurrencies are highly volatile. Always do your own research before investing.
The post BNB Price Prediction: Can BNB Maintain Momentum With Its New Prediction Market? appeared first on Cryptonews.


The World Foundation sold $65 million in WLD tokens through over-the-counter block trades with four private counterparties at an average price of $0.2719 per token.

Clapham: how our weak society emboldened the mob

Fed Governor Miran still backs cuts, says interest rates could be ‘about a point’ lower this year

Make Money With AI Music


-

 News Videos7 days ago
Parliament publishes latest register of MPs’ financial interests
-

 Business6 days ago
Instagram, YouTube Found Responsible for Teen’s Mental Health Struggle in Historic Ruling
-
 Tech6 days ago
Intercom’s new post-trained Fin Apex 1.0 beats GPT-5.4 and Claude Sonnet 4.6 at customer service resolutions
-

 NewsBeat5 days ago
The Story hosts event on Durham’s historic registers
-

 Sports5 days ago
Sweet Sixteen Game Thread: Tide vs Michigan
-
Entertainment2 days ago
Fans slam 'heartbreaking' Barbie Dream Fest convention debacle with 'cardboard cutout' experience
-
 Entertainment4 days ago
Lana Del Rey Celebrates Her Husband’s 51st Birthday In New Post
-
Crypto World1 day ago
Dems press CFTC, ethics board on prediction-market insider trades
-

 Sports22 hours ago
Tallest college basketball player ever, standing at 7-foot-9, entering transfer portal
-
 Fashion7 days ago
How to Style Spring Like WeWoreWhat: Easy Outfit Ideas for 2026
-

 Tech3 days ago
The Pixel 10a doesn’t have a camera bump, and it’s great
-

 Entertainment6 days ago
HBO’s Harry Potter Series Will Definitely Fail For One Big Reason, And It’s Not J.K. Rowling Or Snape
-

 Crypto World2 days ago
U.S. rule change may open trillions in 401(k) funds to crypto
-

 Fashion6 days ago
En Vogue in Brown Leather and Tailored Neutrals by Atelier Savoir, Styled by J Bolin
-

 Tech1 day ago
How to back up your iPhone & iPad to your Mac before something goes wrong
-

 Fashion6 days ago
What Are Your Favorite T-Shirts for the Weekend?
-

 Fashion5 days ago
Weekly News Update, 3.27.26 – Corporette.com
-

 Politics2 days ago
Should Trump Be Scared Strait?
-

 Sports2 days ago
Women’s hockey camp eyes fitness boost, tactics ahead of WC 2026 campaign | Other Sports News
-

 Tech1 day ago
Flipsnack and the shift toward motion-first business content with living visuals
You must be logged in to post a comment Login