
Crypto World
Bitcoin crashed below $62,000. What happened


Bitcoin has been in freefall since June 2, 2026. What started as a midday flash crash that knocked the price from about $71,765 to $67,895 has turned into a three-day slide.
Summary
- Bitcoin fell below $62,000 after a three-day selloff that erased months of gains and triggered roughly $1.8 billion in liquidations.
- Data showed leverage had climbed to levels last seen before the October 2025 crash, leaving the market vulnerable to a liquidation cascade.
- Analysts pointed to weakening Bitcoin demand, persistent ETF outflows, and broader risk aversion as factors that kept prices under pressure after the initial drop.
By June 4, Bitcoin had fallen to $61,655, its lowest level in months and more than 50% below the October 2025 all-time high near $126,200.
The selloff has wiped out roughly $1.8 billion in leveraged positions, flushed more than 272,000 traders, and dragged Bitcoin below Strategy’s average purchase price for the first time since late 2023.
Long positions, the bets on prices rising, made up nearly nine-tenths of the damage. The drop looked sudden, the kind of out-of-nowhere move that sends everyone hunting for a single villain. It was not out of nowhere.
The on-chain data had been flashing warnings for days, the leverage was sitting at levels last seen right before the previous major crash, and the spark that lit the fuse was almost comically small.
This is what actually happened, in order.
The setup: leverage at crash levels
The most important fact about this crash is that the market was primed for it before anything happened. The crash was not caused by the trigger. It was caused by the conditions, and the trigger just lit them.
Before the drop, the derivatives market was dangerously stretched. Bitcoin’s futures open interest leverage ratio, a gauge of how much borrowed money is sitting in the futures market relative to Bitcoin’s size, had climbed to 2.63% on June 2. The perpetual-futures version reached 2.48%. Both were the highest readings since October 6, 2025.
That date should make anyone who trades crypto nervous, because October 6, 2025 was right before the “Black Friday” crash, one of the most violent liquidation events of the last cycle. In other words, the amount of leverage in the system on June 2 had quietly built back up to the exact level it sat at immediately before the previous major wipeout.
Funding rates were running hot, meaning traders were paying a premium to hold long positions, a classic sign that bullish bets had become crowded and one-directional.
When leverage gets that stretched and positioning gets that crowded, the market becomes fragile in a specific way. A large mass of leveraged long positions sits stacked at similar price levels, each with a liquidation point not far below the current price.
All it takes is a push big enough to hit the first cluster of those liquidation points, and the rest go like dominoes. The market did not need a major catastrophe to crash. It needed a nudge, because the structure was already a tower of leverage waiting to topple.
The spark: a 32-coin sale
The nudge, almost absurdly, was a $2.5 million Bitcoin sale by a company that owns roughly $61 billion of it.
On June 1, Strategy, the Michael Saylor-led firm that is the largest corporate holder of Bitcoin, disclosed in an SEC filing that it had sold 32 Bitcoin for about $2.5 million to help fund dividends on its preferred stock. In raw market terms, 32 coins is statistically irrelevant. Global Bitcoin spot turnover runs into the tens of billions of dollars daily. A $2.5 million sale does not move the price by itself any more than a bucket of water changes the level of a lake.
What made it matter was the symbolism. Strategy wrote the playbook for aggressive, never-sell corporate Bitcoin accumulation. For years, the company’s refusal to sell was a load-bearing belief for a certain kind of Bitcoin holder. So when the filing showed Strategy selling for the first time since 2022, it did not register as a tiny dividend-funding operation.
It registered, especially among retail traders on forums like Stocktwits who pointed to Saylor’s decision as the primary cause, as the guy who said he would never sell, selling. That broke a psychological anchor, and in a market sitting on October-2025 levels of leverage, breaking a psychological anchor was enough.
The sequence matters here. The sale itself did not crash the market. The sale dented sentiment, sentiment nudged the price down toward the first cluster of leveraged long liquidation points, and then the leverage did the rest. The 32 coins were the match. The leverage was the gasoline.
The cascade: how the dominoes fell
Once the price broke through the first liquidation cluster, the mechanism took over, and the mechanism is brutal and automatic.
Here is how a liquidation cascade works. When a trader uses leverage to bet on Bitcoin rising, the exchange sets a liquidation price below the entry. If the price falls to that level, the exchange automatically closes the position by selling, to prevent the trader’s losses from exceeding their collateral. That forced selling pushes the price down further. The lower price hits the next cluster of liquidation points, forcing more automatic selling, which pushes the price down again. Each wave of forced selling triggers the next. It is a chain reaction that feeds on itself, and it can run far faster than any human can react.
On June 2 the chain reaction was violent. Roughly $394 million in leveraged positions were force-closed in a single hour. Over the next 24 hours, the total reached about $1.02 billion, and as the slide continued, the broader wipeout swelled toward $1.8 billion, one of the largest liquidation events of 2026 and the biggest since the prior October’s crash. More than 272,000 traders were liquidated.
The long-short split tells the whole story: roughly $1.57 billion of the liquidations were long positions versus only about $215.7 million in shorts. This was a crowd of bullish, leveraged traders getting flushed almost all at once.
The selling was not only in the derivatives market. Spot Bitcoin moving onto exchanges, often a precursor to selling, spiked sharply. Total exchange inflows reached about 58,617 Bitcoin, the highest since April 14, and higher than the roughly 46,527 Bitcoin that flowed in just before the October 2025 Black Friday crash. More coins were being moved to exchanges to sell this time than ahead of that previous wipeout, which is part of why the slide kept going rather than snapping back.
The damage spread across the market. Bitcoin led with over $833 million in liquidations, Ethereum followed with nearly $480 million as it fell toward $1,857, Solana saw over $90 million, and XRP dropped around 3%. The total crypto market capitalization fell to around $2.42 trillion.
The slide that kept going
A normal flash crash bounces. This one did not, and that is what separates the June 2 event from an ordinary leverage flush.
After the initial June 2 cascade, Bitcoin failed to recover. It opened June 3 below $67,000, dipped toward the $65,400 area, and retested its February low for the third time. By June 4, it had broken below $62,000, touching $61,655, erasing months of recovery and falling more than 50% below the October 2025 peak. Ethereum opened June 3 below $2,000, down more than 7%. Each attempted bounce was sold into.
The reason the slide kept going points to something deeper than leverage. CryptoQuant’s head of research, Julio Moreno, argued the correction was about Bitcoin demand contracting, not about stocks, oil, or macro. By his measure, overall demand for Bitcoin, speculative and spot combined, was shrinking at a monthly pace of about 232,000 Bitcoin.
US equities, by contrast, were sitting at record highs at the same moment, which undercuts the idea that this was simply a broad risk-off move dragging everything down together. On this reading, Bitcoin was falling because fewer people wanted to buy it, full stop, and a leverage flush on top of contracting demand produces a slide rather than a quick snapback.
The drop also pushed Bitcoin below a symbolically heavy line: Strategy’s average purchase price, for the first time since late 2023. The largest corporate holder of Bitcoin was now underwater on its average position, which deepened the very sentiment problem that Strategy’s small sale had started.
The other pressures in the background
The leverage and the demand contraction explain the mechanics, but several other forces were leaning on the market at the same time, which is why the selling found so little support on the way down.
ETF outflows were the steadiest pressure. Spot Bitcoin ETFs had entered an extended consecutive-selloff streak that reached 11 to 12 days, the longest run since the products launched, with total withdrawals of roughly $3.45 billion. That meant the largest channel of institutional demand was not buying the dip. It was a net seller, removing the buyer that might otherwise have absorbed the cascade.
The macro backdrop was risk-off. Renewed Middle East tensions, with Iran-related uncertainty pushing oil prices higher, drove a broad move out of risk assets. The crash also landed at the start of a jobs week, with US job openings data due ahead of payrolls, leaving traders defensive ahead of data that could move rate-cut expectations. Sticky inflation worries and renewed dollar strength added to the pressure, since a stronger dollar makes Bitcoin less attractive to global buyers.
There was even an on-chain wrinkle: reported movement from old Mt. Gox-related wallets, the kind of dormant-coin shuffle that occasionally spooks the market with fears of long-held supply hitting exchanges. And underneath all of it sat the cycle argument. Some analysts read the drop as the four-year cycle simply playing out, with the post-peak drawdown that historically follows a major top now underway. On this view, the crash was not an anomaly at all but the expected behavior of an asset more than a year past its cycle high.
Where prediction markets see it going
With the slide still fresh, the clearest read on sentiment comes from where traders are actually putting money, and the prediction markets have turned sharply bearish.
On Polymarket, the most active Bitcoin market shifted to pricing a roughly two-thirds chance that Bitcoin hits $55,000 or lower before 2027. Traders priced a 72% chance of a drop below $65,000 in 2026, and the same market showed meaningful odds, around half, of a fall to $50,000, with smaller but non-trivial odds assigned to $45,000 and even $40,000.
These contracts resolve based on whether Bitcoin records a low at or below the listed price, so they reflect where traders think the floor could be tested, not necessarily where it settles.
The analyst commentary matched the bearish tilt. CryptoQuant said a bear market has persisted since November 2025 and warned that bottoms take months to form, with Moreno cautioning against trying to call a bottom right after a fresh leg down.
That said, the same prediction markets still showed a slight majority assigning odds to Bitcoin reclaiming $100,000 by year-end, a reminder that even bearish crowds were not writing off a recovery entirely. The honest summary of market sentiment is that the crowd now sees real downside risk toward $55,000 and below, while keeping a smaller bet alive that this resolves higher by December.
Why this keeps happening
If this sequence feels familiar, that is because it is. The specific trigger changes every time, but the underlying pattern of crypto crashes is remarkably consistent, and understanding it is more useful than memorizing any single day’s news.
The recurring ingredient is always leverage. Crypto offers traders enormous leverage, often far beyond what regulated traditional markets allow, and during calm bullish stretches that leverage accumulates. Traders pile into long positions, funding rates climb, and open interest swells.
The market looks strong on the surface because the price is rising, but underneath it is becoming more fragile with every additional leveraged long, because each one is a liquidation point waiting to be hit. The October 2025 crash had this setup. The June 2026 crash had this setup. The pattern repeats because the incentive to use leverage during a rally never goes away.
The trigger is almost always secondary. It can be a Saylor sale, a macro headline, a large whale moving coins, a technical break of a watched level. What matters is not the size of the trigger but whether the market is leveraged enough for the trigger to start a cascade. A $2.5 million sale starting a slide in a $1.2 trillion asset class makes no sense until you understand that the sale was not the cause, just the ignition. In an unleveraged market, the same sale would have been a non-event.
This is why seasoned traders watch funding rates and the open-interest leverage ratio more closely than they watch any individual news item. The news tells you what lit the fuse. The leverage data tells you how big the explosion will be.
Where this leaves things
The June crash was a leverage event that turned into a demand event. The headline says Bitcoin crashed because Saylor sold, and that is the version most people will remember. The fuller version is that Bitcoin was carrying its highest leverage since the eve of the last major wipeout, a small symbolically loaded sale started the dominoes, and then a genuine contraction in Bitcoin demand kept the price sliding for three days instead of letting it bounce.
The numbers that matter going forward are not the 32 coins. They are the roughly $1.8 billion liquidated, the 272,000 traders flushed, the 232,000-Bitcoin monthly demand contraction CryptoQuant flagged, and the fall below Strategy’s average cost basis. The liquidation cascade was, mechanically, a reset: it cleared out the crowded long leverage that made the market fragile, which is often a precondition for stabilization.
But the demand contraction is the worrying part, because a leverage flush fixes itself in hours while demand can persist for months. That is the distinction between a dip and a deeper decline, and right now the data points to both forces being present at once.
What it does not settle is direction. A leverage flush resets the derivatives market, but where Bitcoin goes from its post-crash level near $62,000 depends on the things that have nothing to do with leverage: whether ETF outflows reverse, whether demand stops contracting, whether the Middle East risk-off eases, whether the jobs data shifts rate-cut expectations, and whether the four-year-cycle crowd is right that this is a post-peak drawdown with further to run.
Prediction markets are betting on more downside toward $55,000 while keeping a smaller wager alive on a recovery by year-end. For traders, the durable lesson is the one this pattern teaches every cycle: in a market this leveraged, the trigger is never the point. The leverage is. And this time, the demand behind it is the thing to watch next.
This article is for informational purposes and does not constitute financial or investment advice. Cryptocurrency markets are highly volatile. The figures and analysis described reflect data available as of June 4, 2026. Always do your own research and consult with qualified financial professionals before making investment decisions.


Hungary is rolling back strict crypto rules as CoinCash prepares to resume services after receiving authorization under the European Union’s Markets in Crypto-Assets (MiCA) regulation.
The Hungarian parliament voted to repeal the country’s crypto validator requirement, removing mandatory third-party approval for certain crypto transactions, the Hungarian tax and legal publication Ado.hu reported on Tuesday.
Finance Minister Kármán András said the government removed the validation requirement after the previous rules disrupted Hungary’s crypto market, prompting some service providers to halt operations in the country.
“Due to the negative and market-shaking regulations so far, many players have terminated their services related to cryptocurrencies in Hungary, but the market is now showing signs of recovery,” he wrote in a Tuesday Facebook post.
The development marks a significant shift in Hungary’s crypto sector, removing an additional approval step while leaving broader licensing and compliance requirements in place.
How Hungary’s crypto checks worked
Hungary introduced the requirement through its 2024 crypto assets law, creating a separate validation process for certain crypto conversions.
The rules, which took effect on July 1, 2025, required a licensed validator to verify details including the origin of crypto assets, wallet ownership and customer information before issuing a compliance declaration.
Related: Hungary to reverse crypto trading crackdown after EU scrutiny
The system added another transaction-level approval step alongside MiCA. Hungary also applied a shortened MiCA transition period for crypto asset service providers (CASPs), requiring compliance by July 1, 2025, compared with the EU’s maximum transition deadline of July 1, 2026.
The stricter regulatory environment prompted some crypto platforms to suspend services in Hungary, including Budapest-based crypto platform CoinCash, which voluntarily paused operations in December 2025 while pursuing MiCA authorization.
CoinCash receives Hungary’s first MiCA license
The National Bank of Hungary (MNB) granted CoinCash operator Tiwala Solutions authorization under the EU’s MiCA regulation on July 20, according to a company announcement reviewed by Cointelegraph.
“We’re the first and only Hungarian company authorised directly by the National Bank under the EU framework,” CoinCash co-founder said in a LinkedIn post on Friday.
Related: Unauthorized crypto trading now carries 2 years of prison in Hungary
The authorization covers custody, crypto-to-fiat and crypto-to-crypto exchange, transfers, investment advice and portfolio management.
CoinCash said it completed a months-long compliance review before receiving approval and paused operations while preparing to meet the requirements. The company plans to gradually resume services and expand beyond trading into additional MiCA-regulated offerings.
Magazine: The real reason DeFi projects that survived 2022 crash are shutting down now


Coinbase appointed Rob Witoff as chief technology officer on July 28, bringing an early company engineer into the role as the U.S. crypto exchange expands AI-assisted product development.
Summary
- Coinbase appointed longtime engineer Rob Witoff as chief technology officer, confirming the leadership change Tuesday.
- Witoff first joined Coinbase in 2014, returning as platform head in December 2024 after entrepreneurship.
- Coinbase cut approximately 14% of employees in May while rebuilding teams around AI-assisted workflows companywide.
Coinbase’s official leadership page now lists Witoff as CTO.
Chief Executive Brian Armstrong announced the appointment on X and credited Witoff with helping turn Coinbase into “one of the most AI-enabled companies in the world.” That description is Armstrong’s assessment rather than an independently measured ranking.
Rob Witoff returns to a role shaped by Coinbase’s early years
Witoff first joined Coinbase in 2014 and worked there until 2017. Coinbase said he led security and infrastructure, became chief architect and helped build some of the exchange’s earliest systems. He later founded institutional crypto custody company Unit 410, which Coinbase acquired.
Witoff said his interest in Bitcoin began in 2009. He recalled that Coinbase initially supported one cryptocurrency, used a single codebase and ran with a small engineering team. The account provides historical context from the incoming executive, although Coinbase has not independently detailed every technical claim in the July 27 post.
The company brought him back in December 2024 as head of platform and a member of the executive team. Witoff said his latest “tour of duty” began with a goal of making Coinbase “the best place in the world to build.” That remains a forward-looking management objective.
Coinbase CTO appointment comes during an AI overhaul
The promotion follows a broad change in how Coinbase develops software and organises teams. In May, the company announced plans to reduce its workforce by about 14%, or roughly 700 roles, while flattening management and building smaller teams around AI tools.
Armstrong said AI allowed engineers to complete work in days that previously took teams weeks. He also outlined experiments with “one person teams” combining engineering, product and design work. Those plans describe Coinbase’s intended operating model; their long-term effect on output, costs and staff workloads is not yet established.
Coinbase later said nearly all newly merged code had become AI-generated and human-reviewed. Its July engineering report said the share rose from 5.7% in the first quarter of 2025 to roughly 100% by mid-2026, while maintaining human review and compliance controls.
Witoff inherits reliability and security responsibilities
The CTO will oversee technology while Coinbase expands derivatives, stablecoin payments, prediction markets and services for AI agents. Each product increases the need for dependable infrastructure, security controls and fast incident response.
Coinbase experienced a roughly 50-minute service disruption on July 14 after a routine configuration update affected a shared production cluster. Transfers, card payments and some onchain services were interrupted. The company said customer funds were not at risk and later announced new deployment safeguards and recovery procedures.
Witoff’s background in security, architecture and platform engineering gives him direct experience with those areas. However, Coinbase has not published new performance targets, budget commitments or a separate technology roadmap tied to his appointment.
Leadership changes continue across Coinbase
The CTO appointment follows another executive transition. Chief Legal Officer Paul Grewal notified Coinbase on July 8 that he would leave his post on July 31. Molly Abraham is expected to become general counsel and corporate secretary, while Grewal will serve as an adviser through October.
As crypto.news previously reported, Coinbase’s May restructuring placed AI-native development at the centre of its operating plan. In related coverage, crypto.news reported that Coinbase had launched tools allowing authorised AI agents to trade, make payments and perform financial tasks.
Coinbase plans quarterly reviews of its AI-focused engineering interview process and 45-day and 90-day assessments for new hires. The next test for Witoff will be whether the company can keep releasing products quickly while maintaining security, reliability and regulatory controls.


It raised $400 million in June through a private placement of convertible preferred shares and warrants. The preferred shares, priced at $53 each, converted into common stock upon completion of the listing. Investors agreed not to transfer the securities below $70 until six months after the listing, according to the filing.
Ionic decommissioned bitcoin mining at its Ward County, Texas, site in December and committed its 234 MW of capacity to Nscale under a 126-month lease carrying $1.95 billion in contracted revenue, according to the registration statement.
The company said it expects as much as $195 million in revenue this year, with more than 90% coming from infrastructure leasing. It held 2,815.6 bitcoin worth $192.1 million and had no debt as of March 31.


Uzbekistan has established a special crypto mining zone across Karakalpakstan, introducing tax incentives, expanded power options, and a dedicated regulatory framework to attract licensed mining companies.
Summary
- Uzbekistan has launched the Beshkala Mining Valley as a regulated crypto mining zone across Karakalpakstan
- Licensed miners can use grid power, renewable energy, and hydrogen while receiving tax exemptions through 2035
- Mining companies must keep crypto sale proceeds in Uzbek banks and operate under state licensing rules
- The project allows miners to reuse excess heat for greenhouse farming as part of the regional development plan.
Under a presidential resolution that took effect on April 20, Uzbekistan has designated the entire Republic of Karakalpakstan as the Beshkala Mining Valley, creating a regulated environment for cryptocurrency mining while linking the initiative to the region’s economic development plans.
The resolution allows licensed mining companies operating within the zone to use electricity from the national grid, renewable energy sources such as solar power, and hydrogen-based power generation. It also creates a legal pathway for miners to sell their digital assets through Uzbekistan’s licensed crypto exchanges, foreign trading platforms, direct agreements, or by converting them into other liquid crypto assets.
Companies participating in the program must transfer revenue from crypto asset sales to bank accounts held in Uzbekistan, a requirement intended to keep transactions within the country’s regulated financial system while maintaining oversight of mining-related income.
Uzbekistan has expanded the crypto mining framework
Only legal entities registered in Karakalpakstan will qualify for resident status within the Beshkala Mining Valley. Businesses seeking to operate there must first obtain resident status through the zone’s directorate before applying for a crypto mining license issued under the supervision of the National Agency for Perspective Projects, the authority responsible for regulating the sector.
A dedicated directorate will oversee the management of the mining valley and process applications from prospective operators. Besides regulating mining activity, the administration will supervise implementation of the project’s development policies across the region.
Mining companies will also be permitted to reuse excess heat generated by their equipment for greenhouse farming on agricultural land, creating an additional use for energy produced during mining operations.
The resolution exempts income earned from mining activities from taxes and mandatory payments until Jan. 1, 2035, providing one of the main financial incentives for companies considering investment in the zone.
Crypto miners can use more than solar power
The latest framework also changes part of Uzbekistan’s previous mining policy.
Earlier licensing rules introduced in October 2023 required miners to obtain official authorization before operating and largely limited mining activities to electricity generated from solar power, except where legislation provided otherwise.
Under the new framework for the Beshkala Mining Valley, approved residents can instead draw power from the unified electricity grid alongside renewable energy and hydrogen-based generation. The updated approach gives operators more flexibility while preserving the country’s licensing requirements for crypto mining businesses.
Uzbek law continues to define crypto mining as the computational process used to maintain distributed ledgers by validating blocks and preserving network integrity. The activity remains restricted to legal entities rather than individual miners.
Mining revenue will remain inside Uzbekistan
Alongside operational rules, the government has tightened financial requirements governing proceeds from crypto mining.
Residents of the mining valley may sell mined digital assets through domestic exchanges, overseas trading platforms, direct contracts, or by exchanging them for other liquid crypto assets. Regardless of where the assets are sold, proceeds must ultimately be transferred to bank accounts located in Uzbekistan.
The framework is intended to keep mining-related revenue within the domestic banking system while allowing companies to access international cryptocurrency markets.
According to an earlier presidential decree signed on April 17 and effective from April 20, residents of the mining zone are also required to pay a monthly fee equal to 1% of mining income to the zone’s directorate, even as they benefit from tax exemptions running through the beginning of 2035.
Karakalpakstan remains central to investment plans
Creation of the Beshkala Mining Valley forms part of Uzbekistan’s ongoing efforts to attract investment into Karakalpakstan, a region that has remained a priority for economic development initiatives.
Government plans have linked the mining zone with improvements in regional living standards while encouraging more efficient use of renewable energy resources through regulated crypto mining projects.
The mining initiative follows another technology-focused program launched for Karakalpakstan in 2025, when Uzbekistan approved a separate tax-free zone for artificial intelligence and data center projects. That program offered discounted electricity prices and tax incentives to foreign investors, with reports stating that investments of at least $100 million could qualify for exemptions from taxes and customs duties until 2040.
Officials said the AI and data center project was designed to attract more than $1 billion in foreign investment by 2030, placing the new crypto mining zone within a series of long-term development initiatives targeting the region.


Russia’s Federal Security Service (FSB) charged Telegram founder Pavel Durov with aiding terrorist activity and placed him on an international wanted list, the agency said Wednesday.
The FSB accused Telegram of failing to remove channels, chats and bots allegedly used by Ukrainian intelligence and extremist groups to coordinate sabotage, attacks and cyber fraud inside Russia, according to Interfax.
Durov charges carry a sentence that could lead to life imprisonment. The FSB did not say whether Russia had requested an Interpol Red Notice, which would not, in itself, constitute an international arrest warrant.
The case escalates an investigation opened in February after Russia began restricting Telegram’s operations. The platform has been fined more than 100 million rubles ($1.25 million) this year, primarily for failing to remove content prohibited under Russian law, Interfax reported.
Telegram is one of crypto’s largest distribution platforms, hosting project communities, trading groups, bots and blockchain-based Mini Apps.


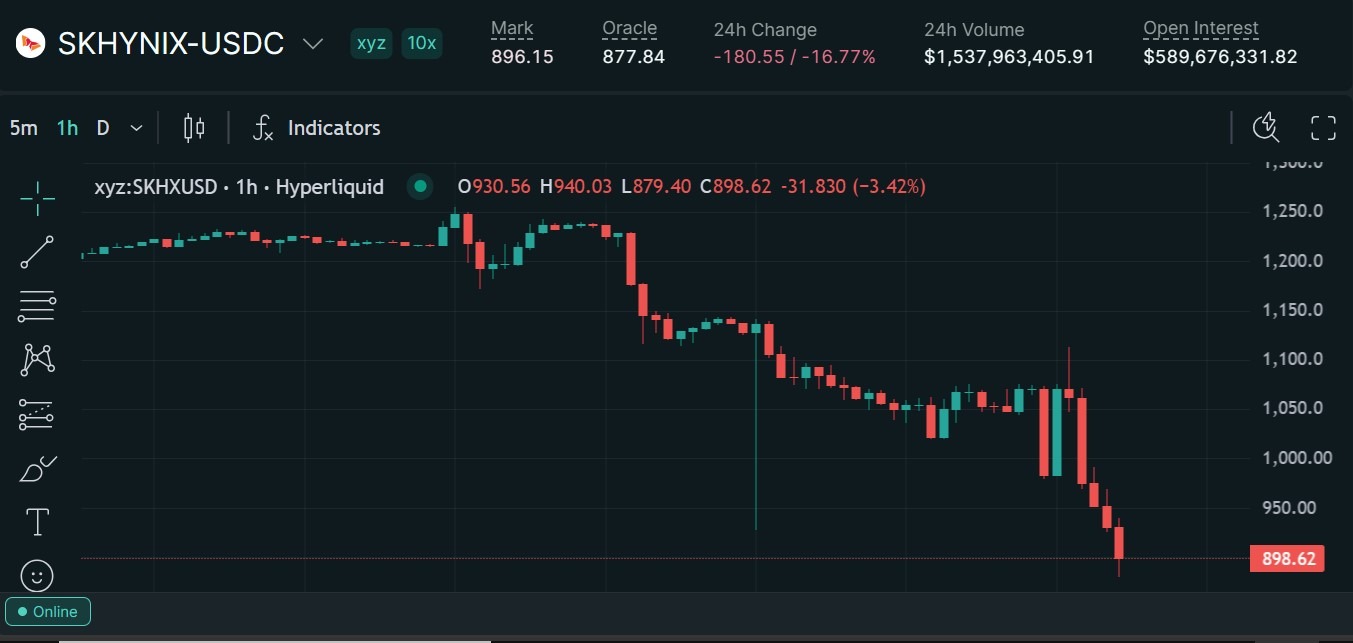
A trader realized a $2.2 million gain during this week’s SK Hynix liquidation incident on Hyperliquid.
Trade.xyz, the team that operates the market, will now cover losses tied to the same event. It maintains that the oracle systems performed as specified.
Trader Banks $2.2 Million While 960 Accounts Get Liquidated
According to Arkham, the trader, Stately, realized approximately $2.2 million in profit after part of his short position in SK Hynix was automatically reduced during an auto-deleveraging (ADL) event during a liquidation cascade.
The trader remains short SK Hynix with an open position worth $13.36 million, which now shows an additional $2.1 million in unrealized gains.
Follow us on X to get the latest news as it happens
The liquidation stems from a sharp decline in the SK Hynix perpetual contract, which fell 17.9%. BeInCrypto reported that the move triggered the liquidation of approximately $57.4 million in long positions across 960 accounts.
It is worth noting that the SK Hynix perpetual contract was launched by Trade.xyz under Hyperliquid’s HIP-3 framework, rather than by Hyperliquid itself. In a post on X, Trade.xyz addressed the incident and outlined the steps it plans to take in response.
The team said the SKHYNIX mark price fell from $1,127.90 to $917.25 at 23:01 UTC on July 27. According to the platform, the price was derived from an executed trade that was relayed by multiple independent data providers.
“The XYZ oracle was live in external pricing and tracking that venue, which serves as the primary Korean pre-market venue. The oracle system worked as intended according to its specification,” the post read.
To address the liquidation incident, the platform said it would cover liquidation losses attributable to the pricing anomaly. Eligibility rules will follow, and it expects distributions within days.
Trade.xyz framed the payout as a one-time discretionary decision rather than a precedent. It also plans to revisit how it forms prices, including signals from its own order books.
Subscribe to our YouTube channel to watch leaders and journalists provide expert insights
The post Trader Walks Away With $2.2 Million After SK Hynix Perp Crash appeared first on BeInCrypto.


The UK Financial Conduct Authority has identified cross-border payments as the strongest practical application for stablecoins after gathering feedback from banks, payment companies and crypto firms during its Stablecoin Sprint.
Summary
- FCA participants identified cross border payments as the strongest current use case for stablecoins, particularly in markets with limited access to U.S. dollars.
- The regulator said UK consumers have little incentive to switch payment methods, though merchants could benefit from lower costs and faster settlement.
- Findings from the Stablecoin Sprint have informed the FCA’s stablecoin issuer rules and will shape future policy for stablecoin payments.
- The March sprint and May trade finance roundtable brought together banks, payment firms, stablecoin issuers and fintech companies to examine payment and programmable finance use cases.
According to the UK Financial Conduct Authority, participants in its Stablecoin Sprint said stablecoins currently offer the clearest value in cross-border payments, especially in markets where access to U.S. dollars remains limited, while consumer adoption for everyday retail payments in the UK is likely to develop more slowly because existing payment systems already provide fast and low-cost transactions.
The regulator published the findings from the policy sprint, held in March 2026, alongside insights from a trade finance roundtable conducted in May. Around 75 representatives from banks, payment service providers, merchant acquirers, fintech companies, infrastructure providers, stablecoin issuers and industry groups attended the two-day event, while another 30 participants later discussed programmable payments in trade finance.
The exercise forms part of the FCA’s work on stablecoin payment regulation after it finalized rules for UK-issued stablecoins on June 30. Those rules require issuers to fully back stablecoins with reserve assets and redeem tokens at par, while the regulator said feedback gathered during the sprint will continue shaping future policy for stablecoin payments.
Stablecoin payments offer the strongest case in cross-border transfers
During the discussions, participants agreed that cross-border transfers present the strongest commercial opportunity for stablecoins because they can reduce settlement delays and improve access to dollar-based payments in countries where banking infrastructure remains limited.
The FCA said participants drew a distinction between emerging markets and established payment corridors. In mature markets where international payment services are already efficient and relatively inexpensive, firms considered the advantages of stablecoins less pronounced.
Domestic retail payments generated a different assessment. Participants told the regulator that UK consumers have little reason to replace existing payment methods because bank transfers and card payments are already widely available, inexpensive and completed quickly.
Businesses, however, could still benefit from stablecoin payments. According to the FCA, merchants identified lower transaction costs and faster settlement as potential advantages, particularly where payment delays or intermediary fees remain an issue.
Trade finance discussions held in May also examined programmable payments, with participants exploring how smart contract-based settlement could support commercial transactions through automated payment execution.
The latest findings build on the FCA’s wider crypto regulatory framework published on June 30, which established the next phase of the UK’s digital asset regime.
Under those rules, firms seeking to conduct regulated crypto activities will be able to apply for authorization from Sept. 30, 2026, before the full regime takes effect on Oct. 25, 2027. The framework covers trading platforms, custodians, staking providers and stablecoin issuers, while existing anti-money laundering registrations will not automatically transition into the new licensing system.
The FCA also adjusted part of its stablecoin framework after industry feedback. Final rules lowered the proposed capital requirement for stablecoin issuers to 1% of issued value from an earlier 2% proposal, with Executive Director for Payments and Digital Finance David Geale previously saying the regulator revised the requirement after reviewing evidence submitted by industry participants.
Most sterling-denominated stablecoins will remain under FCA supervision, while tokens considered systemically important would fall under oversight by the Bank of England.
Industry feedback has influenced earlier UK proposals
The Stablecoin Sprint findings follow several months of consultation between regulators and industry participants over how Britain should supervise fiat-backed digital assets.
In May, the Bank of England said it was reviewing parts of its proposed stablecoin framework after digital asset firms argued that reserve requirements and temporary holding limits could reduce the commercial viability of pound-backed stablecoins.
The central bank had proposed requiring issuers to keep at least 40% of reserves in non-interest-bearing deposits at the Bank of England while introducing temporary limits on individual and corporate holdings during an initial rollout period.
According to comments reported at the time, industry participants argued that ownership caps would be difficult to enforce across wallets and trading venues, while reserve requirements that generated no interest income could materially reduce issuer profitability.
Bank of England Deputy Governor Sarah Breeden said the central bank was reassessing whether those temporary holding limits remained necessary and whether reserve requirements should be adjusted.
The policy debate has also extended beyond domestic regulation. Bank of England Governor Andrew Bailey warned in May that the international growth of dollar-backed stablecoins could require closer coordination between regulators and described future discussions with the United States over global standards as a likely point of negotiation.
FCA also links stablecoins with programmable finance
Outside payments policy, the FCA has recently connected stablecoins with emerging artificial intelligence systems capable of carrying out financial decisions without continuous human involvement.
In its July review on the future of retail financial services, the regulator said autonomous AI agents managing payments, investments and savings accounts could increase demand for programmable digital money because conventional banking infrastructure may struggle to support machine-speed financial transactions.
The report identified stablecoins and tokenized bank deposits as payment infrastructure capable of supporting automated settlement through distributed ledger technology while maintaining that firms cannot transfer legal accountability to AI systems.


Every dollar Robinhood Chain earns, a tenth goes to a DAO treasury controlled by strangers. The arrangement has been covered a dozen times as good news for Arbitrum’s token.
Summary
- Robinhood Chain runs on Arbitrum’s Orbit stack, and under the Arbitrum Expansion Program every Orbit chain settling outside Arbitrum One routes 10% of net protocol revenue back to the Arbitrum ecosystem.
- The split is fixed: 8% to the Arbitrum DAO treasury, controlled by ARB tokenholders, and 2% to the Arbitrum Developer Guild.
- The figures are now real, no longer theoretical. Robinhood Chain has passed $2 million in cumulative revenue since its July 1 launch, with roughly $200,000 flowing to Arbitrum, and Arbitrum reported the network earning over $800,000 in a single seven-day stretch, annualizing near $42 million.
- The payment is calculated on net revenue after operating costs, applies to sequencer profits, and may extend to MEV capture if the chain adopts Arbitrum’s Timeboost mechanism.
- Every version of this story published so far has been written for ARB holders. The unexamined half is what the arrangement costs the brokerage, and why a company with a $2.2 billion war chest chose to pay it.
Nobody has asked the other question: what a licensed brokerage that spent a decade removing intermediaries bought by becoming a tenant.
There is a particular irony in a company whose entire founding pitch was the removal of intermediaries acquiring one. Robinhood spent a decade telling retail investors that the layers between them and the market were extractive, that commissions were a tax on participation, and that the right architecture was fewer parties taking a cut. On July 1 it launched its own blockchain, the most complete expression of that philosophy available: a settlement layer it controls, sequencing it operates, and fee revenue it collects. And under the terms of the technology stack it chose, a tenth of what that chain nets goes to somebody else. Specifically, 8% goes to a treasury controlled by holders of a governance token, and 2% funds a developer guild, both under an arrangement called the Arbitrum Expansion Program. The mechanism has been reported repeatedly since Offchain Labs disclosed it, always from one direction: what it means for ARB, why the token rallied, how a governance asset acquired a revenue claim. This piece asks the question those pieces did not. What did Robinhood buy, what is it paying, and does the arithmetic work.
What the arrangement actually is
The mechanics are specific enough to matter, and they have been reported loosely in several places.
The Arbitrum Expansion Program applies to any Layer 2 or Layer 3 chain built with Arbitrum’s Orbit toolkit that settles outside Arbitrum One or Arbitrum Nova. Those chains route 10% of net protocol revenue back to the Arbitrum ecosystem. Of that 10%, eight percentage points flow to the Arbitrum DAO treasury, which ARB tokenholders control through governance, and two percentage points fund the Arbitrum Developer Guild, which supports tooling, grants, and protocol work.
Three details in that description carry weight and are frequently dropped.Net, not gross. The calculation runs on revenue remaining after network operating costs, which ties the payment to a chain’s actual profitability instead of raw transaction throughput. That is materially friendlier to an operator than a gross fee would be, and it means a chain running at thin margins pays little regardless of volume.
Sequencer profits are the base. The revenue subject to sharing comes from the entity that orders and processes transactions, which on Robinhood Chain is Robinhood. That is the same revenue line this publication has examined as the core economics of any Layer 2, and it is precisely the line the chain exists to capture.
MEV may be included. If the chain adopts Timeboost, Arbitrum’s mechanism for capturing maximal extractable value from transaction ordering, those revenues could fall under the sharing arrangement as well. Whether Robinhood adopts it is a live question with real dollars attached, since ordering advantages on a chain hosting tokenized equities are worth considerably more than on a memecoin venue.
For contrast, Arbitrum One sends 100% of its own fees to the Arbitrum treasury. The Orbit arrangement is the lighter one, which is the point: it is the price of using the stack without settling on the flagship chain.
The numbers, now that they exist
For the first three weeks this was an abstraction. It is not anymore.
Robinhood Chain has passed $2 million in cumulative revenue since its July 1 launch, with approximately $200,000 routed to the Arbitrum ecosystem under the program. That is a clean 10%, and it is the first hard confirmation that the mechanism operates as described, not as an aspiration in a governance document.
Around that sit the throughput figures that produced it. The chain processed roughly 4 million transactions in its first week. Uniswap alone recorded $500 million in 24-hour volume on it. A single day in early July cleared $568 million. Within about two weeks the chain was clearing more than $800 million in daily decentralized exchange volume, briefly exceeding Ethereum’s, with roughly $3.9 billion across a week. Arbitrum reported the network earning over $800,000 in revenue across seven days, which annualizes near $42 million. Deposits crossed $600 million this week, rising 50% in seven days.
Now the distortion that every honest reading has to apply. The chain is running a 90-day gas subsidy, expiring around October, which means users are not paying the fees a mature chain would charge and the revenue figures are suppressed accordingly. Our audit of the chain’s first month documented how thoroughly that subsidy inflates activity metrics; it works in the opposite direction on revenue. The $42 million annualized figure is therefore both a real number and a floor, and the interesting reading comes after the subsidy lapses, when volumes and revenues both reprice. For broader context, crypto.news has also explained the subsidy distorting these numbers.
At current run rates, Arbitrum’s share is roughly $4 million a year. Against Robinhood’s quarterly revenue near $1.27 billion, that is a rounding error. Against the chain’s own economics, it is a tenth of everything.
What Robinhood bought
The arrangement only looks strange if you assume the alternative was free. It was not, and the alternatives are worth setting out because the choice reveals the strategy.
Build independently. A brokerage could commission a chain from scratch, own 100% of sequencer revenue, and pay nothing to anyone. The cost is time, engineering risk, and security. Rolling your own settlement layer means auditing it, defending it, and answering for it when something breaks, which for a regulated financial institution holding customer assets is not a theoretical exposure. It also means no ecosystem: no existing tooling, no bridges, no wallets that already work.
Use an existing chain. Deploy on Arbitrum One or Base or anywhere else, pay ordinary fees, capture nothing. This is what Robinhood actually did first, launching tokenized stock offerings on Arbitrum in 2025 before committing to its own chain, and the limitation is obvious: you are a tenant with no landlord’s economics and no control over the roadmap, the fee schedule, or who else gets to build next door.
Take the Orbit path. Get a chain you brand, control, and sequence, with Offchain Labs providing technical support, inheriting the Arbitrum ecosystem’s tooling and security assumptions, at the price of a tenth of net revenue. The launch specifications suggest what that bought: 100-millisecond block times, EVM compatibility, ETH as the gas asset instead of a new token nobody asked for, and a chain live and processing millions of transactions within a week of announcement.
Read that way, the 10% is a build-versus-buy decision resolved in favour of speed, and for a public company with a stock to defend and a crypto revenue line that fell 47% year over year in the first quarter, speed was plausibly worth more than margin. Our earnings analysis covered why the timing mattered so much.
The uncomfortable version of the same read is that Robinhood, having concluded that owning the rails is where the value sits, does not actually own them. It leases them, with favourable terms, from a decentralized organization whose token holders vote on what to do with the proceeds.
The tenant problem
That last sentence is not a rhetorical flourish. It describes a governance relationship that no traditional financial infrastructure arrangement resembles, and it has consequences nobody has priced.
The 8% going to the Arbitrum DAO treasury is controlled by ARB tokenholders through governance votes. Those holders decide how the money is deployed. They also, through the same governance process, hold influence over the direction of the technology stack Robinhood’s chain depends on. A licensed brokerage supervised by federal regulators is now a revenue contributor to, and a dependent of, an entity whose decision-making runs through token voting by anonymous participants.
For most crypto-native businesses that is unremarkable. For a public company that files with the SEC, answers to a board, and holds customer assets under regulatory obligation, it is a novel counterparty structure. The questions it raises are practical, not philosophical: what happens if governance votes to change the fee arrangement, what recourse exists if the stack’s roadmap diverges from the tenant’s needs, and how a regulated institution documents dependency on a DAO in its risk disclosures.
There is also a competitive dimension. The Orbit program applies universally, meaning any competitor can take the same path on the same terms. The arrangement Robinhood entered is not exclusive and confers no advantage over the next brokerage to build a chain, which limits how much of a moat the whole exercise creates. What it does create is a template, and the rest of the industry has noticed: our coverage of the tokenized-equity race documented Nasdaq building blockchain share issuance with Kraken’s parent and ICE working with OKX, none of which requires anyone to build from scratch.
Does the arithmetic work
Set aside the framing and ask the commercial question, because the answer determines whether any of this matters.
Roughly $42 million annualized in chain revenue, before the subsidy expires, against $4 million to Arbitrum. Against a company whose quarterly revenue runs near $1.27 billion, the chain contributes something in the low single-digit percentage range of annual revenue at current run rates, and the Arbitrum payment is immaterial to the parent by any measure.
Which means the fee share is not the story financially. It is the story structurally, because it clarifies what the chain actually is. Robinhood did not build a chain to earn sequencer fees; the numbers are too small relative to its brokerage business for that to be the motivation. It built one to control the settlement layer for tokenized equities, to avoid depending on a competitor’s infrastructure as that market develops, and to own the venue where its own products trade. Sequencer revenue is a byproduct, and 10% of a byproduct is a reasonable price for the option.
The test comes when the byproduct stops being small. If tokenized equities scale the way the DTCC’s entry into the same market suggests they might, and if Robinhood Chain hosts a meaningful share of that activity, the sequencer line grows and the 10% grows with it. A tenth of a rounding error is nothing. A tenth of a business is a negotiation, and the Arbitrum Expansion Program’s terms were set by the party that wrote them.
The precedent this sets
Strip out the two companies and the arrangement describes something the industry has been moving toward without naming: infrastructure providers taking a percentage of businesses they do not operate.
Arbitrum’s position under this model is closer to a franchise operator than a blockchain. It supplies the technology, the tooling, the security assumptions, and the developer support, and it collects a percentage of what franchisees earn across an expanding set of chains it did not build. Offchain Labs has been explicit that this is the strategy, framing enterprise adoption as the revenue thesis and noting that the flagship chain’s economics are separate. The model compounds with adoption in a way that grants and one-time licensing never do.
That has an obvious appeal for anyone holding the governance token, and it has a less obvious implication for everyone building on the stack. A percentage arrangement set at launch, when the tenant is small and the terms are generous, is an arrangement that becomes expensive precisely when the tenant succeeds. Ten percent of nothing costs nothing. Ten percent of a settlement layer hosting a meaningful share of tokenized equities is a real line item, and it is collected by a party whose consent the tenant needed at the start and whose terms the tenant did not write.
The comparison from outside crypto is the app store. Developers accepted a percentage when the platform was small and the alternative was no distribution, and spent the following decade in litigation and regulatory complaint about the rate. Nothing about the Arbitrum arrangement is coercive in that way, since alternatives genuinely exist and the terms are public. But the structural shape is familiar, and the history of platform percentages is that they are renegotiated by the largest tenants, eventually, loudly.
Robinhood is now among the largest tenants on this particular platform. Whether it ever behaves like one is a question for the quarter after the subsidy expires, when the numbers stop being small enough to ignore.
What to watch
The revenue line after October. The 90-day gas subsidy expires around then, and the first unsubsidized quarter is the only honest read on what the chain actually earns. Both volumes and revenues reprice, in opposite directions, and the net is unknown.
Whether Timeboost gets adopted. MEV capture on a chain hosting tokenized equities is worth real money, and adopting Arbitrum’s mechanism would likely bring those revenues under the sharing arrangement. The decision is a direct read on how Robinhood values ordering revenue against the cost of sharing it.
Disclosure in the filings. Whether the chain’s economics, including the Arbitrum arrangement, appear in Robinhood’s regulatory filings as a described dependency or a risk factor, and in what language. A public company documenting a revenue-sharing obligation to a DAO would be a first worth reading closely.
Whether the terms hold. The Expansion Program’s rates are set by Arbitrum governance. Any proposal to change them, in either direction, would test how much leverage a large Orbit tenant actually has, and Robinhood is now among the largest.
Competing chains on the same terms. Every brokerage that follows takes the same deal. If the tokenized-equity market fragments across several Orbit chains, the interesting question stops being what Robinhood pays and becomes what Arbitrum collects from an entire category it does not operate.
A final note on why the framing in the existing coverage matters more than it looks. Every account of this arrangement published so far was written for holders of a governance token, which meant the operative question was always whether the revenue share is large enough to justify a rally. That is a legitimate question and it produced accurate reporting. It also produced a blind spot, because a revenue share has two sides and only one of them was ever examined.
The side nobody covered is the one with the public company, the regulatory filings, the customer assets, and the board. Robinhood’s chain is now a material piece of its strategic story, its stock trades on the strength of that story, and the chain’s economics include a permanent obligation to an entity that no securities analyst covering the stock has any reason to have heard of. That gap between how crypto covers a deal and how equity markets would cover the same deal is where most of the useful analysis in this sector currently sits, and it is worth reading every ecosystem announcement with the question of who else is party to it. The same platform-ownership pattern is also visible in the same playbook in prediction markets, where distribution, licensing, and customer ownership intersect.
Frequently asked questions
What is the Arbitrum Expansion Program?
An arrangement under which any Layer 2 or Layer 3 chain built with Arbitrum’s Orbit technology stack, and settling outside Arbitrum One or Nova, routes 10% of its net protocol revenue back to the Arbitrum ecosystem. Of that, 8% goes to the Arbitrum DAO treasury controlled by ARB tokenholders, and 2% funds the Arbitrum Developer Guild.
How much has Robinhood Chain actually paid?
Roughly $200,000, against more than $2 million in cumulative chain revenue since the July 1 launch, which confirms the 10% rate operating in practice. Arbitrum separately reported the network earning over $800,000 in a single seven-day period, annualizing near $42 million, though those figures are suppressed by an ongoing gas subsidy.
Is the 10% calculated on gross or net revenue?
Net, after network operating costs, which ties the payment to a chain’s actual profitability rather than to transaction volume. The revenue base is sequencer profits, and if the chain adopts Arbitrum’s Timeboost mechanism for capturing value from transaction ordering, those revenues may fall under the arrangement as well.
Why did Robinhood not just build its own chain from scratch?
Time, risk, and ecosystem. Building independently means owning all the revenue and also owning the security, auditing, and defence of a settlement layer holding customer-adjacent assets, with no existing tooling, bridges, or wallet support. Orbit delivered a branded, controlled chain with 100-millisecond block times and technical support from Offchain Labs, live within a week, at the cost of a tenth of net revenue.
Does the payment matter financially to Robinhood?
Not currently. At present run rates the Arbitrum share is roughly $4 million a year against quarterly company revenue near $1.27 billion. The chain itself contributes a low single-digit share of annual revenue at best. The arrangement matters structurally rather than financially, because it defines what the chain is and who it depends on.
What is unusual about paying a DAO?
The counterparty structure. The 8% flowing to the Arbitrum DAO treasury is controlled by token holders voting through governance, and those same holders influence the roadmap of the technology stack Robinhood’s chain runs on. A federally regulated public company holding a revenue-sharing obligation to, and infrastructure dependency on, a decentralized organization is a novel arrangement with unsettled disclosure and risk-management questions.
Does this give Robinhood any advantage over competitors?
Not through the arrangement itself, which is available to anyone on identical terms. Any brokerage can build an Orbit chain and pay the same 10%. Robinhood’s advantages, if they hold, come from distribution and from operating the venue where its own products trade, and the tokenized-equity market is already attracting incumbent exchanges building comparable infrastructure.
What should investors watch?
The first unsubsidized quarter after the gas subsidy expires around October, whether Timeboost is adopted and MEV revenue enters the sharing arrangement, how the chain’s economics and the Arbitrum obligation appear in regulatory filings, and any governance proposal to change the Expansion Program’s rates. This is educational analysis, not investment advice.
Disclaimer: This article is for information and educational purposes only and does not constitute financial or investment advice. Revenue figures reflect third-party trackers and company statements available at the time of writing and are subject to revision, and chain activity is currently affected by a temporary fee subsidy. Nothing here is a recommendation to buy, sell, or hold any security or asset. Always do your own research. Information is accurate as of July 29, 2026.
Trade.xyz, an operator of onchain perpetual markets on Hyperliquid, said it will cover eligible liquidation losses after a price anomaly hit its contract tracking SK Hynix, a South Korean chipmaker and producer of high-bandwidth memory for artificial intelligence.
Trade.xyz said the SKHYNIX contract’s mark price fell from $1,127.90 to $917.25 at 23:01 UTC on Monday after an executed trade was relayed by multiple independent data providers. Eligibility requirements will be announced soon, with distributions expected in the coming days.
The SK Hynix contract ranks among Hyperliquid’s most active markets. On Wednesday, Hyperliquid data showed the contract had generated over $1.5 billion in 24-hour volume and held nearly $600 million in open interest at the time of writing.
Trade.xyz said its oracle was tracking the external venue used as the primary South Korean pre-market and had “worked as intended according to its specification.” It acknowledged traders’ frustration and described the reimbursement as a “one-time discretionary decision,” adding that it would review how prices are formed during extreme market events.
The platform did not disclose how many traders would qualify for reimbursement or the total amount it expects to distribute.

SK Hynix trading chart. Source: Hyperliquid
How the anomaly reached the perpetual market
Trade.xyz said the sharp move originated from an executed transaction on an external market rather than its own order book. Its SK Hynix oracle tracks the US dollar value of one SKHX common share by converting the underlying Korean won price using the prevailing exchange rate, according to its documentation.
The external print fed into the oracle and contributed to the contract’s mark-price move. Hyperliquid uses the mark price to value positions for margin purposes and determine when leveraged positions should be liquidated.
The platform said it is considering giving more weight to prices formed on its own order books, which it said now provide meaningful liquidity and market signals.
Related: Onchain commodity trading is here to stay, but liquidity remains an issue
Trade.xyz operates under Hyperliquid’s HIP-3 framework, which allows builders to launch perpetual contracts tied to assets with external price feeds.
The platform accounted for more than $22 billion of HIP-3’s first $25 billion in cumulative volume and later launched an officially licensed S&P 500 perpetual using S&P Dow Jones Indices data.
Magazine: How Hong Kong is turning tokenized bonds into real market infrastructure


Gabriel Perez, who was accused of profiting from Kalshi bets tied to President Donald Trump’s speeches, is no longer employed by the federal government.

AI digs through 3,700 accounts of dreams and waking life, finds method in the madness

North Yorkshire restaurant with jaw-dropping sea views
Varun Beverages shares jump 3% after Q1 PAT rises 15%, revenue grows 20%


-

 Fashion5 days ago
Weekend Open Thread: Brooks Brothers
-
 Sports3 days ago
Commonwealth Games boxing: Jadumani Singh seals dominant 5-0 win over Pakistan’s Sumama Rehman to enter quarter-finals | Commonwealth Games News
-

 Tech2 days ago
Intel is reversing course and bringing hyper-threading back to its server chips
-

 Crypto World6 days ago
Ethics, other provisions in crypto Clarity Act to be further discussed
-

 Politics2 days ago
Luke Littler dismantles Gerwyn Price to retain title in Blackpool
-

 Sports5 days ago
2026 3M Open leaderboard: Scottie Scheffler finds putter in Round 1, sits three back
-

 Politics1 day ago
The Part of the Electric Transition Nobody Wants to Discuss
-

 Fashion5 days ago
16 Dresses for the High Summer Event
-
 Entertainment5 days ago
A New Post-Apocalyptic Gundam Anime Series Blasts Into SDCC
-

 News Videos3 days ago
BITCOIN JUST ENTERED THIS CRITICAL ZONE…
-

 News Videos6 days ago
The Peugeot Family: How 200 Years of an “Old Money” Dynasty Died in A Boardroom
-

 Crypto World4 days ago
Ripple bought a bank in pieces. The $4 billion audit
-

 Politics3 days ago
Spain sweeps the board at 2026 World Cup with individual awards
-

 Business4 hours ago
Major shareholder moves on Canyon
-

 Crypto World3 days ago
XRP Ledger adds $2.6B as RWA inflows rank second
-

 Crypto World6 days ago
Uniswap (UNI) pushes deeper into tokenized RWAs with permissioned trading pools
-
 Entertainment15 hours ago
‘Stargate’ Creator’s New Sci-Fi Series Returns for Season 3 Tomorrow
-

 Tech4 days ago
Anthropic launches Claude Opus 5, a cheaper AI model for coding, agents and enterprise workflows
-
Crypto World6 days ago
SEC Agrees to Overhaul Recordkeeping After Settling Coinbase Lawsuit Over Gensler’s Lost Texts
-

 Business5 days ago
Alliance Entertainment Holding Corporation (AENT) Discusses Evolution Into Omnichannel Distribution and Fulfillment Platform for Media and Collectibles Transcript
You must be logged in to post a comment Login