
Crypto World
Bitcoin Hodlers Add 10% as BTC Lines Up a Run to $90,000
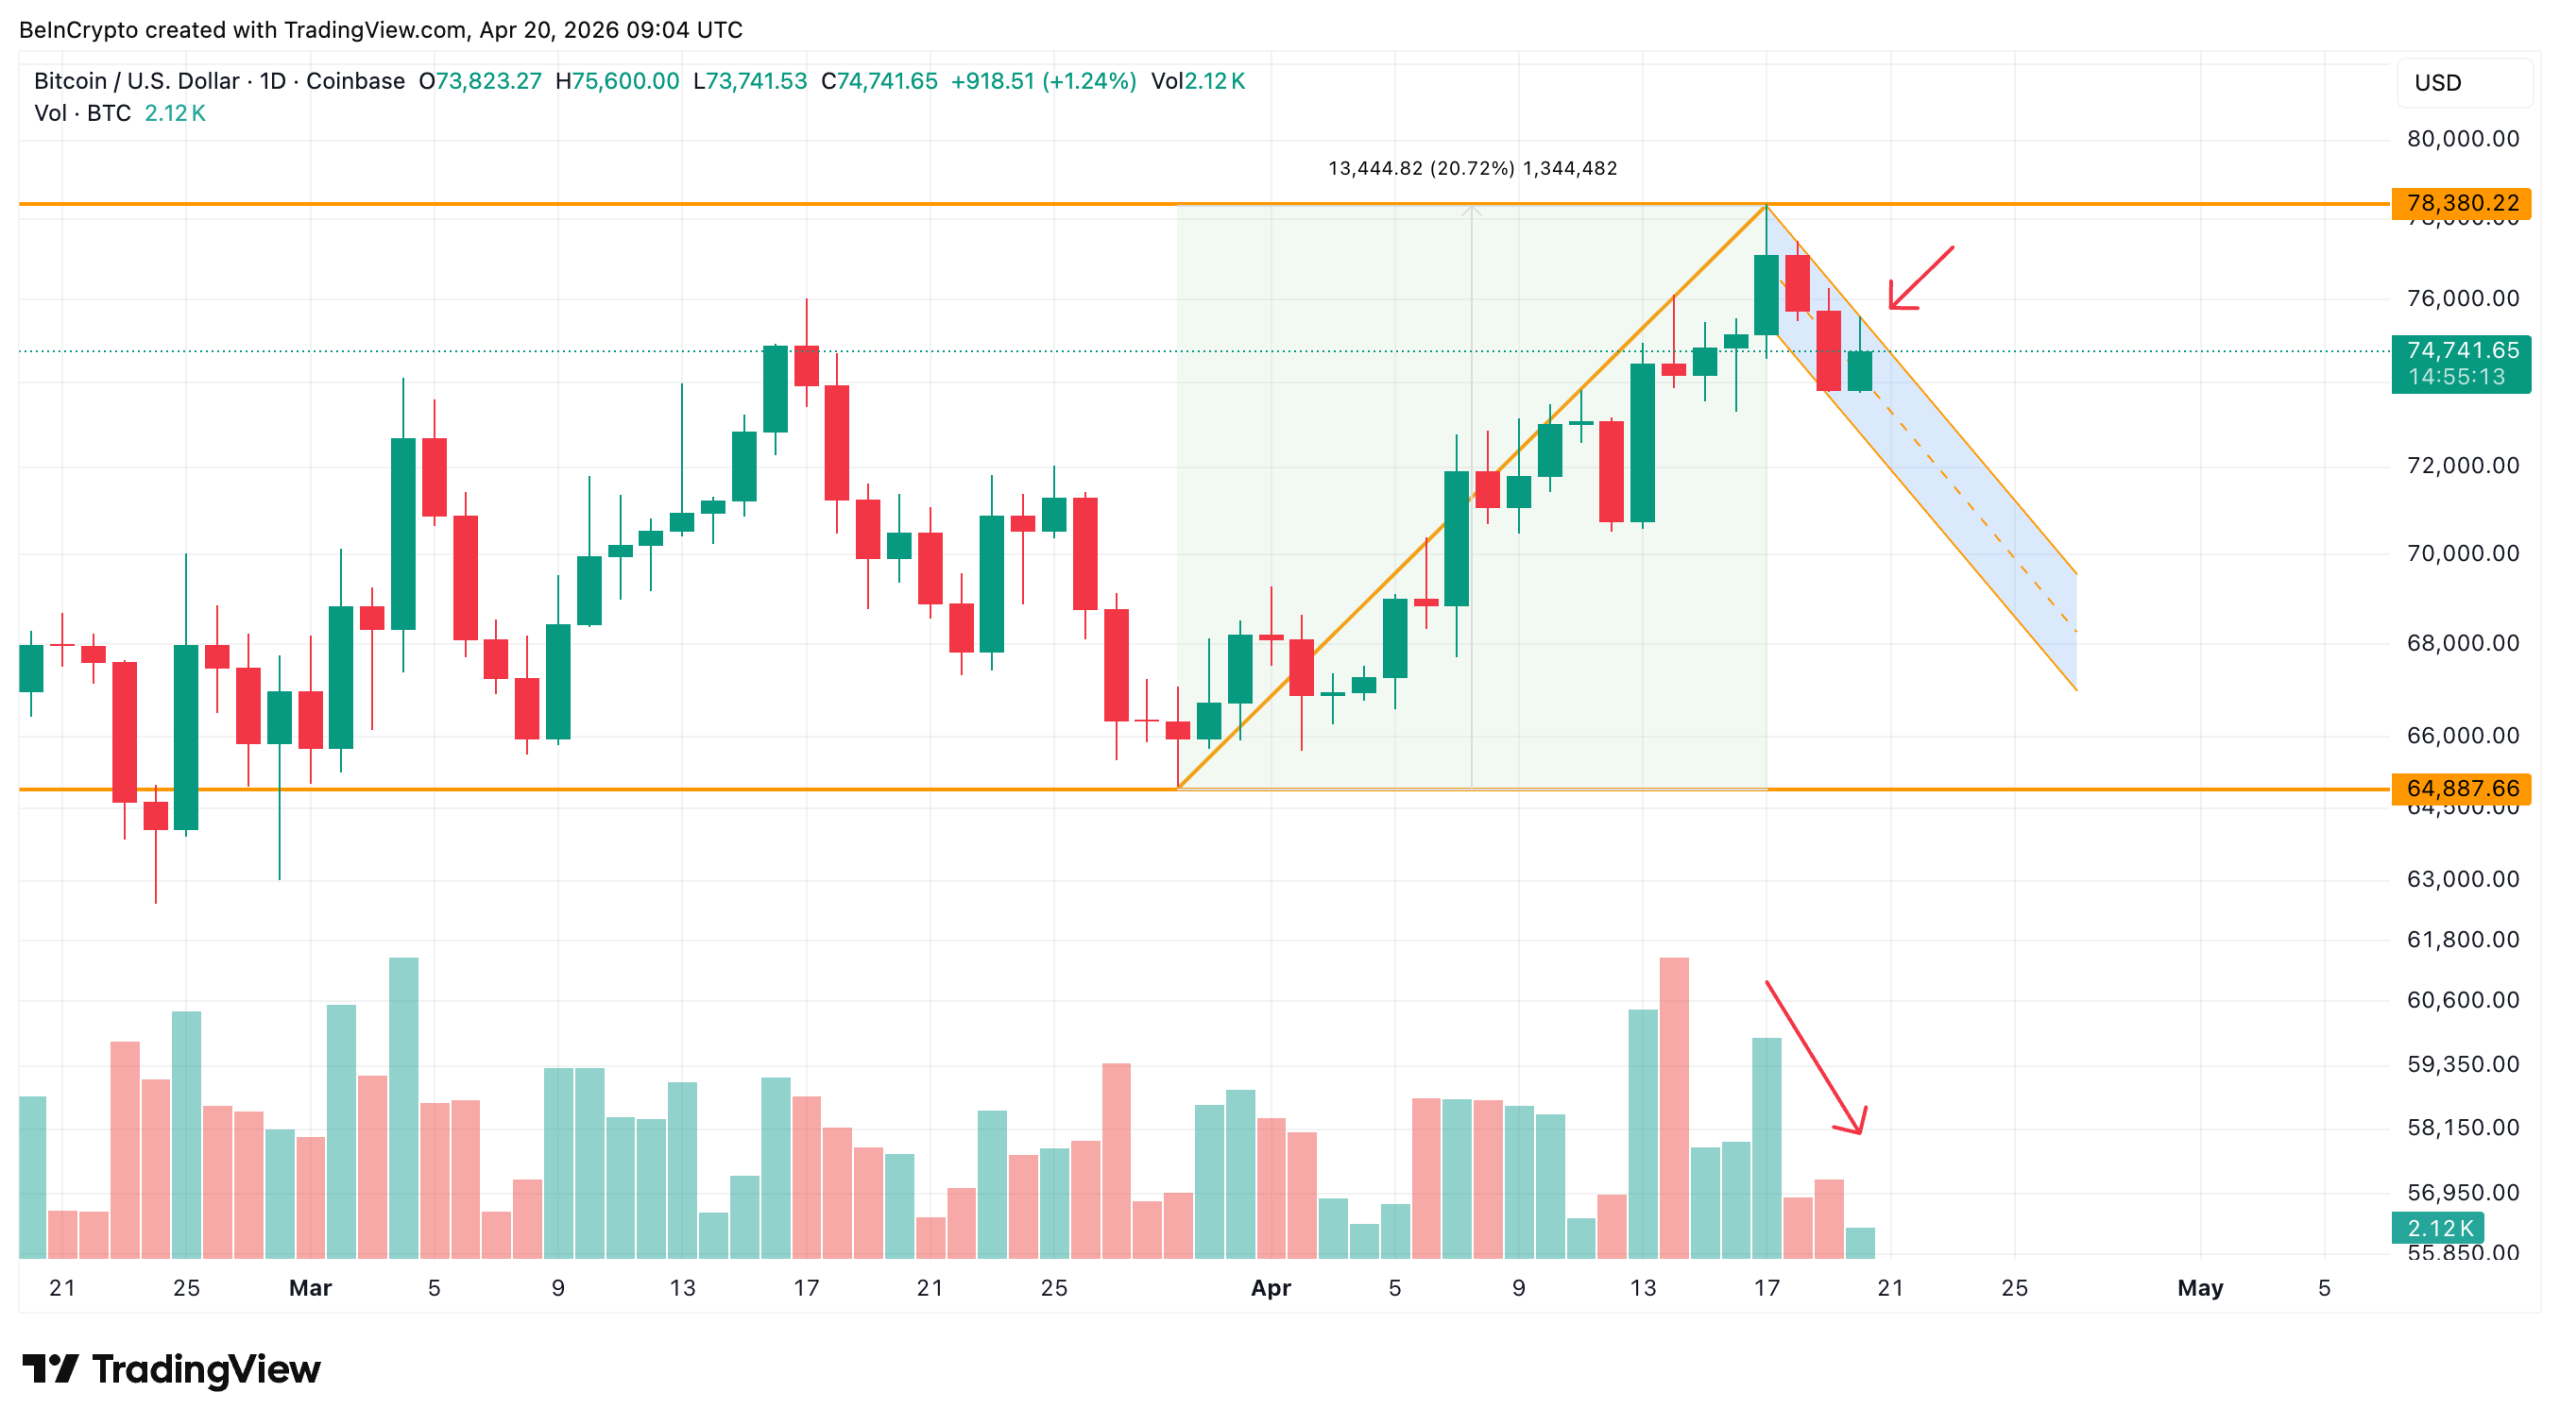
Bitcoin (BTC) price trades near $75,000, up marginally on the day, following a rejection near $78,380 on April 17.
The pullback has neutralized derivatives positioning, yet long-term holders have added to their stacks at an accelerating pace. That split has set up a narrow single-level decision for the days ahead.
Bitcoin Builds a Bull Flag After a 21% Rally From the March Low
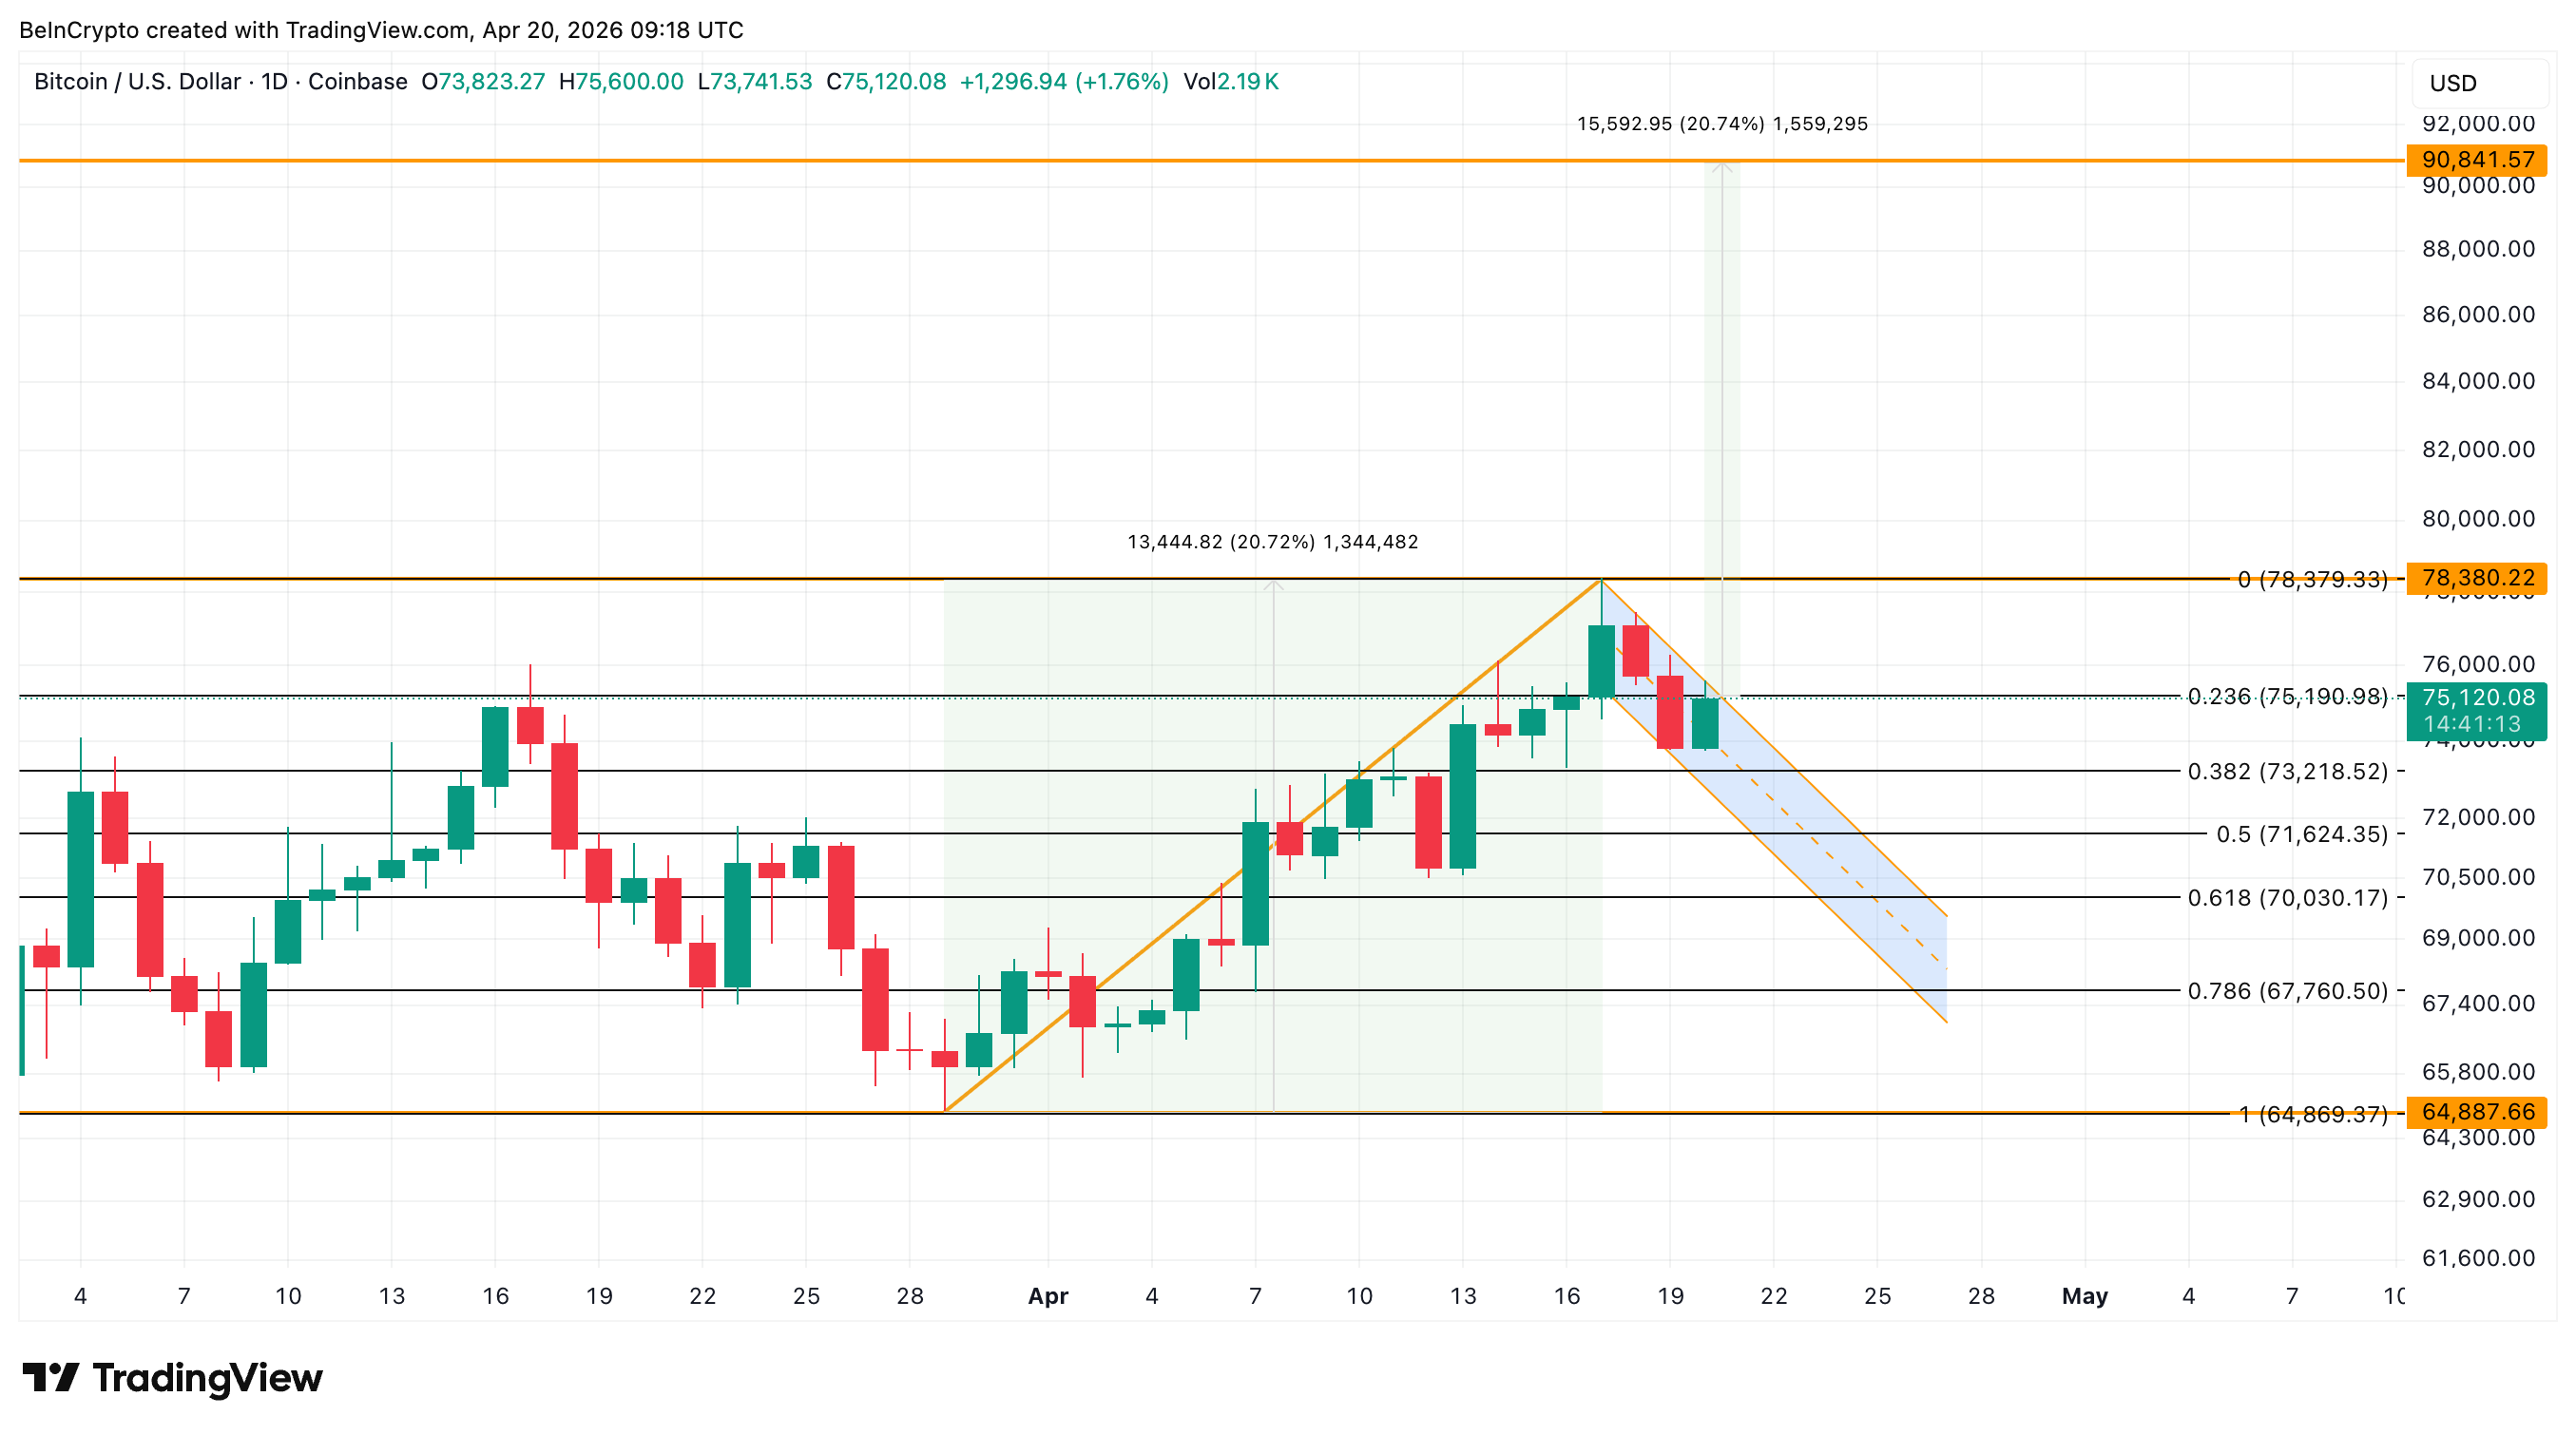
Bitcoin rallied 20.72% from its March 29 low to the April 17 peak at $78,380, a 13,444-point pole move in roughly three weeks. Since the peak, price has traded inside a descending parallel channel, the bull flag structure that typically signals continuation after a sharp advance.
The flag’s upper trendline has been tested twice in recent sessions, on April 18 and again on April 20. The last attempt printed a long upper wick. That wick marks the session where buyers pushed price into resistance and sellers took some control before the close.
Volume quality tells the same story. Buy-session volume inside the flag has come in below the prior sell-session volume, an asymmetry that reverses the usual bullish read. Volume compression inside a flag is normal. Volume compression where sellers keep outweighing buyers is a weaker signal.

Want more token insights like this? Sign up for Editor Harsh Notariya’s Daily Crypto Newsletter here.
The pattern itself is still intact. The execution against the ceiling, however, has not delivered the conviction bulls need for a first-attempt breakout. With spot volume sending mixed signals, the next question is whether derivatives positioning is filling the gap.
Open Interest Has Shed Nearly 10% Since the Flag Formed
Since the April 17 peak, Bitcoin open interest, the total dollar value of outstanding perpetual futures positions, has dropped from $30.46 billion to $27.44 billion. That is roughly a 10% reduction across three trading sessions.
The funding rate, the periodic payment between long and short positions in perpetual contracts, has moved from -0.014% on April 17 to -0.002% today. Negative funding means shorts pay longs. The shift toward zero suggests short positioning has been closing out or getting forced out.
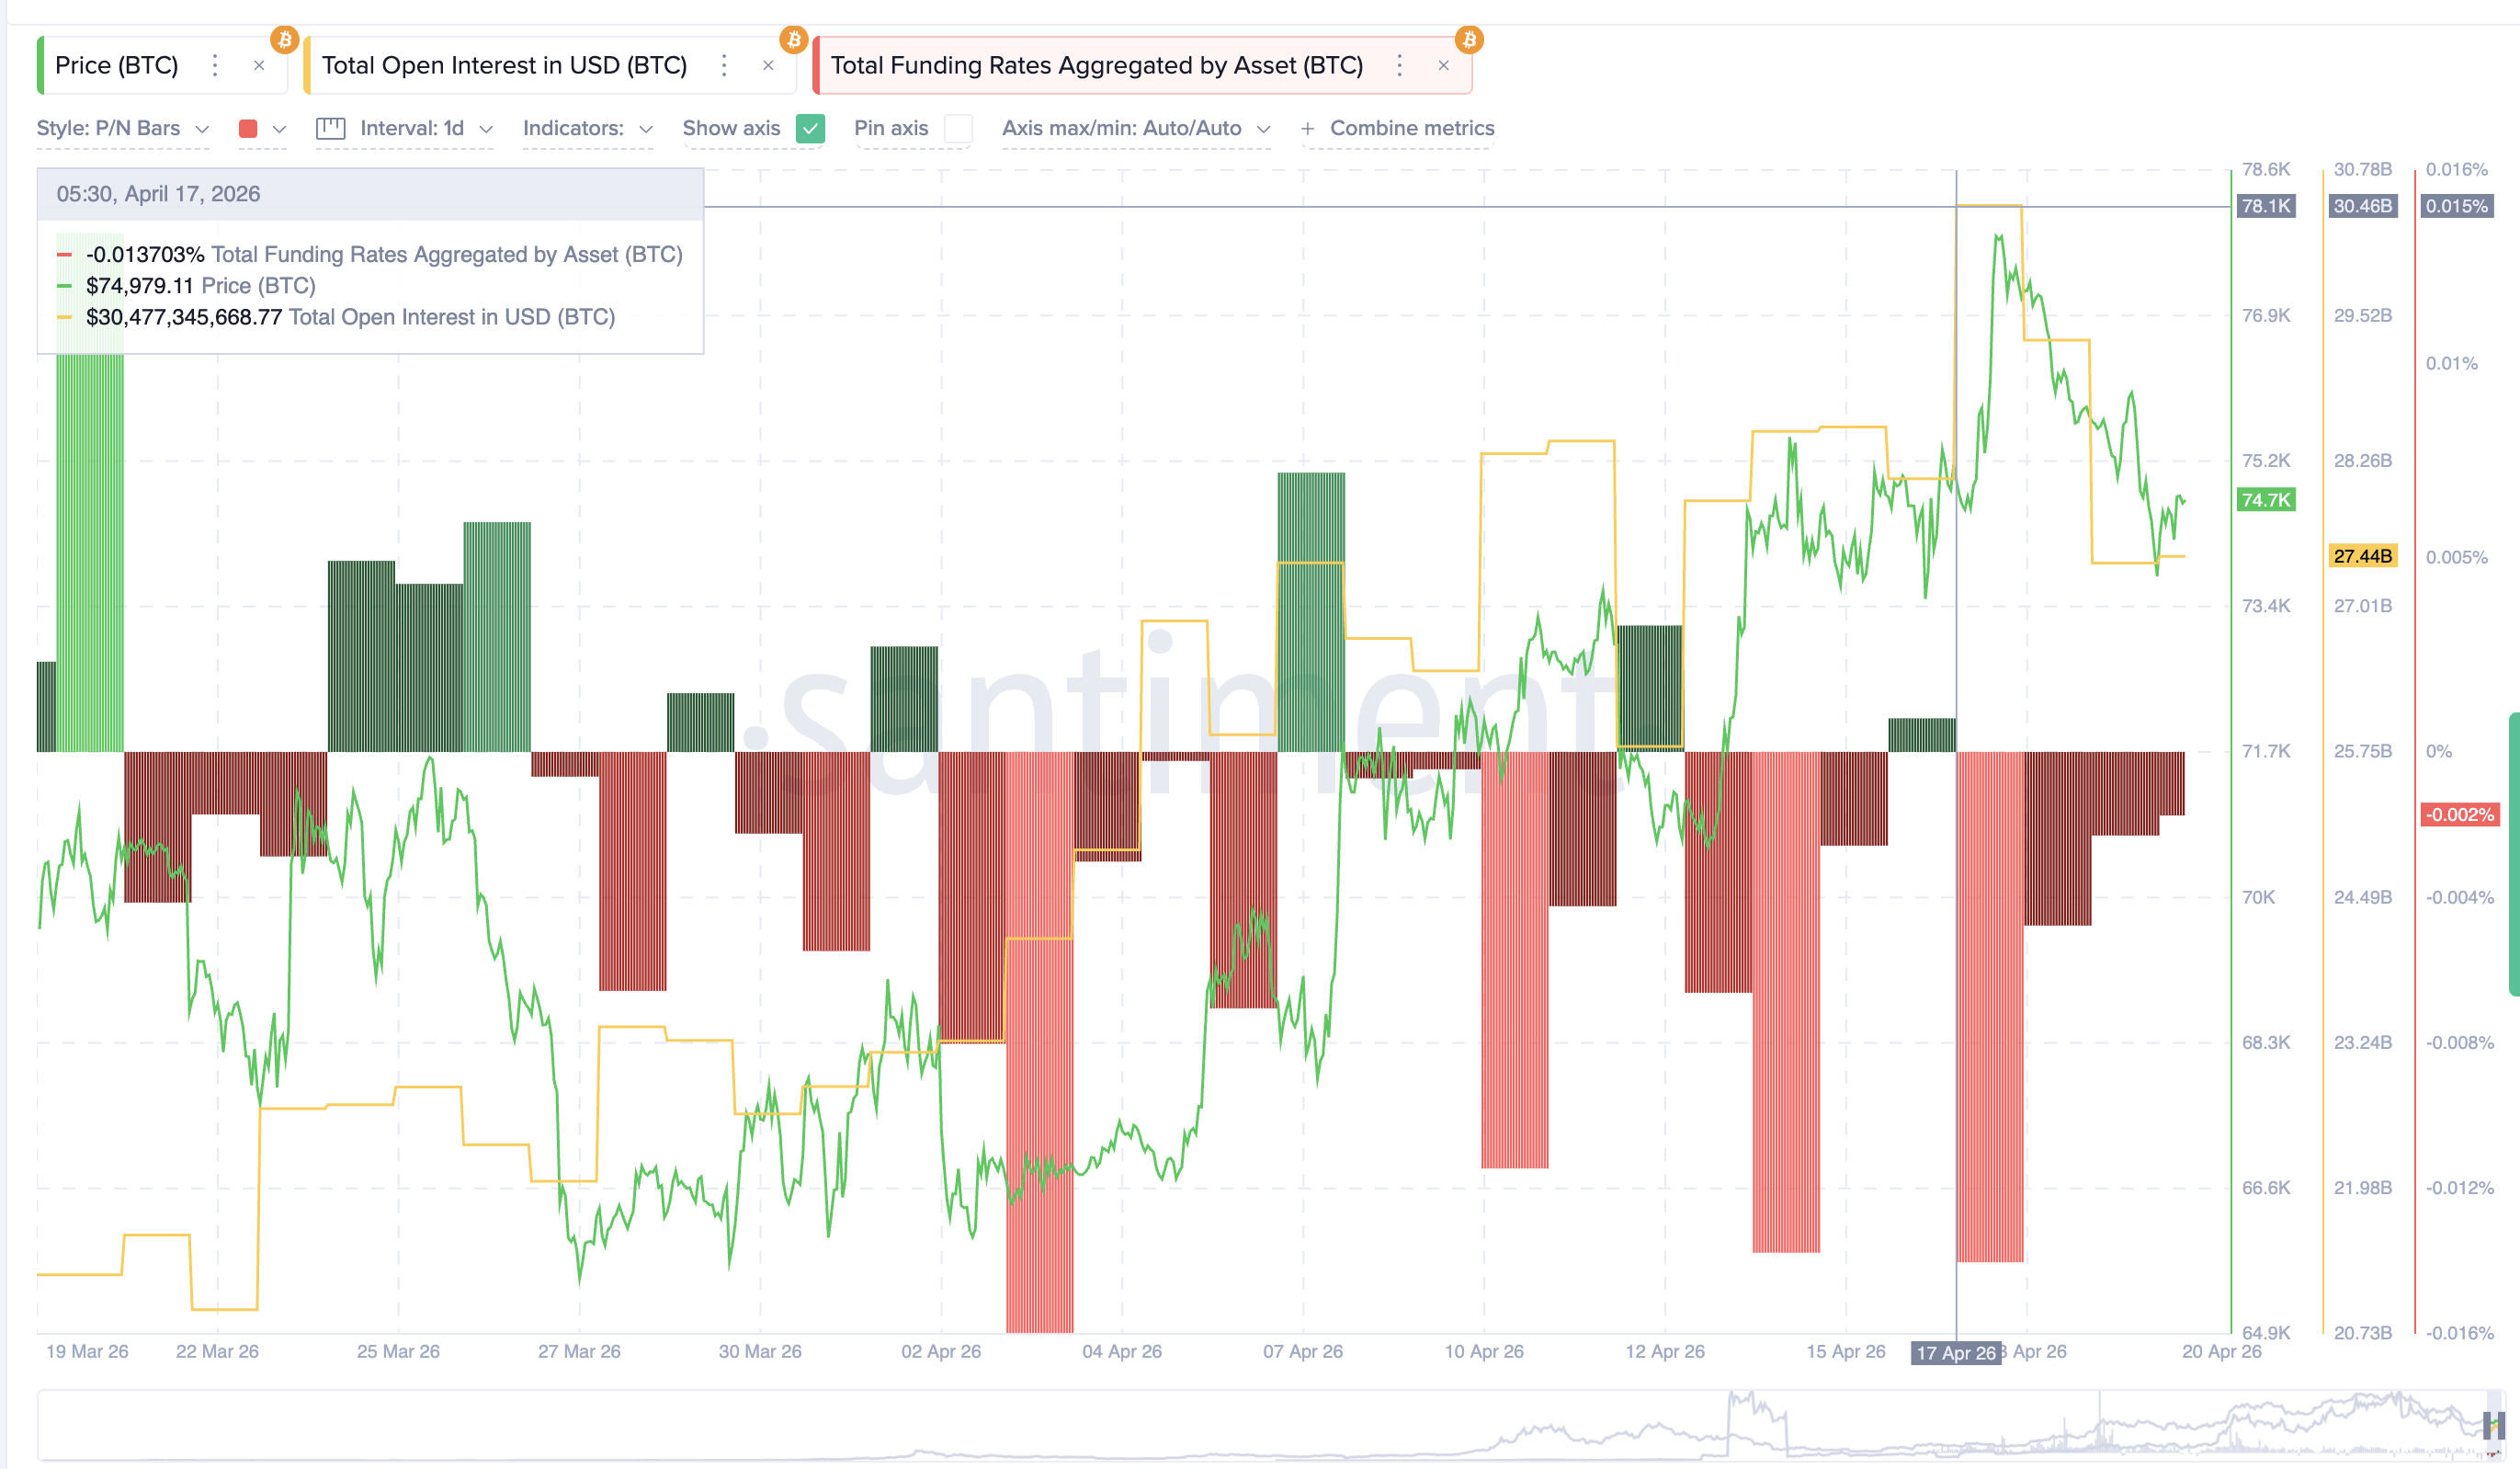
The bullish contrarian setup would pair rising open interest with deeply negative funding, a sign of shorts stacking into the rally. This chart shows the opposite. Open interest is shrinking while funding normalizes toward zero. New Bitcoin longs are not stepping in to replace the exiting shorts. And even new shorts are waiting on the sidelines.
Interpreted carefully, the derivatives market is not voting in either direction. It is resetting. Clean decks sometimes precede sustainable moves, but a reset alone does not supply the demand a breakout needs. With leverage neutralized, spot positioning becomes the decider.
Long-Term Holders Added More Than 10% Since the Rejection
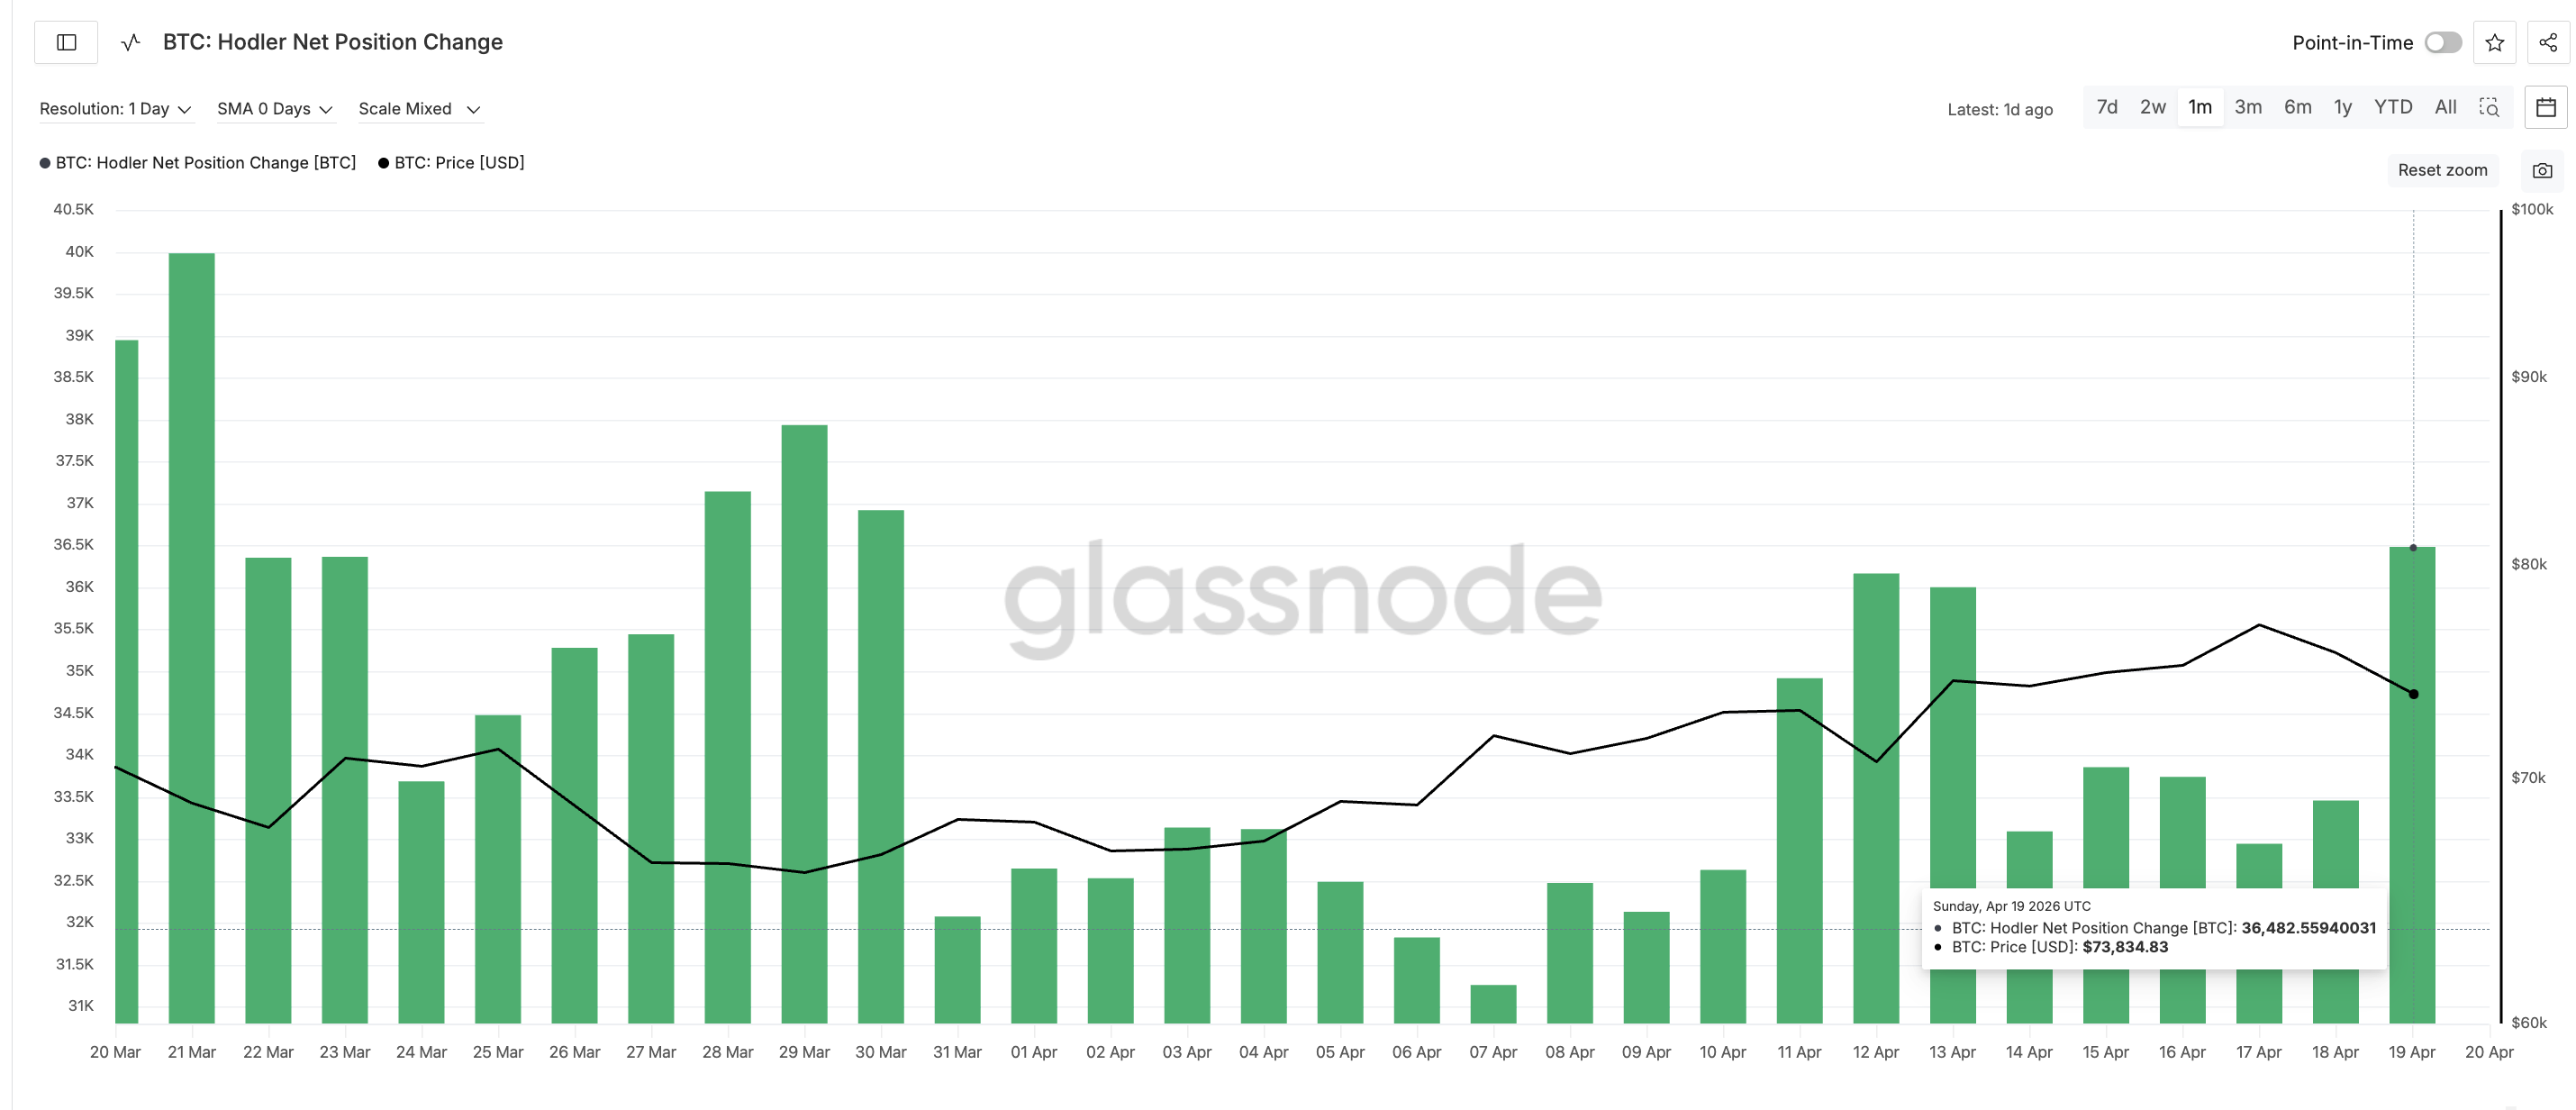
The Hodler Net Position Change, a Glassnode metric that measures how much long-term holders are accumulating each day, has climbed from 32,942 BTC on April 17 to 36,482 BTC on April 19. That marks a 10.75% jump in hodler accumulation over three sessions, a large swing by Bitcoin’s scale.
The identity of the sellers becomes clearer when cross-referencing the HODL Waves, a Glassnode distribution that splits circulating supply by wallet age band. The 1-week to 1-month cohort, which captures the most recent speculative buyers, peaked near 4% on April 9 and has since dropped to 2.781% on April 19.
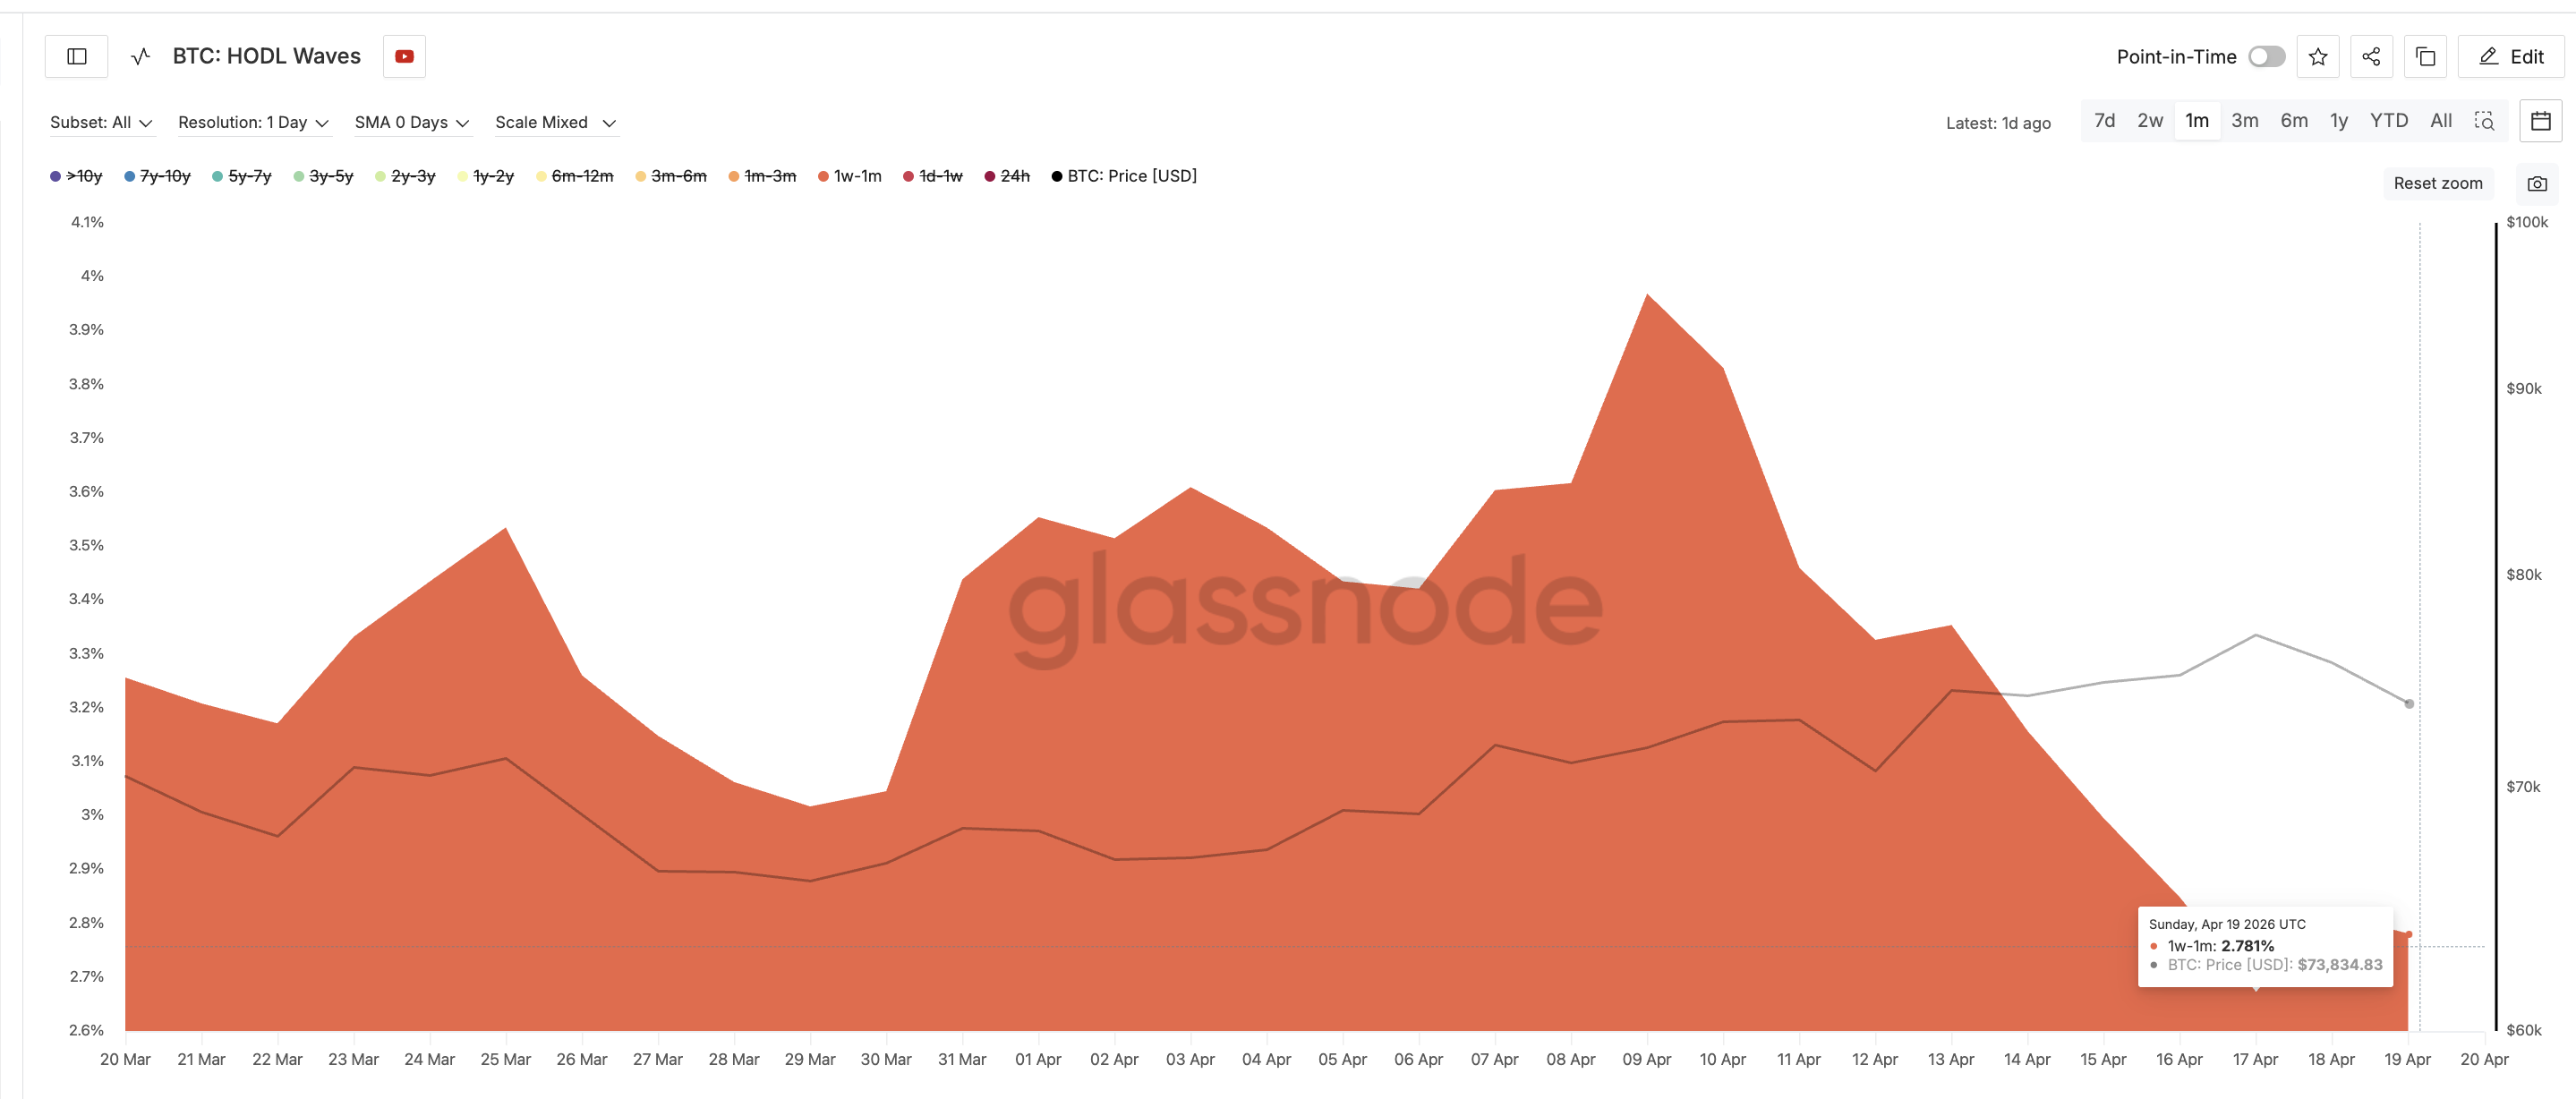
That cohort has compressed by roughly 30% in ten days. The pattern is consistent with recent speculative buyers booking profits into the rally, while longer-term holders absorb the supply on the dip.
The rotation from weak to strong hands is happening quietly inside the flag consolidation. The hodler behavior answers the question derivatives could not. Leverage is neutral because spot is doing the buying, and the flag’s next move now hangs on a single price trigger.
Bitcoin Price Levels That Decide the $90,000 Path
Bitcoin price needs a daily close above $75,190.98, the 0.236 Fibonacci level drawn from the $64,869 pole base to the $78,379 peak. That level was tested and rejected on April 20, keeping the flag’s resistance cluster intact.
A decisive close above $75,190 opens the path for the flag to resolve higher. The pole projection, measured by extending the 20.72% pole move from the breakout point, targets $90,841.57 on the chart. That is roughly a 21% advance from the current zone if the breakout confirms with volume.
Today’s green candle has not been accompanied by a leverage buildup in derivatives. That is a healthy sign, because the move has room to extend without being immediately exposed to a long squeeze. A confirming breakout would turn the leverage reset from a neutral condition into a loaded spring.
The pattern nuance is the two failed probes at the ceiling. A deeper retest toward the 0.382 level at $73,218 or the 0.5 level at $71,624 could precede a cleaner second attempt. A loss of the 0.618 level at $70,030 would mostly invalidate the bullish pattern.
For now, $75,190 separates the continuation case that targets $90,000 from a deeper retest that could drain the bull flag’s upside.
The post Bitcoin Hodlers Add 10% as BTC Lines Up a Run to $90,000 appeared first on BeInCrypto.

The selloff accelerated after the $292 million Kelp DAO exploit on April 18, which drained 116,500 rsETH through a compromised LayerZero-powered cross-chain bridge.
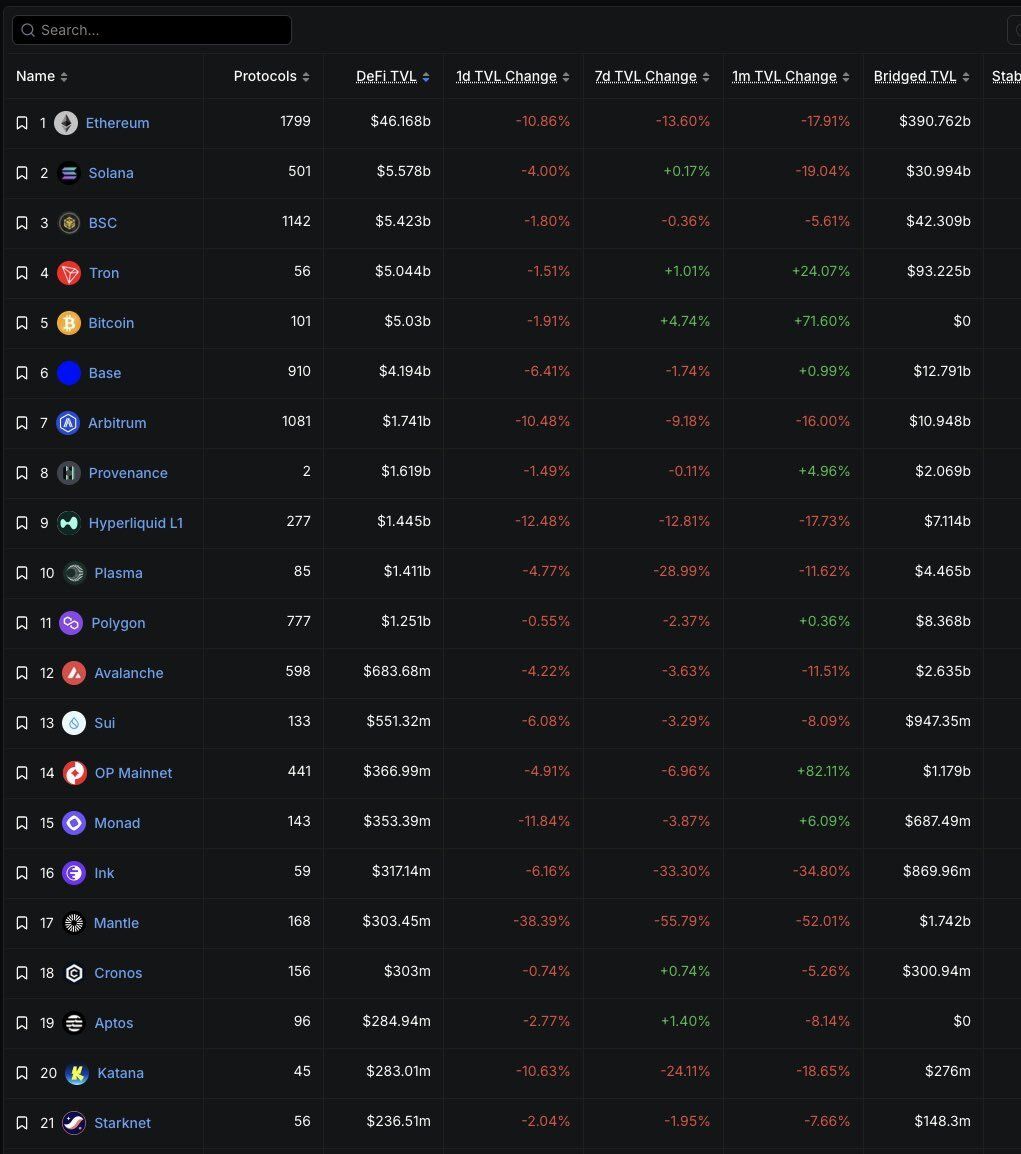
Data from DefiLlama shows Ethereum, which dominates 53.91% of all DeFi TVL, lost 17.91% of its locked value in the past month. The chain now holds $46.17 billion, down from over $56 billion before the hack wave began.
Is Money Leaving DeFi?
The data shows a clear trend: capital is exiting. This DeFi sector contraction mirrors patterns seen in previous risk-off periods, but the breadth of losses stands out.
Solana dropped 19.04% monthly despite a slight 0.17% weekly gain. BSC fell 5.61%. Even Bitcoin DeFi, which had been growing rapidly with a 71.60% monthly gain earlier in the cycle, lost 1.91% in the past 24 hours as contagion spread.
The worst performers tell the story. Mantle collapsed 52.01% in 30 days, falling from over $600 million to $303 million. Ink dropped 34.80%. Katana lost 18.65%. Hyperliquid L1 fell 17.73%. Arbitrum, once considered a safe haven for DeFi activity, declined 16.00% monthly.
Only two chains in the top 20 posted positive monthly gains: Tron at 24.07% and OP Mainnet at 82.11%. Both benefited from stablecoin flows seeking perceived safety outside the Ethereum restaking ecosystem.

Kelp DAO Hack Triggers Contagion Across DeFi
The $292 million exploit targeted Kelp DAO’s cross-chain bridge infrastructure. Attackers used poisoned RPC nodes and a DDoS attack to manipulate a single verifier configuration, draining funds across Ethereum and Arbitrum in minutes.
The contagion spread rapidly. Aave urged WETH suppliers to withdraw due to rsETH exposure, triggering billions in outflows from the largest DeFi lending protocol. Ethena, Curve Finance, ether.fi, and Tron DAO froze their LayerZero OFT bridges as a precaution.
LayerZero Labs attributed the attack to TraderTraitor, a Lazarus Group subunit previously linked to the Drift Protocol exploit earlier this month.
Are Users Repricing DeFi Risk?
The TVL decline suggests users are reassessing cross-chain infrastructure risk. Kelp, previously considered one of the top DeFi protocols with over $2 billion in TVL, now faces existential questions about its ability to make users whole.
Plasma lost 28.99% in seven days. Ink dropped 33.30% weekly. These sharp moves indicate active withdrawals rather than passive price depreciation.
Ethereum still dominates with 53.91% of all DeFi TVL, followed by Solana at 6.49%, BSC at 6.34%, Bitcoin at 5.91%, and Tron at 5.89%. But dominance without growth signals a shrinking pie rather than a flight to quality.
The question facing DeFi is whether this represents a temporary repricing or a structural shift in how users evaluate bridge and restaking risk.
The post DeFi TVL Drops on All Top 20 Chains After KelpDAO Exploit appeared first on BeInCrypto.

In a detailed incident report, Aave service providers quantified the protocol’s exposure for the first time and outlined two scenarios depending on how Kelp DAO allocates the loss. LayerZero and Kelp continue to blame each other for the compromised bridge configuration.
Aave service providers on Monday published an incident report quantifying the protocol’s exposure to the April 18 Kelp DAO rsETH bridge exploit, outlining two bad-debt scenarios ranging from $123.7 million to $230.1 million, and recommending an immediate pause of the protocol’s Umbrella safety module.
According to the report, posted to the Aave governance forum, 89,567 of the 116,500 rsETH stolen from Kelp’s LayerZero bridge were deposited across seven attacker-controlled wallets on Aave. Those positions borrowed 82,650 WETH ($190.86 million) and 821 wstETH ($2.33 million).
The single largest position, on Aave’s Ethereum Core market, supplied 53,000 rsETH and borrowed 52,460 WETH, or $121 million, from one wallet. The remaining positions were distributed across Aave’s Arbitrum deployment. All attacker positions currently sit at health factors between 1.01 and 1.03.
Kelp subsequently recovered 40,373 rsETH by freezing a second attempted drain. That balance is the only confirmed backing for 152,577 rsETH of claims across every L2, a pro-rata backing ratio of 26.46%. Ethereum mainnet rsETH is backed separately by Kelp’s underlying ETH staking deposits.
Two bad debt scenarios
The report declined to commit to a single bad-debt figure, stating that the outcome depends on decisions outside Aave’s control — primarily how Kelp accounts for the loss and whether it updates its LRTOracle exchange rate.
Under Scenario 1, a uniform socialization across all rsETH holders on all chains, each token takes a 15.12% haircut. Total bad debt reaches $123.7 million, with the Ethereum Core WETH reserve absorbing $91.8 million, or a 1.54% shortfall. Mantle absorbs $10.4 million, or 9.54% of its WETH reserve, the most proportionally acute.
Under Scenario 2, losses are isolated to rsETH on L2s. Remote-chain rsETH is repriced to its 26.46% backing ratio, or a 73.54% haircut, while Ethereum mainnet rsETH is unaffected. Total bad debt rises to $230.1 million, all concentrated on L2s.
In this scenario, Mantle faces a 71.45% shortfall ($77.7 million), Arbitrum 26.67% ($88.4 million), Base 23.28% ($47.5 million), and Ink 18% ($13.9 million). Ethereum Core is untouched.
Umbrella covers only Ethereum Core reserves. Under Scenario 2, it would not activate.
Balance sheet disclosure
The report disclosed the Aave DAO’s financial position. As of April 20, the treasury holds $181 million — $62 million in Ethereum-correlated holdings, $54 million in AAVE tokens, and $52 million in stablecoins. The DAO generated $145 million in revenue in 2025 and $38 million year-to-date in 2026, with operating cash flow of $149 million in 2025 and $40 million year-to-date.
Aave DAO service providers are “leading an effort with ecosystem participants to address a potential bad-debt scenario,” the report said, and the effort has received “indicative commitments from various parties.” It did not identify the parties or quantify the commitments.
The report also recommended the DAO immediately pause the WETH Umbrella module. As of writing, 18,922 of the 23,507 aWETH staked in Umbrella — approximately 80% — have already entered the 20-day unstaking cooldown. A pause would block further deposits, withdrawals, transfers, and slashing. Coverage under a paused module would need to be handled manually through governance rather than automatically.
A second-order liquidation risk
The report also quantified the risk of further bad debt if ETH falls in price while Aave’s WETH reserves remain at 100% utilization. Because idle WETH balances are below $20 on every affected chain, liquidators cannot receive WETH as underlying and instead receive aWETH receipts, which keeps their capital inside the reserve and slows liquidation throughput.
At a 50% ETH price drop, Aave modeled $100.8 million of residual bad debt on Ethereum alone, with smaller amounts on Arbitrum, Base, Linea, and Mantle. Arbitrum and Base were flagged as particularly vulnerable because wstETH looping positions on those chains run at health factors around 1.03 — meaning first liquidations would trigger at ETH price drops of just 0.77% and 1.77%, respectively.
LayerZero and Kelp continue to trade blame
The Aave report did not assign blame for the underlying bridge exploit. LayerZero and Kelp DAO have continued to publicly attribute the incident to each other.
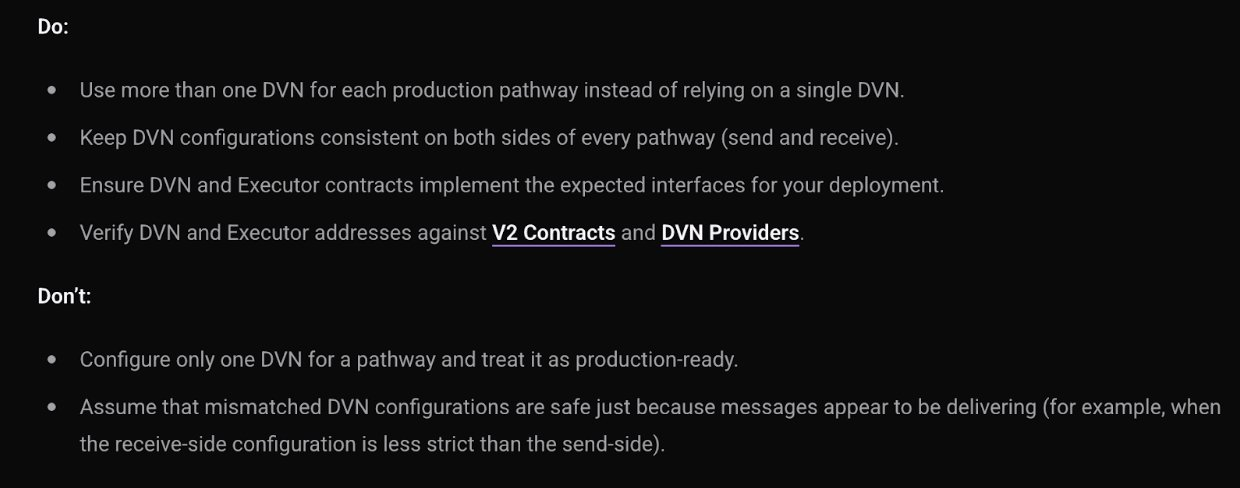
In a Sunday post-mortem, LayerZero Labs attributed the attack to the DPRK-linked Lazarus Group. The company said attackers compromised two downstream Remote Procedure Call (RPC) nodes used by its LayerZero-operated Decentralized Verifier Network (DVN), and introduced malicious software that returned forged data only to the DVN, then launched a DDoS attack to force failover to the poisoned RPC nodes.
LayerZero said the protocol itself was not exploited and attributed the attack’s success to Kelp’s use of a 1-of-1 DVN configuration.
In a rebuttal reported by CoinDesk on Monday, a source familiar with Kelp’s position said a communications channel between the two teams had been open since July 2024 and that LayerZero had not issued a specific recommendation to change the rsETH DVN configuration. The source said the compromised DVN was LayerZero’s own infrastructure and that Kelp’s core restaking contracts were not affected.
Yearn Finance core developer known on X as @banteg, published a technical review showing LayerZero’s public V2 OApp Quickstart uses a 1-of-1 DVN setup in its reference configuration across Ethereum, BSC, Polygon, Arbitrum, and Optimism. CoinDesk reported approximately 40% of applications on LayerZero currently run 1-of-1 configurations.
LayerZero has said it will no longer sign messages for any application using a 1-of-1 DVN configuration.
“DeFi has spent years auditing smart contracts. Kelp is the moment the industry realises the threat doesn’t end at the code. Most protocols are completely exposed at the infrastructure layer,” said Yair Cleper, Co-Founder and CEO of MagmaDevs and contributor to Lava Network, a decentralized marketplace for blockchain data providers.
Bitcoin (BTC) begins the last full week of April juggling fresh US-Iran war fears as resistance hurdles line up.
Key points:
-
Bitcoin stays green on weekly time frames with multiple nearby price levels in focus.
-
Elliott Wave analysis concludes that $81,000 is Bitcoin bulls’ next “final boss.”
-
A resurgent US-Iran war threatens to unravel last week’s crypto and risk-asset gains.
-
Bitcoin ETFs see major inflows, but investors’ cost basis is still above $80,000.
-
Bitcoin’s true market mean metric reveals that the current bear market remains “mild.”
BTC price can still make “new highs” this week
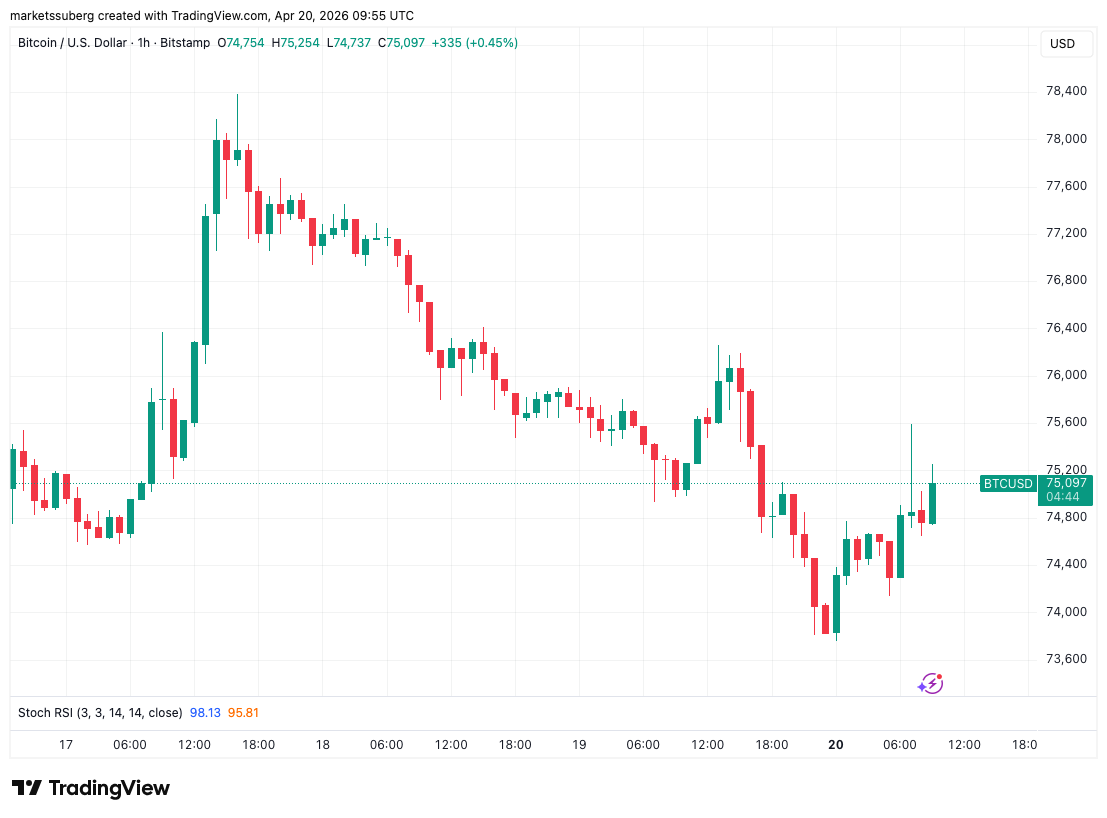
Bitcoin still managed a “green” weekly candle despite last-minute sellers driving price below $74,000.
Data from TradingView shows a modest recovery ensuing as the new week begins — despite the lingering threat of geopolitical escalation between the US, Israel and Iran.

Price now has multiple resistance levels overhead, with the nearest being its 21-week exponential moving average (EMA) at $78,400.
Over the weekend, trader and analyst Rekt Capital stressed the influence of that trend line.
“Bitcoin is rejecting from the 21-week EMA (green),” he noted in an X post alongside a print of the weekly chart.
“It is this rejection that could force a post-breakout retest of the top of the Double Bottom (~$73k) next week, provided Bitcoin Weekly Closes just like this.”

In a subsequent post, Rekt Capital said that a successful retest of the $73,000 area would “confirm the breakout” for the bulls.
A Weekly Close just like this could confirm the 21-week EMA (green) as resistance to set up for a post-breakout retest of the Double Bottom formation top (blue ~$73k)
A successful retest of the Double Bottom formation would confirm the breakout$BTC #Crypto #Bitcoin https://t.co/7eZiVYZFeQ pic.twitter.com/cWxH3lMNpb
— Rekt Capital (@rektcapital) April 19, 2026
Continuing, trader CrypNuevo forecast that BTC/USD would continue to trade in a range with an $80,000 ceiling “for the next month.” They acknowledged that it was “unknown” how high the pair could go should the US-Iran war definitively end.

Crypto trader Michaël van de Poppe, meanwhile, remained upbeat, seeing a push beyond last week’s local highs next. He noted that there was a new “gap” open above price in CME Group’s Bitcoin futures market.
“Relatively strong bounce upwards on $BTC on Monday, as markets tend to go risk-off prior to the open. Gold has gone down, so no attached risk,” he told X followers on Monday.
“Bitcoin bouncing upwards, and given that there’s still a gap to $77.3K, I would assume we’re going to see new highs this week.”

$81,000 emerges as Bitcoin’s “final boss”
In its latest BTC price analysis, crypto market intelligence platform Decode placed specific emphasis on $81,000 as the resistance level to beat.
As part of Elliott Wave analysis, Decode showed BTC/USD trading between the 200-week and 21-week EMAs.
“Bitcoin still pinned below the 21 week ema, but looking pretty good overall, and with the final boss at 81k,” it commented.
This “final boss,” Decode explained in subsequent debate on X, “narrows the options from an Elliott Wave perspective, removing short term bearish counts.”

$81,000 also represents the average entry price for institutional buyers of the US spot Bitcoin exchange-traded funds (ETFs).
Nearby, the cost basis for Bitcoin’s short-term holders (STHs) — entities hodling for up to six months without selling — is now at $83,500, per data from onchain analytics platform CryptoQuant.

CryptoQuant notes that the STH spent output profit ratio (SOPR) metric — the ratio of STH coins moving onchain in profit or loss — is circling breakeven.
“If SOPR manages to sustainably move back above 1, it would indicate that STHs are once again realizing profits, which is generally positive for the market as long as values do not become excessive,” contributor Darkfost wrote in a QuickTake blog post last week.
Iran war comeback risks risk-asset “unwind”
The US will release little by way of macroeconomic data in the coming week, but markets have bigger concerns.
With the sudden comeback of the US-Iran war, traders are suddenly revisiting the prospect of higher oil prices and a longer-term knock-in effect on inflation.
“The sudden change in events has characterized the Middle East conflict since it started at the end of February,” trading resource Mosaic Asset Company commented in the latest edition of its regular newsletter, The Market Mosaic.
“And it appears that intensifying hostilities could unwind the bullish action over the past few weeks.”
WTI crude oil fell to its lowest levels since early March last week as markets increasingly bet on the ceasefire and agreements between the US and Iran holding. The fresh breakdown in diplomacy sparked a rebound toward $90 per barrel.
BREAKING: US oil prices surge +7%, rising above $89/barrel, as markets react to Iran closing the Strait of Hormuz and denying reports of a second round of talks with the US. pic.twitter.com/Tmtt8idhsr
— The Kobeissi Letter (@KobeissiLetter) April 19, 2026
S&P 500 futures avoided a major correction at the weekly open, trading down around 0.6% on Monday.

Continuing, however, Mosaic warned that the writing was already on the wall for the equities rally after the S&P hit fresh all-time highs.
“Simply following breadth, sentiment, and positioning by institutional investors helped flag the recent rally. At the same time, warning signs were already emerging as the S&P 500 broke out to record highs,” it wrote.
“The number of stocks breaking out to new highs is failing [to] confirm the move in the indexes, while buying pressure from a key group of institutional investors has largely run its course.”

As Cointelegraph reported, oil prices in particular are under the microscope as a US inflation catalyst. The next print of the Consumer Price Index (CPI), which will reflect the ongoing impact of the war during April, is due for release on May 12.
Risk-on institutions wake up to Bitcoin
The upshot in risk appetite amid Iran relief had a near-instant impact on Bitcoin institutional investment vehicles.
In particular, the US spot ETFs saw considerable capital inflows through Friday, with more than 25,000 BTC entering over five days.
“The latest accumulations by spot ETF firms are significant, as the last time they posted a figure this close was in April 2025, when they added 23,900 units,” CryptoQuant noted in a QuickTake blog post on the topic.

Data from UK-based investment company Farside Investors confirms that on Friday alone, the net inflows to the ETFs were more than $660 million — the largest single-day total since January.
“Aside from the current milestone, BTC spot ETFs are recovering,” CryptoQuant continued.
“The balance held by the firm offering them has been declining since October, but has risen since the February dip.”

In BTC terms, the ETFs’ total holdings are now at their highest since November 2025.
GM ☕️
Last week we have seen –
– One of the highest inflows into #bitcoin ETPs.
– Record bitcoin purchases by $MSTR.Yet, $BTC has failed to reclaim the ETF cost basis (~$81k).
Let’s watch… pic.twitter.com/qVD76JobLY
— André Dragosch, PhD⚡ (@Andre_Dragosch) April 20, 2026
Commenting on X, Andre Dragosch, European head of research at crypto asset manager Bitwise, acknowledged that ETF investors’ cost basis is still above spot price at $81,000, increasing the psychological significance of that level as a resistance hurdle.
Bitcoin price downside still on “milder path”
The average Bitcoin hodler remains underwater despite the recent trip to 10-week highs for BTC/USD.
Related: Bitcoin can grow ‘probably a lot bigger’ than $30T+ gold market — Analysis
New research from onchain analytics platform Glassnode also warns that in terms of history, Bitcoin’s current bear-market drawdown remains “mild.”
In an X article published on Thursday, lead analyst CryptoVizArt used the true market mean (TMM) metric to assess hodler profitability. TMM filters out long-dormant or lost coins to provide a more accurate picture of cost basis for the active BTC supply.
“When BTC trades below TMM, the average active holder is underwater. Since 2016, this has happened ten times with meaningful negative outcomes — episodes lasting from 2 days to over 11 months, with max drawdowns ranging from -0.1% to -57%,” they summarized.

Bitcoin is now over 75 days into its latest sub-TMM phase, with TMM itself at $78,200.
A chart plotting 2026 against Bitcoin’s historical average dips below TMM shows price forging a “milder path” than before.
“That said, 75 days is still early. The 2018 and 2022 episodes didn’t bottom until months 5-9,” CryptoVizArt warned.
“The signal isn’t ‘all clear’ — it’s ‘watch closely.’ Reclaiming the TMM and stabilizing there would mark active investors returning to profit, historically a strong reset point for momentum.”

This article is produced in accordance with Cointelegraph’s Editorial Policy and is intended for informational purposes only. It does not constitute investment advice or recommendations. All investments and trades carry risk; readers are encouraged to conduct independent research before making any decisions. Cointelegraph makes no guarantees regarding the accuracy or completeness of the information presented, including forward-looking statements, and will not be liable for any loss or damage arising from reliance on this content.
Interoperability protocol LayerZero claims that an inadequate setup tied to Kelp’s decentralized verifier network (DVN) enabled malicious actors to steal $290 million from Kelp DAO, adding that preliminary signs point to North Korea-linked threat actors.
An attacker drained about 116,500 Restaked ETH (rsETH), worth as much as $293 million at the time, from Kelp DAO’s LayerZero-powered rsETH bridge on Saturday.
LayerZero said Monday that the exploit stemmed from a single point of failure in Kelp’s setup, which relied on a single LayerZero DVN as the only verified path, despite LayerZero previously advising them against this.
“LayerZero and other external parties previously communicated best practices around DVN diversification to KelpDAO. Despite these recommendations, KelpDAO chose to utilize a 1/1 DVN configuration.”
In practice, that meant Kelp relied on a single verification path for cross-chain messages rather than requiring multiple independent checks.
The exploit quickly shifted attention from the technical cause to the question of who should absorb the losses, while the fallout spread into Aave, where the attacker used rsETH as collateral to borrow real liquidity.
Aave’s total value locked (TVL) had fallen by about $8.9 billion to $17.5 billion at the time of writing after the exploiter used the stolen funds to borrow on Aave, leaving about $195 million in “bad debt,” triggering withdrawals on the lending protocol.

LayerZero said Kelp’s rsETH bridge relied solely on the LayerZero Labs DVN, and argued that the incident reflected an unsafe application configuration rather than a compromise of LayerZero itself. The company said it is now urging all applications using 1/1 DVN setups to migrate to multi-DVN configurations and will stop signing or attesting messages for apps that retain the single verifier design.
Losses spark blame fight after $290 million Kelp exploit
With no recovery or compensation plan yet announced, users and market observers spent Monday debating whether losses should sit with Kelp DAO, LayerZero, Aave or rsETH holders themselves.
Yishi Wang, founder and CEO of open-source hardware wallet OneKey, said that the best path forward was to negotiate with the hacker, offer a 10% to 15% bounty, and get the bulk of the funds back.
“If negotiations fail, LayerZero’s ecosystem fund should foot the bulk of the bill—it’s got the deepest pockets and the most long-term skin in the game,” wrote the founder in a Monday X post, adding that Kelp DAO is “broke” and could make it up with tokens and future revenue, or consider selling the project.
Analytics platform DeFiLlama’s pseudonymous founder, 0xngmi, outlined three solutions, including the option to “socialize” losses among all users, “rug rsETH holders on L2s,” or try to return holder balances to a pre-hack snapshot, which would be “very hard to do,” he wrote in a Monday X post.

Cointelegraph reached out to Aave for comment, but had not received a response by publication.
Related: Hyperbridge attacker mints 1B bridged Polkadot tokens in $237K exploit
Exploit raises Aave liquidation risks
Investor concerns about the Kelp exploit have significantly reduced Ether (ETH) liquidity on Aave, the lending protocol’s core collateral asset.
This low liquidity presents a “critical safety risk where liquidations of ETH collateral cannot take place while markets are at 100% utilization,” said MoneySupply, the pseudonymous head of strategy at Aave competitor lending protocol Spark, in a Saturday X post.
“With current illiquidity conditions on Aave, a 15-20% ETHUSD price drop could cause significant bad debt accumulation (on top of any potential issues attributable to the direct rsETH exploit),” he said.

Aave said it immediately froze all rsETH in Aave v3 and V4, preventing further damage. Aave’s own smart contracts were not exploited.
Magazine: Meet the onchain crypto detectives fighting crime better than the cops
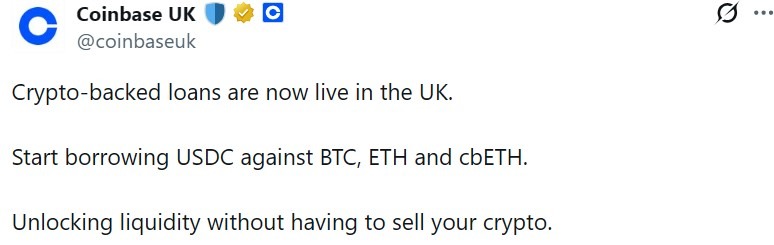
Crypto exchange Coinbase has rolled out crypto-backed USDC loans for users in the United Kingdom, allowing users to borrow USDC against Bitcoin, Ether and Coinbase Wrapped Staked Ether (cbETH). The loans are issued through Morpho, a lending protocol on Base.
According to a Monday announcement, users can borrow up to $5 million in USDC (USDC) with Bitcoin (BTC)-backed loans, depending on how much collateral a user pledges. Coinbase said interest rates are variable and set by Morpho based on market conditions on Base, suggesting that borrowing costs can change frequently.
The exchange said there is no fixed repayment schedule, but borrowers face liquidation risk if the loan-to-value ratio exceeds specific thresholds.
The launch expands a crypto-backed lending service that Coinbase has been rolling out in the US since 2025. On Nov. 21, Coinbase launched the product across US states, except New York, allowing users to borrow up to $1 million in USDC with Ether (ETH) as their collateral.
The expansion also comes amid ongoing regulatory developments in the UK. On Wednesday, the FCA launched a consultation for a future crypto regime expected to take effect in October 2027, covering areas like stablecoins, trading platforms, custody and staking. Until the regime comes fully into force, the UK remains only partially regulated, with rules focusing on financial promotions and Anti-Money Laundering (AML).
The rollout adds lending to Coinbase’s growing UK product stack while extending its effort to route consumer finance activity through onchain infrastructure.

UK expansion adds lending to growing product stack
Coinbase described the UK launch as part of its effort to build a broader financial product suite in the country, following its registration with the Financial Conduct Authority (FCA) in 2025.
On Feb. 3, 2025, Coinbase secured FCA approval as a registered crypto service provider, allowing it to offer crypto and fiat services to both retail and institutional investors. In November 2025, Coinbase launched DEX trading and savings accounts in the UK.
Related: Coinbase is testing AI agents that show up on Slack and email
The product launch comes as Coinbase has been exploring ways to extend crypto-backed lending into traditional finance use cases.
On March 26, the exchange partnered with Better Home & Finance to allow borrowers to pledge Bitcoin or USDC as collateral for loans used to fund down payments on mortgages.

Se você está procurando por novos casinos legais online em Portugal, você está no lugar certo. Neste artigo, vamos apresentar as melhores escolhas e listas de casinos online para você aproveitar ao máximo sua experiência de jogo online.
Antes de começar, é importante lembrar que a segurança é fundamental quando se trata de jogos online. Por isso, é importante verificar se o casino online é licenciado e regulamentado por uma autoridade reconhecida, como a Comissão de Regulação do Jogo (CRJ) em Portugal.
Com isso em mente, aqui estão algumas das melhores opções de casinos online legais em Portugal:
Casino 888: O Casino 888 é um dos mais antigos e mais populares casinos online do mundo. Com uma licença da CRJ, o casino oferece uma ampla variedade de jogos, incluindo slots, blackjack, roulette e muitos outros.
Casino Betsson: O Casino Betsson é outro grande nome no mundo dos jogos online. Com uma licença da CRJ, o casino oferece uma ampla variedade de jogos, incluindo slots, blackjack, roulette e muitos outros.
Casino William Hill: O Casino William Hill é um dos mais antigos e mais populares casinos online do mundo. Com uma licença da CRJ, o casino oferece uma ampla variedade de jogos, incluindo slots, blackjack, roulette e muitos outros.
E muitos outros! Aqui estão algumas dicas para você escolher o melhor casino online para você:
Verifique a licença: novos casinos legais online portugal Certifique-se de que o casino online é licenciado e regulamentado por uma autoridade reconhecida, como a CRJ em Portugal.
Verifique a variedade de jogos: Certifique-se de que o casino online oferece uma ampla variedade de jogos, incluindo slots, blackjack, roulette e muitos outros.
Verifique a segurança: Certifique-se de que o casino online tem medidas de segurança adequadas para proteger suas informações e transações.
E muitas outras coisas! Aqui estão algumas dicas adicionais para você aproveitar ao máximo sua experiência de jogo online:
Regule seu orçamento: Certifique-se de que você tem um orçamento para o jogo online e não ultrapasse os limites.
Peça ajuda se precisar: Se você precisar de ajuda, não hesite em contatar o suporte do casino online.
E muitas outras coisas! Aqui estão algumas dicas adicionais para você aproveitar ao máximo sua experiência de jogo online:
Divirta-se!: O jogo online é para divertir-se, então não esqueça de se divertir!
Novos Casinos Legais Online Portugal: Melhores Escolhas e Listas de Casinos Online
Se você está procurando por novos casinos online em Portugal, é importante lembrar que a escolha certa pode fazer toda a diferença. Com tantas opções disponíveis, é fácil se perder na multidão. Por isso, aqui estão algumas dicas para ajudá-lo a encontrar o melhor casino online para você.
Primeiramente, é importante verificar se o casino online é legal em Portugal. Isso pode ser feito verificando se o site está licenciado e regulamentado pela autoridade competente, como a Serviço de Regulação e Inspeção de Jogos (SRIJ). Além disso, é fundamental verificar as condições de jogo e as regras de bônus.
Outra coisa importante é verificar a segurança do site. Isso pode ser feito verificando se o site tem um certificado SSL (Secure Sockets Layer) e se o software de jogo é seguro e confiável. Além disso, é fundamental verificar se o site tem uma política de privacidade clara e transparente.
Novos Casinos Online em Portugal sem Depósito
Se você está procurando por novos casinos online em Portugal sem depósito, aqui estão algumas opções para você considerar:
– BitStarz: um dos mais populares casinos online em Portugal, oferecendo uma variedade de jogos de cassino e esportes.
– Wildz: outro popular casino online em Portugal, oferecendo uma variedade de jogos de cassino e esportes, incluindo slots, blackjack e roulette.
– Casino Estoril: um dos mais antigos casinos online em Portugal, oferecendo uma variedade de jogos de cassino e esportes, incluindo slots, blackjack e roulette.
É importante lembrar que, embora esses casinos online em Portugal sem depósito sejam uma boa opção, é fundamental verificar as condições de jogo e as regras de bônus antes de se registrar.
Em resumo, é importante verificar a legalidade, segurança e condições de jogo antes de se registrar em um casino online em Portugal. Além disso, é fundamental verificar as regras de bônus e as condições de jogo para garantir que você tenha uma experiência agradável e segura.
Os Melhores Casinos Online para Jogadores Portugueses
Se você é um jogador português que procura novos casinos online sem depósito, você está no lugar certo! Aqui, vamos apresentar os melhores casinos online para jogadores portugueses, sem depósito necessário.
Um dos principais benefícios de jogar em casinos online é a possibilidade de experimentar diferentes jogos sem precisar fazer um depósito. Isso permite que você descubra novos jogos e estratégias sem comprometer seu orçamento.
- Novos Casinos Online Portugal sem Depósito:
- Novos Casinos Online em Portugal:
- Novos Casinos Online Portugal:
Além disso, muitos casinos online oferecem bônus sem depósito para novos jogadores. Isso significa que você pode receber um bônus para jogar sem precisar fazer um depósito.
Portanto, se você está procurando por novos casinos online sem depósito, aqui estão algumas opções para você considerar:
- Novos Casinos Online Portugal:
- Novos Casinos Online em Portugal:
- Novos Casinos Online Portugal:
Lembre-se de que sempre é importante ler e entender as regras e condições dos casinos online antes de começar a jogar.
Bitcoin (BTC) has recovered 25% from its multi-year low below $60,000, with momentum indicators flashing rare “buy” signals.
Key takeaways:
-
Bitcoin’s MACD and RSI indicators forecast a sharp BTC price rally in the coming days.
-
Bitcoin price must reclaim $78,000 in the coming days to sustain upward momentum.
Bitcoin’s MACD, RSI confirm “bull market is on”
Data from TradingView showed BTC/USD trading at $75,300, 4% below its 10-week high of $78,380 reached on Friday.
Despite this pullback, fueled by uncertainties over the US and Israel-Iran war, price indicators hinted at continued upside to come.
Analyzing the moving average convergence divergence (MACD) indicator in the weekly time frame, trader Sykodelic flagged a key bullish crossover, setting Bitcoin up for an upward run.
Related: BTC price due ‘new highs:’ Five things to know in Bitcoin this week
“Not only do we have a 1W MACD bullish cross and break of trend, we have it from the lowest point the MACD has ever dropped to,” analyst Sykodelic said in a recent post on X, adding:
“We are at a very important level here, and the weekly close will be very important.”
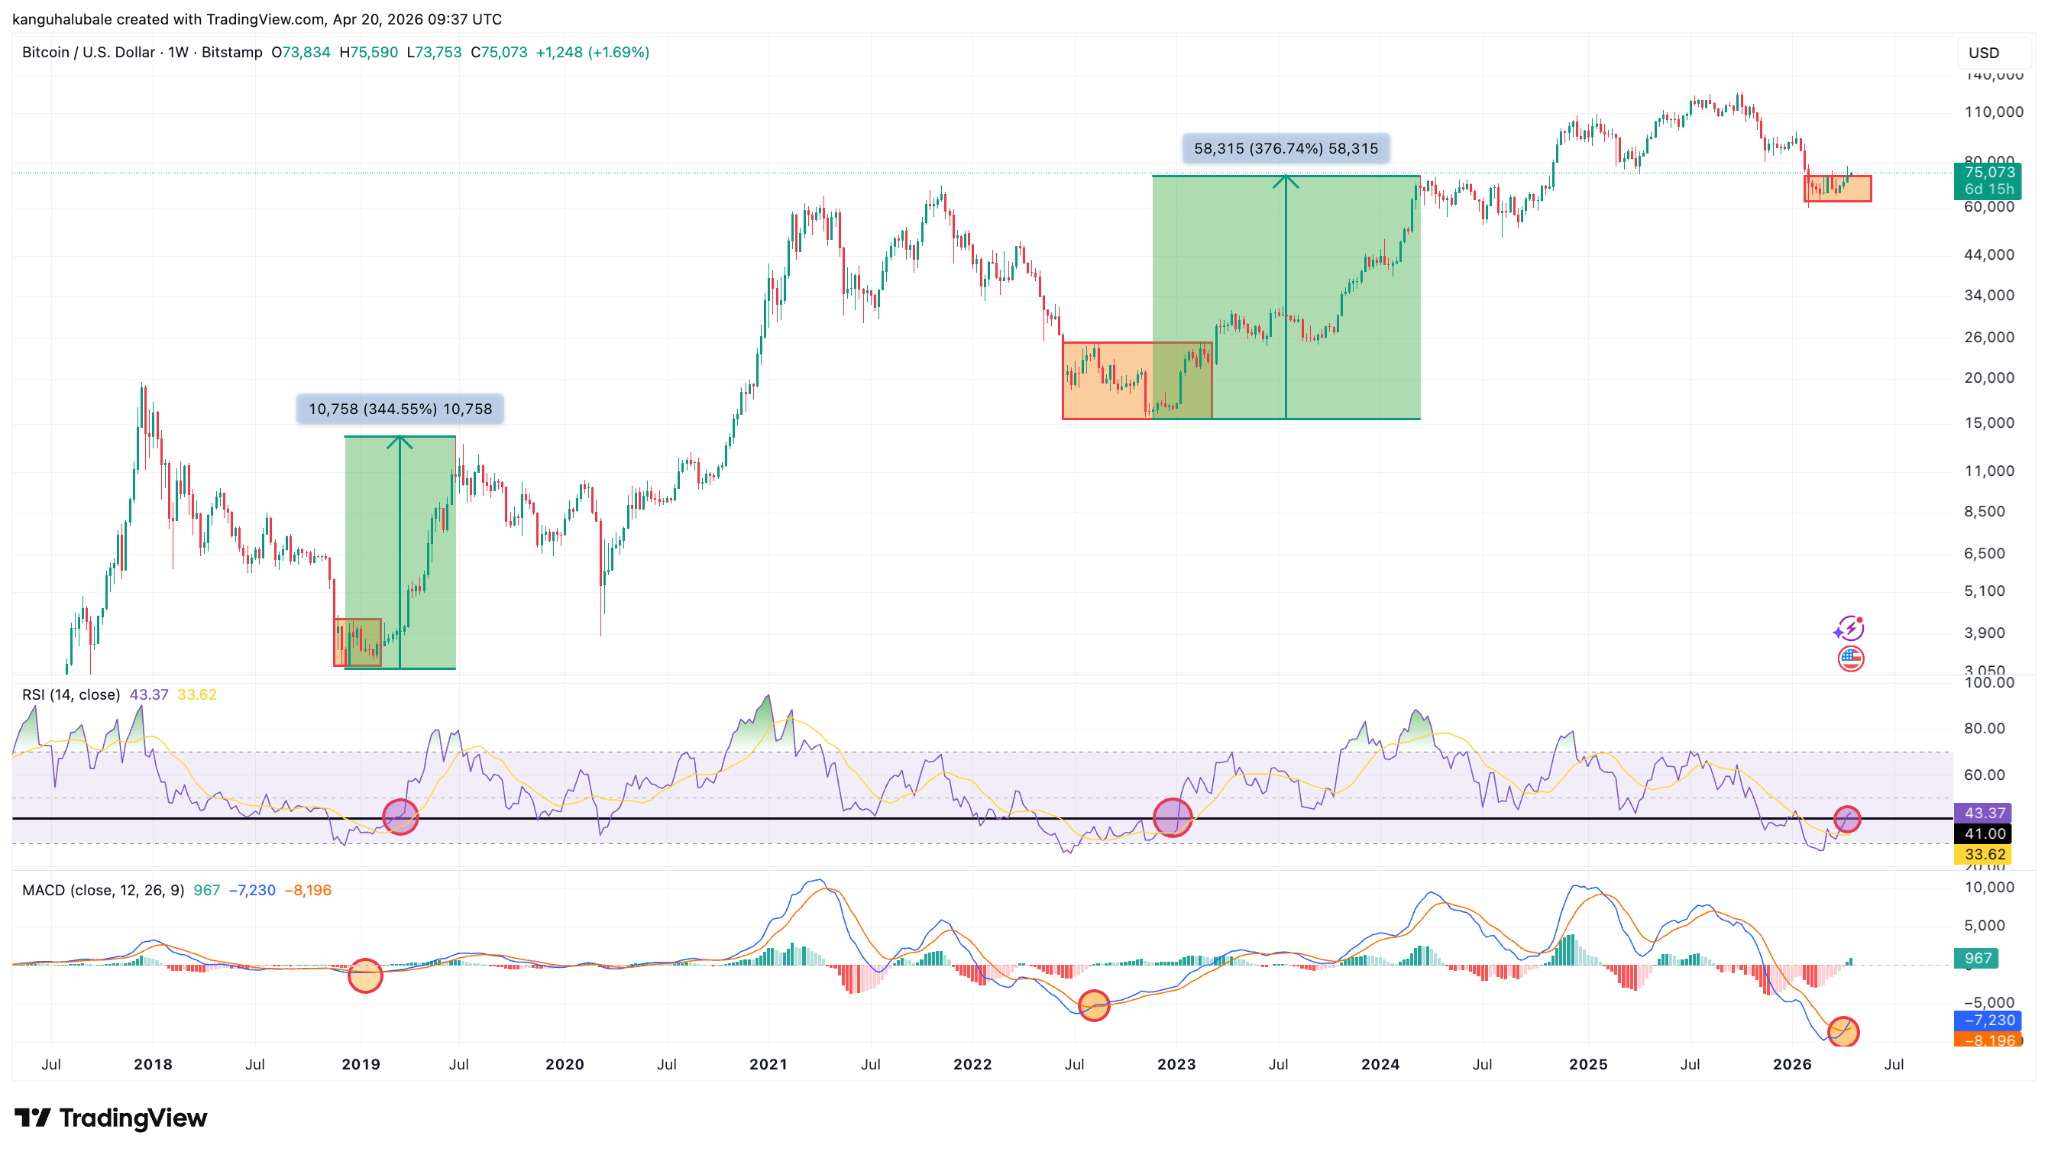
Previous instances show that Bitcoin tends to rise sharply when the MACD line (blue) crosses above the signal line (orange).
This ultimately has led to 340%-380% BTC price gains, as seen in 2018-2019 and 2022-2023.

“A big move usually follows whenever this weekly MACD bullish cross happens,” analyst Mikybull Crypto said in a recent post on X.
Meanwhile, the relative strength index, or RSI, has now recovered to 43 from 21 in mid-February. When combined with a buy signal on the MACD, the picture begins to resemble previous cycles.
In a recent video posted on X, trading resource Material Indicators said that the weekly RSI holding above the 41 level was among the “macro things that need to happen to say a validated bull market is on.”
Previous occurrences in 2023, 2020 and 2019 have led to 660%, 1,600% and 316% BTC price rallies, respectively.
Other Bitcoin analysts suggest that sustained spot market buy volume and consistent inflows to the Bitcoin ETFs are the necessary components required for a rally to new highs.
Bitcoin must reclaim $78,000 next
As Cointelegraph reported, Bitcoin’s bullish case hinges on flipping the resistance at $78,000 into support, where the true market mean currently sits.
Analyzing Bitcoin’s price action on lower time frames, Telegram trading resource Technical Crypto Analyst said that after reclaiming the $70,000 level, the BTC/USD pair is “now pushing into a major supply zone around 75K–78K, which is acting as resistance,” adding:
“A clean breakout above this zone could continue the move toward new highs, while rejection may lead to a pullback toward the 68K–70K support region.”

Fellow analyst Bitcoinsensus said failure to break above $78,000 would suggest that the latest rally was a “possible bull trap,” as seen in previous failed breakouts.
“If price loses momentum from here, the setup keeps downside pressure in focus in the near term.”

As Cointelegraph reported, a close above the $76,000-$78,000 area would confirm that the buyers are in control, clearing the path for a potential rally to $84,000.
This article is produced in accordance with Cointelegraph’s Editorial Policy and is intended for informational purposes only. It does not constitute investment advice or recommendations. All investments and trades carry risk; readers are encouraged to conduct independent research before making any decisions. Cointelegraph makes no guarantees regarding the accuracy or completeness of the information presented, including forward-looking statements, and will not be liable for any loss or damage arising from reliance on this content.

TLDR
- The NSA reportedly used Anthropic’s Mythos Preview despite a Pentagon supply chain risk designation.
- Axios cited sources who confirmed the NSA accessed the model after the restriction.
- The Pentagon labeled Anthropic a supply chain risk in March over safeguard disputes.
- The dispute involved Anthropic’s refusal to loosen controls tied to autonomous weapons and surveillance.
- Anthropic limited Mythos Preview access to about 40 organizations due to offensive cyber capabilities.
The National Security Agency has used Anthropic’s Mythos Preview despite a Pentagon supply chain risk designation. Axios cited multiple sources who confirmed the agency’s access to the model. The report shows internal differences across federal departments over Anthropic technology use.
Anthropic Model Access Expands Inside NSA
Axios reported that two sources confirmed NSA use of Mythos Preview. One source said the department expanded usage beyond limited internal testing.
However, the Pentagon designated Anthropic as a supply chain risk in March. The designation restricted the company’s technology in military contracts after a policy dispute.
The dispute centered on Anthropic’s refusal to loosen safeguards. The company declined to adjust controls linked to autonomous weapons and domestic surveillance systems.
As a result, the Pentagon limited procurement pathways for Anthropic products. Still, Axios reported that the NSA accessed Mythos through existing channels.
The report did not explain the technical route used for access. However, it confirmed that usage occurred after the risk designation.
Axios stated that it remains unclear how the NSA deployed the model. Yet, other authorized organizations have used Mythos to scan systems for vulnerabilities.
Anthropic limited Mythos Preview access to about 40 organizations. The company restricted access because of the model’s offensive cyber capabilities.
Sources told Axios that the NSA relied on the model’s security testing features. They did not describe operational outcomes or contract values.
The report did not state whether the NSA violated formal procurement rules. It also did not clarify if the usage involved classified systems.
White House Engages Anthropic Leadership
The White House has explored options to work with Anthropic despite the ongoing court dispute. Axios reported that discussions took place at senior levels.
Anthropic CEO Dario Amodei met White House Chief of Staff Susie Wiles. He also met Treasury Secretary Scott Bessent to discuss government usage.
Axios reported that Amodei addressed Mythos access and broader security practices. The outlet cited a source familiar with the meeting.
The meeting occurred while the court fight over the Pentagon designation continued. However, officials have not announced any policy change.
The White House did not publicly outline next steps. Still, the talks showed active engagement with Anthropic leadership.
Anthropic has defended its safeguards in previous statements. The company has said it maintains strict controls over high-risk applications.
Pentagon officials have not rescinded the supply chain risk designation. Therefore, formal contract limits remain in place.
Axios reported that agency-level adoption may differ from procurement policy. However, it did not provide internal compliance details.

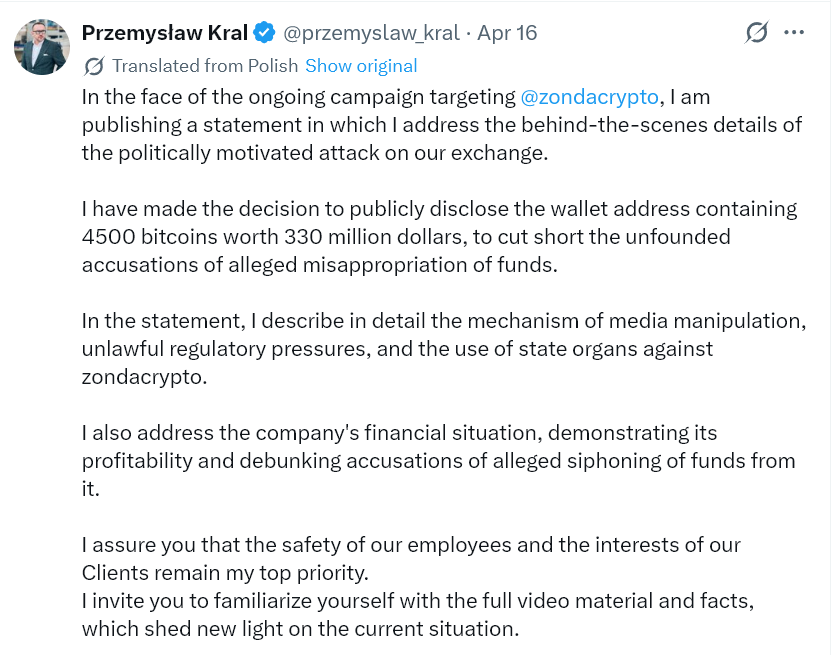
The Zondacrypto withdrawal crisis has frozen millions of customer funds at Poland’s largest crypto exchange. The company cites a 4,500 BTC wallet as proof of solvency, though no one there can move the coins.
The private key belongs to founder Sylwester Suszek, who sold the exchange in 2021 and disappeared in March 2022. Regulators, prosecutors, and the country’s prime minister are now circling the company.
How the zondacrypto Withdrawal Crisis Started
Withdrawal delays first surfaced in December 2025. Users reported on the exchange’s official Telegram channel that funds sat in pending status for days. Management blamed high demand and new security protocols.
Complaints multiplied by late March 2026. A whistleblower site, zonda-alert.pl, launched to gather customer testimonials. Blockchain analysts followed with hard data.
Average monthly Bitcoin (BTC) balances across zondacrypto’s known hot wallets collapsed between August 2024 and April 2026. Holdings fell from 55.7 BTC to 0.086 BTC, a 99.7% drop.
The exchange processes a large share of Polish retail crypto volume. Any sustained freeze hits hundreds of thousands of customers at once.
The Missing Key and a Vanished Founder
CEO Przemysław Kral addressed the allegations on April 17. He cited a wallet holding roughly 4,500 BTC, worth around $330 million. Kral argued the reserves prove the exchange remains solvent.
The defense unraveled quickly. Kral admitted zondacrypto cannot access those coins. The private key belongs only to Suszek, who failed to hand it over when he sold the business in 2021.

Suszek dropped out of public view in March 2022 and has never reappeared. Polish media and private investigators have chased leads across Europe without confirming his location.
A separate investigation now targets Suszek himself. Even his own family cannot confirm whether he is still alive. A wallet no one can move is effectively empty for any practical purpose.
Independent analysts at Recoveris tracked 511 transfers moving from zondacrypto wallets to a single Kraken deposit address. The transfers totaled over $21 million between December 2025 and April 2026.
Kral has rejected the findings and threatened legal action. The silence around the transfers deepens the trust deficit with customers.
A National Political Firestorm
The story has dominated Polish national media as breaking news in recent days. Television, radio, and leading newspapers have led their bulletins with each new revelation.
Prime Minister Donald Tusk escalated the pressure on April 18. He told parliament that zondacrypto financially backed politicians who voted against crypto market rules. Tusk also alleged the exchange maintains links to Russia.
Poland’s largest parliamentary parties have begun using zondacrypto to attack or defend their own politicians. The exchange has become a political weapon on all sides of the chamber.
Regulators Move In
Poland’s National Prosecutor’s Office had opened a formal investigation on April 8. The Office of Competition and Consumer Protection confirmed it has been collecting complaints since 2022.
That consumer office began probing zondacrypto’s parent company in January 2025. Poland’s internal security agency is now reportedly examining the exchange.
Analysts compare the situation to Cinkciarz.pl, a Polish currency exchange that collapsed in 2024. Temporary technical delays there preceded license revocation and heavy customer losses.
What Comes Next
The zondacrypto withdrawal crisis follows a pattern seen in crypto markets during the FTX collapse. Frozen funds, vague statements, a CEO defending solvency, and on-chain data telling a different story.
Over one million customers and Poland’s broader stance on MiCA rules now hinge on what regulators uncover next. The coming weeks will test whether authorities can untangle the wallet, the founder, and the political fallout. Customer patience may not hold. The man who holds the keys is still missing.
The post Poland’s Biggest Crypto Exchange Falls, and Nobody Can Find the Man Who Holds the Keys appeared first on BeInCrypto.
TLDR
- Coinbase has launched crypto-backed USDC loans for users in the United Kingdom through Morpho on Base.
- UK customers can borrow USDC against Bitcoin, Ethereum, and cbETH without selling their holdings.
- The platform allows loans to be issued in under one minute, and funds can be used onchain or converted to fiat.
- Coinbase offers Bitcoin-backed loans up to $5 million USDC, depending on the collateral pledged.
- Interest rates remain variable and update with Base block production instead of following a fixed schedule.
Coinbase has introduced crypto-backed USDC loans for customers in the United Kingdom. The company allows users to borrow against Bitcoin, Ethereum, and cbETH without selling assets. It powers the product through Morpho on Base and issues loans in under one minute.
Coinbase and Morpho Expand USDC Lending to the UK
Coinbase rolled out the borrowing service after expanding its US product earlier this year. The company routes all loans through Morpho’s onchain lending infrastructure on Base. As a result, users access open market liquidity instead of a traditional internal loan book.
The platform allows customers to borrow USDC against pledged crypto assets. Coinbase said borrowers can use funds onchain or convert them into fiat for spending. The company confirmed that interest rates remain variable and update with Base block production.
Coinbase reported that total loan originations through Morpho exceeded $2.17 billion USDC as of April 14, 2026. The figure reflects activity before the product’s first international launch. Morpho described the integration as “one of the largest DeFi distribution moves to date.”
Bitcoin, Ethereum, and cbETH Back UK Borrowing
The UK version supports Bitcoin, Ethereum, and cbETH as eligible collateral. Coinbase offers Bitcoin-backed loans up to $5 million USDC, depending on pledged assets. The company applies variable interest rates determined by onchain markets.
Borrowers do not face a fixed repayment schedule under the current structure. However, the system can liquidate positions if loan value rises too high against collateral. Coinbase stated that rates adjust automatically with each new Base block.
The company launched its US borrowing product in January 2025. At that time, eligible US customers could borrow USDC against Bitcoin through Morpho. The company structured those loans with variable rates set by onchain supply and demand.
Coinbase said the UK expansion aligns with its broader consumer finance plans. Over the past year, the company secured UK VASP registration from the Financial Conduct Authority. It also introduced a GBP savings account in partnership with ClearBank.
The company expanded decentralized exchange trading access for British customers during the same period. Now, it adds borrowing as another feature for UK users. Coinbase aims to convert idle crypto balances into accessible liquidity.
The product operates fully on Morpho’s decentralized lending framework. Coinbase connects customers directly to liquidity pools on Base. Therefore, the company avoids maintaining its own lending inventory.
Coinbase confirmed that loans can be issued in less than one minute. Users can draw USDC immediately after pledging collateral. The company stated that the process runs entirely through smart contracts on Base.
Coinbase continues to monitor loan originations across supported markets. As of April 14, 2026, total originations surpassed $2.17 billion USDC. The UK launch marks the company’s first expansion of the Morpho-powered borrowing product outside the United States.
Silvercorp secures $220 million syndicated loan from banks

DeFi TVL Drops on All Top 20 Chains After KelpDAO Exploit
Recreate Meghan Markle’s Cool Mom Sneakers Look for $66


-

 NewsBeat6 days ago
Trump and Pope Leo: Behind their disagreement over Iran war
-

 Fashion3 days ago
Weekend Open Thread: Theodora Dress
-

 Crypto World7 days ago
SEC Signals Exemption for Crypto Interfaces From Broker Registration
-

 News Videos6 days ago
Secure crypto trading starts with an FIU-registered
-

 Sports4 days ago
NWFL Suspends Two Players Over Post-Match Clash in Ado-Ekiti
-

 Crypto World7 days ago
SEC Proposes Certain Crypto Interfaces Don’t Need to Register as Brokers
-

 Business1 day ago
Powerball Result April 18, 2026: No Jackpot Winner in Powerball Draw: $75 Million Rolls Over
-

 Crypto World3 days ago
Russia Pushes Bill to Criminalize Unregistered Crypto Services
-

 Politics3 days ago
Palestine barred from entering Canada for FIFA Congress
-
 Business4 days ago
Creo Medical agree sale of its manufacturing operation
-

 Politics1 day ago
Zack Polanski demands ‘council homes not luxury flats for foreign investors’
-
 Entertainment7 days ago
Brand New Day’ Footage Reveals the Devastating Impact of ‘Now Way Home’
-

 Crypto World3 days ago
Russia Introduces Bill To Criminalize Unregistered Crypto Services
-

 Tech2 days ago
Auto Enthusiast Scores Running Tesla Model 3 for Two Grand and Turns It Into Bare-Bones Go-Kart
-
 Entertainment7 days ago
Karol G’s ‘Ultra Raunchy’ Coachella Set Gave ‘Satanic Vibes’
-
 Tech6 days ago
Microsoft adds Windows protections for malicious Remote Desktop files
-

 Tech5 days ago
‘Avatar: Aang, The Last Airbender’ Leaked Online. Some Fans Say Paramount Deserves the Fallout
-

 Entertainment7 days ago
How Babylon 5 Turned Brief Side Story Into Emotional Masterpiece
-
 Tech7 days ago
What was the first ransomware attack to demand payment in Bitcoin?
-

 Business7 days ago
Intuitive Machines Stock Climbs 2.4% as $180M NASA Lunar Contract and $900M Revenue Outlook Fuel Momentum
You must be logged in to post a comment Login