
Crypto World
Bitcoin Holds Key Level, Altcoins Aim To Follow: Will Bears Relent?
Key points:
-
Bitcoin remains under pressure as bears are selling on rallies near the $74,508 resistance
-
The bears are mounting a solid defense in several major altcoins at higher levels, indicating a negative sentiment.
Bitcoin (BTC) has started the new week on a cautious note as bulls attempt to maintain the price above $67,500. Investors are not rushing in to buy the dip, as seen from the $133.3 million in outflows from BTC exchange-traded products last week. The total outflows from crypto investment products have risen to $3.8 billion over the past four weeks, according to a CoinShares update on Monday.
If BTC ends the month below $79,500, it will record its first-ever consecutive negative monthly closing in January and February. With more than 22% loss, BTC is staring at its worst first-quarter performance since the 49.7% loss in 2018, per CoinGlass data.

Despite BTC’s weak performance and uncertain near-term direction, Strategy co-founder Michael Saylor indicated in a post on X that the company is buying more BTC. That will be Strategy’s 99th BTC transaction, showing their long-term bullish view remains intact.
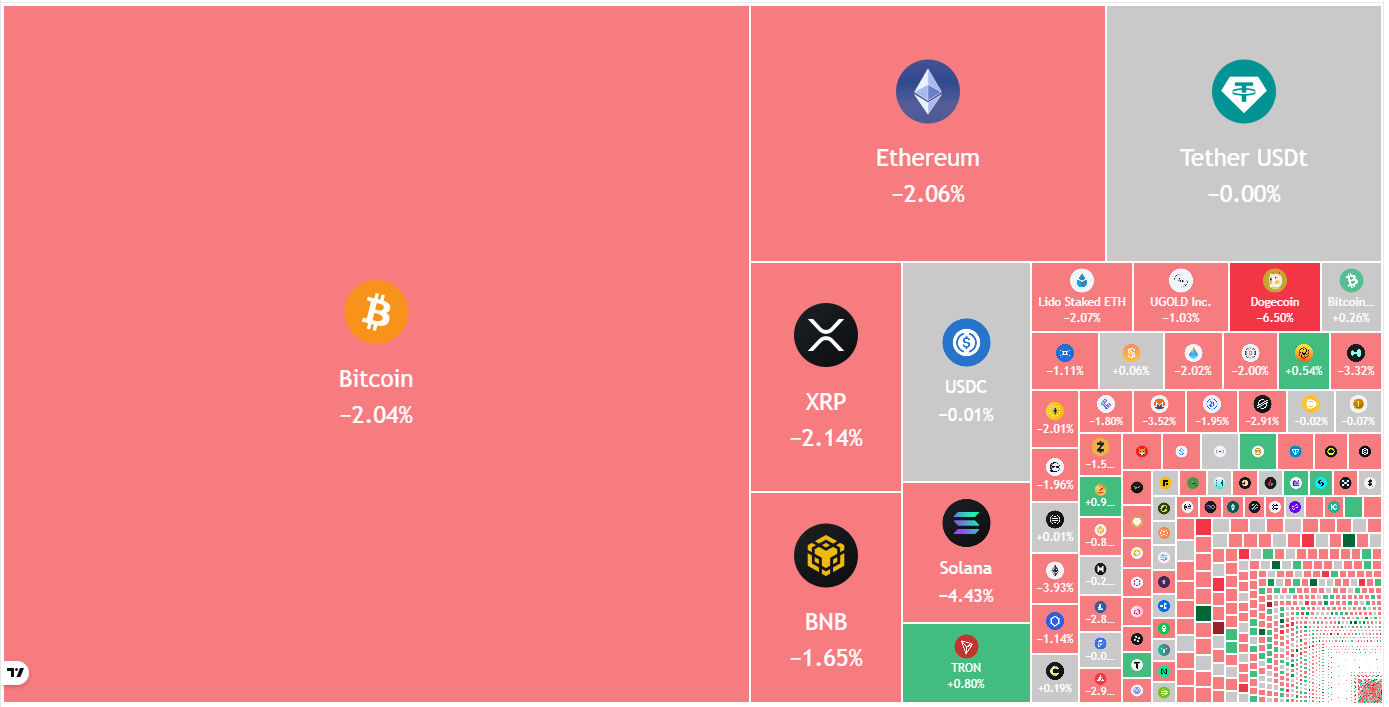
Could BTC and the major altcoins defend the support levels and start a strong relief rally? Let’s analyze the charts of the top 10 cryptocurrencies to find out.
S&P 500 Index price prediction
The S&P 500 Index (SPX) is witnessing a tough battle between the bulls and the bears at the support line of the ascending channel pattern.

The moving averages are on the verge of a bearish crossover, and the relative strength index (RSI) is in the negative territory, indicating that the bears are making a comeback. The index may start a deeper correction to 6,720 and then to solid support at 6,550 if the price breaks below the 6,780 level.
Buyers will have to propel the price above the 7,002 level to retain control. If they manage to do that, the index may resume its uptrend and surge toward the 7,290 level.
US Dollar Index price prediction
The US Dollar Index (DXY) has been trading below the moving averages, but the bears have failed to challenge the 96.21 to 95.55 support zone.

The bulls will try to strengthen their position by pushing the price above the moving averages. If they can pull it off, the index may rally to 99.49 and then to the overhead resistance at 100.54.
Contrarily, if the price turns down sharply from the moving averages, it suggests that the bears continue to sell on rallies. The index may the next leg of the downtrend on a close below the 95.55 support.
Bitcoin price prediction
Sellers are attempting to halt BTC’s recovery near $71,000, indicating that the bears remain sellers on rallies.

The sellers will have to pull the price below the $65,000 level to remain in command. The BTC/USDT pair may then retest the critical $60,000 level. If the $60,000 support cracks, the next stop is likely to be $52,500.
Buyers will have to drive the Bitcoin price above the breakdown level of $74,508 to signal that the bearish momentum is weakening. The pair may then surge toward the 50-day SMA ($83,910), where the bears are expected to mount a strong defense.
Ether price prediction
Ether (ETH) once again turned down from the $2,111 level on Sunday, indicating that the bears are fiercely defending the level.

Sellers will attempt to pull the price below the immediate support at $1,897. If they do that, the ETH/USDT pair may drop to the $1,750 level. Buyers are expected to defend the $1,750 level with all their might, as a close below it may sink the pair to $1,537.
Instead, if the Ether price turns up and breaks above the 20-day EMA ($2,221), it signals that the selling pressure is reducing. The pair may then rally to the 50-day SMA ($2,744).
BNB price prediction
BNB’s (BNB) relief rally fizzled out at $642 on Sunday, indicating that the bears are selling on every minor rise.

The bears will attempt to increase their hold by pulling the BNB price below the $570 level. If they manage to do that, the BNB/USDT pair may extend its decline to psychological support at $500.
The bulls will have to drive the price above the 20-day EMA ($686) to suggest that the bears are losing their grip. The pair may then climb to $730 and subsequently to the 50-day SMA ($817).
XRP price prediction
XRP (XRP) turned up from the support line of the descending channel pattern on Friday and pierced the 20-day EMA ($1.53) on Sunday.

However, the bears successfully defended the breakdown level of $1.61 and pulled the XRP price back below the 20-day EMA. The bulls are unlikely to give up easily and will make another attempt to clear the $1.61 level.
If they succeed, the XRP/USDT pair may rise to the 50-day SMA ($1.81). Such a move suggests that the pair may remain inside the channel for some more time.
Sellers will have to tug the price below the support line to gain the upper hand. The pair may then retest the Feb. 6 low of $1.11.
Solana price prediction
Buyers are attempting to push Solana (SOL) back above the breakdown level of $95, but the bears have held their ground.

The Solana price may trade inside the $76 to $95 range for some time. Such a move increases the likelihood of an upside breakout. The SOL/USDT pair may then rally toward $117.
This positive view will be negated in the near term if the price turns down and breaks below the $76 support. The pair may then retest the Feb. 6 low of $67, where the buyers are expected to step in.
Related: $75K or bearish ‘regime shift?’ Five things to know in Bitcoin this week
Dogecoin price prediction
Dogecoin (DOGE) turned down from the breakdown level of $0.12 on Sunday, indicating that the bears are defending the level.

The 20-day EMA ($0.10) is flattening out, and the RSI is just below the midpoint, signaling a possible range-bound action in the near term. The DOGE/USDT pair may swing between $0.08 and $0.12 for a few days.
Buyers will gain the upper hand on a close above the $0.12 resistance. That opens the doors for a rally to $0.16. Alternatively, the advantage will tilt in favor of the bears on a close below $0.08. The Dogecoin price may then slump to $0.06.
Cardano price prediction
Cardano’s (ADA) relief rally reached the 20-day EMA ($0.29) on Saturday, which is expected to act as a stiff hurdle.

If the bulls do not give up much ground to the bears, the possibility of a break above the 20-day EMA increases. That suggests the ADA/USDT pair may remain inside the descending channel for some more time. A break and close above the downtrend line signals a potential short-term trend change.
Sellers will have to pull the Cardano price below the support line to extend the downward move toward the next support at $0.20.
Bitcoin Cash price prediction
Bitcoin Cash (BCH) surged above the 20-day EMA ($544) on Friday, indicating that the bears are losing their grip.

The recovery is facing resistance at the 50-day SMA ($578), but a positive sign is that the bulls have not allowed the Bitcoin Cash price to slip back below the 20-day EMA. That increases the likelihood of the continuation of the relief rally. If buyers pierce the 50-day SMA, the BCH/USDT pair may reach $600.
Sellers will have to swiftly yank the price below the 20-day EMA to apply pressure on the bulls. The pair may then skid to the $500 support.
This article does not contain investment advice or recommendations. Every investment and trading move involves risk, and readers should conduct their own research when making a decision. While we strive to provide accurate and timely information, Cointelegraph does not guarantee the accuracy, completeness, or reliability of any information in this article. This article may contain forward-looking statements that are subject to risks and uncertainties. Cointelegraph will not be liable for any loss or damage arising from your reliance on this information.

Drift Protocol (DRIFT) published a detailed incident update on April 5, revealing that the $285 million exploit on April 1 was the result of a six-month intelligence operation attributed to North Korean state-backed actors.
The disclosure describes a level of social engineering that goes well beyond typical phishing or recruiter scams, involving in-person meetings, real capital deployment, and months of trust-building.
A Fake Trading Firm That Played the Long Game
According to Drift, a group posing as a quantitative trading firm first approached contributors at a major crypto conference in fall 2025.
Over the following months, these individuals appeared at multiple events across several countries, held working sessions, and maintained ongoing Telegram conversations about vault integrations.
Follow us on X to get the latest news as it happens
Between December 2025 and January 2026, the group onboarded an Ecosystem Vault on Drift, deposited over $1 million in capital, and participated in detailed product discussions.
By March, Drift contributors had met these individuals face-to-face on multiple occasions.
“…the most dangerous hackers don’t look like hackers,” commented crypto developer Gautham.
Even Web security experts find this concerning, with researcher Tay sharing that she initially expected a typical recruiter scam but found the operation’s depth far more alarming.
How the Devices Were Compromised
Drift identified three likely attack vectors:
- One contributor cloned a code repository the group shared for a vault frontend.
- A second downloaded a TestFlight application presented as a wallet product.
- For the repository vector, Drift pointed to a known VSCode and Cursor vulnerability that security researchers had been flagging since late 2025.
That flaw allowed arbitrary code to execute silently the moment a file or folder was opened in the editor, with no user interaction required.
After the April 1 drain, the attackers scrubbed all Telegram chats and malicious software. Drift has since frozen remaining protocol functions and removed compromised wallets from the multisig.
The SEALS 911 team assessed with medium-high confidence that the same threat actors carried out the October 2024 Radiant Capital hack, which Mandiant attributed to UNC4736.
On-chain fund flows and operational overlaps between the two campaigns support that connection.
Industry Calls for a Security Reset
Armani Ferrante, a prominent Solana developer, called on every crypto team to pause growth efforts and audit their entire security stack.
“Every team in crypto should use this as an opportunity to slow down and focus on security. If possible, dedicate an entire team to it… you can’t grow if you’re hacked,” said Ferrante.
Drift noted that the individuals who appeared in person were not North Korean nationals. DPRK threat actors at this level are known to deploy third-party intermediaries for face-to-face engagement.
Mandiant, which Drift has engaged for device forensics, has not yet formally attributed the exploit.
The disclosure serves as a warning to the broader ecosystem. Drift urged teams to audit access controls, treat every device that touches a multisig as a potential target, and contact SEAL 911 if they suspect similar targeting.
The post Drift Protocol’s $285 Million Heist Started With a Handshake and 6 Months of Trust appeared first on BeInCrypto.
Crypto World
Algorand Hits Regulatory and Quantum Milestones as Institutional Adoption Accelerates in 2026

TLDR:
- The US SEC and CFTC jointly classified $ALGO as a digital commodity, removing long-standing institutional barriers in 2026.
- Google’s Quantum AI team cited Algorand 32 times in a whitepaper, recognizing its post-quantum cryptography as industry-leading.
- Algorand and Algorand Technologies merged into one Delaware entity, backed by a $15 million protocol development commitment.
- Staking launched on Revolut for 70 million users as Post Finance added $ALGO custody, marking major mainstream access milestones.
Algorand is gaining renewed attention from institutions and regulators in 2026. The blockchain network, founded by Turing Award winner Silvio Micali, has recorded several major milestones in recent months.
These include regulatory guidance from US agencies, a Google quantum endorsement, and a major organizational overhaul.
Together, these developments are drawing fresh interest from banks, governments, and enterprise builders worldwide. The network has processed over 3.5 billion on-chain transactions with zero downtime since launch.
Regulatory Clarity and Quantum Recognition Open New Doors
In March and early April 2026, the US SEC and CFTC issued joint guidance classifying $ALGO as a digital commodity. This removed a major compliance barrier that had held back institutional investors for years.
Algorand Foundation CEO Staci Warden described the decision as “bedrock regulatory clarity.” Crypto analyst account @We_R_Crypto noted this language “resonates deeply in boardrooms wary of compliance risk.”
The classification aligns $ALGO with asset classes traditional finance already understands well. As a result, institutional capital that previously held back can now move more freely into the ecosystem.
Around the same time, the Foundation and Algorand Technologies merged into a single Delaware-based entity. The consolidation brought a new Board of Directors and a $15 million commitment to protocol development.
New appointments further strengthened the organization’s technical bench. Bruno Martins was named Chief Technology Officer, while Chris Peikert joined as Chief Scientific Officer. These hires reflect a clear focus on enterprise performance and long-term cryptographic security.
On March 31, Google’s Quantum AI team published a whitepaper citing the network 32 times. The paper positioned it as a leading real-world deployment of post-quantum cryptography.
Lattice-based cryptographic techniques used by the protocol address growing concerns about quantum threats to existing standards. The market responded with strong price momentum following the whitepaper’s publication.
Institutional Partnerships and Real-World Utility Drive Adoption
Algorand’s accessibility expanded when staking went live on Revolut in early 2026. The platform serves over 70 million customers globally.
Through this integration, users can now participate in network security and earn rewards. Swiss institution Post Finance also added $ALGO trading and custody services for its clients.
Beyond staking, the network is building momentum in real-world asset tokenization. Its low fees and efficient settlement infrastructure suit fractional ownership and programmable compliance applications. These use cases align naturally with where Algorand’s infrastructure is currently positioned.
The x402 standard for agentic commerce represents another frontier. Demonstrated live at SXSW, x402 enables autonomous agents to transact directly on-chain.
This opens doors for AI-driven payment models and automated subscription services. Humanitarian use cases, including cross-border aid distribution with UNHCR, further demonstrate the network’s real-world reach.
On the education side, the Algo_Bharat initiative has established 100 blockchain clubs at Indian universities. This effort builds a developer pipeline in one of the world’s fastest-growing digital economies.
The xGov programme complements this by funding community builders through transparent, retroactive grants.


Bitcoin is trading at $67,100 on Sunday, roughly flat over the weekend, but the mood around it is the worst it has been since the Iran conflict began on February 28.
Santiment data published Saturday shows social media commentary on bitcoin has hit a ratio of five bearish posts for every four bullish ones, the most negative skew in five weeks. The last time sentiment was this one-sided was the day Operation Epic Fury launched and bitcoin dropped below $65,000 for the first time in the conflict.
🗣️ According to social data across X, Reddit, Telegram, and other platforms, Bitcoin is seeing the highest ratio of bearish discussions (fear) since February 28th. With crypto’s #1 market cap sitting at $66.8K, FUD has crept back in with the community showing a key lack of… pic.twitter.com/Ym7SbUC22I
— Santiment ✈️ 🇫🇷 EthCC (@santimentfeed) April 4, 2026
The Fear and Greed Index sits at 9, deep in extreme fear territory, where it has been pinned between 8 and 14 for over a month. That kind of sustained single-digit reading without a corresponding price collapse is unusual. In 2022, the index hit comparable levels during the LUNA crash and the FTX implosion, both of which involved actual capitulation events with 20% to 30% single-day drawdowns. This time, bitcoin is grinding sideways in a $65,000 to $73,000 range while sentiment collapses around it.
What matters is that sentiment and price are telling completely different stories. Bitcoin has spent five weeks absorbing war headlines, Trump speeches, $403 million liquidation events, and the most bearish on-chain demand data in years without actually going anywhere. It is still trading within 5% of where it was when the conflict started, grinding sideways while the mood around it collapses.
The reason it hasn’t broken lower is visible in the institutional flow data. ETFs absorbed approximately 50,000 BTC in March, the highest monthly pace since October 2025. Strategy added another 44,000 BTC. Morgan Stanley received approval for a bitcoin ETF at 14 basis points, opening 16,000 advisors and $6.2 trillion in assets under management. The institutional bid is real and it is holding the floor.
But the floor is all it is holding. A CoinDesk analysis from early Saturday showed overall 30-day apparent demand at negative 63,000 BTC, meaning the rest of the market is selling faster than institutions can absorb. Whales holding 1,000 to 10,000 BTC have swung from adding 200,000 BTC a year ago to removing 188,000 today, one of the most aggressive distribution cycles on record.
April has historically been one of bitcoin’s strongest months, finishing green 10 out of 15 years with an average gain of 20.9%. But seasonality does not trade against a war, a negative Coinbase Premium, record whale distribution, and a Fear and Greed Index stuck in single digits.


Ant Digital Technologies, the blockchain division of Chinese conglomerate Ant Group, has unveiled a new platform aimed at enabling AI agents, not humans, to become the main participants in crypto transactions called Anvita.
Unveiled at the company’s Real Up summit in Cannes, Anvita is Ant’s bet on what it calls an “agent-to-agent economy,” where autonomous software programs can hold assets, trade, and make payments with little to no human involvement.
Anvita consists of two main products at its inception. The first, Anvita TaaS (Tokenization-as-a-Service), is focused on tokenizing real-world assets for institutions, including custody and treasury tools. The second, Anvita Flow, is a platform for AI agents to register, find each other, coordinate tasks and settle payments in real time.
“Pure RWA is just the ‘static infrastructure’ of digital assets,” said Zhuoqun Bian, president of blockchain business at Ant Digital Technologies. “The real transformation lies in moving toward an onchain agentic economy, where autonomous agents will not just analyze data — they will hold assets, execute trades, and optimize portfolios.”
Anvita Flow integrates the x402 protocol, developed by Coinbase and Cloudflare, which enables stablecoin payments directly over HTTP. Agents interacting on the platform can complete sub-cent transactions instantly using USDC, removing the need for traditional billing systems, subscriptions or human approval.
The system also includes an Agent Store with modules for data collection, financial analysis and gaming. Developers can list their own agents, and the platform supports major frameworks like OpenClaw and Claude Code, with flexible hosting options.
In practice, the potential extends beyond tokenized assets toward a more active onchain economy. Agents could allocate resources, execute trades, handle services on behalf of users, and settle micro-transactions automatically as they interact.
Ant Digital joins a growing field of companies building infrastructure for AI-driven commerce. Visa and Coinbase have released competing protocols for agent-based payments, with Visa’s Trusted Agent Protocol targeting card-rail checkout and Coinbase’s x402 targeting stablecoin micropayments.
Google unveiled its Agent Payments Protocol (AP2) in September, backed by over 60 organisations. Mastercard acquired stablecoin firm BVNK for $1.8 billion in the largest stablecoin infrastructure deal on record, signaling that traditional payment networks also see blockchain settlement as part of their future.
The Solana Foundation has reported the network already processed over 15 million onchain agent transactions, and Coinbase CEO Brian Armstrong has said he expects agents to surpass humans in transaction volume.
McKinsey has projected that AI agents could mediate $3 trillion to $5 trillion of global consumer commerce by 2030.
Still, usage remains lackluster. The x402 protocol is currently seeing roughly $28,000 in daily volume, much of it from testing, with Artemis analysts flagging roughly half of observed transactions as artificial activity.
Ant Digital’s blockchain, which already supports tokenized assets from various financial institutions, is currently pursuing USDC integration with Circle and applying for stablecoin licences in Hong Kong, Singapore and Luxembourg.


Satoshi Nakamoto’s listed birthday has again drawn attention across the crypto market on April 5.
Summary
- Satoshi Nakamoto’s profile lists April 5, 1975, making Bitcoin’s founder 51 years old on Sunday.
- April 5 may be symbolic because it matches Executive Order 6102 and gold ownership history.
- Satoshi’s final known public forum post came in 2010, followed by last messages in 2011.
The date comes from the Bitcoin creator’s profile on the P2P Foundation and remains one of the few public details tied to the pseudonymous founder.
The Bitcoin community marked April 5 as the birthday linked to Satoshi Nakamoto. The date appears on Nakamoto’s P2P Foundation profile, where the birth date is listed as April 5, 1975.
Based on that entry, Satoshi would turn 51 on April 5, 2026. Still, there is no public proof that the date reflects a real birthday, and the identity behind the name remains unknown.
Satoshi Nakamoto is the name used by the person or group that created Bitcoin, wrote its white paper, and launched its original software. Even after more than a decade, verified facts about the founder remain limited.
That is why the birthday entry continues to attract attention each year. The profile detail stands out because Satoshi left very little personal information in public view, making even a simple date a recurring point of discussion.
The date has also drawn interest because some Bitcoin users connect it to US monetary history. April 5 matches the anniversary of Executive Order 6102, a 1933 order that restricted private gold ownership in the United States.
Some members of the crypto community also point to the listed birth year of 1975, when private gold ownership again became legal in the US. Because of that overlap, some observers believe the date may have been symbolic rather than personal. That view remains uncertain, and no direct proof confirms the reason behind the choice.
Bitcoin founder remains absent from public view
Satoshi’s public silence has added to the mystery around the profile entry. On Dec. 13, 2010, Satoshi made the final known post on the BitcoinTalk forum.
In 2011, Satoshi sent the last known private messages to developers and said Bitcoin was in “good hands.”
Since then, no verified public message has appeared from the Bitcoin founder. Whether April 5, 1975 is a real birthday or a symbolic reference, the date continues to serve as a yearly reminder of the person or group behind Bitcoin’s creation.

X Head of Product Nikita Bier says no technology exists to fix the spam replies plaguing crypto accounts, claiming 80% of crypto activity is driven by bots.
The statement comes amid complaints that the platform is a “horrible website,” and concessions that it remains the least-worst channel for open communication.
X’s Bier Draws a Line on Crypto Spam
Bier’s admission marks a shift in tone from X’s earlier confidence in fighting spam through technical measures.
“The financial incentive to spam on X will decline enormously over the next 30 days and soon be negative,” X’s Nikira Beir said in March.
Over the past year, the platform reportedly purged 1.7 million bot accounts, revoked API access from InfoFi apps that incentivized posting, and rolled out a dislike button to suppress low-quality replies.
However, Bier now argues those tools have limits. He said the only viable path forward is enabling 2nd-degree reply restrictions, a feature X has been testing with Premium+ subscribers.
“There is no technology in the world that could ever fix the spam replies of a crypto account — because 80% of crypto is simply bots. The only path out is to enable 2nd-degree reply restrictions,” wrote Bier in a Sunday post.
The setting expands who can reply to a post beyond just direct followers to include followers of followers, while still blocking unknown accounts and bots.
The concession suggests X (Twitter) views the crypto bot problem as structural rather than solvable solely through detection.
If 80% of crypto accounts are bots, as Bier claims, no filtering system can separate legitimate users from automated ones at scale without collateral damage to real accounts.
Solana’s Anatoly Yakovenko and the Crypto Communication Crisis
Yakovenko’s response highlighted a deeper frustration within the crypto industry. The Solana co-founder called the platform “horrible,” yet acknowledged that open threads on X remain the best available option for public crypto communication.
The exchange followed a satirical post by Solana community member that mocked the state of crypto communications.
The post listed increasingly absurd rules, from not answering X DMs and Telegram messages to not answering your door or responding if your name is called.
The joke landed amid heightened security concerns following the $285 million Drift Protocol exploit on April 1, which used social engineering rather than code vulnerabilities.
That context added weight to the humor. The Drift attacker compromised administrative access through misleading approvals, not a smart contract bug.
In that environment, trusting any inbound communication becomes a genuine operational risk for crypto builders.
X’s Anti-Spam Playbook So Far
Bier has driven several anti-spam measures since joining X as Head of Product in mid-2025. In January 2026, he revoked API access from InfoFi apps like Kaito, which rewarded users for posting on X.
The move crashed Kaito’s token price by 20% and forced the project to sunset its Yaps incentive program.
In March 2026, X teased a dislike button on replies, and Bier signaled that spam’s financial incentive on the platform would turn negative within 30 days.
The platform also began preparing an auto-lock feature that flags accounts posting about crypto for the first time, requiring identity verification before they can continue.
Despite those efforts, Bier’s latest statement reframes the fight. Rather than promising to eliminate crypto spam, he is now telling users the problem is too deeply embedded in crypto’s own ecosystem for any platform to solve.
Could the 2nd-degree reply restrictions meaningfully reduce spam, or would they simply push bot operators to adapt?
Do you have something to share about Twitter’s spam problem, or any other topic? Write to us or join the discussion on our BeInCrypto Telegram channel and in our newsletters.
Follow us on X to get the latest news as it happens
The post 80% of Crypto Is Bots: Why X (Twitter) Might Never Fix the Spam Problem appeared first on BeInCrypto.


Anthropic has entered US election financing with a new political action committee as debate over artificial intelligence policy grows in Washington.
Summary
- Anthropic launched AnthroPAC, giving employees a channel to support candidates during rising AI policy debate.
- The PAC arrived as Anthropic battles Pentagon limits tied to weapons use and surveillance policy.
- Google-backed Texas expansion shows Anthropic is growing political reach while scaling infrastructure for AI demand.
The move adds a new political step for the company at a time when it is also fighting the Pentagon in court and expanding its AI infrastructure plans.
Anthropic filed a statement of organization with the Federal Election Commission on April 3 to create “AnthroPAC.” Reports said the committee is an employee-funded PAC tied to Anthropic and set up as a “separate segregated fund.”
The PAC is expected to back candidates from both major parties. Reports also said the money will come from voluntary employee contributions, while federal campaign finance rules require public disclosure and limit how much PACs can give to federal candidates.
The filing comes as AI policy draws more attention in Washington. Anthropic has already taken part in the political debate this cycle through a $20 million contribution to Public First Action, a group that supports AI safety efforts.
The new PAC gives Anthropic another channel to support lawmakers working on AI rules. That step places the company more directly inside the policy fight as lawmakers, regulators, and technology firms push different approaches on AI governance.
Anthropic is also in a legal dispute with the Pentagon over how its AI systems can be used. The company said in March that the Department of War labeled it a “supply chain risk” after it opposed the use of its tools in autonomous weapons and mass surveillance.
A federal judge in California temporarily blocked that action in late March. The Associated Press reported this week that the Trump administration has appealed that ruling to the Ninth Circuit.
Google backs Texas expansion
At the same time, Anthropic is expanding its computing capacity. Reports said Google plans to help finance a Texas data center project for Anthropic that could exceed $5 billion in its first phase and is being developed with Nexus Data Centers.
That project shows how fast AI infrastructure demand is growing. It also links Anthropic’s political move with a wider business push as the company seeks more influence in policy and more capacity for model development.
Key Takeaways
- Elon Musk’s SpaceX is preparing for a potential IPO with a valuation reaching $1.5 trillion
- The company’s Starlink division pulled in approximately $11.8 billion during 2025
- xAI, Musk’s artificial intelligence venture, was absorbed into SpaceX this year
- Investor confidence remains shaky after 2021 IPO class suffered massive losses of 70–80%
- Direct investment in SpaceX remains unavailable to retail traders, with limited fund access through ARKVX
Elon Musk’s aerospace powerhouse is preparing for what could become one of the largest initial public offerings in American market history. With a private valuation climbing to $1.5 trillion, SpaceX currently holds the title of the planet’s most valuable privately-held enterprise.
Musk launched SpaceX back in 2002 with Mars colonization as his ultimate vision. Over two decades, the enterprise has transformed into a leading player across rocket technology, satellite-based internet connectivity, and artificial intelligence applications.
The Falcon 9 launch vehicle stands as the globe’s most economically efficient and dependable rocket system, having completed more than 633 successful missions. Meanwhile, the company’s Starship platform represents a completely reusable spacecraft engineered for transporting humans and equipment to lunar and Martian destinations.
SpaceX’s Starlink internet constellation generated roughly $11.8 billion during 2025, establishing itself as a cornerstone revenue driver for the organization.
The integration of xAI into SpaceX’s portfolio occurred earlier this year. Musk has publicly stated his vision for space-based solar energy collection to fuel AI computing infrastructure on a massive scale, explaining the strategic rationale behind combining these ventures.
Market Volatility and IPO Concerns
The timing of SpaceX’s public market entry comes amid lingering skepticism about new listings. The IPO frenzy of 2021 left countless investors nursing substantial losses.
Allbirds serves as a cautionary tale—once commanding a $2.2 billion valuation, the company recently sold for approximately $39 million. BuzzFeed has seen its market capitalization collapse from over $1 billion to roughly $23 million. Names like UiPath, GitLab, and Warby Parker continue trading 70–80% beneath their debut prices.
These spectacular failures have created a more skeptical investor base. SpaceX faces pressure to demonstrate sustainable profitability rather than relying on market enthusiasm alone.
Unlike numerous ventures from the 2021 cohort, SpaceX operates as an established business generating substantial revenue. However, market observers note that restoring investor confidence requires clearing a significantly higher bar following years of disappointing IPO performance.
Mainstream investors lack direct purchasing options for SpaceX equity at present. Access remains limited to specialized vehicles like the ARK Venture Fund and XOVR ETF, both maintaining modest positions in the company.
Publicly Traded Space Sector Alternatives
Investors seeking immediate exposure to the space economy can access several companies already trading on public exchanges.
Rocket Lab has successfully deployed 252 satellites and is advancing development of its Neuron next-generation launch system. Intuitive Machines maintains a NASA partnership and provided critical infrastructure for the recent Artemis 2 lunar mission.
AST SpaceMobile operates as a direct Starlink competitor in satellite communications, with AT&T and Verizon among its strategic partners.
On the reporting date, Intuitive Machines’ shares surged 18.53%. AST SpaceMobile climbed 10.28%, while Rocket Lab advanced 3.27%.
Crypto World
OpenAI Cap Table Leak Reveals Microsoft’s 17x Windfall While Sam Altman Holds Zero Equity
Key Takeaways
- Microsoft’s approximately $13B investment in OpenAI now stands at roughly $228B — delivering a 17x multiple
- SoftBank deployed $64.6B and has unrealized gains exceeding $50B, with holdings valued at approximately $99.3B
- OpenAI CEO Sam Altman maintains no ownership position in the artificial intelligence company
- The nonprofit OpenAI Foundation retains 25.8% ownership acquired at no cost — while maintaining complete board control
- Nvidia’s position shows a slight loss, holding $29.6B in value against a $30.1B investment
An ownership breakdown detailing OpenAI’s shareholder structure surfaced online in early April, sparking widespread discussion about the distribution of value within the AI giant. Investor Sheel Mohnot shared the document on X, which appears compiled from publicly available filings and secondary market transactions. The data reflects OpenAI’s current $852 billion post-money valuation after completing a $122 billion capital raise.
The spreadsheet details each major investor’s ownership percentage, capital deployed, and return multiplier. This information provides unprecedented transparency into the financial structure of one of tech’s most valuable private companies ahead of its anticipated public offering.
Microsoft emerges as the dominant financial beneficiary according to the leaked data. The tech giant deployed approximately $13 billion through multiple funding rounds — beginning with a $1 billion investment in 2019, followed by a massive $10 billion injection in January 2023, plus an additional $2 billion during 2024. The company’s 26.79% ownership stake carries an estimated value of $228.3 billion, representing approximately a 17.6x return multiple. This combination of scale and returns is unmatched among OpenAI’s investor base.
Microsoft’s quarterly SEC filings verify the $13 billion total investment amount. OpenAI recently identified Microsoft as a material business dependency in investor disclosures, referencing revenue-sharing agreements and exclusive cloud infrastructure commitments.
SoftBank stands as the largest capital contributor beyond Microsoft, having pledged $64.6 billion to OpenAI. The Japanese conglomerate’s 11.66% ownership position is currently valued at approximately $99.3 billion. This represents unrealized gains surpassing $50 billion on the investment. CNBC reporting verified that SoftBank completed funding its $40 billion commitment by December 2025, utilizing a $40 billion bridge financing facility arranged by JPMorgan and Goldman Sachs.
Original Backers See Extraordinary Multiples
First movers in OpenAI’s funding history achieved the most impressive return multipliers, despite smaller absolute dollar amounts. Khosla Ventures deployed roughly $50 million during 2019, with that position now valued at approximately $1.5 billion — representing a 30x gain. Sound Ventures, the investment firm co-founded by entertainer Ashton Kutcher, committed between $20–30 million and currently holds about $1.3 billion in value, translating to a 43x multiple. Thrive Capital invested $3.5 billion and maintains a 1.98% stake currently worth $16.9 billion.
Nvidia represents the sole investor showing negative returns. The chipmaker holds 3.47% of OpenAI with a current valuation of $29.6 billion, compared to an initial cost basis of $30.1 billion. Much of Nvidia’s contribution came through GPU compute infrastructure rather than direct cash, making the return calculation more nuanced.
CEO Sam Altman’s Equity Remains Undetermined
Perhaps the most striking revelation in the ownership document is that Sam Altman, who has served as OpenAI CEO since 2019, currently possesses zero equity in the organization. His ownership line item shows as undecided. Board chairman Bret Taylor publicly stated in October 2024 that Altman’s equity arrangement had not been finalized. Altman personally refuted speculation about imminent equity grants during an internal employee gathering.
The original OpenAI Foundation nonprofit entity maintains 25.8% ownership with zero capital invested — theoretically producing an infinite return on a holding valued at approximately $219.8 billion. While representing a minority economic interest, the Foundation retains absolute authority over all board member appointments.
OpenAI is preparing for a public market debut targeted for 2026 or early 2027, with discussions centering on a potential $1 trillion valuation. Industry observers anticipate Altman’s ownership compensation will be addressed in connection with that liquidity event.


Drift Protocol said the April 1 attack on its platform followed months of planning and social engineering.
Summary
- Drift said attackers spent six months building trust before using malicious tools to breach contributor devices.
- The exchange linked the exploit with medium-high confidence to actors behind Radiant Capital’s October 2024 hack.
- Drift said repeated in-person contact at crypto events helped attackers study contributors and gain access.
The decentralized exchange linked the case to a group that spent time building trust with contributors before sending malicious tools and links. External estimates put the loss at about $280 million.
Drift Protocol said its early review found a long and organized campaign against the platform. The team said the attackers showed “organizational backing, resources, and months of deliberate preparation” during the operation.
The exchange said the contact began around October 2025. According to Drift, people posing as members of a quantitative trading firm approached contributors at a major crypto conference and claimed they wanted to integrate with the protocol.
Drift said the group kept meeting contributors at several industry events over the next six months. The team said the people involved were technically skilled, knew how Drift worked, and appeared to have real professional backgrounds.
That steady contact helped the group gain trust. Drift said the attackers later used malicious links and tools shared with contributors to compromise devices, carry out the exploit, and remove traces of their activity after the breach.
In addition, Drift said it has “medium-high confidence” that the same actors behind the October 2024 Radiant Capital hack carried out this exploit. That earlier attack caused losses of about $58 million and also involved malware used to gain access to internal systems.
Radiant Capital said in December 2024 that a North Korea-aligned hacker posed as a former contractor and sent malware through Telegram. Radiant said “this ZIP file” later spread among developers for feedback and opened the way for the intrusion.
Drift warns conferences can become attack targets
Drift said the people who met contributors in person “were not North Korean nationals.” At the same time, the team said DPRK-linked threat actors often use third-party intermediaries for face-to-face contact and relationship building.
The exchange said it is now working with law enforcement and other crypto industry participants to build a full record of the April 1 attack.
The case has also added a fresh warning for crypto firms, as conferences and in-person meetings can give threat groups a chance to study teams, build trust, and prepare later attacks.

Every Celeb Who Has Joined SNL’s Five-Timers Club

Another Reform candidate has praised Enoch Powell

Iran-US war latest: Trump tells Tehran to ‘open the Strait or you’ll be living in hell’ in swear-laden rant


-

 NewsBeat3 days ago
Steven Gerrard disagrees with Gary Neville over ‘shock’ Chelsea and Arsenal claim | Football
-

 Business3 days ago
No Jackpot Winner and $194 Million Prize Rolls Over
-

 Fashion2 days ago
Weekend Open Thread: Spanx – Corporette.com
-
Entertainment6 days ago
Fans slam 'heartbreaking' Barbie Dream Fest convention debacle with 'cardboard cutout' experience
-

 Crypto World4 days ago
Gold Price Prediction: Worst Month in 17 Years fo Save Haven Rock
-

 Tech6 days ago
The Pixel 10a doesn’t have a camera bump, and it’s great
-
Crypto World5 days ago
Dems press CFTC, ethics board on prediction-market insider trades
-

 Tech6 days ago
Avatar Legends: The Fighting Game comes out in July and it looks pretty slick
-

 Business3 days ago
Login and Checkout Issues Spark Merchant Frustration
-

 Sports15 hours ago
India men’s 4x400m and mixed 4x100m relay teams register big progress | Other Sports News
-

 Tech6 days ago
Apple will hide your email address from apps and websites, but not cops
-

 Sports5 days ago
Tallest college basketball player ever, standing at 7-foot-9, entering transfer portal
-

 Tech5 days ago
EE TV is using AI to help you find something to watch
-

 Politics6 days ago
Should Trump Be Scared Strait?
-

 Tech5 days ago
Flipsnack and the shift toward motion-first business content with living visuals
-

 Fashion6 days ago
The Best Spring Trends of 2026
-

 Tech5 days ago
How to back up your iPhone & iPad to your Mac before something goes wrong
-
Crypto World7 days ago
Bitcoin’s Six-Month Losing Streak: What On-Chain Data Says About the Market’s Next Move
-

 Politics6 days ago
BBC slammed for ignoring author of The Fraud
-
Tech5 days ago
Daily Deal: StackSkills Premium Annual Pass
You must be logged in to post a comment Login