
Crypto World
Bitcoin Price Loses $63,000 Support, Experts Eye $60,000 Next
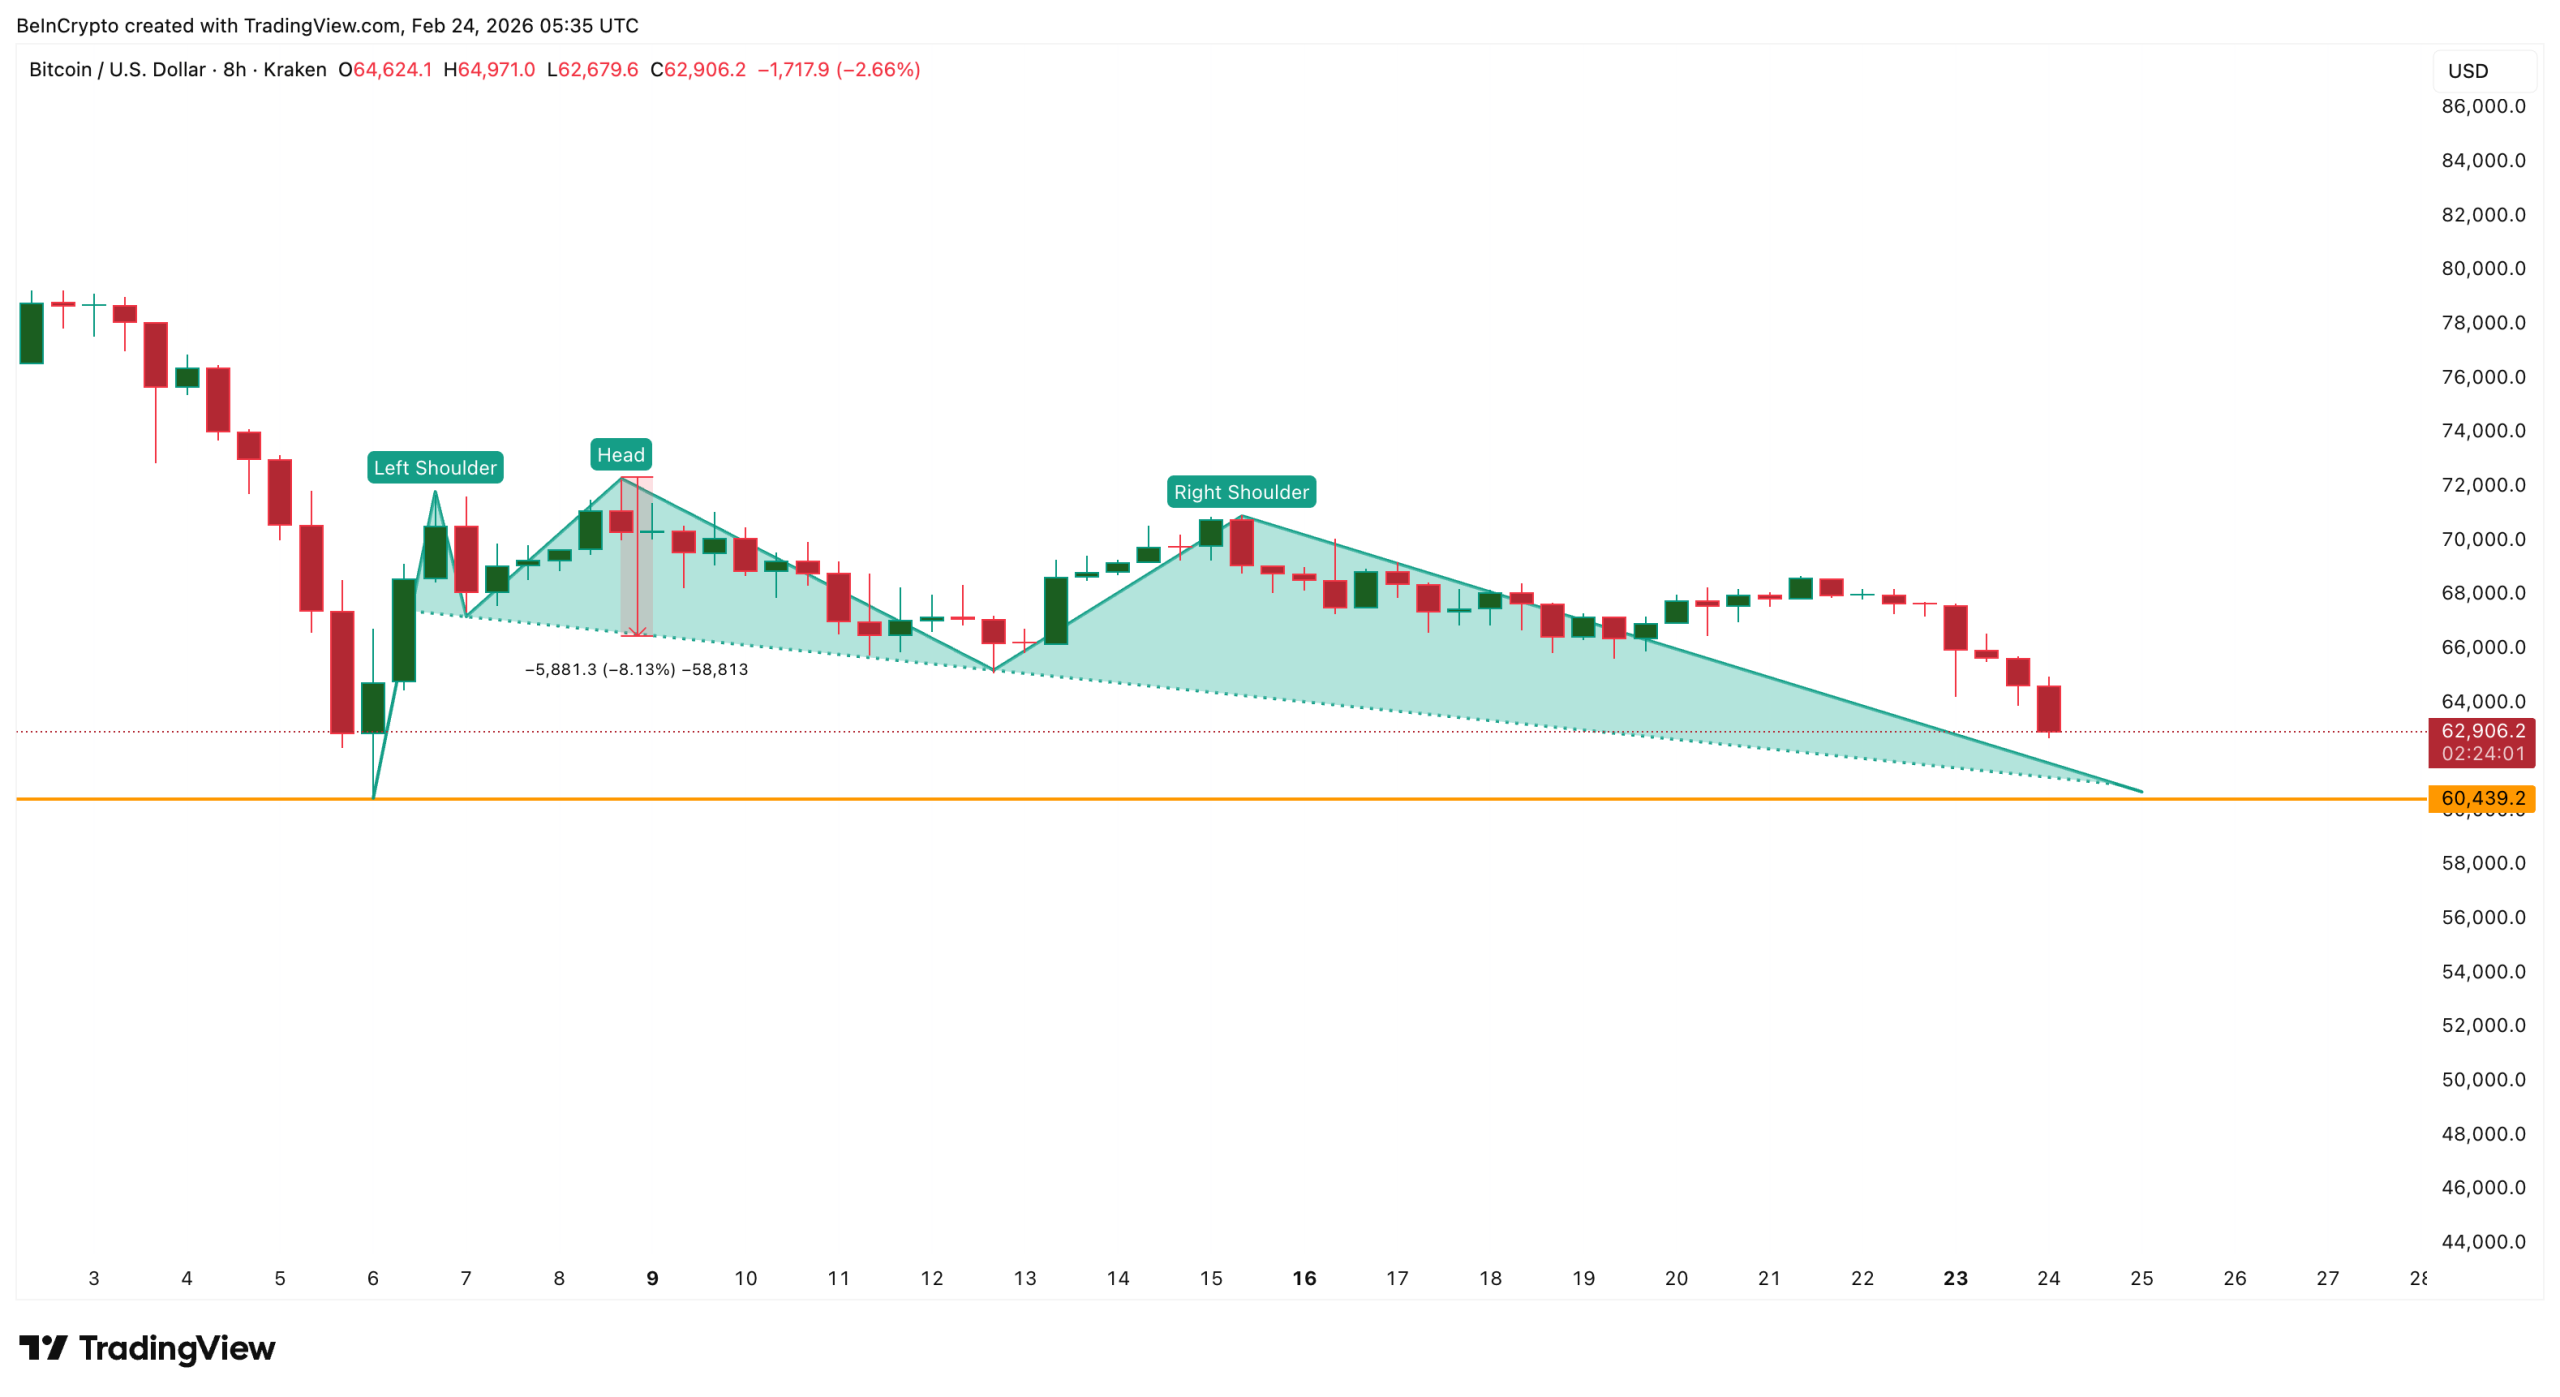
Bitcoin has slipped below the $63,000 level, extending its monthly decline to nearly 30%. The drop reflects more than short-term volatility. It shows deeper structural weakness building across the network and institutional flows.
This weakness is appearing even as Bitcoin enters its longest miner capitulation phase, year-on-year. At the same time, institutional demand through ETFs continues to deteriorate. Together, these forces are now pushing Bitcoin toward one of its most important support zones this cycle.
Bearish Pattern And Miner Income Collapse Explain Weakness
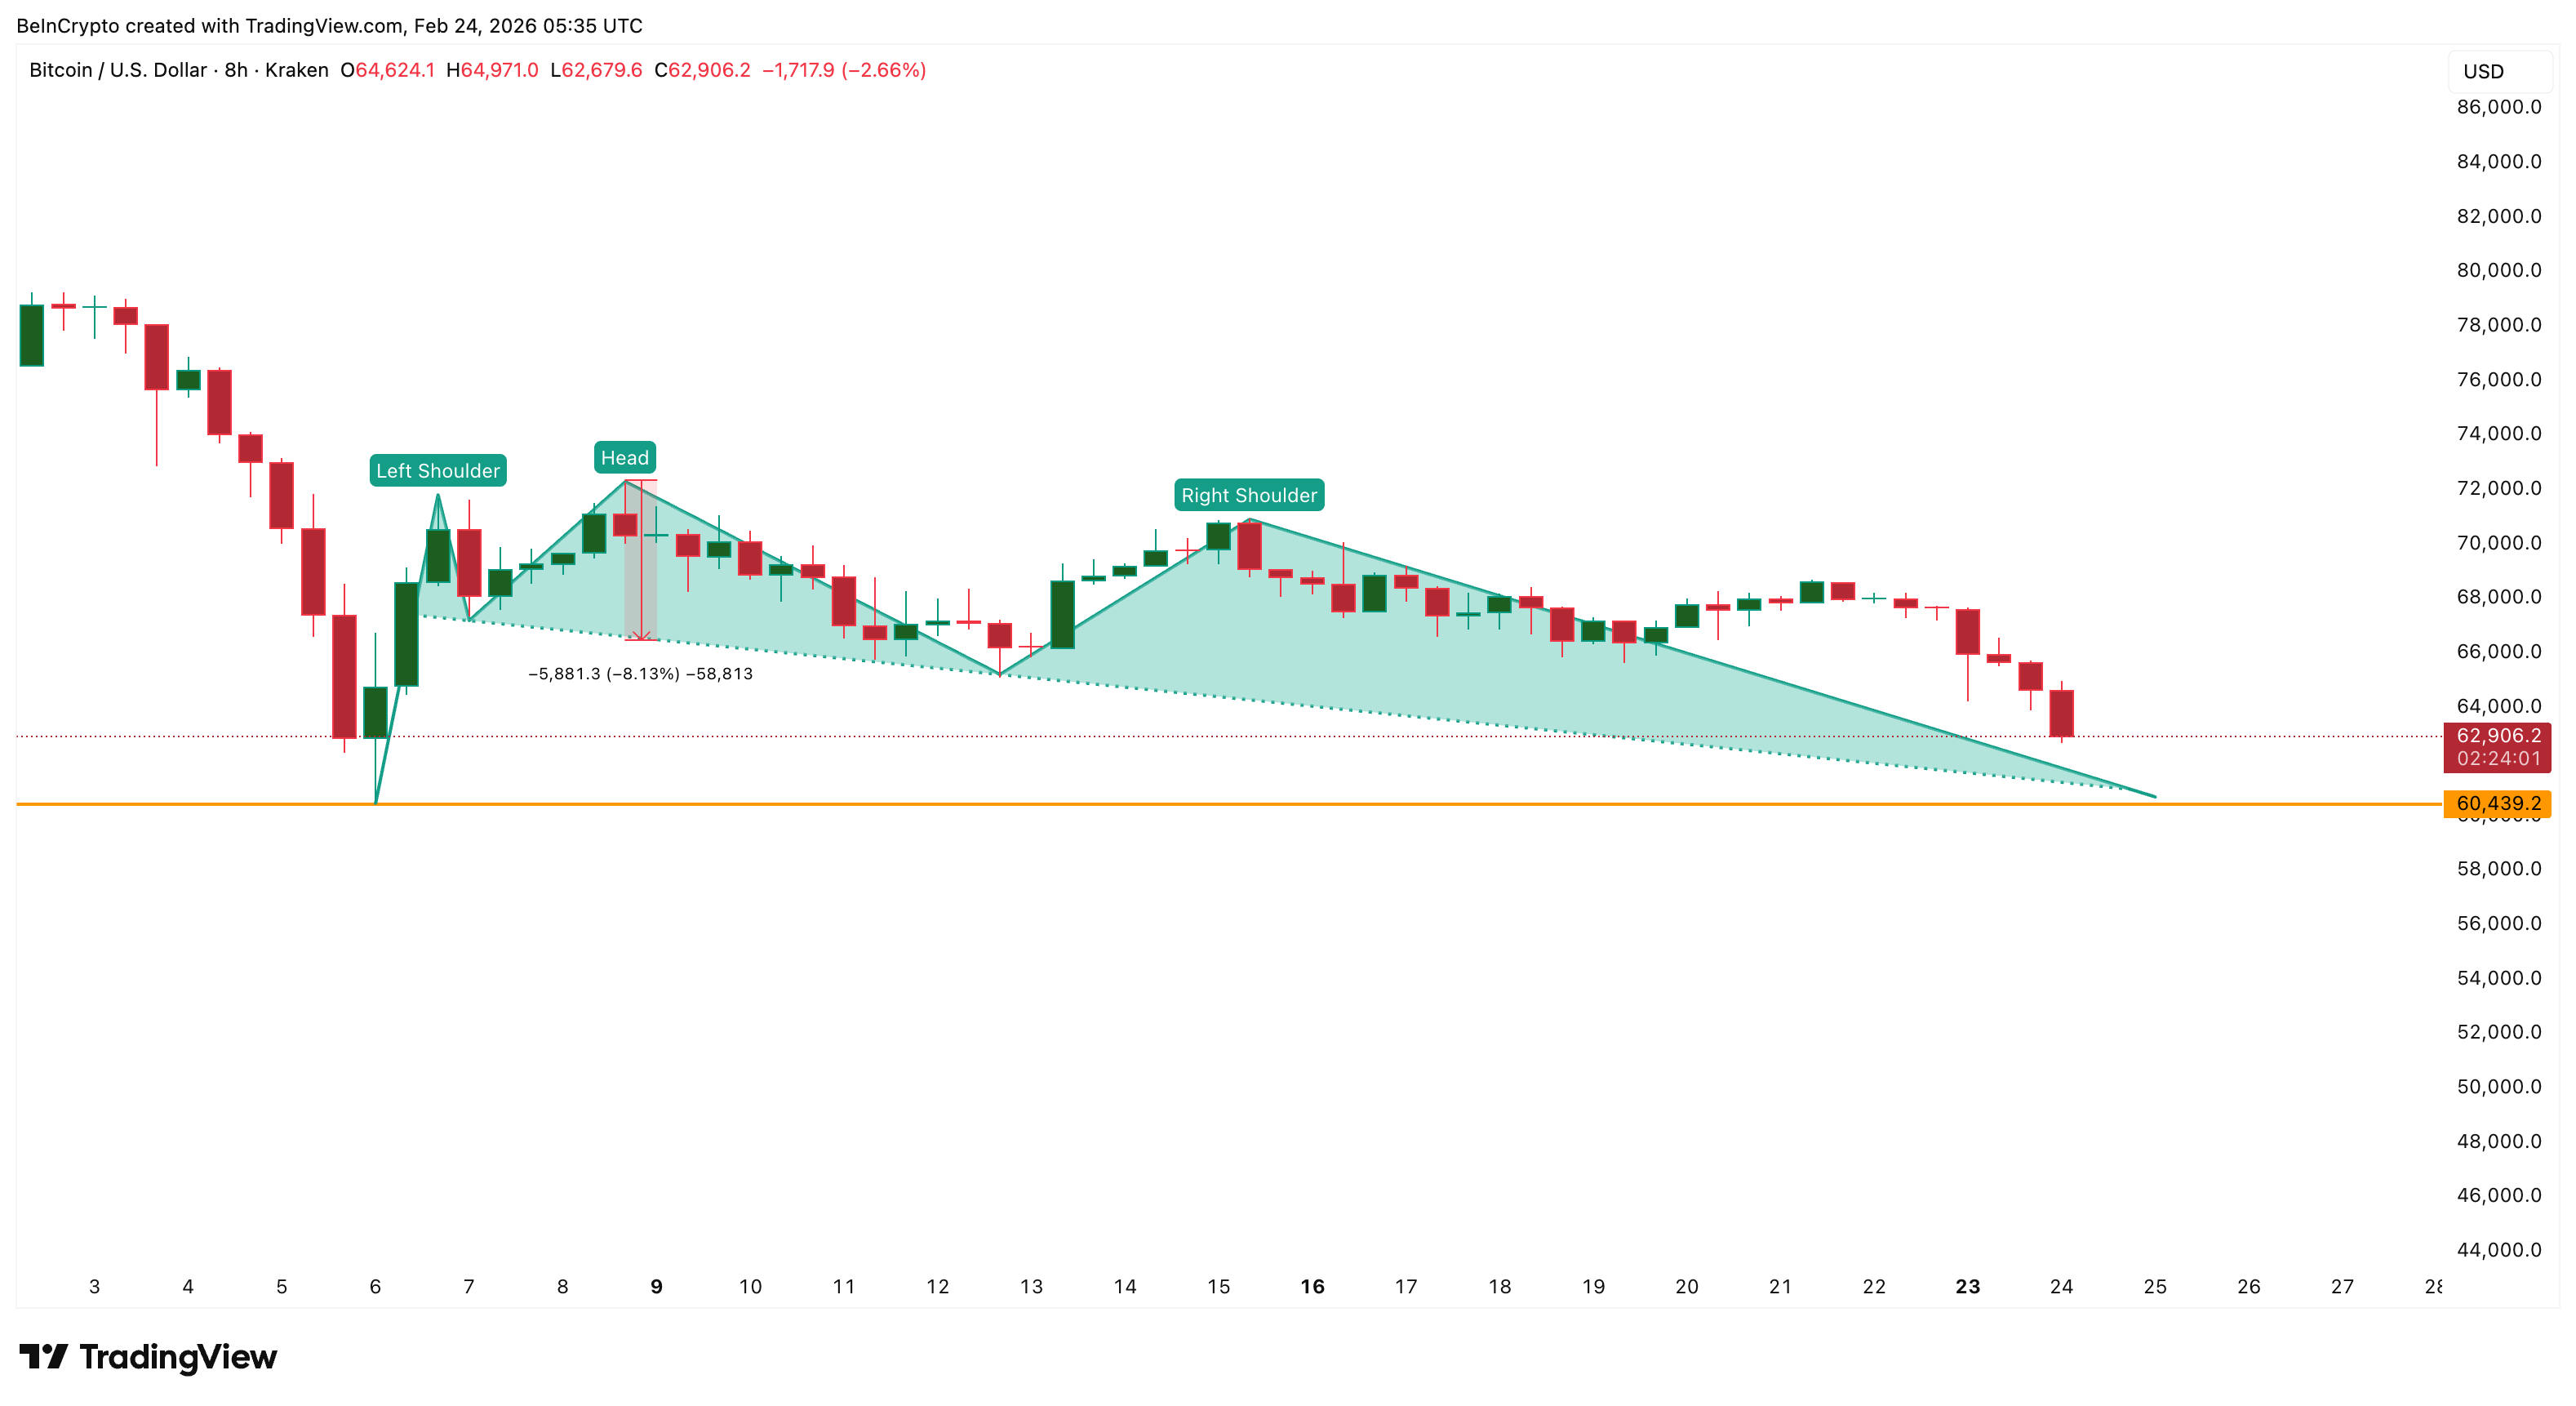
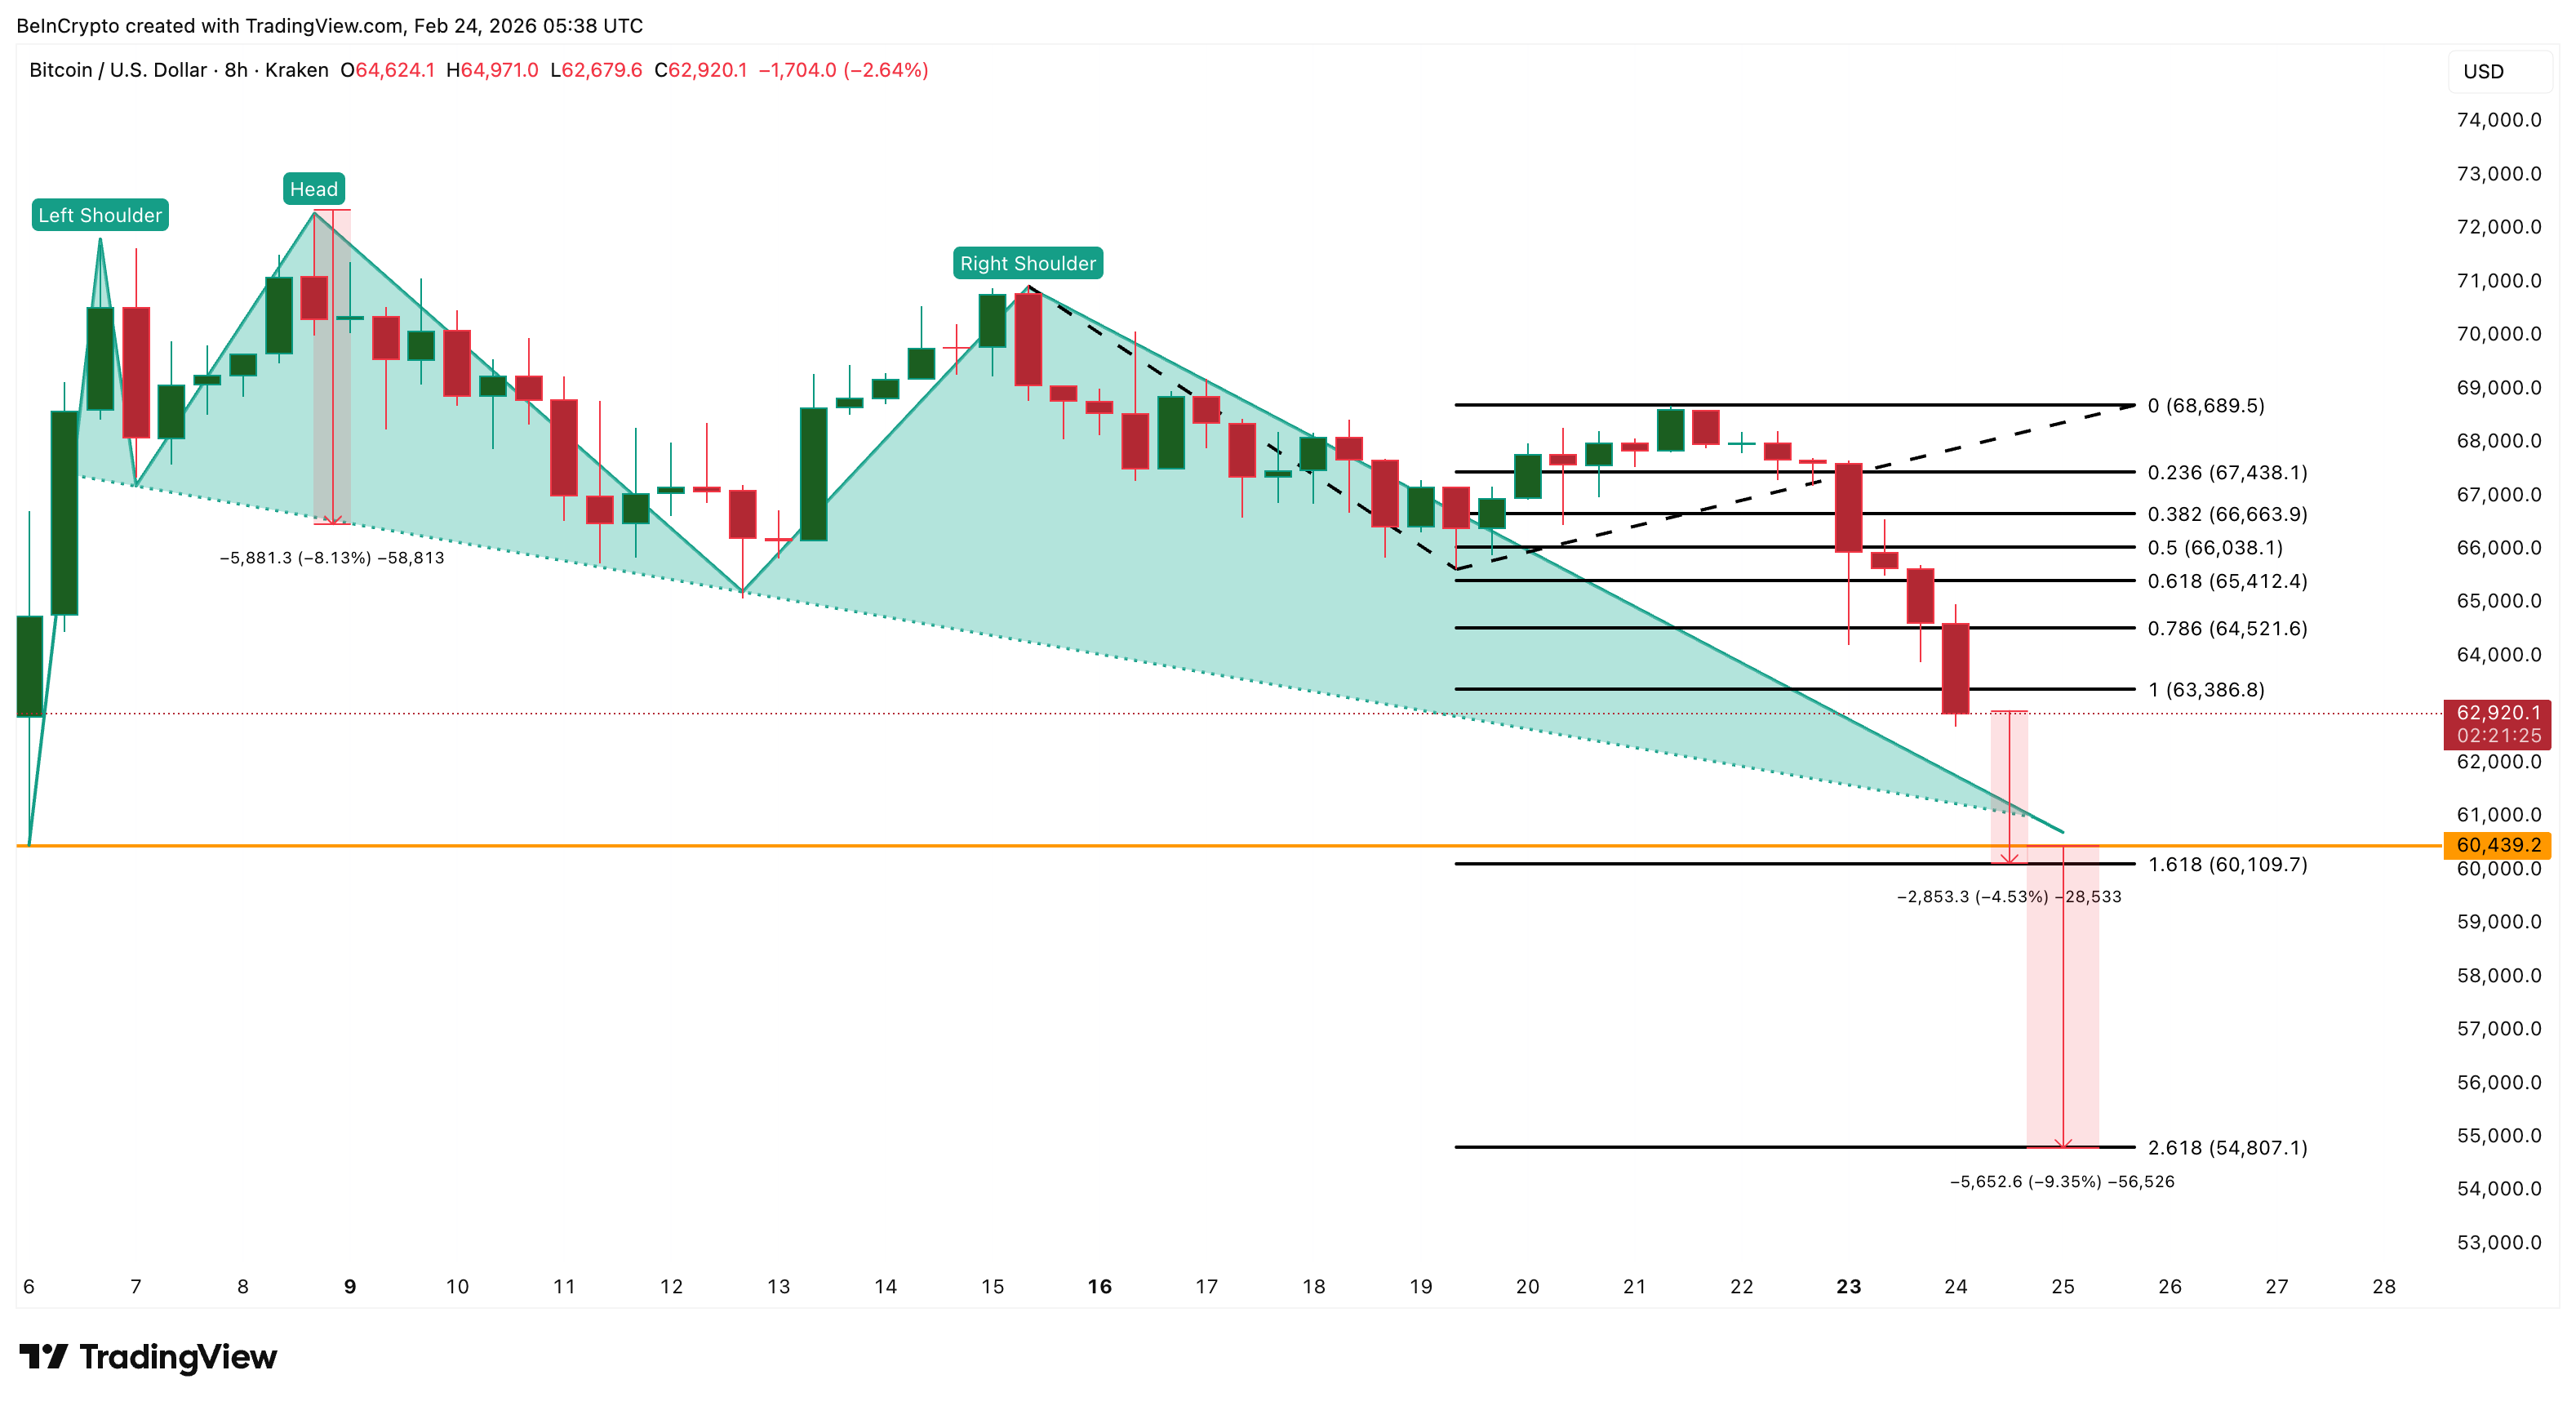
Bitcoin’s price structure has started to break down on the 8-hour chart. A head-and-shoulders pattern has formed, and the neckline of this pattern now sits near the $60,000 zone, making this level the most important short-term support.
Want more token insights like this? Sign up for Editor Harsh Notariya’s Daily Crypto Newsletter here.
This technical weakness comes as miners continue selling aggressively. Glassnode data shows the miner net position change metric has remained negative continuously from January 9 through February 23. This 46-day stretch marks the longest uninterrupted miner capitulation phase in the year-on-year timeframe. The peak of this stretch was seen on February 6, two days after the BTC price bottomed around $60,400.
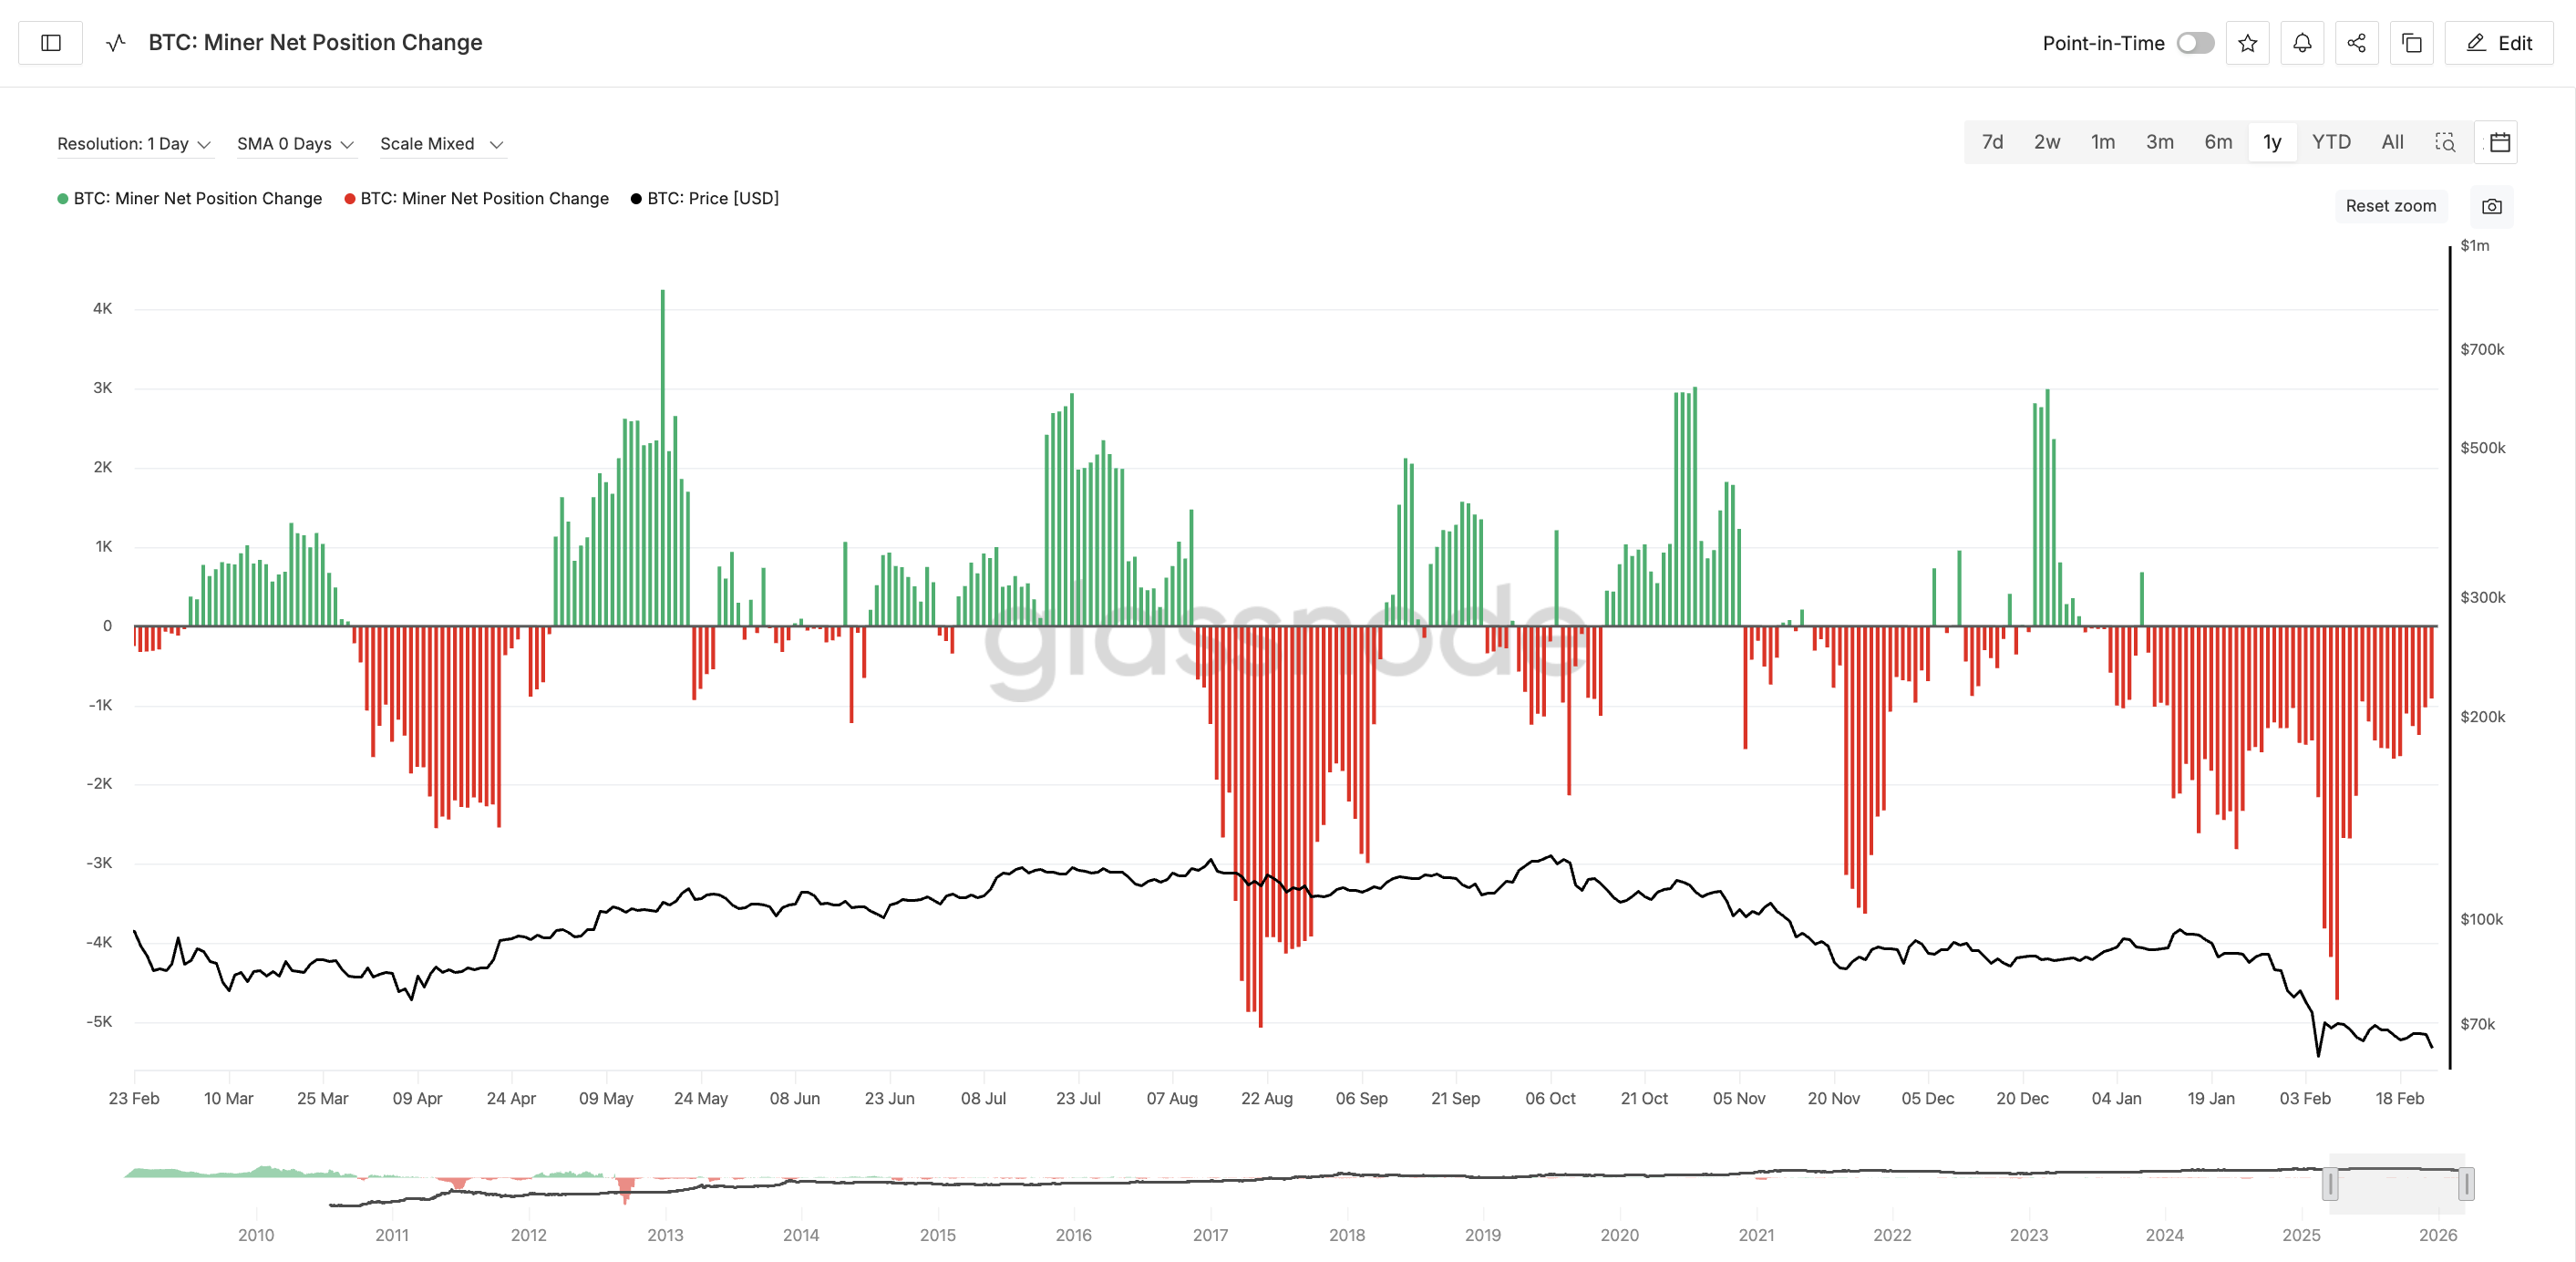
Miner capitulation happens when miners sell more Bitcoin than they accumulate. This usually reflects financial pressure rather than profit-taking.
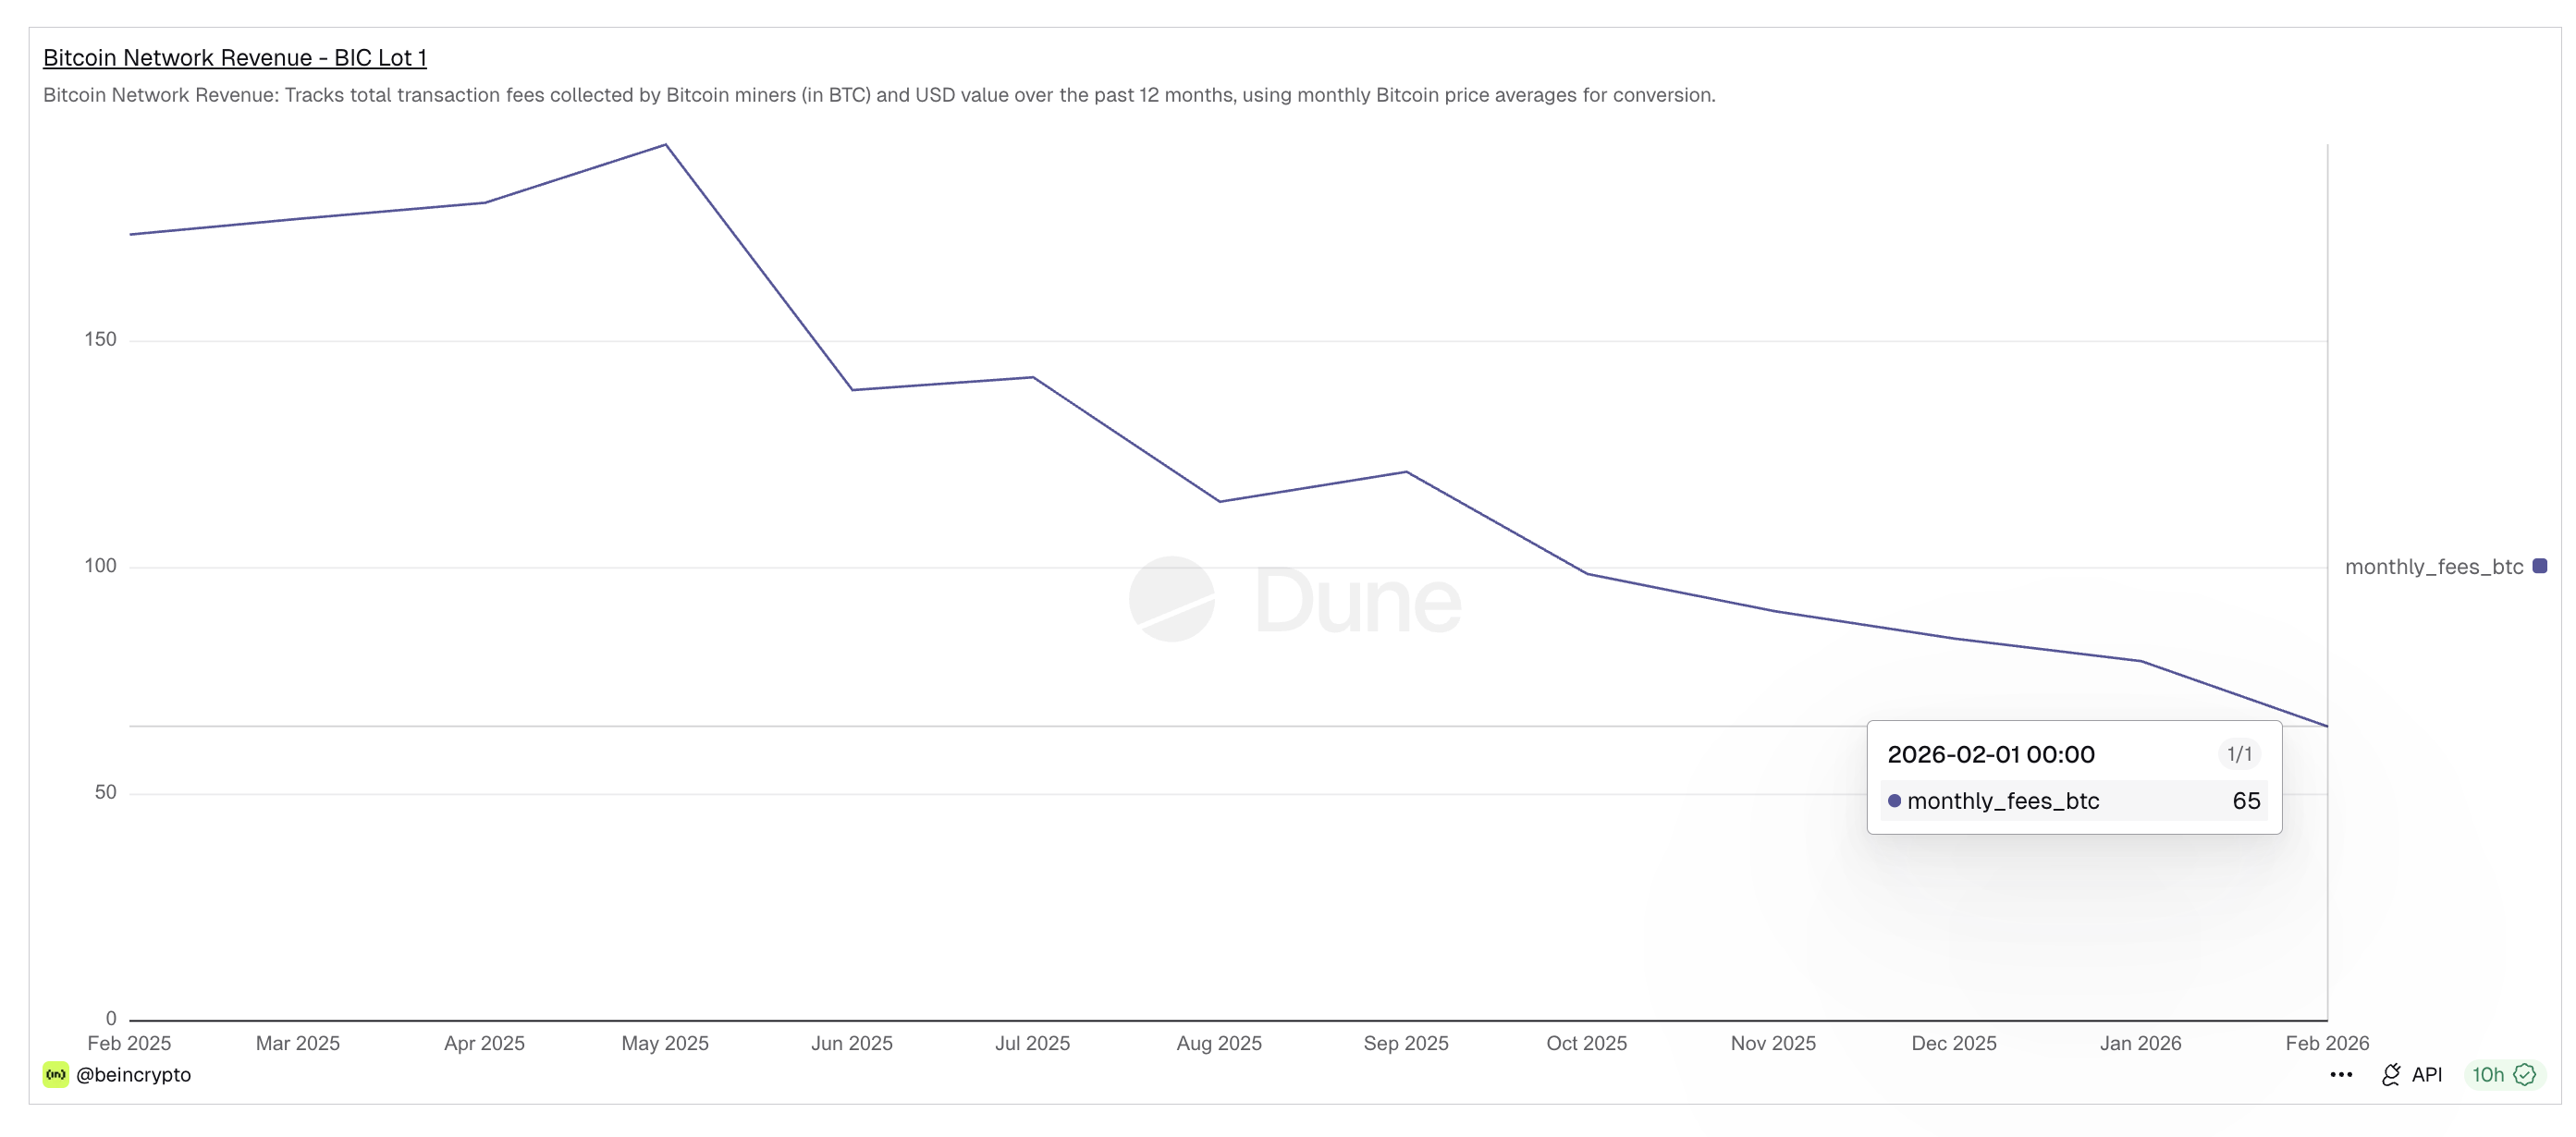
BeInCrypto’s exclusive Dune dashboard helps explain the reason behind this shift. Bitcoin network revenue, which tracks transaction fees earned by miners, has collapsed sharply over the past year. Monthly fees fell from 194 BTC in May 2025 to just 65 BTC by February 2026. This represents a nearly two-thirds drop in miner income.
With earnings falling and BTC correcting, miners have fewer incentives to hold Bitcoin. Instead, they are forced to sell reserves, increasing supply in the market. This sustained selling pressure has weakened Bitcoin’s structure. But miners are not the only group stepping away.
Institutional demand has also started to deteriorate, raising new risks around the critical $60,000 support zone.
ETF Outflows And Realized Price Align With Bitget CEO’s Warning About Critical Support
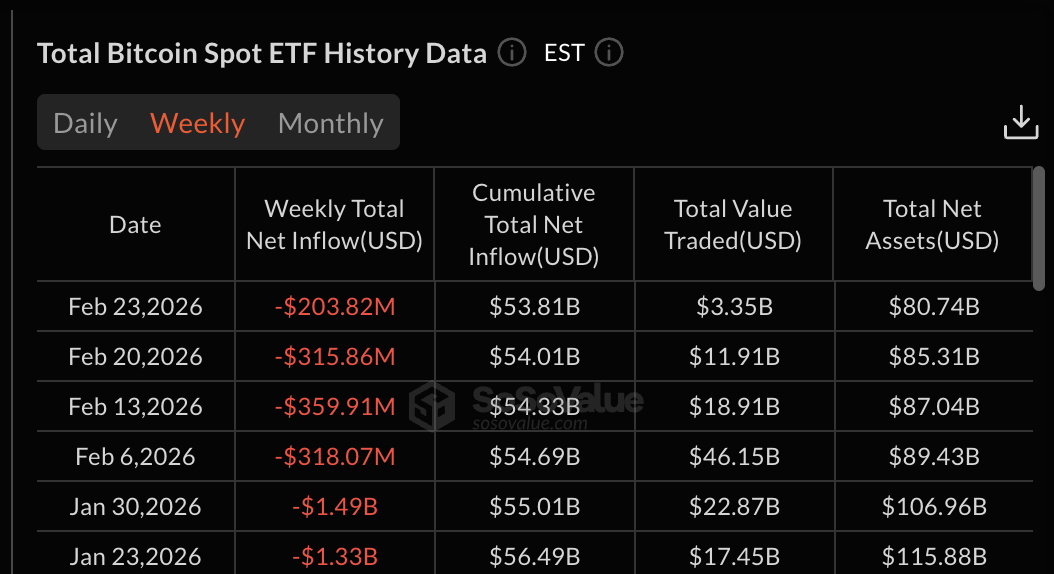
Institutional demand through Bitcoin ETFs has weakened significantly in recent weeks. Bitcoin has now recorded six consecutive weeks of ETF outflows. This marks the longest sustained weekly exit period since spot Bitcoin ETFs launched.
These outflows signal that large investors are reducing exposure instead of accumulating.
Gracy Chen, CEO of Bitget, directly addressed this fragile setup yesterday, right before BTC lost $63,000. She said:
“Today, Bitcoin is trading in the $64,000–$66,000 zone, and we believe macro factors are doing most of the work. Selling pressure is still tangible and heavy, so the asset has become highly sensitive to headlines, and recent turbulence around tariffs has put even more pressure on risk sentiment,” she said.
She also identified the most important level now:
“On the technical side, we think $60,000 remains the key support level so far, while a move lower, caused by a significant macro event, or accelerating ETF outflows could drag the asset down to $50,000. Liquidity there is deep, and support is substantial, so we’d expect a bounce from either level and a renewed attempt higher,” she added.
Her statement highlights how closely ETF flows and macro pressure are now tied to Bitcoin’s structure. This risk becomes clearer when compared with Bitcoin’s realized price.
Realized price currently sits near $54,700. This level represents the average cost basis of all Bitcoin in circulation. Historically, Bitcoin tends to stabilize near this level because it reflects the market’s aggregate holding cost.
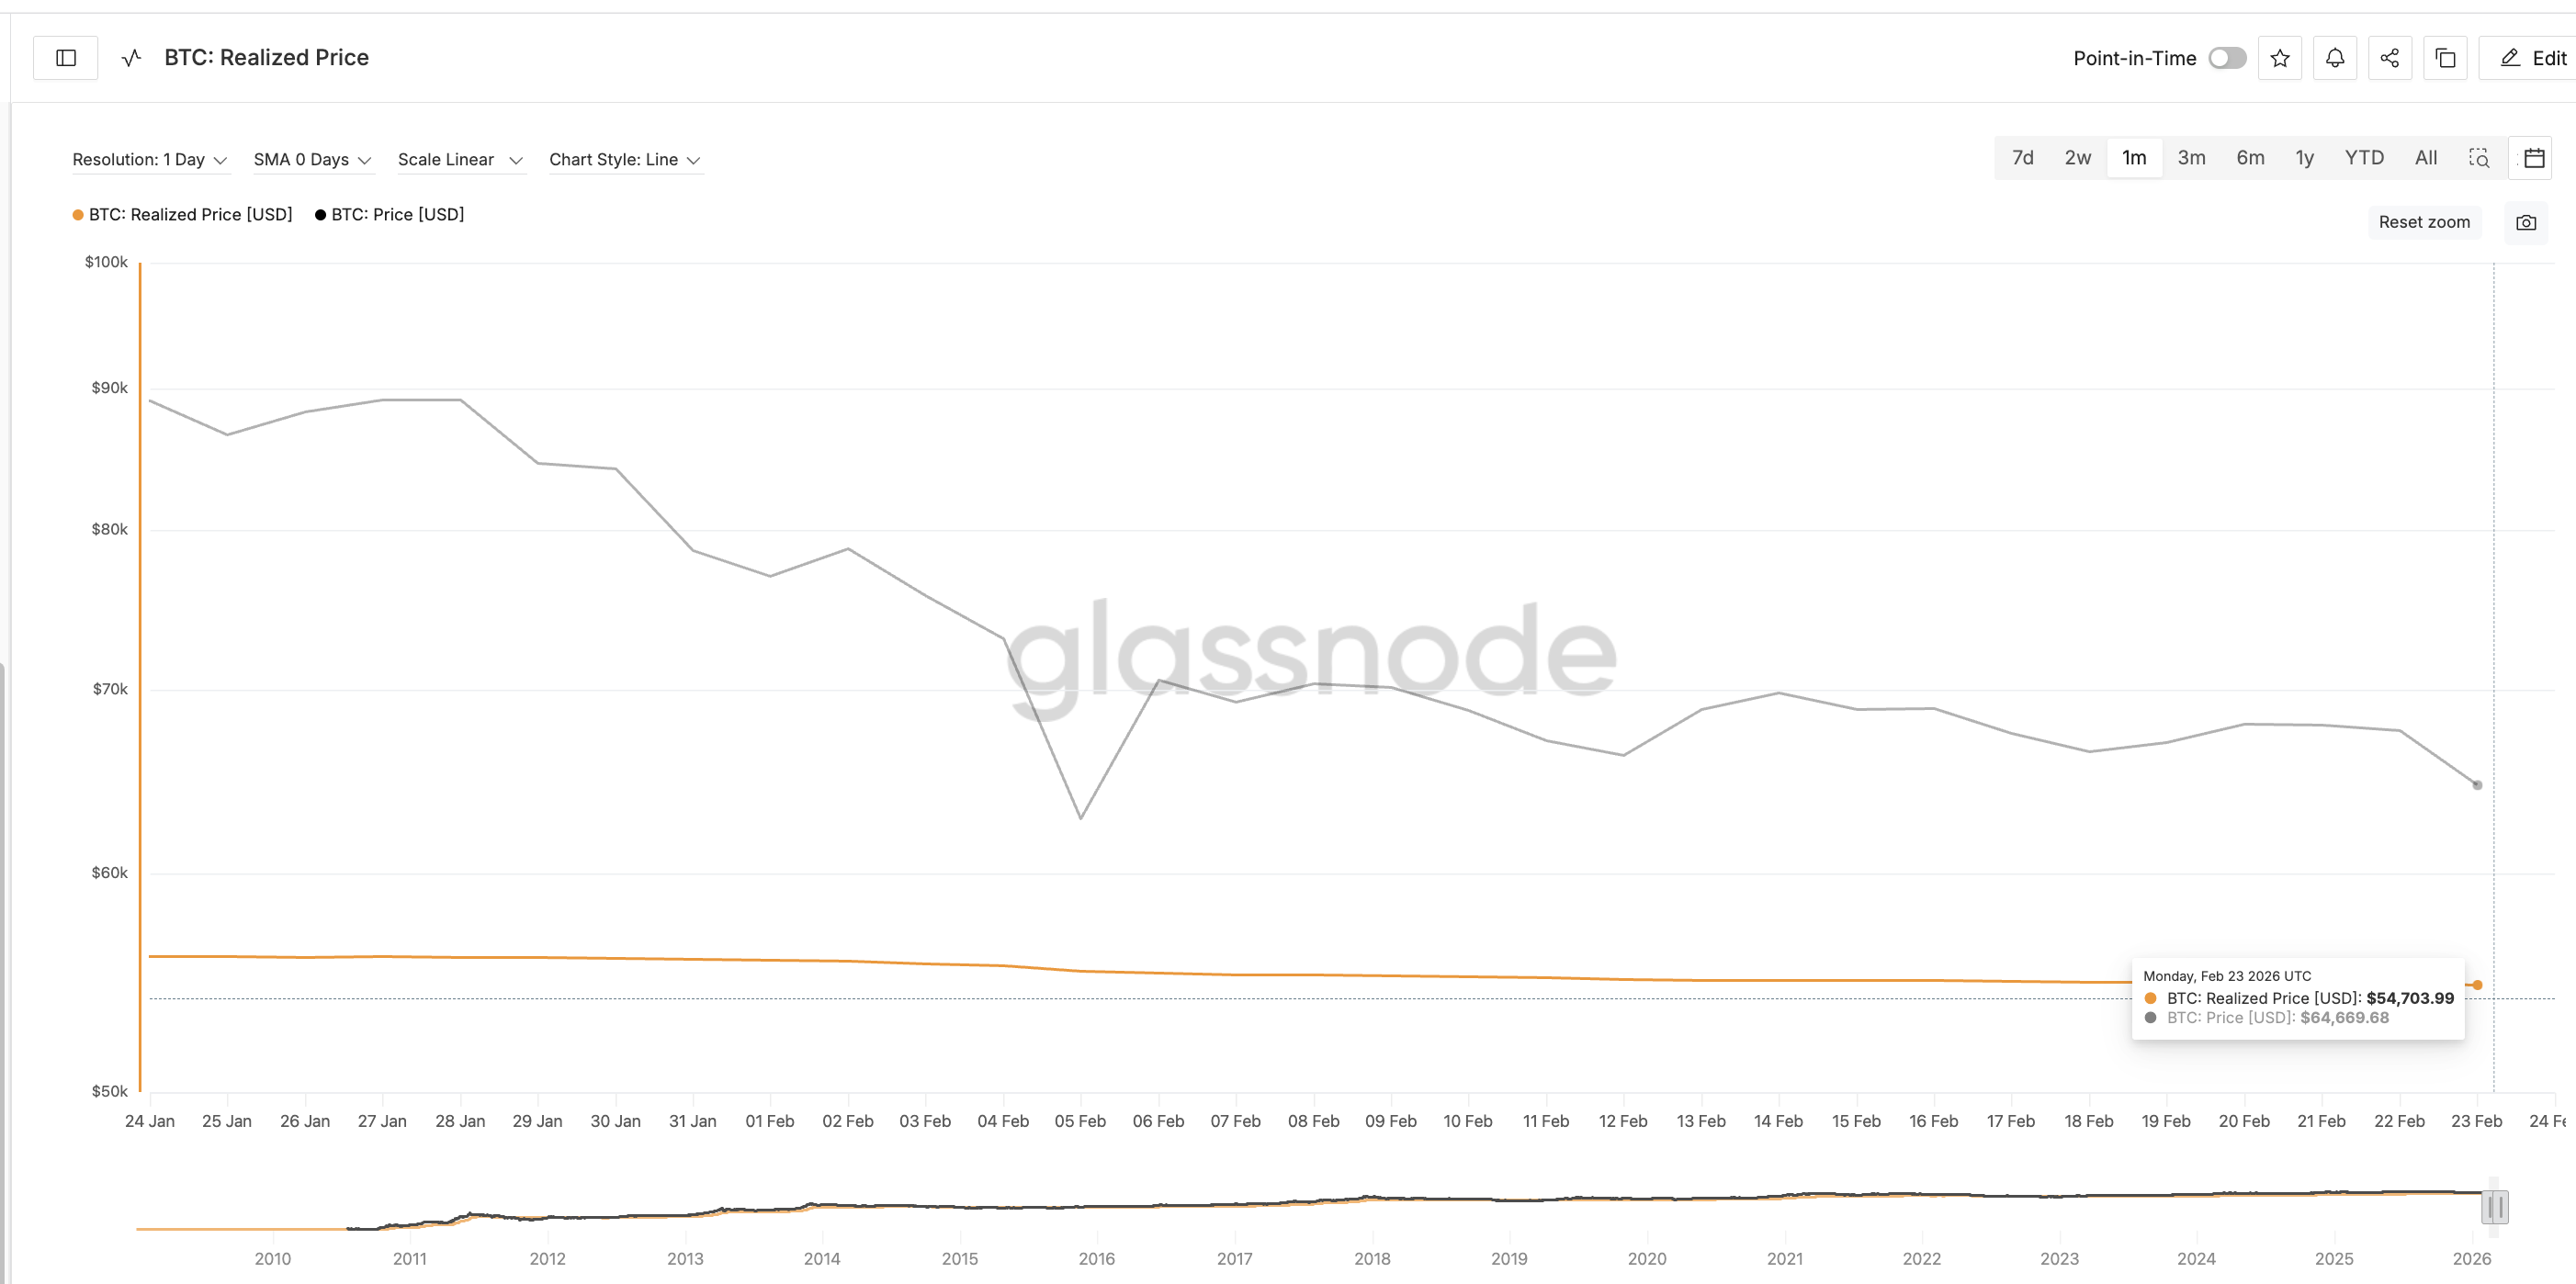
If ETF demand continues weakening and Bitcoin loses $60,000, the realized price could become the next major support zone. This makes the current BTC price region especially critical.
Bitcoin Price Levels Show Why The $60,000 Zone Is The Key
Bitcoin’s recent price action confirms the importance of the $60,000 zone, already highlighted by the Bitget CEO. This level previously served as support on February 6, around the time when miner capitulation reached its current cycle peak. The same level now aligns with a key Fibonacci retracement zone near $60,100.
This convergence makes the area both psychologically and technically important. If Bitcoin manages to hold above this zone, it could stabilize and attempt recovery.
However, a confirmed break below $60,000 would confirm the head-and-shoulders breakdown. Based on the pattern’s structure and technical retracement levels, this could trigger a decline toward $54,800. This level aligns almost exactly with Bitcoin’s realized price.
Gracy Chen’s warning reinforces why this zone matters. Her view that $60,000 remains key support, with deeper downside possible if ETF outflows continue, aligns closely with Bitcoin’s current technical structure. For now, Bitcoin stands at a decisive point.
Some strength returns if the BTC price recovers and reclaims the crucial resistance at $63,300, followed by $65,400. However, complete bearish structure invalidation remains out of bounds for now.
Miner capitulation continues to increase supply, while ETF outflows signal weakening institutional demand. Until these pressures ease, the $60,000 level remains the line separating stabilization from a deeper correction.

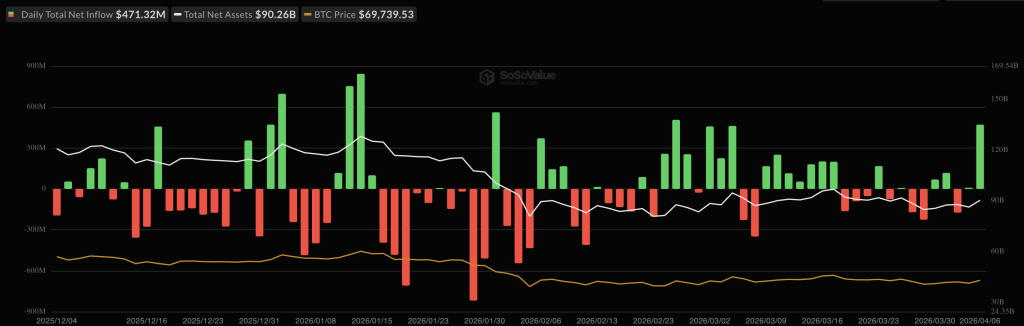
US-listed spot Bitcoin exchange-traded funds (ETFs) have renewed the pace of inflows, recording their largest daily flows in weeks.
Spot Bitcoin (BTC) ETFs posted $471 million in inflows on Monday, the largest daily inflow since Feb. 25, when the funds attracted $507 million, according to SoSoValue.
The inflows came as the Bitcoin price briefly approached $70,000 before retreating below $69,000, according to CoinGecko data.
The volatility occurred amid ongoing geopolitical pressure as well as renewed concerns over Bitcoin’s quantum resistance, while the Crypto Fear & Greed Index remained in “Extreme Fear” at 13.
BlackRock’s IBIT leads the inflows at $182 million
BlackRock’s iShares Bitcoin Trust ETF (IBIT) led the inflows with about $182 million, followed by the Fidelity Wise Origin Bitcoin Fund (FBTC) with $147 million, according to Farside data.
The ARK 21Shares Bitcoin ETF (ARKB) ranked third with nearly $119 million, marking its largest daily inflow since July 10, 2025.
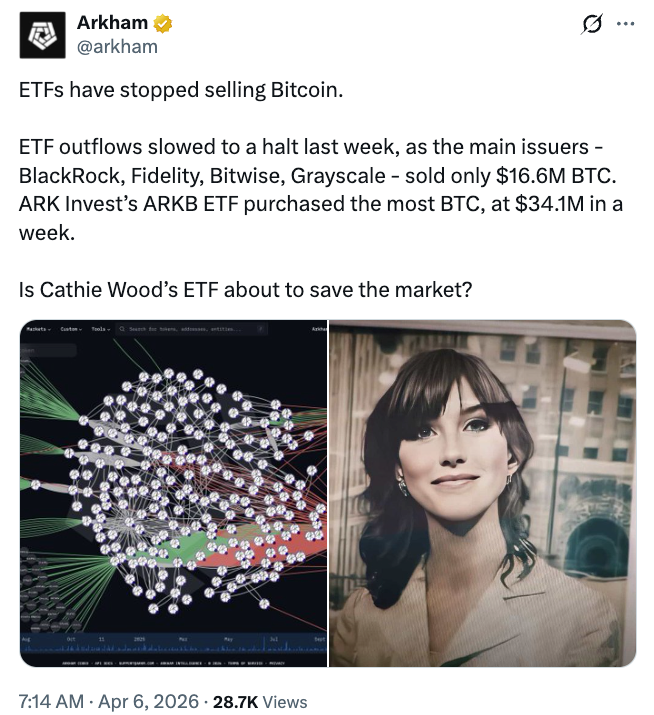
On Monday, the blockchain analytics platform Arkham observed that ETF outflows slowed to a halt last week, with major issuers selling just about $16.6 million in Bitcoin. ARK Invest’s ARKB ETF purchased the most BTC, or $34 million in a week, it said.

Following the three trading sessions in April so far, US spot Bitcoin ETFs recorded about $307 million in net inflows, bringing total assets under management (AUM) back above $90 billion.
Related: Strategy adds $330M BTC as paper losses top $14.5B in Q1
In March, Bitcoin ETFs posted $1.3 billion in inflows, marking the first monthly gain after outflows of $1.61 billion in January and $207 million in February.
Ether ETFs record $120 million in inflows
US spot Ether (ETH) ETFs followed the recovery in sentiment on Monday, recording $120 million in inflows and offsetting $78 million in outflows from the prior two trading sessions.
Ether ETFs posted three consecutive months of losses, bringing total outflows for the period to about $770 million.
Other altcoin ETFs saw muted activity, with XRP (XRP) recording zero inflows on Monday, while Solana (SOL) ETFs posted about $247,000 in inflows.


A whale has transferred nearly $20 million worth of Bitcoin to Binance as the flagship crypto continues to struggle.
Summary
- A Bitcoin whale moved around 300 BTC to Binance, with roughly $20 million in value, while still holding about 200 BTC.
- The wallet built its position earlier in 2025 at an average price of $97,541, leaving it at a loss if the holder sells.
Data from Arkham Intelligence shows that an address labeled “bc1q…kp4n” sent around 300 BTC, valued at over $20 million, to a Binance deposit address on Tuesday. As of press time, the wallet still retains roughly 200 BTC, which is worth about $13.75 million based on prices at the time of writing.
The wallet appears relatively recent compared to others seen in recent months, where decade-old holdings have suddenly become active to execute similar transfers.
On-chain data indicates that the address accumulated around 513 BTC between January and March 2025. At the time, the stash was worth close to $50 million, pointing to an average acquisition price of roughly $97,541 per coin.
So far, it remains unclear whether the transfer was made with the intent to sell, but movements to exchanges are often linked to potential selling activity. Given that the wallet is currently sitting at a loss, with Bitcoin trading near $69,000, the move could be aimed at limiting further downside.
On the contrary, the transfer could simply be portfolio restructuring or internal fund management rather than an immediate sale.
However, if we look at recent whale activity, it would not come as a surprise if the holder is preparing to sell. Bitcoin is down more than 45% from its all-time high and has faced intense volatility in recent sessions.
Last month a dormant wallet moved 2,100 BTC, worth around $147.7 million, after more than 13 years of inactivity. In another case, roughly $33 million in Bitcoin was sent to Binance by a separate whale.
This is happening as Bitcoin price has remained under pressure due to bearish macro catalysts, particularly rising tensions between the U.S. and Iran. The conflict has pushed oil prices higher and aggravated inflation concerns in the U.S. and across global markets. As long as these tensions persist, large holders may be inclined to remain on the sidelines.
On the other hand, institutions and treasury firms like Strategy have continued buying the flagship crypto.

Key Takeaways
- Tim Cook offloaded $16.5M worth of Apple shares on April 2, selling 5,087 shares between $251.25 and $256.00 each
- Apple stock has declined approximately 4.6% in 2026, hovering near $255, marginally trailing the broader S&P 500
- The company unveiled the MacBook Neo on March 4 with a groundbreaking $599 price tag — every variant sold out within 16 days
- BofA projects the MacBook Neo addresses a $32B addressable market opportunity for 2026
- Analyst Wamsi Mohan from Bank of America maintains his Buy recommendation with a $320 target on Apple shares
Apple (AAPL) shares are hovering around $255, reflecting a year-to-date decline of approximately 4.6%.
The tech giant’s chief executive has been methodically reducing his holdings. Tim Cook divested $16.5 million in Apple shares during an April 2 transaction — unloading 5,087 shares at price points spanning $251.25 to $256.00. These transactions occurred through a predetermined Rule 10b5-1 arrangement, a mechanism specifically structured to eliminate concerns about insider trading.
Despite the recent sale, Cook maintains a substantial position with 3.28 million Apple shares, currently valued at approximately $848 million. While he’s trimming his stake, the CEO remains heavily invested in the company’s future.
Speculation about Cook’s potential departure from the CEO position recently surfaced. He addressed these rumors directly in a recent media appearance, clarifying that he’s made no public indication of leaving the position he’s occupied since taking over in 2011.
Apple’s sluggish 2026 performance isn’t happening in isolation. The entire Magnificent 7 cohort is experiencing negative returns this year. Microsoft has plummeted nearly 23%, Tesla is down 21.8%, Meta has declined 12.2%, and Amazon has fallen 7.8%. Against this backdrop, Apple’s 4.6% retreat appears relatively modest.
What distinguishes Apple from other tech behemoths isn’t aggressive AI infrastructure investment — it’s the strategic absence of it. While cloud providers are expected to deploy nearly $700 billion toward AI capabilities in 2025, Apple’s capital expenditure plans hover around $14 billion. The company is wagering that AI technology will become commoditized. Whether this thesis proves correct remains uncertain, but the approach maintains lean operational costs.
MacBook Neo Achieves Instant Sellout
The standout product launch this quarter is undoubtedly the MacBook Neo, introduced March 4 with a $599 price point. This represents Apple’s most affordable laptop offering in company history — priced lower than the Apple Watch Ultra 3. The device directly targets the $500–$1,000 notebook category, a segment where Apple previously maintained minimal presence with just 0.6% market penetration in 2025.
The launch timing appears strategic. Millions of aging PCs are incompatible with Windows 11 upgrades, generating a significant hardware replacement wave. Dell COO Jeffrey Clarke noted in late 2025 that approximately 500 million Windows 11-compatible PCs remain unupgraded — with an additional 500 million machines unable to support the operating system.
On March 20, Apple CEO Cook shared on X: “Mac just had its best launch week ever for first-time Mac customers.” Within the same timeframe, all eight MacBook Neo configurations sold out through Apple’s online store until the following month, as reported by 9to5Mac.
BofA Projects $32B Market Opportunity
Bank of America’s Wamsi Mohan conducted comprehensive analysis on the Neo’s revenue potential. His research team calculated a 2026 total addressable market of $32 billion, derived from 2025 notebook shipment volumes in the $300–$800 price range, adjusted downward by 10% for 2026, then multiplied by Apple’s competitive education average selling price of $499.
Assuming 10% market penetration and 19% operating margin performance, Mohan projects the Neo could contribute an additional $0.03 to earnings per share. While this appears modest in isolation, the strategic value lies in ecosystem expansion — Apple’s iPhone installed base encompasses roughly 1.5 billion devices compared to just 260 million Mac units. Transitioning iPhone users into Mac ownership strengthens overall platform engagement.
Mohan reaffirmed his Buy rating alongside a $320 price objective, calculated using a 32x multiple on his 2027 earnings forecast of $9.94 per share.


Disclosure: This article does not represent investment advice. The content and materials featured on this page are for educational purposes only.
Little Pepe surpasses $28m in presale, advancing to Stage 13 as investor participation grows.
Summary
- Little Pepe presale surpasses $28m, entering Stage 13 as token price rises and supply nears sellout
- LILPEPE gains traction with Layer 2 utility, combining meme appeal with EVM-compatible infrastructure
- Strong presale demand pushes Little Pepe toward next price tier, highlighting early investor momentum
Little Pepe (LILPEPE) has now achieved yet another milestone in the continuation of the ongoing presale process, having now exceeded $28 million in overall funds raised. It has now moved into Stage 13 of the process, where the price of the token is now $0.0022 and is gaining more and more pace with the rising number of participants in the process.

In the latest updates, it has now raised $28,101,728 out of the $28,775,000 overall Stage 13 target, with 16,943,966,303 out of the 17,250,000,000 available for the process being sold out. This has now put more and more pressure on the late entrants in the process as the overall presale is now moving closer and closer to the next price level.
In the next stage, the price of the token is expected to rise to $0.0023, all in line with the pattern of appreciation that has been established. Since its listing in Stage 1 at a price of $0.001, this asset has appreciated by more than 120%, highlighting the value of early mover advantage.
Growing interest backed by utility and layer 2 infrastructure
Unlike most memecoins, which only rely on their virality, the Little Pepe coin seeks to position itself as a Layer 2 ecosystem with actual functionality. With the use of EVM-compatible architecture, the project seeks to provide ultra-fast, secure, and cheap transactions in the creation of a scalable environment.
The token operates with zero transaction tax, removing additional trading costs for users. Alongside this, staking mechanisms and NFT integrations are planned, adding further utility beyond simple trading activity.
With the aim of developing a wide ecosystem, including various applications and tools dedicated to memes, the community aspect will be merged with the practical use cases of the blockchain.
Exchange listings and expansion plans strengthen outlook
The team has set out their future plans, which include the listing on top centralized exchanges as well as DEX. This will not only improve the market once the presale is over but also meet the high market expectations set by the community, which is hoping to achieve a $1 billion market cap.
The project has also managed to gain attention by setting the aim to enter the top 100 on CoinMarketCap, further adding to the high growth prospects.
Community campaigns drive participation
Little Pepe’s rapid rise has been closely tied to strong community engagement. To celebrate its growth, the project has launched a $777,000 presale giveaway, where 10 winners will receive $77,000 worth of LILPEPE tokens each.

In order to participate in the campaign, the person has to make a minimum contribution of $100 in the presale and complete the social engagement task. This makes the platform more interactive and increases the person’s chances of winning with more entries.
In addition, a Mega Giveaway has been introduced for Stages 12 to 17. Both large contributors and randomly selected buyers are eligible to win rewards exceeding 15 ETH, adding another incentive layer for participants.
Momentum builds as presale nears next phase
With the number of tokens available dwindling in Stage 13 and the price set to rise soon, the current phase is one of the last chances for investors to get in before the price jumps again.
With the support of technical infrastructure, no-tax trades, and community-driven strength, the attention of the crypto world is still focused on Little Pepe. As the presale continues, the meme coin and Layer 2 elements are building a story that goes beyond the hype.
For more information, visit the official website, Telegram, and X.
Disclosure: This content is provided by a third party. Neither crypto.news nor the author of this article endorses any product mentioned on this page. Users should conduct their own research before taking any action related to the company.
Crypto World
Ackman’s Pershing Square Launches $64 Billion Takeover Bid for Universal Music Group (UMG)

Key Takeaways
- Pershing Square, led by Bill Ackman, has unveiled a non-binding $64 billion merger proposal with Universal Music Group through its SPARC Holdings vehicle.
- The bid prices UMG at €30.40 per share, representing a 78% premium over the previous closing price of €17.10.
- Universal Music Group shares surged approximately 13% following the announcement, while major shareholder Bollore Group climbed around 6%.
- The proposed merger would create “Nevada Corporation,” which would trade on the New York Stock Exchange.
- The deal structure includes Michael Ovitz, former Disney president, joining the board as chairman if the transaction proceeds.
Bill Ackman’s investment firm Pershing Square has unveiled a massive $64 billion takeover proposal for Universal Music Group, seeking to combine the Amsterdam-listed music powerhouse with its SPARC Holdings special purpose vehicle in a transaction that would relocate UMG to American markets.
The all-in proposal prices Universal Music Group at €30.40 per share, marking a substantial 78% premium above Monday’s closing price of €17.10. Market reaction was swift, with UMG shares climbing approximately 13% during early Tuesday sessions. Meanwhile, Bollore Group, which maintains the largest ownership position in UMG, experienced a stock increase of roughly 6%.
Universal Music Group has not yet issued a statement regarding the takeover approach.
The offer remains non-binding at this stage. The transaction framework calls for UMG shareholders to receive €9.4 billion in cash consideration alongside 0.77 shares of the newly formed Nevada Corporation for each UMG share owned.
Pershing intends to secure the cash component through multiple channels: SPARC’s rights holders, leveraged financing arrangements, and liquidating its ownership position in Spotify.
The resulting combined company — tentatively named Nevada Corporation — would obtain a primary listing on the New York Stock Exchange, fulfilling Ackman’s longstanding objective of establishing UMG’s presence in American capital markets.
Ackman’s Strategic Rationale Behind the Proposal
In correspondence addressed to Universal Music Group’s board of directors, Ackman praised management for their “excellent” stewardship of the company’s operations. However, he highlighted persistent underperformance in the stock price since UMG’s 2021 debut on the Amsterdam exchange as the fundamental challenge requiring action.
Ackman identified three primary concerns: market uncertainty surrounding Bollore Group’s 18% ownership stake, postponement of UMG’s previously planned American listing, and what he characterized as insufficient deployment of UMG’s financial resources.
Just last month, Universal Music Group abandoned a previous arrangement with Pershing regarding the pursuit of a U.S. stock exchange listing — a decision that seems to have catalyzed Tuesday’s formal merger proposition.
Pershing maintains a 4.7% ownership interest in UMG, positioning it as the fourth-largest institutional shareholder based on LSEG information.
Major Stakeholders Remain Silent
Bollore Group, controlling an 18% stake in Universal Music Group, has not issued any public statement. Vivendi, holding the second-largest ownership position, similarly declined to provide commentary. Tencent Holdings, ranked as UMG’s third-largest shareholder, has not responded to inquiries.
The stance of these major investors carries significant weight. A transaction of this magnitude requires substantial shareholder consensus to advance toward completion.
Michael Ovitz, renowned talent representative and former president of The Walt Disney Company, is designated to assume the role of board chairman at UMG should the merger receive approval.
Pershing Square has indicated it anticipates finalizing the transaction by the conclusion of 2026.

The debate over quantum threats to Bitcoin is shaping up as much a social challenge as a cryptographic one, according to Grayscale’s head of research. In response to a March 30 paper from Google researchers suggesting a quantum computer could crack Bitcoin’s cryptography with far less computing power than once thought, the industry is weighing not just the mathematics but the community’s ability to converge on a path forward.
Grayscale’s Zach Pandl argues that Bitcoin’s architecture may actually cushion it in the near term. He points to the network’s UTXO model, proof-of-work consensus, absence of native smart contracts, and certain address types that are not quantum-vulnerable. The real hurdle, Pandl says, is getting the Bitcoin community to agree on how to handle the looming post-quantum era, especially when it concerns dormant coins sitting in long-forgotten wallets.
Roughly 1.7 million BTC remain in early P2PK-style addresses, a tranche that includes the long-anticipated possibility that Satoshi’s own stash could be part of those holdings. Valued at around $68 billion at current prices, these coins represent a governance and risk-choreography challenge as much as a cryptographic one.
The Bitcoin community has three options
Pandl outlines three principal courses of action for coins whose private keys are lost or inaccessible: burn the coins, deliberately slow their movement by constraining the rate at which vulnerable addresses can spend, or take no action and leave the situation as is. He notes that all options are technically feasible, but the hard part is achieving consensus—a recurring theme in Bitcoin’s history of protocol debates, including controversies over data stored in blocks.
The social dimension of the decision is underscored by a recent flashpoint in the community: the Ordinals controversy of 2023, which inflamed debates over using block space to inscribe data such as text or images to satoshis. While the debate has cooled, the two sides remain far from unanimous on governance and protocol change.
“All are conceptually doable, but the challenge is reaching a decision, and the Bitcoin community has a history of contentious debates over protocol changes, including last year’s dispute around image data stored in blocks.”
That warning echoes a broader message: even as researchers discuss the urgency of upgrading cryptography, the path forward ultimately depends on communal agreement about how to treat long-dormant funds and how aggressively to pursue post-quantum protections.
No immediate threat, but a clear call to readiness
Pandl stresses that the time to begin migration toward post-quantum cryptography is now, even if the current threat is not imminent. The idea is to harden blockchains against future quantum attacks before they become critical, rather than scrambling after weaknesses become exploitable.
Industry momentum toward quantum readiness is not limited to Bitcoin. The Solana Foundation and the XRP Ledger have already begun experimenting with post-quantum cryptography, while the Ethereum Foundation published a dedicated post-quantum roadmap in February. These signals suggest a broader market push to standardize and deploy quantum-safe protections across networks, a shift readers should watch closely as governance and coordination across ecosystems mature.
“In our view, there is no security threat to public blockchains from quantum computers today.”
For investors and builders, the takeaway is to separate near-term risk from long-term planning. While the cryptographic landscape may not produce an urgent exploit in the immediate future, the world of post-quantum cryptography is moving forward, and the communities behind major networks are increasingly vocal about preparedness. Grayscale’s stance mirrors a growing consensus: the prudent course is to accelerate research, test implementations, and seek consensus on a governance path that preserves Bitcoin’s security model while guarding against quantum-era threats.
What to watch next
As research continues and other networks advance their quantum-resistant experiments, the crucial developments will be how the Bitcoin community negotiates dormant-key scenarios and whether a broadly accepted post-quantum standard gains traction. The coming months should reveal whether a practical, agreed-upon approach emerges for handling inaccessible coins and for upgrading cryptographic defenses before quantum-era risks become acute.
For now, the emphasis remains on preparedness rather than panic: accelerate post-quantum research, monitor governance dialogues, and observe how the broader ecosystem—spanning Solana, XRP Ledger, and Ethereum—moves toward standardized quantum resistance. The manner in which Bitcoin navigates these questions will shape how investors evaluate digital-asset safety in a world where quantum computers are increasingly plausible, but not yet compelling threats.
Crypto World
Trump’s Dooms Day Deadline For Iran Arrives: Will Bitcoin Price and SPX Dump or Will Trump Blink?

Bitcoin Price is trading at $68,500, as Trump’s April 7 Iran deadline arrives and the crypto market refuses to flinch.
The White House has held its ‘no extension’ posture, demanding Iran open the Strait of Hormuz under threat of strikes on civilian infrastructure, and markets are not pricing in catastrophe.
The S&P 500 is mirroring the same wait-and-see tension, with BTC-SPX correlation tightening into a binary: geopolitical escalation triggers a correlated dump, or Trump blinks and both assets rip higher.
Spot Bitcoin ETFs logged $471 million in inflows over the past 24 hours – the strongest single-day figure in 30 days – suggesting institutions are not running for the exits.
On-chain data from CryptoQuant shows significant exchange outflows in the window before the deadline, consistent with whale accumulation rather than distribution. The market is not calling this a crisis. It is calling a bluff.
Discover: The Best Crypto to Get Right Now
Why the Iran Deadline Is a Macro Trading Event, Not Just a Geopolitical One
The mechanism here is straightforward: a US strike on Iranian infrastructure triggers an oil supply shock, energy inflation re-accelerates, the Fed’s rate-cut timeline extends, and risk assets – Bitcoin and equities both – reprice lower.
That’s the dump scenario, and it’s not subtle. The S&P 500 would absorb the inflation signal as a tightening catalyst; Bitcoin, still running elevated BTC-SPX correlation, would follow equities into a risk-off unwind.
The de-escalation path runs the opposite direction. If Trump blinks – grants an extension, accepts back-channel terms, or downgrades the threat – oil pulls back, rate-cut expectations firm up, and the path of least resistance for both BTC and SPX turns higher.
Geopolitical risk premium drains out of energy hedges and back into growth and risk assets. Bitcoin, already holding $69,000 under maximum headline pressure, would have room to accelerate toward $72,000-$75,000.
Iran’s stated counter-threat, ramping up attacks on Persian Gulf energy sites if struck – introduces tail risk that neither equities nor crypto are fully pricing.
That asymmetry is worth holding in mind. The market’s current read is ‘contained.’ History doesn’t always agree with that read in the first 48 hours of an escalation.
Bitcoin Price Prediction: $75,000 Breakout or Flush Back to $64,000?
Bitcoin at $69,140 is sitting directly at the level that has defined the cycle’s contested zone since late 2025. Immediate support rests at $66,500 – the 50-day moving average – and a clean break below that level opens the $64,000-$65,000 range, where the 200-day MA currently sits.
That $66,500 level is load-bearing. Lose it on a geopolitical shock and the technical structure deteriorates fast.
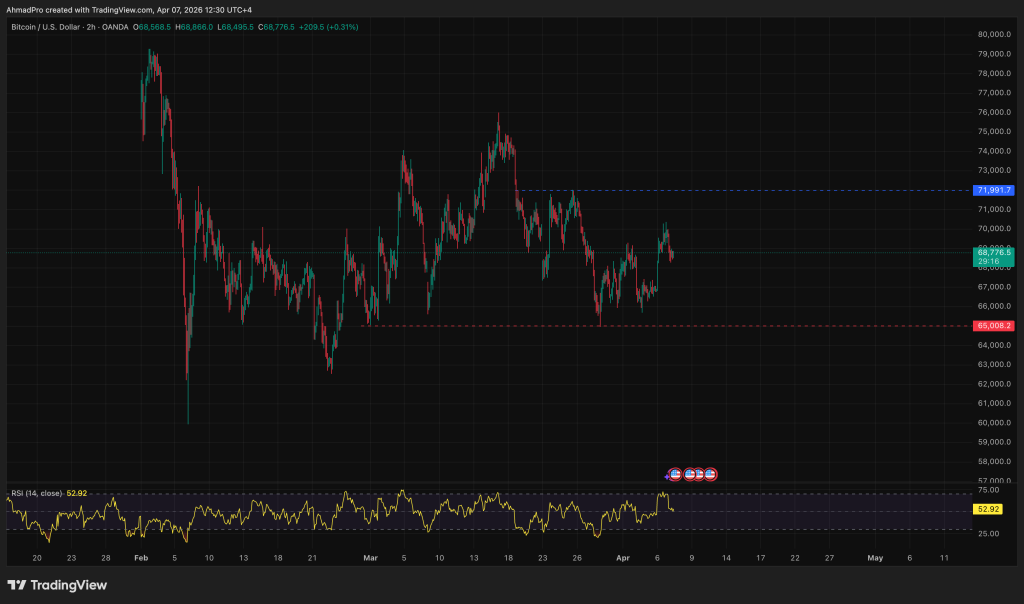
On the upside, $72,000 is the first meaningful resistance – the ceiling from the March consolidation range. A sustained hold above $69,500 through the deadline resolution sets up a test of that level. Above $72,000, the next target is $75,000, which analysts have flagged as the make-or-break level for the broader April macro setup.
RSI is running at approximately 52 – not overbought, not oversold. The setup reads like a coiled compression, not a topping pattern.
Bull case activates on a confirmed hold above $69,500 post-deadline with ETF inflows sustaining above $300 million daily – target $75,000 within five to seven sessions.
Bear case activates on a geopolitical escalation event that breaks $66,500 on volume – in that scenario, $64,000 becomes the first support that actually matters. Until one of those conditions materializes, the $66,500 level is the only number traders need to watch.
Explore: The Best Pre-Launch Token Sales With Asymmetric Upside Potential
The post Trump’s Dooms Day Deadline For Iran Arrives: Will Bitcoin Price and SPX Dump or Will Trump Blink? appeared first on Cryptonews.
Crypto World
BitGW’s Single-Sided AMM Model Highlights a More Collaborative Direction for Crypto Liquidity
As the crypto market continues to mature, Automated Market Makers (AMMs) are no longer seen solely as tools used by decentralized exchanges. Increasingly, they are becoming part of a broader shift in market structure, where trading platforms combine algorithmic liquidity with centralized execution.
BitGW has been operating a single-sided AMM model for several years, reflecting this evolution. While early AMMs—widely associated with platforms like Uniswap—reshaped how liquidity is created in crypto, newer models are beginning to focus not only on efficiency, but also on accessibility, sustainability, and how value is distributed among participants.
From Traditional AMMs to Single-Sided Liquidity
Early AMM systems typically required users to provide two assets into a liquidity pool. That structure made decentralized trading possible at scale, but it also introduced practical challenges. Users needed to manage paired assets, track price movements across both sides, and accept the possibility of impermanent loss.
Single-sided AMM models take a different approach. Instead of requiring two tokens, they allow users to participate with just one asset. This simplifies the process and lowers the barrier for users seeking liquidity-based returns without managing a more complex pool structure.
BitGW’s long-running implementation of this model shows how the concept can extend beyond purely decentralized environments.
A Hybrid Model Rather Than a Replacement
Rather than positioning AMMs and order books as competing systems, the market is increasingly moving toward hybrid designs. In this structure, AMM logic contributes to pricing and liquidity formation, while centralized infrastructure provides execution depth, speed, and stability.
BitGW’s model reflects this direction. Its single-sided AMM framework operates within a broader trading environment, combining simplified liquidity participation with the advantages of centralized exchange architecture.
This makes single-sided liquidity more accessible, particularly for users who may be interested in participating but are less inclined to manage the complexity of traditional dual-token AMMs.
Where the Model Becomes More Meaningful
What makes this structure notable is that the AMM functions not only as a trading mechanism, but also as part of a broader revenue and incentive framework.
BitGW’s revenue structure spans multiple sources, including spot trading fees, swap transactions, AMM operations, and additional mechanisms such as spread capture and asset utilization. These components are directly linked to trading activity and form part of standard exchange infrastructure.
Within this structure, LP participation is connected to the value generated by market activity on the platform. As trading volume and liquidity interaction increase, liquidity providers benefit from the underlying flow they support.
This linkage between trading activity and liquidity participation reflects a model focused on consistency and long-term operational sustainability.
Profit Sharing as a Cooperative Mechanism
One of the more distinctive aspects of the single-sided AMM framework is how it connects platform activity with user returns.
When users add liquidity, they contribute to the infrastructure supporting trading flow. As that activity grows, LPs share in the value generated within the system. This shifts liquidity provision from a purely technical role to a more active form of participation in the platform’s operating economy.
Such a structure is becoming increasingly relevant in today’s market, where users are paying closer attention not only to yield levels, but also to how that yield is generated and whether the underlying mechanism is sustainable.
For BitGW, this supports a “cooperation rather than extraction” narrative: the platform grows with liquidity, and liquidity providers grow alongside the platform.
Why Single-Sided AMMs May Matter More Going Forward
As crypto infrastructure evolves, the industry is moving beyond the earliest generation of AMMs. The question is no longer only whether AMMs work, but which models are better suited for broader adoption.
Single-sided designs are gaining attention because they reduce friction, simplify participation, and integrate more naturally with hybrid exchange environments. For platforms seeking both scalability and usability, this approach may prove more practical than traditional dual-token systems alone.
BitGW’s multi-year operation of a single-sided AMM model points in this direction. It suggests that the future of liquidity may not lie in choosing between centralized and decentralized systems, but in combining them in ways that are more efficient, more accessible, and more aligned with participant interests.
About BitGW
BitGW is a digital asset trading platform focused on developing advanced liquidity infrastructure and delivering efficient trading solutions for global users. The platform has also emphasized compliance and regulatory alignment in earlier updates to its AML and KYC framework.
The post BitGW’s Single-Sided AMM Model Highlights a More Collaborative Direction for Crypto Liquidity appeared first on BeInCrypto.


The crypto market fell 2% to $2.42 trillion after U.S. President Donald Trump said Iran’s proposal to end the war was not enough and warned that Tehran must reopen the Strait of Hormuz by the deadline or face strikes on key infrastructure.
Summary
- Crypto market cap fell 2% to $2.42 trillion after Donald Trump rejected Iran’s ceasefire proposal and warned of strikes if Hormuz is not reopened.
- Iran declined a 45-day ceasefire push while demanding sanctions relief and war compensation, as a Tuesday deadline for U.S. action approaches.
- Bitcoin pulled back below $69K and major altcoins slipped 1–2% as traders turned cautious ahead of potential escalation or de-escalation.
In a sternly worded statement, Trump warned that an Iranian proposal to end the ongoing war in the Middle East is “not enough” to call off his strikes against Iranian infrastructure unless Tehran commits to settling its disputes by reopening the Strait of Hormuz.
“It’s a significant proposal. It’s a significant step. It’s not good enough, but it’s a very significant step,” Trump told reporters. He added that intermediaries “are negotiating now”.
The Strait of Hormuz, which is a strategic gateway for global energy supplies, was effectively blocked as a result of Iran’s attacks in the Gulf region after U.S. and Iranian forces clashed. This has led oil prices to skyrocket and has sparked widespread fears of runaway inflation hurting both crypto and traditional markets.
Trump said the Tuesday deadline for U.S. attacks on Iranian infrastructures would continue to be set in motion unless Iran accepts a deal to reopen the strait, allowing free trade in the region.
Earlier on Monday, Pakistan had put forward a 45-day ceasefire proposal after weeks of trying to broker a diplomatic solution to the war between Iran and the U.S. and Israel.
Iran had reportedly rejected the proposal while pushing for a permanent end to the war. Other demands made by the Iranian government include the removal of sanctions from the central bank and compensation for wartime damages incurred.
While the U.S. government has reviewed the proposal, Trump has so far refused to blink, with war continuing as of press time. Trump has reportedly reiterated that the deadline for compliance still stands at 8 pm Washington time on Tuesday. If Iran fails to agree to a deal, the U.S. could bomb Iran ‘back to the stone ages’.
The crypto market rose to a peak of $2.47 trillion on Monday as reports of Iran considering a proposal to bring a permanent end to the war first surfaced. Investors took this as a sign of de-escalation of the war situation.
However, after Trump confirmed that the U.S. would go forward with its strikes, the market tanked back to $2.43 trillion, erasing some of the gains from the previous day as investors booked profits.
Bitcoin (BTC), the world’s largest crypto asset that is currently strongly influencing other crypto assets due to the war situation, rallied past the $70,000 psychological resistance on Tuesday. However, the asset has fallen back sharply, trading at $68,546 at press time.
Ethereum (ETH), BNB (BNB), XRP (XRP), and Solana (SOL) were down 1-2%, showing traders remain hesitant as they await more clarity about how the standoff ends today.
On one hand, a potential confirmation of peace or de-escalation of the current Middle East conflict could result in a jump in investor appetite for risk assets, thus benefiting cryptocurrencies.
On the other hand, if the U.S. carries forward with the strikes on Iran, it can result in a massive flight to safety and a deeper correction across the entire crypto market.
Disclosure: This article does not represent investment advice. The content and materials featured on this page are for educational purposes only.


Fresh capital flowed back into U.S. spot Bitcoin ETFs at the start of the week, with Monday delivering the strongest single-day inflow in over a month and a half.
Summary
- U.S. spot Bitcoin ETFs recorded $471.3 million in net inflows on Monday, the highest daily total in over six weeks.
- BlackRock and Fidelity led the inflows, with additional buying seen across Ark 21Shares, Grayscale, Bitwise, and VanEck products.
Data from SoSoValue showed that the group of funds pulled in $471.3 million in net inflows, spread across six issuers.
BlackRock’s IBIT led the day with $181.9 million, followed by Fidelity’s FBTC, which brought in $147.3 million. Meanwhile, ARK Invest and 21Shares’ ARKB added another $118.7 million. Additional inflows were also recorded across products tied to Grayscale, Bitwise, and VanEck.
Monday’s figure stands as the highest daily intake since Feb. 25, when net inflows reached $506 million. The rebound effectively erased the $173.7 million in net outflows recorded on April 1, signaling a quick turnaround in investor positioning.
Beyond Bitcoin, spot Ethereum products also recorded $120.2 million in net inflows, which marked the highest daily total since the middle of March.
According to market pundits, these inflows could continue to offer structural support for Bitcoin and help it move beyond its current range. However, the ongoing macro uncertainty could pressure price action and limit any sustained upside.
Tensions between the United States and Iran have stretched into a second month, with no clear path toward de-escalation. Donald Trump has set an April 7 deadline for Iran to reopen the Strait of Hormuz, a critical route that has remained shut for weeks and contributed to rising global oil prices.
Trump warned of a “complete demolition” of Iran’s power plants and bridges if the demand is not met, a statement that has added to concerns around further escalation.
For now, Bitcoin is expected to remain sensitive to macro conditions. If tensions in the Middle East cool, it could help spur a return of risk-on sentiment.

When does the Masters start and who will win? Date, odds and how to watch first 2026 major
UBS upgrades Popular stock rating on earnings growth outlook

US Spot Bitcoin ETFs Hit Strongest Gains Since February


-

 NewsBeat5 days ago
Steven Gerrard disagrees with Gary Neville over ‘shock’ Chelsea and Arsenal claim | Football
-

 Business4 days ago
No Jackpot Winner and $194 Million Prize Rolls Over
-

 Fashion4 days ago
Weekend Open Thread: Spanx – Corporette.com
-

 Crypto World6 days ago
Gold Price Prediction: Worst Month in 17 Years fo Save Haven Rock
-

 Business1 day ago
Three Gulf funds agree to back Paramount’s $81 billion takeover of Warner, WSJ reports
-
Crypto World7 days ago
Dems press CFTC, ethics board on prediction-market insider trades
-

 Sports3 days ago
India men’s 4x400m and mixed 4x100m relay teams register big progress | Other Sports News
-

 Business3 days ago
Expert Picks for Every Need
-

 Business5 days ago
Login and Checkout Issues Spark Merchant Frustration
-

 Sports7 days ago
Tallest college basketball player ever, standing at 7-foot-9, entering transfer portal
-

 Tech7 days ago
How to back up your iPhone & iPad to your Mac before something goes wrong
-

 Crypto World6 days ago
Bitcoin enters the public bond market as Moody’s gives a first-of-its-kind crypto deal a rating
-
Crypto World6 days ago
Bitcoin stalls below key resistance as technical signals skew bearish
-

 Tech5 days ago
Commonwealth Fusion Systems leans on magnets for near-term revenue
-

 Politics7 days ago
Transform Your Space with Stunning Small Works
-
Business2 days ago
No Jackpot Winner, Prize to Climb to $231 Million
-

 Politics6 days ago
Starmer’s centre has collapsed, and the left was right all along
-

 Fashion7 days ago
Zara Turns Up the Heat With New Swimwear
-

 Fashion7 days ago
Tuesday’s Workwear Report: Tavira Sculpt Stretch Crepe Trousers
-
Crypto World7 days ago
AI Memory Rout Wipes 9% Off Nvidia Stock: Chart Says More Pain Ahead
You must be logged in to post a comment Login