
Crypto World
Bitcoin Slides to Lower Lows After Failed $76,000 Relief Bounce
Bitcoin (CRYPTO: BTC) slipped to fresh lows not seen since late 2024 after a wavering relief bounce failed to sustain momentum, with the asset testing new pressure near the $72,000 area as US traders returned to the desk. Data feeds from TradingView highlighted weakness in the US session, with dips briefly pushing BTC beneath $73,000 and lighting up the $72,000 mark on major venues such as Bitstamp. The move underscored a broader risk-off tone in macro markets, where gold struggled to reclaim lofty levels and equities drifted lower at the open. Traders and analysts alike flagged a potential safety net around the 200-week exponential moving average (EMA) near $68,000, a level that has historically been watched as a long-term anchor during drawdowns.
Key takeaways
- Bitcoin breached the previous Tuesday low, slipping to a sub-$73,000 print as Wall Street opened and sellers resurfaced.
- The broader macro backdrop cooled, with precious metals giving back gains and equity indices under pressure in the early session.
- Analysts emphasized the importance of the 200-week EMA around $68,000 as a potential long-term support line, should selling intensify.
- Market participants warned that ongoing volatility could push BTC toward psychological and technical levels that have historically invited capitulation bids or further setbacks.
- Uncertainty surrounding U.S. fiscal policy—specifically government funding deadlines—kept headlines active and contributed to headline risk over the near term.
Tickers mentioned: $BTC
Sentiment: Bearish
Price impact: Negative. The slide into sub-$73,000 territory and the failure of a relief rally reinforce a cautious to bearish stance among traders.
Trading idea (Not Financial Advice): Hold. The market is weighing potential further downside against possible stabilizations near key moving averages, warranting patience before committing to new longs.
Market context: The move comes as a broader risk-off environment takes hold, with macro assets showing renewed sensitivity to headlines and policy signals. Traders will be watching for continued liquidity shifts, near-term fiscal risk headers, and how these factors affect risk assets across crypto and traditional markets.
Why it matters
The latest price action illustrates how Bitcoin continues to trade in a high-volatility regime where macro headlines and on-chain signals interact in real time. The retreat below $73,000, following a brief relief rally above $76,000, signals that buyers are not yet reclaiming the recent highs with sustained force. Technical observers point to the 200-week EMA near $68,000 as a possible anchor if selling accelerates, given its historical role as a gravity point during prolonged pullbacks. The market’s attention on long liquidations—signaling aggressive positioning by leveraged traders—also underscores the fragility of near-term upside scenarios as risk appetite remains fragile.
Beyond price levels, the narrative is shaped by the broader macro context. Gold’s inability to recapture higher ground and the mixed performance of U.S. equities in early trading echo a risk-off mood that often spills into crypto markets. The scene is further complicated by a shifting policy backdrop in Washington. While a fresh government shutdown was avoided in the near term, the funding deadline extended only through mid-February keeps policymakers in the spotlight and potentially adds a layer of headline risk for financial assets, including BTC. In such moments, traders often search for wall-based support from familiar levels or moving averages, while hedging strategies come into play as a counterbalance to drawdown risk.
Industry commentary has reflected the ongoing difficulty of sustaining relief rallies in a market dominated by uncertain macro cues. Notably, market participants have flagged that recent price behavior resembles “bear market price action” rather than a durable bottoming process. The sense of urgency around downside risk was palpable across trading desks, with some analysts forecasting the next target in a scenario of continued weakness around the $50,000 to $60,000 region if macro conditions deteriorate further. The debate underscores how crypto markets are increasingly responsive to cross-asset dynamics, including shifts in precious metals, equities, and macro policy signals that set the tone for liquidity and risk tolerance across the sector.
What to watch next
- Watch BTC’s weekly close relative to the key levels around $74,000 and $68,000 (the latter aligning with the 200-week EMA) to gauge whether downside pressure accelerates or subsides.
- Observe liquidity and leverage indicators, including any uptick in long liquidations near the $72,000–$73,000 area, which could signal renewed selling pressure.
- Monitor macro headlines, especially any updates on U.S. fiscal policy deadlines (Homeland Security funding extended through February 13) that could reframe risk sentiment in both crypto and traditional markets.
- Track relief-bounce dynamics: a sustained move back above the $76,000–$77,000 zone would be a meaningful sign of a shifting intraday risk appetite, while failure to do so could reinforce the bear case.
- Pay attention to data from on-chain analytics and market commentators who tie volume patterns to potential trend reversals; sustained high-volume declines typically indicate persistent selling pressure.
Sources & verification
- BTC price action and levels referenced via analyses that cite TradingView price feeds and Bitstamp data.
- Historical reference to the 200-week EMA near $68,000 as a potential long-term anchor.
- Market comments from QCP Capital’s Asia Color update on volatility and headline risk.
- Market commentary from traders on social channels and related coverage discussing bear-market price action and resistance levels.
- Liquidation metrics from CoinGlass indicating ongoing long liquidations and total crypto liquidations.
Bitcoin price action and macro backdrop
Bitcoin (CRYPTO: BTC) faced renewed selling pressure after briefly testing higher ground, with the asset sliding back toward the lower end of the recent trading band as the U.S. market reopened. The intraday trajectory pointed to a deeper tilt toward risk-off dynamics that have characterized much of the recent price action in crypto, equities, and precious metals. A key focus for traders has been whether BTC can sustain any bounce above the $76,000 level or if sellers reassert themselves and push the price toward the next major magnetic price point around $68,000—the approximate footprint of the 200-week EMA that market technicians often monitor for long-term support.
TradingView data showed the weakness extended into a sub-$72,500 print on main venues, reinforcing the idea that relief rallies have struggled to gain traction in the current environment. The pattern aligns with a broader narrative in which macro assets give back gains after brief recoveries, as evidenced by gold failing to reclaim a higher plateau and U.S. stocks trading lower at the open. Within this framework, traders have looked to various anchors—technical, on-chain, and sentiment-based—to price the probability of further downside versus a potential stabilization or rebound.
Several observers have emphasized the persistence of bear-market price action, citing high-volume moves down as a signal that selling pressure remains dominant when price moves lower. A popular chart-focused view suggests that if BTC closes under the $74,000 threshold, the next meaningful objective could shift toward the $50,000–$60,000 area, a scenario that several analysts deem plausible given the current macro setup. In the meantime, market participants cited a potential safety net around $68,000, anchored by the 200-week EMA, a level that has historically attracted buyers during extended retreats. The market’s mood remains cautious, with risk tolerance tightly tethered to evolving macro headlines and policy signals.
“Ugly interim weekly candle for bulls. IF we close sub 74k – its safe to say 50k area is next,” trader Roman wrote in his latest analysis on X.
Beyond the price action, the market remains sensitive to policy developments and funding timelines, with headlines about government funding continuing to influence risk appetite. In a related note, the broader crypto ecosystem continues to digest liquidity dynamics, with long-liquidation pressure mounting whenever price breached key support zones. The combined effect is a landscape where investors weigh the probability of a sharp drawdown against the possibility of a sustained base-building phase that could set the stage for a longer-term recovery should macro conditions cool and liquidity improve.


TLDR:
- Bitcoin surged over 16% in two weeks, breaking a six-month resistance level and shifting market structure outlook.
- BTC moved above the 100-day SMA after prior rejections that triggered declines of 30% and 39% in past cycles.
- Momentum indicators turned positive with a bullish crossover, while volatility expands after a long compression phase.
- Market developments, including institutional access and profitability shifts, continue to support current price strength.
Bitcoin has staged a sharp recovery, climbing more than 16% in two weeks and reclaiming a key resistance level. The move follows months of pressure, while both technical indicators and broader market developments begin to support a shift in short-term direction.
Bitcoin Pushes Through Key Resistance as Momentum Builds
Recent market commentary from Ali Charts noted that Bitcoin has broken above a resistance level that defined price action for nearly six months.
The analyst pointed out that this marks a notable change, especially as the asset tests the 100-day simple moving average again.
Earlier interactions with this level resulted in steep declines. In October, Bitcoin dropped about 30% after rejection.
A similar pattern appeared in January, when price fell roughly 39% following another failed attempt. This time, price action shows a different response, with Bitcoin moving through the level instead of reversing.
At the same time, broader market developments are shaping the current trend. A recent update reported that Strategy’s Bitcoin holdings have returned to profit, as price climbed above its average acquisition level of $75,577. This shift reflects improved balance sheet positioning for large holders.
In parallel, Charles Schwab plans to roll out direct spot Bitcoin and Ethereum access for retail clients in the coming weeks.
This step may expand access to digital assets for traditional investors, adding another layer of demand to the market.
These developments align with the current market structure, where Bitcoin trades near $77,900. Price has been forming higher lows, which often reflects steady buyer interest. This gradual climb suggests a shift from the earlier bearish structure toward a more stable upward trend.
Technical Indicators Signal Early Trend Transition
The daily chart structure shows a clear transition phase. After a prolonged decline from around $110,000 to $75,000, Bitcoin entered a sideways range between $65,000 and $75,000. During this period, Bollinger Bands tightened, indicating reduced volatility and a possible accumulation phase.
As price exited this range, volatility began to expand again. Bollinger Bands are now widening, which often accompanies stronger directional moves. Bitcoin is currently approaching the upper band near the $78,000 zone, where short-term resistance may appear.
Momentum indicators also reflect a change in direction. The oscillator, similar to a MACD-style setup, previously showed deep negative readings, signaling strong selling pressure. That has since reversed, with the indicator crossing above zero and forming a bullish crossover.
The histogram has turned positive and continues to grow, which suggests increasing upward momentum. This shift is often associated with early stages of trend reversal rather than a temporary bounce.
Even so, resistance remains close. If Bitcoin struggles near the $78,000 to $80,000 range, a pullback toward the mid-band near $75,000 could follow. Stronger support remains near $70,000, where previous demand emerged during consolidation.
If price holds above current levels and breaks resistance, the next areas to watch are $85,000 and $90,000. These levels align with prior structural zones and may attract increased market activity.
The current setup reflects a transition from consolidation into a potential expansion phase. With both technical structure and supporting market developments aligning, the market is attempting to establish a new direction.

A temporary ceasefire between the United States and Iran sparked a notable, though tentative, market reaction as traders positioned around the Strait of Hormuz. Polymarket’s prediction-market odds on traffic through the strait returning to normal surged, reflecting optimism that the ceasefire could hold long enough to ease regional tensions.
The odds climbed to a high of 82% on Friday after Iranian Foreign Minister Seyed Abbas Araghchi announced that the Strait of Hormuz was open. They later cooled, settling at about 73% as further statements emerged. Araghchi’s message was conveyed in an X post, stating: “The passage for all commercial vessels through the Strait of Hormuz is declared completely open for the remaining period of the ceasefire, on the coordinated route as already announced by the Ports and Maritime Organization of the Islamic Republic of Iran.”
In the meantime, traders on Polymarket had previously priced in a more cautious outlook, with odds of a return to normal activity by the end of April at around 40%. The divergence between these two points highlights the evolving uncertainty around the durability of the ceasefire and its broader impact on global supply chains.
The news came as the war in Iran reverberated through financial markets, influencing both crypto and energy assets as investors reassessed risk premia and geopolitical risk. That backdrop set the stage for a volatile session across digital assets even as traditional energy proxies moved in response to shifting oil supply expectations.
Bitcoin advances on ceasefire news, but the outlook remains fragile
Bitcoin (BTC) registered a notable, albeit brief, lift in response to the ceasefire developments, briefly tapping around $78,000 before retreating to roughly $77,358 at the time of reporting. The move underscored how geopolitical headlines continue to correlate with crypto sentiment, even as the broader macro picture remains unsettled.
“The passage for all commercial vessels through the Strait of Hormuz is declared completely open for the remaining period of the ceasefire, on the coordinated route as already announced by the Ports and Maritime Organization of the Islamic Republic of Iran.”
Market observers highlighted that while the immediate reaction was supportive for risk-on assets, the longer-term trajectory was far from assured. Nic Puckrin, a crypto market analyst, described the ceasefire as fragile and fraught with unresolved core issues. He noted that a sustained absence of tensions, a meaningful drop in oil prices toward roughly $80 per barrel, and softer-than-expected economic data would all help BTC regain a higher level, potentially near $90,000.
“A ceasefire that results in the end of geopolitical tensions, a sustained drop in oil prices toward $80, and ideally also softer-than-expected economic data that calms stagflation fears” are all needed for BTC to reclaim the $90,000 level, he said. The market’s sensitivity to oil dynamics underscores how intertwined crypto and energy narratives have become in periods of heightened geopolitical risk.
Beyond the chart dynamics, the political backdrop remains a key driver. U.S. President Donald Trump stated that the naval blockade on Iran would “remain in full force and effect” until the transaction with Iran is 100% complete, a stance that keeps the risk of renewed escalation in focus for traders and policymakers alike.
Analysts emphasize that a durable resolution would likely require more than a short-term pause: it would demand progress on broader regional issues, verification mechanisms, and a credible path to de-escalation that reduces volatility across asset classes, including risk assets tied to geopolitical risk premiums.
What this means for investors and markets going forward
The current cycle illustrates a central truth about crypto markets in times of geopolitical strain: risk-on flows can emerge on partial news, but the sustainability of price moves hinges on the durability of peace signals and the broader macro regime. If the ceasefire endures and oil markets stabilize, appetite for crypto risk could improve further, potentially lifting BTC back toward earlier highs. Conversely, if tensions re-ignite or if the ceasefire proves short-lived, the same assets may retreat as investors gravitate toward safety and risk-off positioning.
Market participants will also be watching how policymakers respond to evolving conditions. The prospect of delayed rate cuts—if economic data softens and inflation remains sticky—could influence BTC’s risk premium and its ability to attract new entrants seeking inflation-hedge or digital-asset diversification benefits. The interplay between geopolitics, energy prices, and crypto demand will likely shape the trajectory of Bitcoin and related assets through the coming weeks and into mid-2026.
In the near term, traders should monitor several cross-currents: the durability of the ceasefire, any new statements from Iran or its interlocutors, and the oil-price path as markets digest the potential implications for supply and global growth. As with prior episodes, the path forward is unlikely to be linear, with volatility flagging opportunities for traders who can adapt quickly to shifting signals about risk appetite and macro stability.
For investors, the episode underscores the importance of a diversified approach to exposure amid geopolitical uncertainty. Crypto markets remain sensitive to policy signals, while traditional energy dynamics continue to color risk sentiment across multiple asset layers. As the situation evolves, market participants will look for clearer, verifiable concessions and longer-lasting guarantees that could translate into steadier price action for both digital assets and energy-linked markets.
Readers should stay tuned for further developments on the ceasefire’s longevity, any changes to Hormuz traffic flow, and the potential shifts in oil and macro indicators that could recalibrate the risk-reward calculus for crypto portfolios in the months ahead.


An ICE agent charged 2026 with two counts of felony second-degree assault faces a nationwide arrest warrant after allegedly pointing his duty weapon at the heads of two civilians in a moving vehicle during the Trump administration’s Operation Metro Surge, Hennepin County Attorney Mary Moriarty announced Thursday.
Summary
- Gregory Donnell Morgan Jr., 35, a Maryland resident and ICE Enforcement and Removal officer, allegedly pulled alongside a civilian vehicle on a Minneapolis highway shoulder on February 5 and pointed his weapon directly at the driver and passenger.
- This is the first criminal case against a federal immigration officer stemming from Operation Metro Surge, which deployed approximately 3,000 federal agents to the Minneapolis-St. Paul area and was linked to the fatal shootings of two US citizens.
- Moriarty said Morgan acted “well beyond the scope” of federal authority and that “there is no such thing as absolute immunity for federal agents who violate the law in the state of Minnesota.”
An ICE agent charged 2026 with felony assault in Minnesota marks the first criminal case against a federal officer from Operation Metro Surge, the Trump administration’s largest immigration enforcement operation, which deployed about 3,000 agents to the Minneapolis-St. Paul area between December and February and left two US citizens dead.
Gregory Donnell Morgan Jr. allegedly drove an unmarked SUV on a highway shoulder on February 5 past slower traffic, then pulled alongside a civilian vehicle and pointed his duty weapon directly at both occupants while continuing to drive. The victims called 911 and filmed the Utah license plate on the SUV, which investigators traced to a rental linked to Morgan’s ICE partner.
Morgan gave a voluntary interview to Minnesota State Patrol after the incident, telling investigators he feared for his safety when the victims’ car pulled in front of him. He said he drew his weapon and yelled “Police! Stop!” Investigators noted the victims could not hear him because their windows were up and had no way to identify him as a law enforcement officer.
“For a federal agent, our opinion is that illegally driving on a shoulder, pulling up to a car and pointing a gun at the heads of two community members who are not doing anything at the time is well beyond the scope of their authority,” Moriarty said. The charges carry a maximum sentence of up to seven years in prison per count under Minnesota law.
Federal Response and What This Means for Operation Metro Surge
The Department of Homeland Security did not respond to requests for comment. Acting Attorney General Todd Blanche has previously warned that the DOJ could investigate and prosecute state and local officials who arrest federal agents for performing official duties. Moriarty said Thursday that she is “not concerned about blowback” and that her office would hold people accountable under Minnesota law regardless.
Operation Metro Surge was described by DHS as its largest immigration enforcement operation ever. The surge led to thousands of arrests and drew mass protests across the Twin Cities. Two US citizens, Alex Pretti and Renee Macklin Good, were shot and killed by federal officers during the operation. Trump fired Noem in March shortly after the surge ended, and Border Patrol sector chief Gregory Bovino announced his retirement the same month. Minnesota is separately suing the federal government for access to evidence in the three shooting cases.
The Morgan case moved faster than the shooting investigations because, Moriarty said, “virtually none of the obstacles around evidence collection that exist for the January shootings exist in this case.” A video and a license plate produced a clear evidentiary path. The shooting cases involving Pretti and Good remain under investigation.
The charges arrive at a moment when the administration’s immigration enforcement record is becoming a central midterm issue, with Democrats using controversies like this to keep pressure on vulnerable House Republicans whose votes will determine whether the CLARITY Act and other reform legislation can pass before the November election.
For most of 2025, altcoin holders were waiting. Watching Bitcoin climb to a new all-time high near $126,000, they expected what had always followed — the familiar rotation, the altcoin surge, the season that rewards patience with explosive gains. It never came.
Benjamin Cowen, founder of IntoTheCryptoverse, wasn’t surprised. He had a name for what was happening, and it changed everything.
“This is a cycle where Bitcoin topped on apathy rather than euphoria.”
That single phrase explains more about the 2025 cycle than any price target or on-chain metric. And to understand why, you need to follow the data across four charts — from social sentiment, through market structure, all the way to the deepest layers of the global macro economy.
The Top That Looked Normal, But Wasn’t
Bitcoin did exactly what it always does. It peaked in Q4 of the post-halving year, right on schedule, consistent with every prior four-year cycle. On the surface, nothing was broken. Look closer, however, and something was fundamentally different.
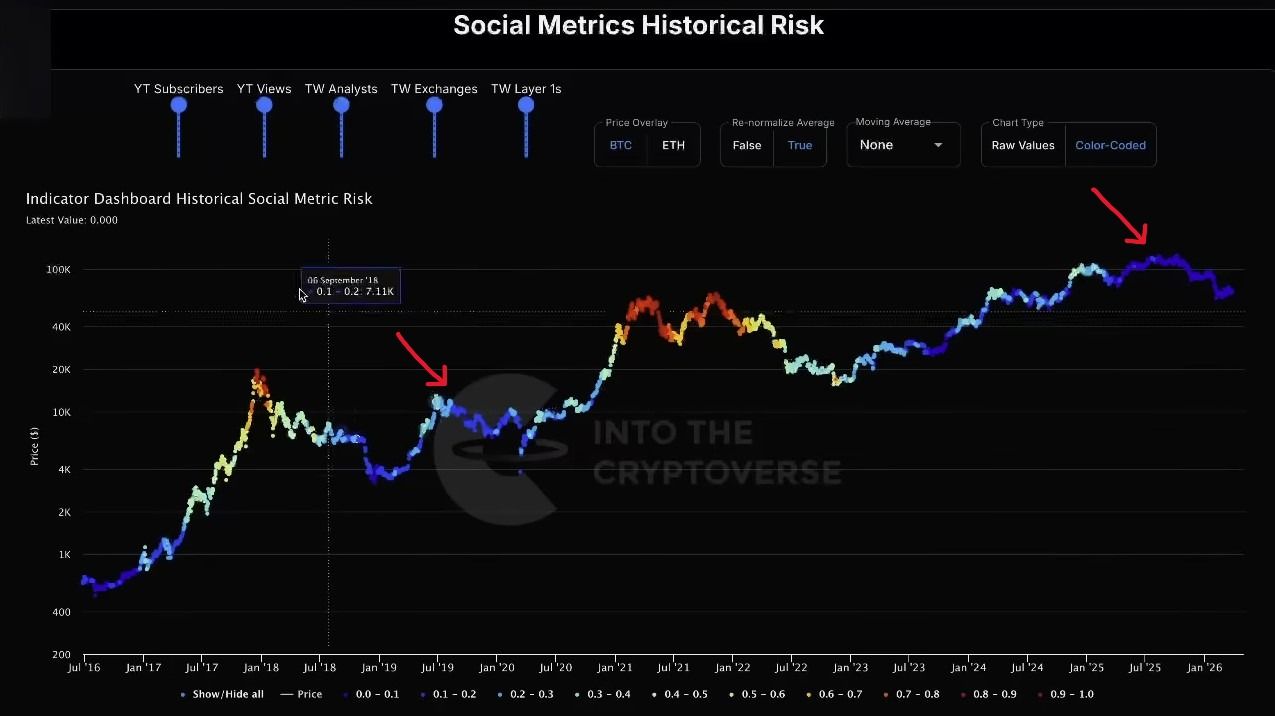
Cowen’s Social Metrics Historical Risk chart tells the story visually. The chart color-codes Bitcoin’s price history by the level of social engagement at each point in time — warm colors (red, orange) for high engagement, cool colors (blue) for low.
In 2017 and 2021, Bitcoin topped in a blaze of red and orange. Social interest was at peak levels. Retail was flooding in. Everyone was talking about crypto.

In 2025, Bitcoin printed its all-time high in cold blue. Social engagement was near-historic lows at the exact moment the market reached its peak.
No retail frenzy or mainstream headlines are driving fresh money in. Just a quiet, almost invisible top — what Benjamin Cowen defines as apathy.
“In 2017 and 2021 we topped on euphoria and because we topped on euphoria there was a rotation into the higher risk assets — altcoins. But when you top on apathy you don’t get that same rotation.”
The only other time this happened was in 2019. That observation is where everything begins.
Benjamin Cowen: Why Apathy Kills the Altcoin Season
In a euphoric cycle, the sequence is predictable. Bitcoin tops, early investors take profits, and that capital rotates into higher-risk assets — altcoins. The crowd, still buzzing with excitement, chases the next opportunity. Alt season follows almost mechanically.
Apathy breaks that sequence entirely. When Bitcoin tops on indifference rather than excitement, there is no crowd waiting to rotate.
The retail wave that normally fuels altcoin rallies simply never arrived. And without new buyers entering the market, altcoins have nowhere to go but down.
Cowen puts it with characteristic bluntness:
“But when you top on apathy, like in 2019, you don’t get that rotation. And the reason you don’t get that rotation is that there’s just no one left to sell the altcoins to.”
The consequence is visible in the altcoin total market cap chart. Rather than the sharp post-Bitcoin rotation that altcoin holders were expecting, the chart shows something more painful — a slow, relentless bleed. Altcoins losing ground to Bitcoin not just in the bear market, but throughout the entire cycle, both during the bull run and after it ended.
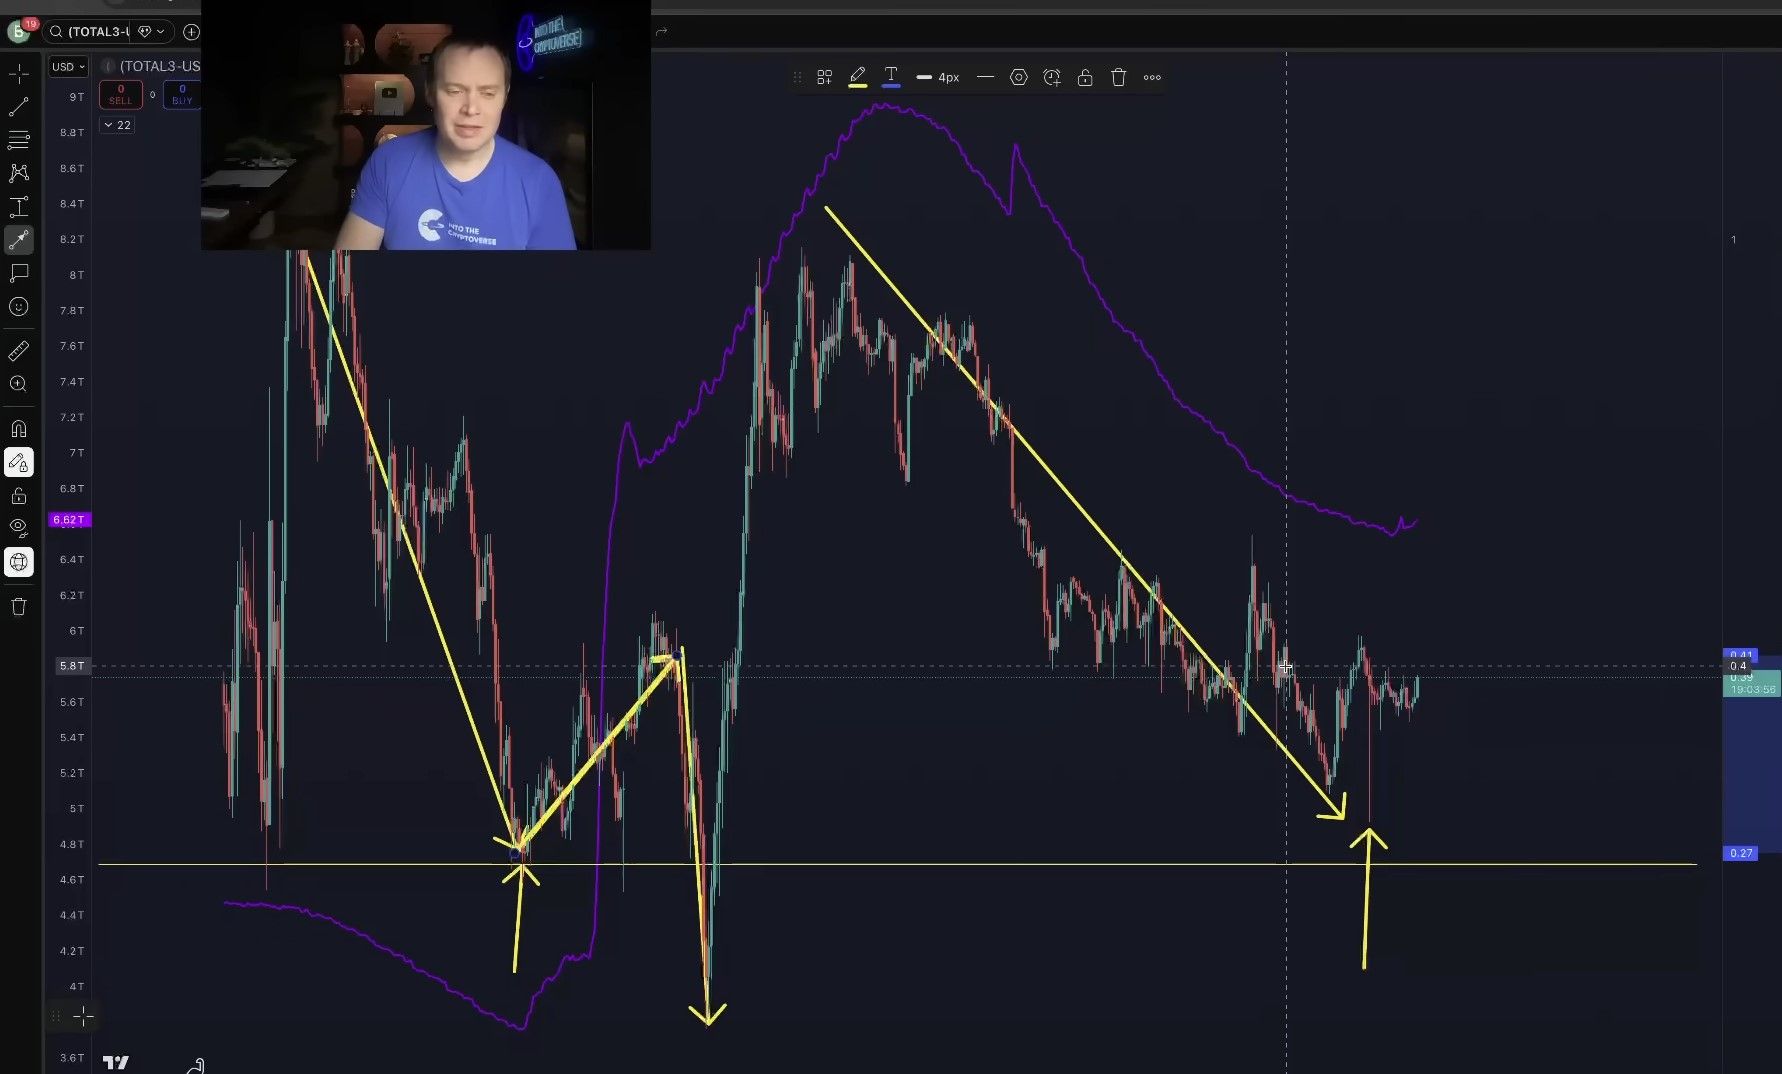
This is not a coincidence or bad luck. It is a direct consequence of the macro environment in which this cycle occurred.
The Macro Context: 2019 and 2025 Show the Same Story
Most crypto analysts treat Bitcoin as its own ecosystem, governed purely by halving cycles and on-chain mechanics. Benjamin Cowen argues that it is only half the picture.
The global business cycle — the broader rhythm of economic expansion, late-cycle stress, and recession — shapes not when Bitcoin tops, but how investors behave when it does.
His Business Cycles chart, built by normalizing a composite of S&P 500 performance, unemployment, interest rates, inflation, and M2 money supply, makes the argument visually.
From Bitcoin’s earliest days through approximately 2019, the macro environment was in an early business cycle phase — the long recovery following the 2008 financial crisis. Risk appetite was structurally high. Investors were willing to climb the risk ladder, moving from equities to Bitcoin to altcoins.
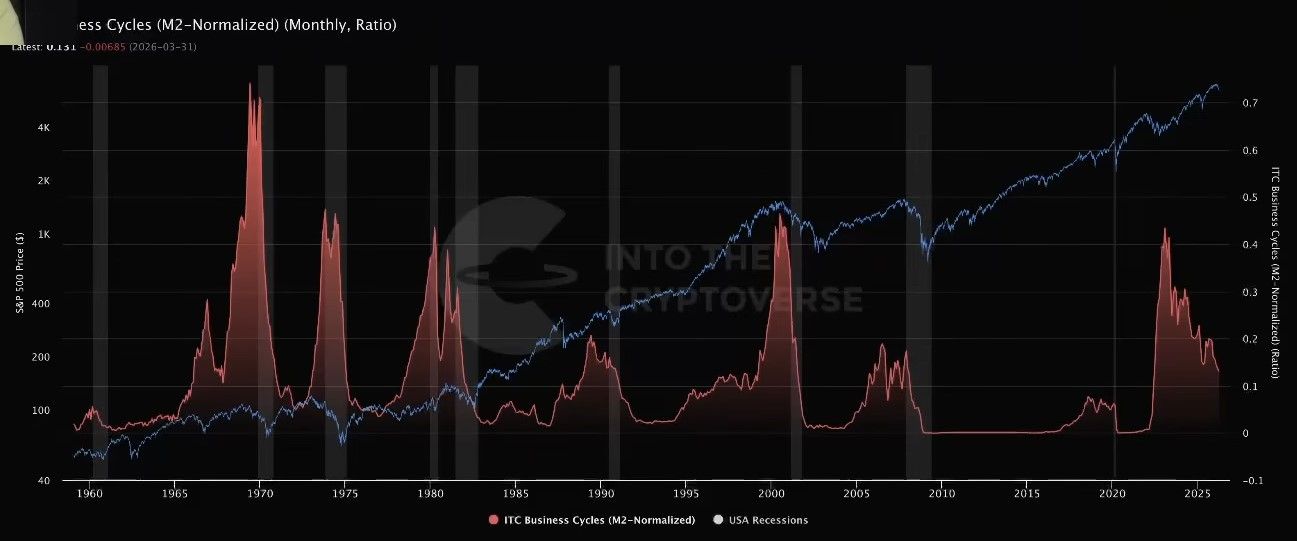
In a late business cycle environment, that risk appetite reverses. Investors don’t reach for more risk — they pull back from it. They consolidate into quality. In crypto terms, that means Bitcoin, not altcoins. It explains why, in both 2019 and 2025, altcoins bled to Bitcoin even as Bitcoin itself was still rising. The macro environment was actively working against the rotation altcoin holders had been counting on.
“The reason why this cycle feels different is because this is a late business cycle environment. And the only other time we had a late business cycle environment where altcoins bled out to Bitcoin even after Bitcoin topped without a rotation was actually in that 2019 phase.”
The Liquidity Risk chart adds a second layer of confirmation. With liquidity risk currently sitting at 0.789 — firmly in the “Very Tight” zone — the conditions mirror those of the 2008 financial crisis and the 2018-2019 period almost precisely. Tight liquidity environments are not environments where investors chase speculative assets. They are environments where capital retreats to safety.
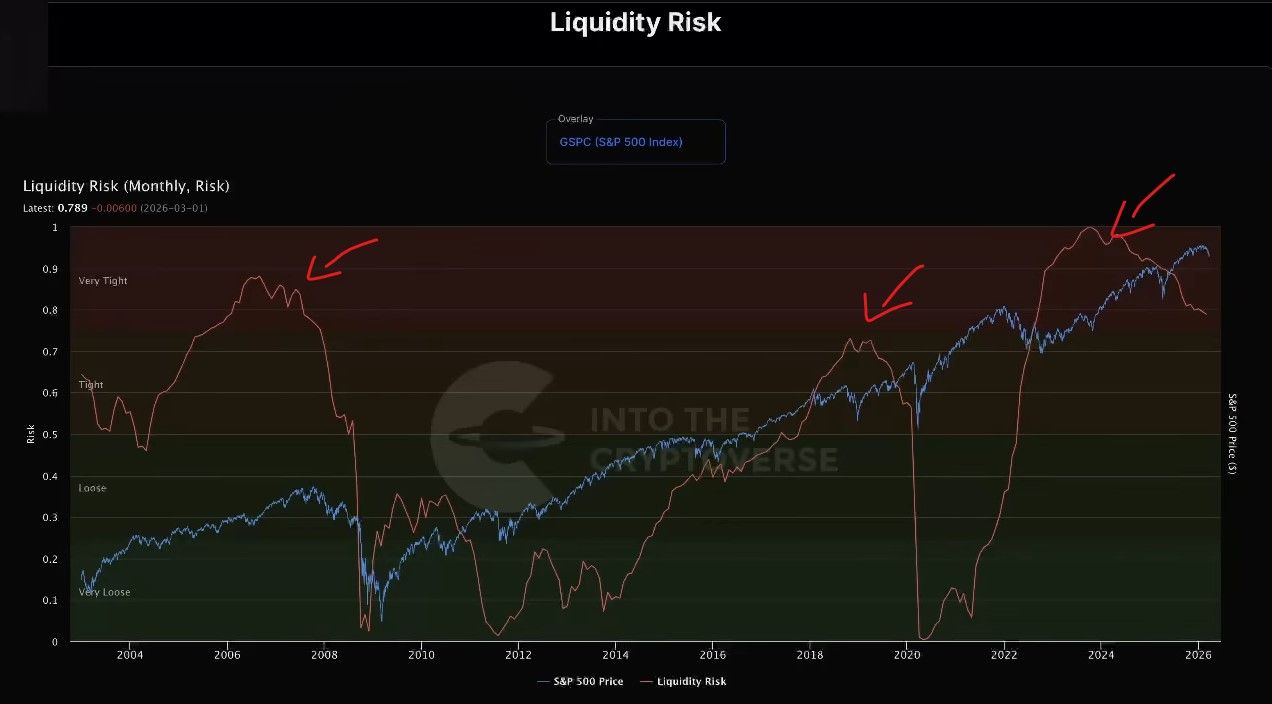
The symmetry between 2019 and 2025 goes deeper still. In 2019, Bitcoin topped in June — two months before quantitative tightening ended in August. In 2025, Bitcoin topped in October — two months before quantitative tightening ended in December. Same pattern, same spacing, larger scale.
“What’s happening now is just a larger version of what happened in 2019. It just happens to all line up.”
What Comes Next for Benjamin Cowen
The 2019 parallel is not a perfect map, but it is the most honest one available. The four-year cycle remains intact — Bitcoin tops when it always tops, and it will bottom when it historically bottoms, approximately one year after the peak. That places the base case for a cycle low in October 2026.
What this cycle has revealed, more clearly than any before it, is that the crypto market does not exist in isolation. The business cycle, liquidity conditions, and investor risk appetite are not background noise — they are the environment in which every crypto decision plays out. In an early cycle, rising risk appetite carries altcoins higher.
In a late cycle, retreating risk appetite leaves them behind.
Benjamin Cowen’s thesis is not a bearish call for its own sake. It is a framework for understanding why this cycle felt different — and why, for those who understood the macro context, it was never really a surprise.
The altcoin season didn’t fail. It was never going to arrive. Not in this environment. Not in this cycle.
The post Benjamin Cowen Reveals Why The Altcoin Season Never Came appeared first on BeInCrypto.

Telegram CEO Pavel Durov warned Friday that the European Union’s new age-verification app could become a stepping stone toward broader online identity tracking, days after the European Commission said the system was technically ready for rollout.
In a Telegram post on Friday, Durov cited analysis from security consultant Paul Moore, who said the app is hackable in “under two minutes” after examining its technical design.
“This product will be the catalyst for an enormous breach at some point,” Moore said in an X post on Thursday, adding that the system could be tricked so the age check isn’t properly tied to the actual user or their device.
Durov argued that the security concerns went beyond age checks and could, over time, be used to justify broader identity verification across online services in Europe.
The criticism reflects a wider debate over how age verification is being built into online platforms, as regulators in multiple regions push similar systems, raising concerns over security and digital identity infrastructure.
System promoted as being “completely anonymous”
The European Commission released the first version of its age-verification blueprint in July 2025, with the aim of letting users prove they are over 18 without disclosing other personal information.
The age verification framework was developed as an open-source project designed to preserve privacy and support future interoperability with European Digital Identity Wallets.

In a statement on Tuesday, EC President Ursula von der Leyen said the EU’s age verification app is “technically ready,” describing the tool as “completely anonymous” and claiming users can prove their age without revealing personal data or being tracked.
However, after researchers said the system can be bypassed in minutes, it’s unclear whether its privacy and security promises will hold up in real use.
Related: Signal push notifications could present privacy vulnerability, says Durov
According to Durov, the app is “hackable by design,” suggesting it was built in a way that makes it easy to break in practice, which he argues could later be used to justify stronger identity checks.

“The EU bureaucrats needed an excuse to silently start turning their ‘privacy-respecting’ age verification app into a surveillance mechanism over all Europeans using social media,” the Telegram CEO said.
Durov has emerged as a major advocate of free speech and digital privacy. He remains under judicial investigation in France over allegations tied to illegal activity facilitated through Telegram, including organized crime, fraud and the platform’s alleged failure to cooperate with authorities.
Magazine: How crypto laws changed in 2025 — and how they’ll change in 2026


President Trump said Thursday the White House is investigating the deaths and disappearances of 10 scientists with ties to classified US defense, nuclear, and aerospace research, calling the pattern “pretty serious stuff” after leaving a meeting on the topic — as a lawmaker called for a formal FBI probe into what investigators have not yet confirmed is anything other than coincidence.
Summary
- Trump told reporters on the White House lawn: “I hope it’s random, but we’re going to know in the next week and a half. Some of them were very important people.”
- White House Press Secretary Karoline Leavitt said the Trump administration would “deem worth looking into” a cluster of cases involving scientists with access to classified nuclear and space material that has drawn growing public scrutiny since late 2024.
- Investigators have found no evidence of a common thread linking the cases, and Harvard physicist Avi Loeb said the cases are probably unrelated because the individuals worked in different specialty areas.
The White House scientist investigation officially entered public view Thursday when President Trump acknowledged he had just left a meeting on the topic of 10 scientists who have died or disappeared since mid-2024, all of them tied to classified US defense, nuclear, or aerospace research.
“Pretty serious stuff,” Trump told reporters before boarding Marine One. “I hope it’s random, but we’re going to know in the next week and a half.” White House Press Secretary Karoline Leavitt this week called it “definitely something I think this government and administration would deem worth looking into,” according to Newsweek reporting. A lawmaker has separately called for the FBI to open a formal investigation.
Five of the ten have died; five remain missing. Among the most prominent: retired Air Force Maj. Gen. William “Neil” McCasland, 68, who previously oversaw some of the military’s most advanced and highly classified research programs, disappeared from his Albuquerque home on February 27, 2026, leaving his phone and prescription glasses behind. Authorities have found no trace of him.
Caltech astrophysicist Carl Grillmair, 67, who worked on the Hubble and Spitzer space telescopes, was shot and killed outside his California home on February 16, 2026. A 29-year-old suspect was arrested and charged with murder. MIT plasma physicist Nuno Loureiro, 47, director of the university’s Plasma Science and Fusion Center, was shot at his Brookline, Massachusetts home in December 2025 and died from his injuries. Jason Thomas, 45, a Novartis pharmaceutical researcher, went missing in December 2025 and was found dead in a Massachusetts lake in March 2026 after investigators said no foul play was suspected.
Monica Reza, 60, a director at NASA’s Jet Propulsion Laboratory, has been missing since June 2025 after vanishing on a well-traveled California hiking trail.
What Authorities Have Found and Have Not Found
No federal agency has publicly confirmed an active investigation linking the cases. Former FBI Assistant Director Chris Swecker told NewsNation he believed the bureau was probably reviewing the cases, adding: “These are classified matters. We shouldn’t be hearing about them if they are investigating.”
Authorities have noted that each case is distinct: some are confirmed homicides with unrelated suspects, some are disappearances with no established cause, and some appear accidental. Avi Loeb of Harvard said he does not believe the cases are related because the individuals worked in different scientific disciplines and there is no established technical link.
The overlap in timing and profession, however, and the access these individuals had to nuclear weapons programs, advanced aerospace systems, and other sensitive areas, has fueled questions across government and intelligence circles that the White House cannot credibly ignore in public.
For the crypto sector, the pattern has a specific relevance: researchers at Lawrence Berkeley National Laboratory, one of the institutions named in connection with these cases, are early adopters of NVIDIA Ising, the new quantum AI toolkit launched this week. Advances in quantum computing research — and the security of the people advancing it — directly intersect with the quantum threat timeline that determines when cryptographic systems securing Bitcoin and other blockchain infrastructure become vulnerable.
Update (4.17.26 6:43 PM UTC): This article has been updated to reflect updated BTC prices and rally data.
Iran’s foreign minister said Friday that the Strait of Hormuz is open to commercial vessel traffic for the remainder of the current ceasefire, prompting quick market reactions.
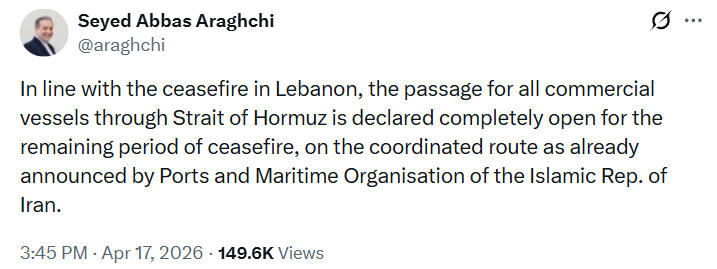
“In line with the ceasefire in Lebanon, the passage for all commercial vessels through Strait of Hormuz is declared completely open for the remaining period of ceasefire,” said Iranian Foreign Minister Seyed Abbas Araghchi in a Friday X post.

US President Donald Trump confirmed the opening of the passage in a Friday post on Truth Social.
Bitcoin (BTC) surged past $77,000 on Friday following the news, rising by over 3.7% in 24 hours and a weekly recovery of about 5%, according to data from CoinMarketCap and TradingView.
Brent crude oil futures sank to around $85 per barrel, falling 10% on the news, according to Tradingeconomics data.
Easing geopolitical tensions may bring more risk appetite among crypto investors. However, the two-week ceasefire between the US, Israel and Iran is set to expire on April 22, with the threat of renewed escalation continuing to weigh on market sentiment.
Investors who sold assets in March are now “rushing back into the market” while risk appetite is returning amid the signs of geopolitical deescalation, according to a Friday X post from The Kobeissi Letter, adding that the S&P 500 index added $7 trillion over the past three weeks.
Related: Tom Lee says ‘mini crypto winter’ is over, sees Ether above $60K
Axios says US weighs broader Iran deal
Adding to the positive news, Axios reported Friday that US officials were discussing a proposal to release as much as $20 billion in frozen Iranian funds in exchange for Iran giving up its stockpile of enriched uranium.
Axios said the proposal was part of a three-page framework being discussed as part of efforts to end the war.

Still, the US naval blockade will remain in “full force and effect” until the US’ transaction with Iran is “100% complete,” wrote President Trump in a Friday Truth Social post, adding that “most of the points are already negotiated.”
Magazine: Bitcoin may take 7 years to upgrade to post-quantum — BIP-360 co-author
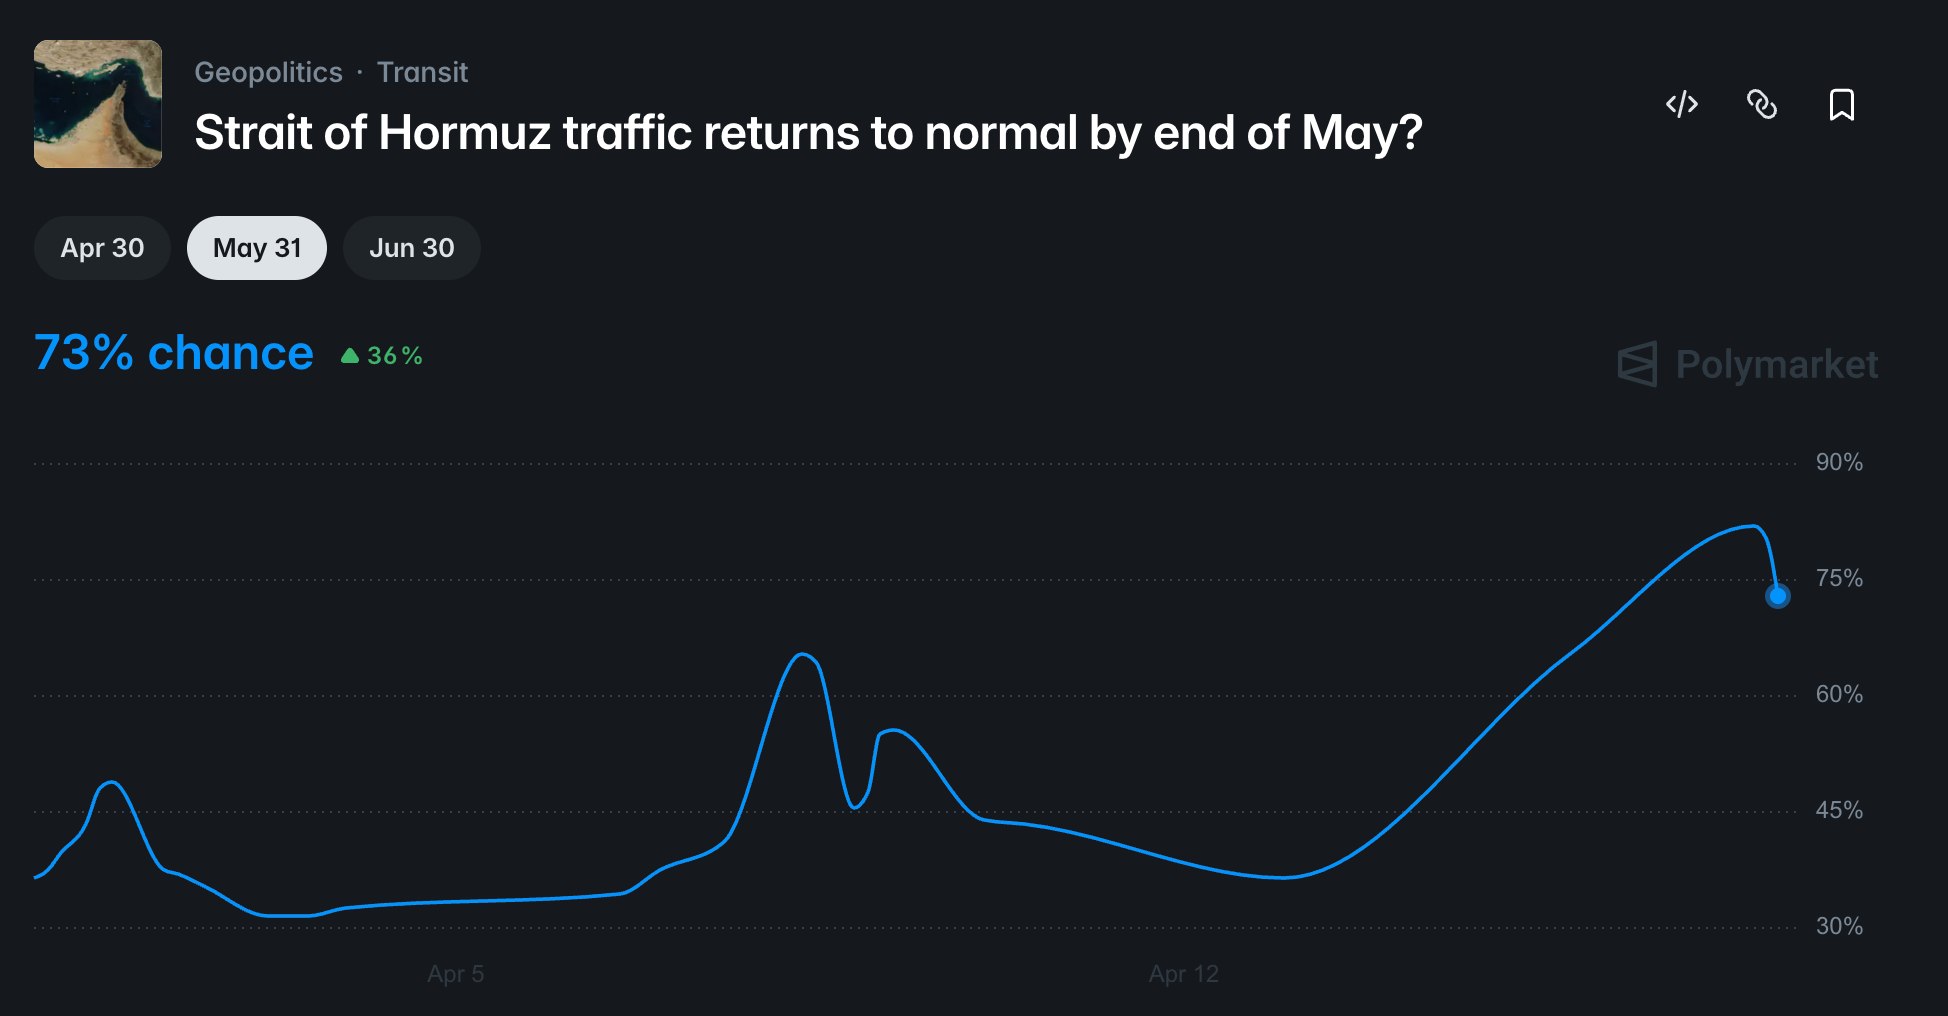
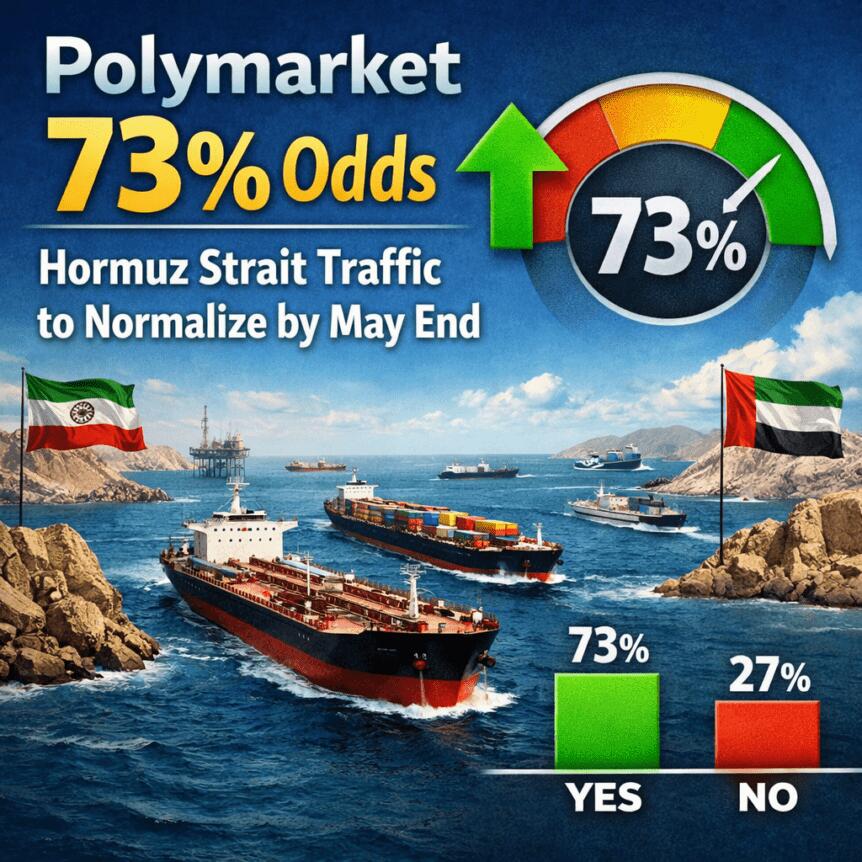
Polymarket prediction market odds of the Strait of Hormuz “returning to normal” by the end of May spiked to 73% on Friday, following news that Iranian officials have temporarily opened up the Strait of Hormuz as part of a ceasefire deal.
The odds climbed to a high of 82% on Friday, after Iranian Foreign Minister Seyed Abbas Araghchi announced that the Strait of Hormuz is open. Since that time, the odds have fallen back down to 73%. He said in an X post:
“The passage for all commercial vessels through the Strait of Hormuz is declared completely open for the remaining period of the ceasefire, on the coordinated route as already announced by the Ports and Maritime Organization of the Islamic Republic of Iran.”

However, traders on the platform placed the odds of the Strait returning to normal activity by the end of April at just 40%.
The war in Iran sent shockwaves through financial markets, impacting crypto and energy prices, as investors and financial analysts react to political developments in the ongoing conflict.
Related: Iran conflict hints Bitcoin’s addressable market could exceed gold: Bitwise
Bitcoin rises on the ceasefire news, but the truce is “fragile”
The price of Bitcoin (BTC) surged on Friday in response to the temporary reopening of the Strait under the ceasefire, briefly tapping $78,000 before climbing down to about $77,358, the price at the time of publication.

Crypto market analyst Nic Puckrin told Cointelegraph that the ceasefire between the US and Iran announced in April is “fragile” and that core issues remain unresolved.
The fallout from the conflict will likely cast a shadow over financial markets for most of 2026, pushing back any interest rate cuts to Q3 2026 at the earliest, if rate cuts materialize at all this year, Puckrin said.
“A ceasefire that results in the end of geopolitical tensions, a sustained drop in oil prices toward $80, and ideally also softer-than-expected economic data that calms stagflation fears” are all needed for BTC to reclaim the $90,000 level, he said.
US President Donald Trump said on Friday that the US naval blockade on Iran would “remain in full force and effect” until the “transaction with Iran is 100% complete.”
Magazine: Should users be allowed to bet on war and death in prediction markets?


Stanford’s 2026 AI Index shows the performance gap between US and Chinese AI models has compressed to just 2.7%, down from a double-digit lead as recently as 2023, as Anthropic’s Claude Opus 4.6 holds a 39-point Elo lead over ByteDance’s best-performing model on the benchmarks Stanford tracks.
Summary
- The 423-page report, released April 14, finds that the US and Chinese models have traded first place multiple times since early 2025, with DeepSeek-R1 briefly matching the top US model in February 2025 before being surpassed.
- The US leads China in private AI investment ($285.9 billion vs $12.4 billion) and notable model production (50 vs 30 in 2025), while China leads in AI publication volume, patent output, and industrial robot installations.
- The number of AI researchers entering the US has dropped 89% over seven years and 80% in the past year alone, a trend the report attributes in part to H-1B restrictions under the Trump administration.
Stanford’s 2026 AI Index, released April 14, documents the near-disappearance of the US performance advantage in artificial intelligence, with the top American model leading the best Chinese model by just 2.7% on the Arena Leaderboard benchmarks Stanford tracks as of March 2026.
The 423-page report from Stanford’s Institute for Human-Centered AI puts the specific figures starkly: in 2023, performance gaps between leading US and Chinese models ranged from 17.5 to 31.6 percentage points on major benchmarks including MMLU, MATH, and HumanEval. By the end of 2024, those gaps had collapsed to 0.3, 1.6, and 3.7 percentage points respectively. The current 2.7% Elo lead between Anthropic’s Claude Opus 4.6 and ByteDance’s Dola-Seed-2.0 Preview is narrow enough to flip on the next major release from either side.
The US advantage remains substantial in investment, infrastructure, and model production. American companies poured $285.9 billion into AI in 2025, 23.1 times China’s $12.4 billion private investment. The US produced 50 notable AI models in 2025 against China’s 30. The US hosts 5,427 data centers, more than ten times any other country.
High-impact patents, where quality of innovation matters more than volume, also favor the US. China leads globally in total patent output, filing 69.7% of all AI patents worldwide. But Stanford’s analysis distinguishes between patent volume and patent impact, and American researchers still produce more commercially influential intellectual property.
Where China Has Surged
China now produces 23.2% of all global AI publications and receives 20.6% of all global AI research citations, compared to 12.6% for the US. Chinese organizations installed 295,000 industrial robots in 2024, versus 34,200 in the United States, with China accounting for 51.1% of global industrial robot installations. The report notes that Chinese government guidance funds, estimated at $912 billion deployed across industries since 2000, mean that private investment figures substantially understate China’s total AI resource commitment.
South Korea has emerged as the world leader in innovation density, filing more AI patents per capita than any other country, introducing a third significant competitor into a rivalry previously framed as bilateral.
The Talent Warning
The report’s most alarming finding for US policymakers may be the talent data. The number of AI researchers entering the United States has dropped 89% over the past seven years, with an 80% decline in the past year alone. New H-1B visa restrictions that include a $100,000 employer fee per hire are cited as a contributing factor.
The Stanford data landed directly in the context of the ongoing US-China AI race that has driven the most significant infrastructure and semiconductor investments in the country’s history, including the NVIDIA Ising quantum AI models launched this week and the Terafab chip project. For AI tokens and the broader crypto-AI intersection, the convergence of the two countries’ capabilities matters: it removes the assumption that US systems have a durable lead and raises the competitive stakes on each new model release.


CFTC AI news came directly from Capitol Hill Thursday as Chairman Mike Selig told the House Agriculture Committee that artificial intelligence tools, specifically Microsoft’s Copilot, are filling surveillance and investigation gaps at an agency that has lost roughly 25% of its workforce since 2025, even as Congress prepares to hand it primary oversight of the US crypto market.
Summary
- Tools such as AI are going to be very helpful in surveilling and bringing the investigations, and we’re incorporating that into various workflows,” Selig told lawmakers, citing Copilot as one productivity tool across the agency.
- The CFTC currently operates with only Selig as its single sitting commissioner out of five required by law, with four seats vacant including both minority-party positions.
- Selig confirmed “numerous investigations ongoing” in prediction markets, where platforms like Polymarket and Kalshi have drawn scrutiny for well-timed trades tied to US military actions and government announcements.
CFTC AI news emerged from Thursday’s House Agriculture Committee oversight hearing as Chairman Mike Selig defended his agency’s shrinking headcount by pointing to productivity gains from AI tools, even as lawmakers pressed him on whether the CFTC has the resources to oversee both a rapidly growing crypto market and a prediction market sector that has ballooned into the billions of dollars in annual volume.
The agency has lost approximately 25% of its staff since 2025 under President Trump’s federal workforce reduction drive. Enforcement division staffing, at roughly 108 positions after a recent budget request for three new hires, is still 23% below the 140 enforcement employees on record in 2025. The CFTC currently operates with Selig as the sole sitting commissioner, with four of five legally required positions unfilled including both minority-party seats.
“Tools such as AI are going to be very helpful in surveilling and bringing the investigations, and we’re incorporating that into various workflows,” Selig told lawmakers. He specifically cited Microsoft’s Copilot as one productivity tool woven into agency workflows. When asked directly about the staff declines, Selig replied: “We are running more efficiently and effectively.”
The CFTC is simultaneously pursuing two expansions that would dramatically increase its regulatory footprint. First, the CLARITY Act, which is moving toward a Senate Banking Committee markup in late April, would designate the CFTC as the primary regulator of non-securities crypto trading, giving it oversight of Bitcoin, Ethereum, and every digital commodity that doesn’t meet the SEC’s securities definition. Second, the CFTC is asserting exclusive federal jurisdiction over prediction markets, a claim currently being contested in courts by multiple states.
Committee Chairman Glenn “GT” Thompson noted the contradiction. “We’re putting a lot on your plate with digital assets, and we’re obviously going down this path with prediction markets,” he told Selig, then asked him to request more staff if operational needs required it. Selig said “Absolutely” and reiterated that enforcement remains a “top priority.”
Prediction Market Investigations and Insider Trading
The prediction market scrutiny has been intense. Multiple members questioned Selig about trades on Polymarket, Kalshi, and other platforms in which small numbers of anonymous accounts appear to have made significant profits on bets tied to US military actions and government announcements, suggesting potential access to non-public information. Reports have identified roughly six Polymarket accounts that earned $1.2 million on correct bets about US Iran strikes placed hours before the February 28 action became public.
Selig said the agency has “numerous investigations ongoing” in prediction markets but declined to quantify or describe them, saying doing so could compromise active work. He described the regulated platforms as the “first line of defense” before the CFTC acts.
Ranking Member Angie Craig of Minnesota said flatly that the CFTC “cannot adequately oversee digital commodity trading and prediction markets” with current resources. She and Thompson announced plans to write to the White House urging bipartisan commissioner nominations. The single-commissioner structure has broader implications for the CLARITY Act rulemaking process: Selig indicated he would not wait for a full commission. “We cannot for the sake of the American people slow down our rulemaking,” he said, signaling he would advance major regulations alone if necessary, a position that could invite legal challenges to any rules adopted without bipartisan deliberation.
As the CFTC’s crypto role expands, Selig’s claim that AI can offset a quarter of the workforce will face a direct test once the CLARITY Act passes and the full weight of digital asset oversight lands on an agency that, by its own data, has 23% fewer enforcement officers than it needs.
Bitcoin Breaks Key Resistance After 16% Rally as Momentum Signals Trend Shift
George Russell addresses Max Verstappen’s retirement claims as he alleges 4x champion didn’t complain when he was winning

One Rumored Color for the iPhone 18 Pro? A Rich Dark Cherry Red

Why Israel is blocking foreign journalists from entering

Bitcoin: We’re Entering The Most Dangerous Phase

Alan Cumming Brands Baftas Ceremony A ‘Triggering S**tshow’

Live Crypto And Gold Scalping Trading | 16 April 2026 #cryptoscalping #xauusdlive

Miami King HATES Financial Freedom?! | ‘Take It Personal’ OUT NOW

Money Personality Tipe Kedua? #fyp #viral #viralvideo #shortsvideo #shorts #financial #keuangan
-
 NewsBeat5 days ago
Pep Guardiola and Gary Neville agree over Arsenal title problem that benefits Man City
-

 Crypto World4 days ago
The SEC Conditionalises DeFi Platforms to Be Avoided for Broker Registration
-

 Politics5 days ago
World Cup exit makes Italy enter crisis mode
-

 Crypto World4 days ago
SEC Signals Exemption for Crypto Interfaces From Broker Registration
-

 News Videos3 days ago
Secure crypto trading starts with an FIU-registered
-

 Sports16 hours ago
NWFL Suspends Two Players Over Post-Match Clash in Ado-Ekiti
-

 Crypto World4 days ago
SEC Proposes Certain Crypto Interfaces Don’t Need to Register as Brokers
-

 Business6 days ago
Ireland Fuel Protests Enter Day 5 as Blockades Spark Shortages and Government Prepares Support Package
-

 NewsBeat4 days ago
Trump and Pope Leo: Behind their disagreement over Iran war
-
 NewsBeat6 days ago
JD Vance announces ‘no agreement’ with Iran over nuclear weapons fear
-
Sports6 days ago
Dexter Lawrence, Stefon Diggs, Trading for De’Von Achane
-

 Crypto World5 days ago
Trump whales load up ahead of Mar-a-Lago luncheon.
-
Crypto World5 days ago
Sei Network Enters Quiet Reset Phase as On-Chain Metrics Signal a Slowdown in 2026
-

 Fashion7 hours ago
Weekend Open Thread: Theodora Dress
-
Business7 days ago
Coreweave CSO Venturo sells $5.5m in class a common stock
-

 Crypto World3 hours ago
Russia Pushes Bill to Criminalize Unregistered Crypto Services
-
Sports7 days ago
1st-Round WR Enters Vikings Mock Draft Orbit
-
Business5 days ago
Kering slides after Morgan Stanley downgrade, Gucci woes loom
-
 Entertainment4 days ago
Karol G’s ‘Ultra Raunchy’ Coachella Set Gave ‘Satanic Vibes’
-
 Business1 day ago
Creo Medical agree sale of its manufacturing operation
You must be logged in to post a comment Login