
Crypto World
Bitcoin stalls below key resistance as technical signals skew bearish

Bitcoin trades in a tight mid‑$60k range beneath stacked moving‑average resistance, with extreme fear and weak momentum keeping any breakout on a short leash.
Summary
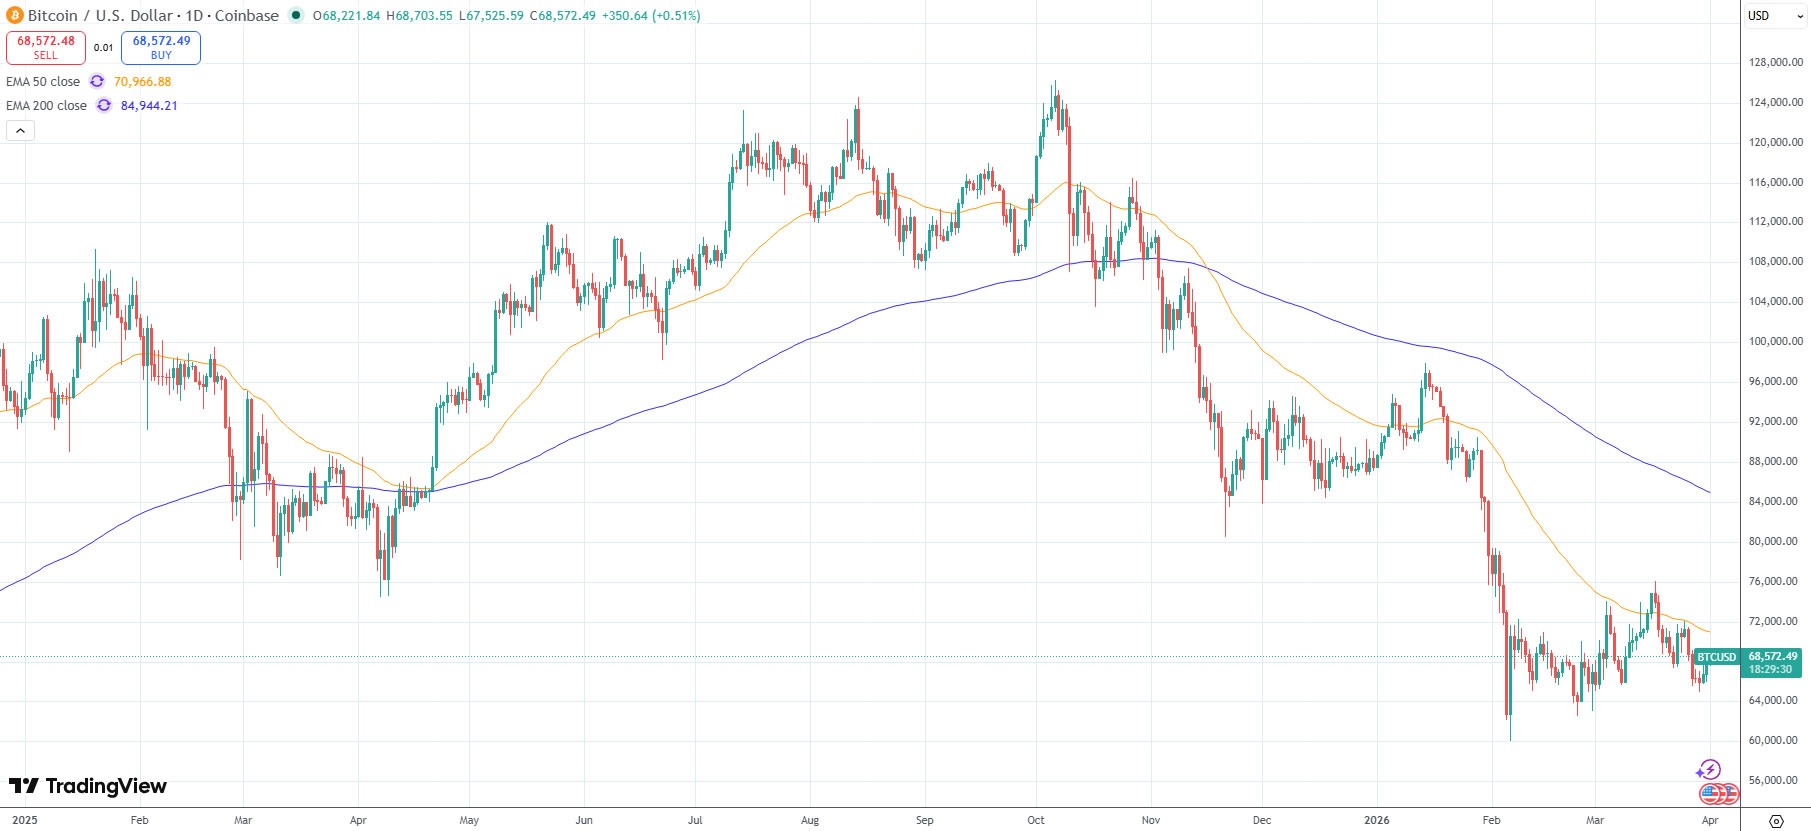
- Bitcoin trades in a tight $66,037–$68,130 range, capped by layered moving average resistance.
- All major EMAs and SMAs sit above spot, with the 200‑day EMA near $85,095 reinforcing downside pressure.
- Momentum gauges remain neutral to weak, as sentiment hovers in “extreme fear” territory across crypto markets.
Bitcoin (BTC) hovered around $66,597 on March 31, 2026, as the largest cryptocurrency by market value remained trapped in a narrow range and “technically constrained” beneath a wall of moving averages. The coin traded between $66,037 and $68,130 over 24 hours, leaving its $1.33 trillion market capitalization and roughly $48.8 billion in daily volume more indicative of indecision than conviction.
That backdrop contrasts with recent sessions where, according to Bloomberg, Bitcoin briefly climbed as much as 2.6% intraday to about $68,335 before paring gains below $68,000 alongside broader risk assets.
On the daily chart, BTC has rolled over from a lower high in the mid‑$70,000s into the mid‑$60,000 band, a shift that Bitcoin.com’s technical desk characterizes as a transition from a prior bullish structure into a “neutral‑to‑bearish posture.” Key resistance is clustered between $68,000 and $69,000, then $71,000–$73,000, while support rests at $65,000–$66,000, with a clean break below $64,000 likely signaling a broader structural breakdown. A similar pattern has played out in recent weeks, with International Business Times noting that Bitcoin “traded around $68,500… showing signs of consolidation” after rejecting near $71,000 and slipping back toward the mid‑$60,000s.
Intraday, lower‑timeframe charts show compression rather than trend. Four‑hour price action has shifted from a downtrend into sideways consolidation after setting a higher low around $65,000, but repeated failures just below the $68,000–$69,000 band underscore persistent seller presence. On the one‑hour chart, lower highs remain intact and a modest bounce off the $66,000 region “has failed to generate follow‑through,” highlighting fragile microstructure and a slight bearish tilt.
Oscillators corroborate that drift. The relative strength index sits near 42, the commodity channel index prints around −104, and the moving average convergence divergence line is negative by roughly 947 points, collectively signaling subdued momentum and an absence of a strong trend rather than outright capitulation. That aligns with broader market analytics, where research firm Intellectia points out that Bitcoin’s recent swings have come with 30‑day volatility above 3%, indicating a “choppy” environment where thinner liquidity amplifies modest flows.
The clearest signal comes from moving averages: every major exponential and simple moving average currently sits above spot price. Short‑term gauges such as the 10‑day EMA around $67,832 and the 10‑day SMA near $68,138 are capping rebounds, while the 50‑day EMA (~$71,005), 100‑day EMA (~$76,713) and 200‑day EMA (~$85,095) mark a stacked band of overhead resistance consistent with a broader bearish structure. Earlier this year, a similar dynamic prompted a “death cross” warning as the 50‑day and 200‑day weighted moving averages flipped lower, a pattern flagged in a prior crypto.news story on Bitcoin ETF‑driven selling.
Sentiment mirrors the technical strain. The Crypto Fear & Greed Index has spent much of the quarter in “extreme fear,” with readings as low as 18, according to on‑chain flow analysis by AInvest and data provider Alternative.me cited by CryptoRank. In that context, the near‑term path for BTC appears binary: Bitcoin.com’s technical team argues that “a sustained break and hold above the $68,000 to $69,000 resistance cluster” on rising volume would be needed to flip the narrative toward recovery, while a rejection followed by a decisive move under $65,000–$64,800 would likely confirm continuation toward the low‑$60,000 support zone.
In a previous crypto.news story on how moving averages can both signal and accelerate downside when price trades below all key bands, analysts warned that reclaiming at least one major EMA is often the first confirmation that distribution has run its course. For now, Bitcoin remains stuck beneath that threshold, with the burden of proof firmly on the bulls.

Bitcoin has declined by about 50% this market cycle, far less than in previous cycles, Fidelity Digital Assets said, adding this trend could continue over time.
Bitcoin’s post-all-time-high drawdowns have historically been steep, at about 80% to 90%, but this cycle has been about 50%, Fidelity Digital Assets research analyst Zack Wainwright said Tuesday.
One can see the “diminishing returns” that have developed from cycle to cycle when looking at Bitcoin’s price performance from the perspective of the previous all-time high, he said.
“Each cycle has been less dramatic to the upside than the previous,” he said. “Downside risk has been less dramatic in 2026, the current cycle, as well,” he added.
Bitcoin’s price hit its current cycle low of just over $60,000 on Feb. 6, a decline of 52% from its Oct. 6 all-time high of about $126,000, according to TradingView. It is currently down 46% from its peak six months ago.
The previous cycle saw a much larger decline of 77%, from the 2021 all-time high of $69,000 to a bear market low just below $16,000 in November 2022.
Bitcoin may bottom in late September
Fidelity’s assessment that this Bitcoin cycle is notably shallower than prior cycles “indicates a maturing market with reduced volatility and stronger institutional confidence,” Nick Ruck, director of LVRG Research, told Cointelegraph on Wednesday.
“This shift signals that Bitcoin is changing from a speculative asset toward a more stable store of value, potentially paving the way for greater adoption in the future.”
Related: Bitcoin’s $10K range expected to hold until spot traders show up: Data
Meanwhile, Alphractal founder Joao Wedson observed Tuesday that Bitcoin’s top occurred 534 days after the last halving, a shorter span than in the previous cycle.
This “decaying pattern” across cycles suggests the historical bottom may occur between 912 and 922 days after the halving, which “points to a bottom in late September or early October 2026,” he said.
BTC is below key daily moving averages
Bitcoin remains below the key 50-day and 200-day exponential moving averages, two long-term trend indicators.
It is hovering at the 200-week EMA, around $68,000, which has served as a key level of support during previous market downturns.

Magazine: Nobody knows if quantum secure cryptography will even work
Consumers browse Huawei phones in a shopping mall in Yantai, Shandong Province, China on March 8, 2026.
Cfoto | Future Publishing | Getty Images
Huawei’s push to develop its own artificial intelligence chip has yet to drive the double-digit revenue gains of its peers, as Chinese companies strive to narrow the gap with the U.S. on AI.
Cloud computing revenue from external customers fell by 3.5% in 2025 to 32.16 billion yuan ($4.6 billion), Huawei said. The company is the second-largest cloud provider in mainland China.
While overall cloud revenue including internal customers rose by 4.8% to 72.8 billion yuan, the main ICT infrastructure segment reported revenue growth that slowed to 2.6%, down from 4.9% in 2024.
That’s the segment that would include Huawei’s self-developed Ascend AI chip solutions, meant to rival Nvidia. Huawei’s total ICT revenue for 2025 was 375.01 billion yuan.
The U.S. has restricted Chinese companies’ access to the most advanced Nvidia chips, while Beijing has urged tech self sufficiency at home.

Huawei’s decline in cloud revenue to external customers comes as ByteDance has rapidly grown its AI cloud business in China in the last several months, albeit from a small base.
The TikTok owner is reportedly ramping up access to high-end Nvidia chips in a partnership deal with a planned Malaysia data center. ByteDance and Alibaba also plan to place orders of Huawei’s new AI chip, Reuters reported last week, citing sources. ByteDance declined to comment. The two other Chinese companies did not immediately respond to a CNBC request for comment.
U.S.-developed AI tools are generally considered the most capable in the world, although some Chinese models have shown an edge in video generation. Not all U.S. AI models are officially accessible in mainland China.
Huawei’s modest cloud growth figures come amid rapid industry expansion worldwide and slower economic growth in China.
Globally, spending on cloud infrastructure services rose by 29% in the fourth quarter in a sixth-straight quarter of market expansion of more than 20%, according to Omdia. The firm predicts 27% cloud growth in 2026.
Earlier this month, Alibaba, the largest cloud computing company by market share in mainland China, reported a 36% increase in segment revenue to 43.28 billion yuan in 2025. Tencent said increased cloud service revenues domestically and internationally helped drive a 22% year-on-year increase in business services revenue in 2025.
Local promotions this month in China for AI tool OpenClaw have also encouraged many locals to download the agent and pay for related cloud and AI model services. China’s consumer spending has remained tepid since the pandemic.
Consumer revenue slows
Subscribe now
Huawei smartphones ranked first in China last year by shipments, up by 1.7%, according to Counterpoint. But the Chinese company lost ground to Apple toward the end of 2025 after the iPhone 17’s release.
For 2025 overall, the telecommunication giant reported revenue of 880.9 billion yuan, up 2%, on net profit of 68 billion, up around 8% from a year ago.
The company spent a record 192.3 billion yuan in research and development, or 21.8% of revenue.
“In 2025, Huawei’s overall performance remained steady,” Sabrina Meng, Huawei’s rotating chairwoman, said in a brief statement, which also expressed gratitude to customers, partners and employees.
The intelligent automotive solutions unit saw revenue of 45.02 billion yuan, with growth slowing to 72% year-on-year, down from a whopping 474.4% in 2024, as the autos business captured an initial surge in electric vehicles. Huawei partners with several automobile manufacturers for in-car software and driver-assist technology.
Bitcoin held gains above $68,000 as investors leaned into news that the US and Iran were ideating ways to end the war. Will markets hold their newfound bullishness?
Bitcoin (BTC) briefly jumped to $68,589, and US stock markets rallied as investors reacted to US President Donald Trump’s statements on considering options for ending the US and Israel-Iran war. Separate, unconfirmed comments attributed to Iranian President Masoud Pezeshkian also suggested that Iran may be looking for ways to end the war.
On Tuesday, reporting from The Wall Street Journal said that President Trump told his aides that he could consider ending the war in Iran, with the Straight of Hormuz remaining partially closed, but an official statement has not been given.
Unconfirmed reports also suggest that Iran’s president is looking for a way to exit the conflict with certain assurances being made by the US and Israel. Regardless of the accuracy of the statements from either president, the DOW gained more than 1,125 points, while the S&P 500 and Nasdaq gained 2.91% and 3.83%, respectively.
Despite the strong performance seen across markets, Cointelegraph reported that crypto traders are skeptical of Bitcoin holding its current gains. Analysts suggested that a daily close above the 50-day moving average and $68,879 are key to establishing an early trend change and potentially clearing overhead short liquidity, which could trigger a liquidation-driven rally to $82,000.
Related: Bitcoin hits $68K but BTC futures, macro data show traders remain bearish
A lack of confidence is the current culprit
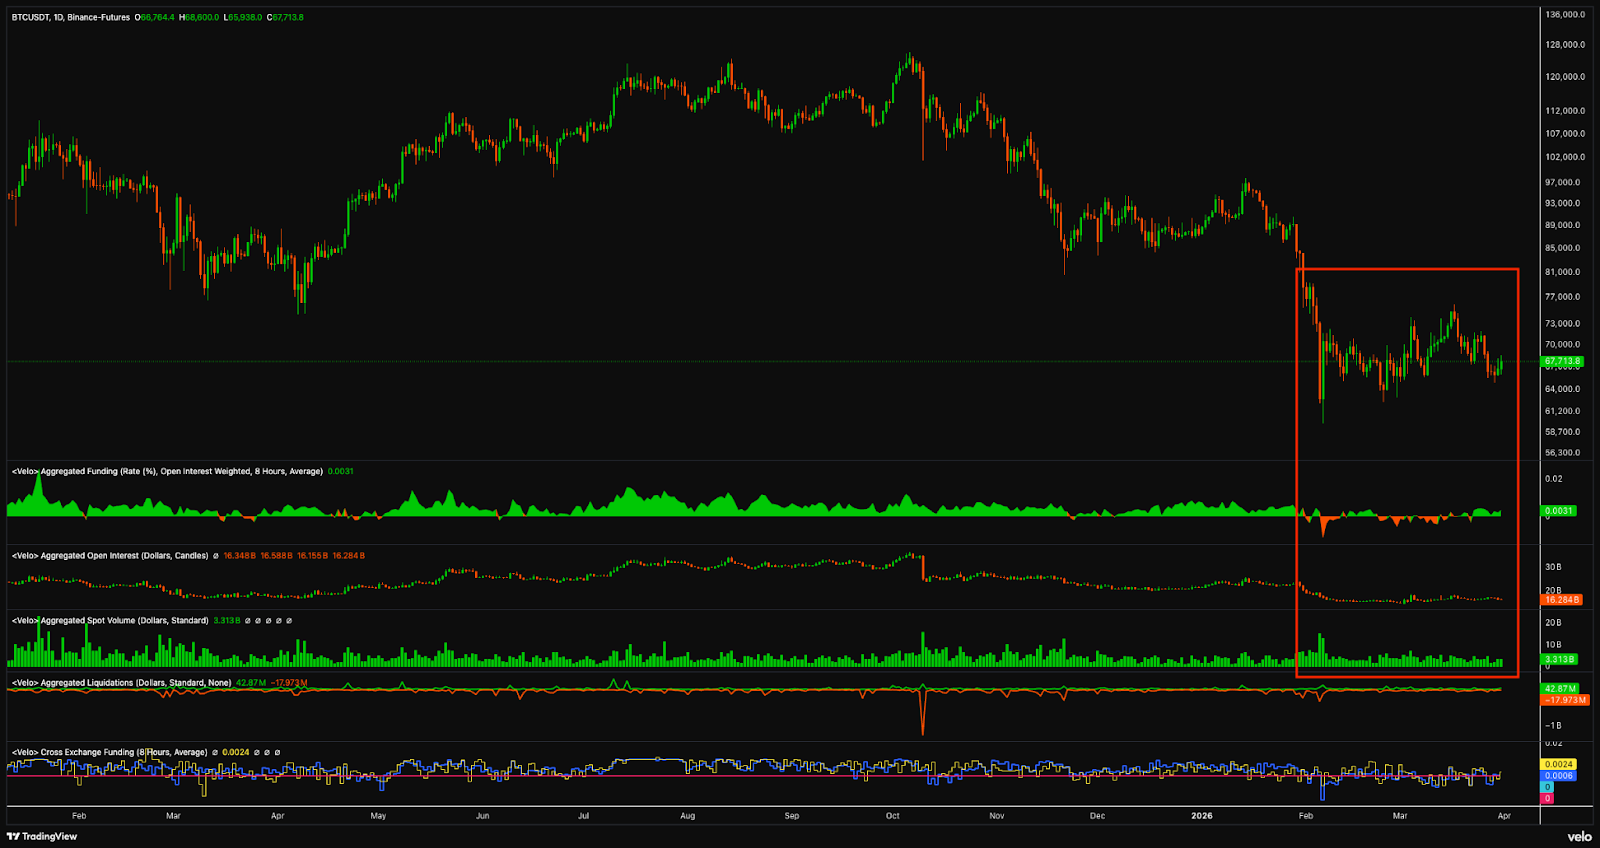
Beyond US macroeconomic conditions and the forecasted longer-term negative impact of the US and Israel-Iran war on energy, goods and services costs, the weakness of spot demand in the Bitcoin market continues to cap most price breakouts.
As shown in the chart below, open interest in the Bitcoin futures market, along with spot demand have remained relatively flat since the Feb. 6 sell-off below $60,000. This suggests that a majority of the price action is driven by news headlines, equities and perpetual futures markets, as the absence of investors making sustained directional bets in each market (futures and spot) leaves BTC price range-bound.

Earlier reporting from Cointelegraph also highlighted short-term traders holding positions below their cost basis ($85,800) and stablecoin inflows to crypto exchanges near a two-year low, further evidence that traders remain extremely cautious and are electing not to take strong directional bets in the market.
This article is produced in accordance with Cointelegraph’s Editorial Policy and is intended for informational purposes only. It does not constitute investment advice or recommendations. All investments and trades carry risk; readers are encouraged to conduct independent research before making any decisions. Cointelegraph makes no guarantees regarding the accuracy or completeness of the information presented, including forward-looking statements, and will not be liable for any loss or damage arising from reliance on this content.
Key takeaways:
-
Solana outperforms Ethereum in high-revenue DApps, providing a fundamental cushion against recent price drops.
-
Rising Ethereum Layer-2 dominance challenges SOL as traders monitor the critical $80 support level for a retest.
Solana’s native token, SOL (SOL), faced an 11% correction following a rejection at $93 on last Wednesday. SOL has lagged the broader cryptocurrency market over the past week, testing the $80 support on multiple occasions. Solana network fees have also declined over the past two months, leading traders to fear a potential retest of the $75 level.

The total value locked (TVL) on Solana stood at $6.3 billion, though the gap remains wide compared to Ethereum’s $54.1 billion. However, Solana amassed 80% more network fees than its main competitor over the last 30 days. This difference is largely due to Ethereum’s incentives for layer-2 rollups, which utilize temporary data blobs to lower costs.

Network fees on Solana dropped to $18.5 million in March, a 42% decrease from January’s $30 million level. Most of this decline stems from lower activity in decentralized exchange (DEX) volumes. Despite maintaining leadership in absolute terms, Solana DEX volumes plummeted to $55.5 billion, their lowest levels since September 2024, according to DefiLlama data.

In comparison, Ethereum DEX volumes totaled $41 billion in March, down 23% from two months prior. More importantly, when aggregating Ethereum layer-2 blockchains like Base, Arbitrum, Polygon, and Optimism, Ethereum’s DEX market share jumped to 42% in March from 33% in January. Solana’s dominance is gradually being challenged, which partially explains SOL’s current bearish momentum.
Solana DApps revenue could solidify SOL’s $80 support level
While DEX volumes on Solana are declining, no other network matches its number of DApps earning $1 million or more in 30 days. This data serves as a strong incentive for developers to join Solana, creating opportunities for user returns through protocols like Pump, Helium Network and ORE Protocol. Since protocol revenues drive investor attention, a healthy ecosystem remains extremely important for SOL’s upside.
Related: Solana lands Mastercard, Western Union on new dev platform

Solana leads the pack with 13 DApps ranking $1 million or more in revenue over the past 30 days. As a comparison, the runner-up Ethereum had 11 DApps, while BNB Chain and Base totaled 4 DApps each with $1 million or higher in monthly revenue. Thus, there is little evidence that the SOL price is bound to retest $75 solely because of lower network fees driven by weak DEX volumes.
DEX activity is a major driver of network fees, but the sustainability of protocols within the Solana ecosystem demonstrates that SOL is far from abandoned by investors.
This article is produced in accordance with Cointelegraph’s Editorial Policy and is intended for informational purposes only. It does not constitute investment advice or recommendations. All investments and trades carry risk; readers are encouraged to conduct independent research before making any decisions. Cointelegraph makes no guarantees regarding the accuracy or completeness of the information presented, including forward-looking statements, and will not be liable for any loss or damage arising from reliance on this content.
Bitfarms (BITF) shares climbed 6.6% on Tuesday despite reporting a widened $284.5 million net loss for 2025, driven by a decline in Bitcoin prices and a high cost of revenue, with the company advancing its pivot to AI and high-performance computing.
The company’s full-year results statement on Tuesday showed a 72% year-on-year increase in revenue to $229 million. This was outweighed by $248 million in cost of revenue, leading to a gross loss.
General and administrative expenses also increased year over year, while the change in fair value of digital assets led to a $50.5 million loss in 2025 compared with a gain of $26 million in 2024. This was partially offset by a $28.2 million realized gain on the sale of digital assets.
The results show the difficulty that some Bitcoin miners have faced in turning a profit. Bitcoin mining profitability margins have slimmed for miners as Bitcoin has fallen 46% from its high in October, while Bitcoin difficulty — a measure of how difficult it is to mine a block — has increased 58.5% since the last halving event in May 2024.
In the earnings call, Bitfarms CEO Ben Gagnon said it made the “bold decision to walk away” from its Bitcoin mining business in November and has built a new business powering HPC and AI data centers:
“No half-measures, no compromises, and in time, no Bitcoin. We built a new company,” he said, adding that Bitfarms expects to rebrand to Keel Infrastructure on Wednesday and has been given shareholder approval to move its legal base from Canada to the US.
The filing shows Bitfarms currently still holds approximately $161 million in unencumbered Bitcoin.
In the statement, Gagnon added: “Everything we built in 2025 — the sites, the team, the balance sheet — was in service of one thesis: that HPC/AI’s exponential growth requires top-tier infrastructure, and we intend to build to meet that demand.”
Related: MARA sells $1.1B in Bitcoin to buy back debt at 9% discount
BITF shares closed Tuesday trading hours up 6.64% to 2.73 Canadian dollars ($1.96), Google Finance data shows.

Bitfarms said its focus with HPC and AI is to power hyperscalers and neoclouds for the next wave of AI applications.
“We are not here to compete with hyperscalers or Neoclouds. We are here to enable them. Our focus is providing the critical and largely invisible foundation that will allow the world’s most advanced AI platforms to deploy on time and scale without interruption.”
It is in the process of advancing a 2.2 gigawatt digital infrastructure development pipeline across North America to deliver on that goal.
Bitfarms is one of several Bitcoin miners that have expanded or pivoted into AI in search of higher-margin opportunities in HPC and AI.
Iris Energy is scaling AI cloud services with Nvidia GPUs, while Cipher Mining has secured a long-term AI hosting deal with AI cloud platform Fluidstack. Riot Platforms and MARA Holdings have also expanded into AI and HPC.
Magazine: Bitcoin may face hard fork over any attempt to freeze Satoshi’s coins
A whitepaper co-authored with the Ethereum Foundation and Stanford researchers slashes qubit estimates by 20x, warns that billions in crypto assets are exposed to multiple attack vectors.


For months, XRP influencers on X and YouTube have been promising their followers that American Express (AmEx) was about to embrace XRP. The long–awaited announcement finally arrived on March 30.
Turns out, the NFL sponsorship deal with the credit card giant had nothing to do with XRP. Yesterday, AmEx became the Official Payments Partner of the NFL, i.e., for presale tickets, on-site experiences, and game perks.
Not a single mention of Ripple or its blockchain.
The hype had been building for months and reached a crescendo in the hours before the announcement.
The same false promise has resurged in viral waves for years.
A years-long pattern of recycled hype
XRP influencers have forecasted AmEx’s use of the XRP Ledger (XRPL) an embarrassing number of times.
Months and even years ago, influencers claimed it was “a done deal” with AmEx, attaching diagrams, conference videos, audio clips, and assortments of annotated screenshots.
In January 2025, a leader of the XRP Army told his followers that Garlinghouse had revealed a partnership with AmEx under a non-disclosure agreement.
In March 2025, another influencer posted that AmEx had confirmed manufacturing a crypto card with Ripple.
By July 2025, yet another XRP influencer cited an unattributed infographic claiming AmEx somehow uses XRPL.
On YouTube, dozens of videos promote the same false narrative. Creators repackaged old footage as breaking news.
What actually happened in 2017
The entire mythology traces back to one real event. In November 2017, AmEx and Ripple announced a pilot for cross-border business payments between the US and UK via RippleNet.
Critically, that pilot did not use the XRP coin. Ripple’s own executive told CNBC at the time, “The technology we have developed, it separated a connection from the cryptocurrency or the token.”
AmEx could use Ripple to exchange value from one fiat currency to another, he explained, “without the need for any intermediate blockchain currency.” Treacher added that XRP “will come into play later on in the evolutionary dynamics and the other players.”
Read more: Here’s why Ripple XRP partnerships and MoUs often go nowhere
It never did. AmEx never expanded the pilot, adopted XRP, or pursued any deal with Ripple beyond 2017. AmEx has never confirmed any new XRP deal, and the more recent viral claims have been labeled fake and misleading.
Still, the AmEx rumor gained its inception then, and XRP influencers kept recycling it for years.
The XRP engagement economy of nonexistent partnerships
XRP influencers have turned the gap between RippleNet partnerships and actual XRPL usage into a cottage industry.
The pattern is consistent. Influencers cite details about a years-old blockchain pilot, conflate RippleNet with XRP token usage, add ‘breaking’ or ‘just in’ or emergency siren emojis, and collect effortless engagement on social media.
Worse, some posts promoted unrelated tokens alongside the AmEx fiction. One Binance Square user bundled the fake announcement with a promotion for an unrelated token that would allegedly benefit from the non-existent AmEx-XRPL deal.
Protos has previously documented hundreds of Ripple partnership announcements that generated minimal usage of XRP, from MoneyGram to Bhutan’s central bank.
XRP is down 29% year to date. AmEx, meanwhile, is selling football tickets using regular dollars.
Got a tip? Send us an email securely via Protos Leaks. For more informed news, follow us on X, Bluesky, and Google News, or subscribe to our YouTube channel.


The “Memescope Monday” trading event flopped and has left traders with a bad case of the Monday blues after it failed to pull in the wins and highs of memecoins’ earlier days.
Last week, various memecoin traders built up hype for the event that would see a community of traders all buying and selling Pump Fun memecoins together in an attempt to boost trading volume and relive the trading days of 2024 and 2025.
One of the bigger voices calling for the event, a crypto influencer called Orangie, encouraged students to skip school and trade memecoins instead, before deleting the video.
The hype worked, and activity across Pump Fun increased, with the number of tokens created on Monday jumping by 83% in 24 hours, and Pump Fun’s daily volume increasing by 78% from the previous day.
However, the day saw more losses than wins, and now sentiment across crypto traders is poor, with users saying that “memecoins are over” and that Monday’s trading get-together was a “mass extraction event.”
Read more: Kash Patel ‘spiderkash’ leak triggers dozens of Solana memecoin scams
Crypto trader Scharo claimed that volume looked promising to begin with, but as soon as Orangie began his memescope stream and “got rinsed,” trading volume began to die.
Orangie shared that he lost over $3,000. His trading stream only lasted a couple of hours, and when he lost his earnings, he proceeded to play games on his PC instead.
Scharo claimed that “the moment [Orangie] stopped pushing, the trenches went quiet and retail disappeared.”
Scharo was also upset that neither Pump Fun nor its chief operating officer (COO), Alon Cohen, posted anything on the big day.
It’s unclear how involved Pump Fun was in the event’s creation, as the platform only made a single promotional post the night before.
Read more: Whoever’s running SBF’s X account keeps following memecoin shills
The crypto influencer RASMR noted that the third top trader on Monday, according to FOMO, only managed to make $12,000, with the second and top traders of the day making roughly $23,000 and $24,000.
He compared these trader profits to previous trader leaderboards where people would make over $500,000 on memecoins. As such, he claims the low wins show Memescope Monday was an “utter atrocious disaster” and how “dead everything is on-chain.”
Memescope Monday trader lost $90K to drainer
Other traders suffered losses outside their control, as one X account claimed that 1100 SOL (worth roughly $90,000) was stolen from them in a draining incident that took place during the event.
Thompsonrueul said, “I don’t know what to feel, and I don’t know what to do,” and pleaded for help from the crypto community. Their funds are reportedly still sitting in the thief’s wallet.
Read more: Burwick Law wants Pump Fun sanctions over harassment claims
Others noted that across the board, it was hard to make any profits on memecoins on Monday as more experienced, dedicated traders were able to quickly sell their tokens using the liquidity of newcomers.
Indeed, that seemed to put off the crypto influencer Gainzy, who said that it’ll mainly be traders quickly selling their tokens.
He said, “The people that make the most money on memes have the shortest hold time. They’re farming you, you’re exit liquidity, this should be very obvious.”
It was no surprise for most, as there was already a consensus before the event that it would be a perfect opportunity for pump-and-dumpers to make profits.
Memescope Monday only managed to move the price of Pump Fun’s token up by 4% yesterday. It has since fallen lower from this point and is now 81% down from its all-time-high last year.
Got a tip? Send us an email securely via Protos Leaks. For more informed news and investigations, follow us on X, Bluesky, and Google News, or subscribe to our YouTube channel.
The a16z-backed privacy chain goes live with private smart contracts, but warns users of known critical vulnerabilities as audits continue.
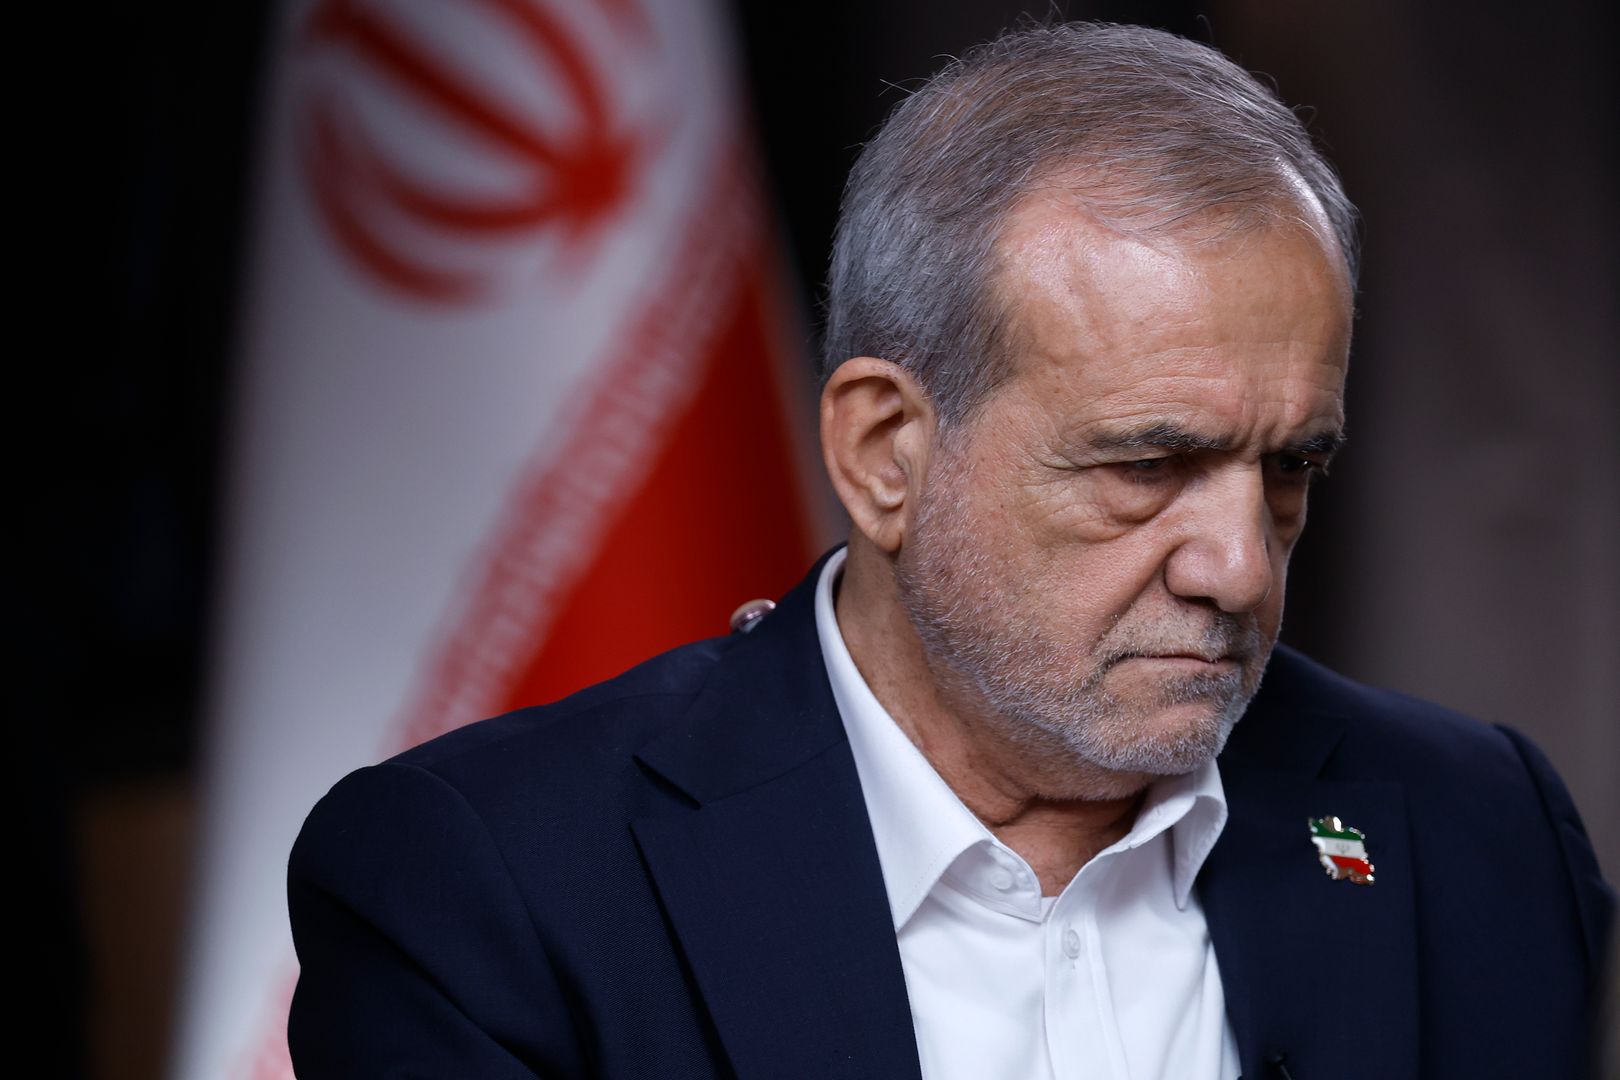

Bitcoin rose alongside U.S. stocks after Iran’s President Masoud Pezeshkian reportedly said the country would be prepared to end the conflict if it receives security guarantees.
The crypto asset was trading at $67,762, up nearly 2% over the past 24 hours. The Nasdaq about doubled its gain on the news, now higher by 3.1%. WTI crude oil, meanwhile, tumbled from just shy of $105 per barrel to $102.
Pezeshkian’s unconfirmed remarks are raising the prospect of a diplomatic off-ramp, easing fears of a wider conflict that could disrupt oil flows, fuel inflation and continue to rattle global markets.
Pete Hegseth Won’t Rule Out US Troops On The Ground In Iran

'Bas ho gaya': Pant ends Rana-Rathi feud ahead of LSG vs DC clash

OnePlus 15R vs OnePlus 15: Which is best?


![[S03:E42] Permainan dunia automotive China kotor? - Hezeri Samsuri, Careta](https://wordupnews.com/wp-content/uploads/2026/04/1775015969_hqdefault-80x80.jpg)
-
 NewsBeat7 days ago
Manchester United reach agreement with Casemiro over contract clause amid transfer speculation
-

 News Videos6 days ago
Parliament publishes latest register of MPs’ financial interests
-
 Tech6 days ago
Intercom’s new post-trained Fin Apex 1.0 beats GPT-5.4 and Claude Sonnet 4.6 at customer service resolutions
-

 NewsBeat4 days ago
The Story hosts event on Durham’s historic registers
-

 Sports4 days ago
Sweet Sixteen Game Thread: Tide vs Michigan
-

 Business5 days ago
Instagram, YouTube Found Responsible for Teen’s Mental Health Struggle in Historic Ruling
-
 NewsBeat7 days ago
Tesco is selling new Cadbury Dairy Milk bar and people can’t wait to try it
-
 Entertainment3 days ago
Lana Del Rey Celebrates Her Husband’s 51st Birthday In New Post
-
Entertainment2 days ago
Fans slam 'heartbreaking' Barbie Dream Fest convention debacle with 'cardboard cutout' experience
-
Crypto World19 hours ago
Dems press CFTC, ethics board on prediction-market insider trades
-

 Sports15 hours ago
Tallest college basketball player ever, standing at 7-foot-9, entering transfer portal
-
 Fashion7 days ago
How to Style Spring Like WeWoreWhat: Easy Outfit Ideas for 2026
-

 Sports7 days ago
Football: France arrive in Boston to face Brazil and Colombia in friendlies – Sports
-

 Entertainment6 days ago
HBO’s Harry Potter Series Will Definitely Fail For One Big Reason, And It’s Not J.K. Rowling Or Snape
-

 Crypto World1 day ago
U.S. rule change may open trillions in 401(k) funds to crypto
-

 Fashion6 days ago
En Vogue in Brown Leather and Tailored Neutrals by Atelier Savoir, Styled by J Bolin
-

 Tech2 days ago
The Pixel 10a doesn’t have a camera bump, and it’s great
-

 Fashion6 days ago
What Are Your Favorite T-Shirts for the Weekend?
-

 Fashion5 days ago
Weekly News Update, 3.27.26 – Corporette.com
-

 Sports1 day ago
Women’s hockey camp eyes fitness boost, tactics ahead of WC 2026 campaign | Other Sports News
You must be logged in to post a comment Login