
Crypto World
Bitcoin tops $64K as improving risk sentiment boosts crypto market recovery



Key takeaways
- Bitcoin (BTC), Ethereum (ETH), and XRP extended their recovery as geopolitical concerns eased.
- Market sentiment improved after US President Donald Trump said Iran had reached out to discuss a potential agreement.
- Bitcoin has surpassed the key $64,000 resistance level, with a breakout potentially strengthening the short-term outlook.
Bitcoin (BTC) extended its recovery on Friday, climbing above the $64,000 level as improving investor sentiment supported a broader rebound across the cryptocurrency market.
The recovery comes after geopolitical concerns eased following comments from US President Donald Trump, who said Iran had contacted the United States to discuss a potential agreement.
The remarks fueled hopes of reduced tensions in the Middle East, encouraging investors to return to risk assets.
The positive sentiment also helped Ethereum (ETH) edge closer to $1,800, while XRP stabilized after finding support near key technical levels.
Improving risk appetite supports Bitcoin recovery
Cryptocurrency markets gained ground as fears surrounding the recent escalation in the Middle East began to subside.
Investor confidence improved after Trump indicated that Iran had initiated contact with the United States regarding possible negotiations, raising expectations that diplomatic efforts could help prevent further conflict.
The shift in market sentiment prompted renewed buying across digital assets, allowing Bitcoin to recover toward an important technical resistance zone.
Bitcoin price analysis: Bulls target higher resistance levels
Bitcoin was trading around $64,300 at the time of writing, placing it just below the significant $65,000 resistance area.
Although the recent rebound has strengthened short-term momentum, BTC remains below several key trend indicators, suggesting the broader market structure has yet to turn decisively bullish.
Bitcoin continues to trade beneath the 50-day Exponential Moving Average (EMA) at $65,399, the 100-day EMA ($68,991), and the 200-day EMA ($75,024)
These moving averages form a strong overhead resistance zone that bulls must overcome before confirming a broader trend reversal.
Technical indicators suggest buying momentum is slowly returning. The Relative Strength Index (RSI) has moved above the neutral 50 level, indicating strengthening bullish momentum after weeks of weakness.
Meanwhile, the Moving Average Convergence Divergence (MACD) remains in positive territory, with the MACD line holding above zero and the histogram continuing to expand, signaling that upward momentum is gradually building.
While these indicators favor buyers in the short term, they have yet to invalidate the broader bearish structure.
The first major resistance for Bitcoin sits near the $64,686 horizontal level. A decisive daily close above this area would bring the 50-day EMA at $65,399 into focus.
If buyers clear that hurdle, attention could shift toward the 100-day EMA at $68,991, followed by the 200-day EMA at $75,024.
Beyond those levels, the next significant long-term resistance lies around $84,410.
On the downside, Bitcoin lacks a strong nearby technical support zone, making the market vulnerable to renewed selling pressure if the current recovery loses momentum.

In that scenario, traders will likely look to the $60,000 psychological level as the next major area where buying interest could emerge.
For now, improving geopolitical sentiment has provided Bitcoin with short-term support, but bulls will need to reclaim $64,000 and overcome the cluster of moving average resistance to strengthen the case for a sustained recovery.

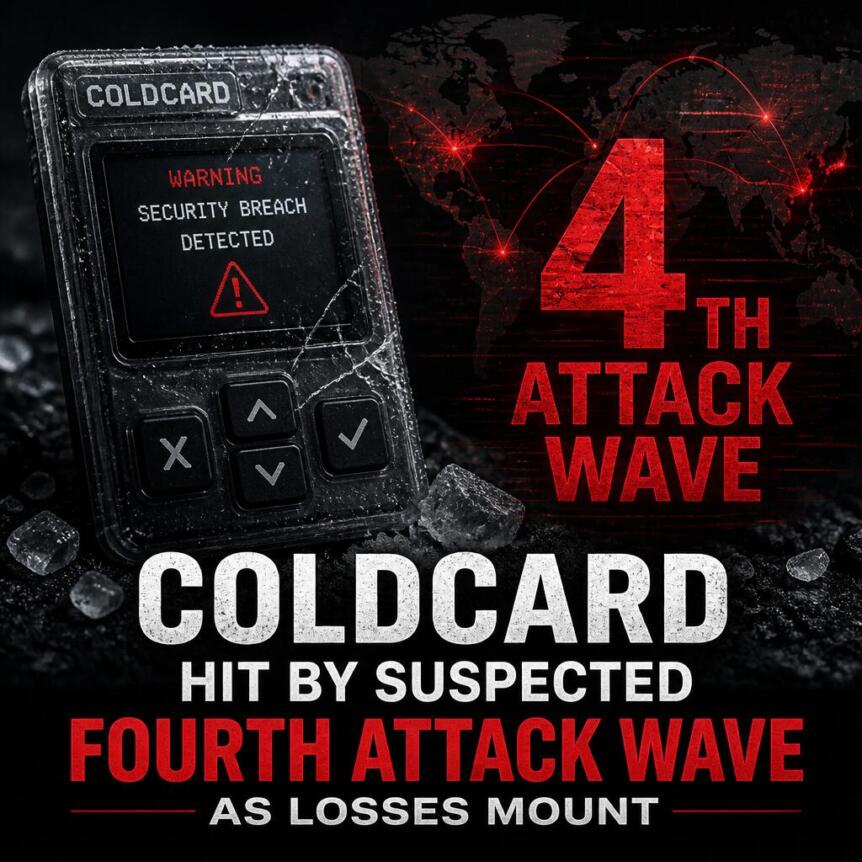
Galaxy Research head Alex Thorn has hinted that Coldcard was hit by a fourth wave of attacks on August 3, estimating that the attackers moved 448.7 BTC from 709 wallets belonging to victims.
Thorn based his findings on blockchain analysis rather than device records, describing the addresses as “likely Coldcard victims.”
A Fourth Wave?
Thorn described the addresses hit by the suspected attack as “likely Coldcard victims,” adding that the unspent outputs and transactions matched the vulnerable wallet pattern. Galaxy’s initial snapshot covered blocks 960,778 through 960,792, identifying 218 transactions involving 388.9 BTC and 462 potential victim addresses. The updated estimate expanded the figures to hundreds of transactions involving 448.7 BTC and 709 potential victim addresses.
Thorn posted the findings on X:
“LIKELY 4TH ORGANIZED WAVE COLDCARD ATTACK OCCURING RIGHT NOW THERE ARE STILL SIMILAR TXS IN THE MEMPOOL WAITING TO BE CONFIRMED AND THE PREVIOUSLY-CONFIRMED TXS SIGNAL RBF OPT-IN, CHECK YOUR FUNDS, AND YOU MAY BE ABLE TO RBF YOUR WAY OUT OF THIS.”
According to Thorn, Galaxy measured 13.8 sweeps per block, a 45x increase compared to 0.3 sweeps per block measured during a pre-incident control period. The siphoned funds were sent to a new address instead of a shared wallet. Some of the stolen funds were subsequently moved to new addresses, making them difficult to track.
Previous Waves
Galaxy has already mapped three prior waves that siphoned 1,367.05 BTC from 4,585 addresses, with the first wave targeting 1,082.05 BTC across 1,196 addresses. The latest wave brings the total figures to 1,815.75 BTC across 5,294 addresses. However, the figures are yet to be confirmed by authorities, Coinkite, or the wallet owners. Additionally, it isn’t clear whether one entity was responsible for all four waves.
Thorn also added that there were transactions awaiting approval in Bitcoin’s mempool, giving holders an escape route. According to Thorn, Bitcoin Core documentation states that unconfirmed opt-in Replace-by-fee transactions can be replaced. This means a user still in control of an affected key could broadcast a conflicting transaction with a higher fee and send the funds to a secure wallet. However, it cannot be replaced once it enters the block, and a replacement is not guaranteed to succeed.
Coldcard Users Must Generate New Seeds
The ongoing issue arises from an RNG integration error that occurred during a March 2021 firmware change. Coinkite estimates that the affected Mk2 and Mk3 seeds have around 40 bits of effective entropy, while seeds generated on affected Mk4, Mk5, and Q releases have 72 bits instead of 128.
Additionally, an engineering team from Block discovered that the firmware called a deterministic MicroPython fallback instead of the hardware random-number generator. However, the Block team clarified they could not confirm exploitability without full empirical testing.
Meanwhile, Coinkite has released version 4.2.0 for Mk2 and Mk3, 5.6.0 for Mk4 and Mk5, 1.5.0Q for Q, and 6.6.0X or 6.6.0QX for Edge releases. However, simply updating the existing firmware does not fully address the vulnerability. Once updated, users must generate a new seed and verify the receiving address. Once verified, they must send a test transaction before migrating the complete balance.
Coinkite also clarified that seeds created using a minimum of 50 fair, private dice rolls are not considered at risk, and that a unique BIP-39 passphrase could serve as a second line of defense. However, it recommended that users complete the migration. The advisory does not cover TAPSIGNER, OPENDIME, and SATSCARD because they use separate codebases.
Disclaimer: This article is provided for informational purposes only. It is not offered or intended to be used as legal, tax, investment, financial, or other advice.
Crypto World
Greece Battles Raging Wildfires After Collision Between Firefighting Helicopters Kills Two

Ursula von der Leyen, president of the European Commission, also remembered the contributions of the fallen.
“It takes a special courage to fly towards the flames so that others can be safe. As we continue to battle these fires side by side, Europe grieves with Greece and Denmark,” she said.
Widespread wildfires devastate Europe
Wildfires have swept across regions in France, with President Emmanuel Macron describing the situation as “the toughest since the Second World War.”
Elsewhere in western Europe, an emergency incident was declared in Suffolk, England, last week as firefighters tackled a blaze the size of at least 210 soccer pitches.
Much of Europe is in the midst of yet another heat wave, further compounding the issue and raising concerns that even contained fires may gather pace once more.

Crypto investor Arthur Hayes warned on August 3 that markets should watch this week’s Federal Reserve H.4.1 release for signs that Japan used US Treasury holdings as collateral to obtain dollars during recent yen intervention efforts.
The move has raised questions about how central banks may manage currency pressure without disrupting bond markets, with potential effects on global liquidity and risk assets like Bitcoin (BTC).
Watching the Fed’s Balance Sheet
The H.4.1 report publishes weekly details on the Fed’s balance sheet, including any repo activity with foreign central banks, which is why Hayes pointed traders there for confirmation.
His post followed last Friday’s coordinated currency action, which Treasury Secretary Scott Bessent said had been taken to counter “disorderly yen movements,” and that his department is still in close contact with the BOJ and Japan’s Ministry of Finance and “will not hesitate to participate in further joint intervention.” He also called for the FIMA repo facility, which lets foreign central banks borrow against Treasury holdings, to be expanded in the coming months.
“If Bessent can get the counterparty limit increased then the Fed can create money using MOF TSY as collateral,” Hayes wrote in response.
The H.4.1 publication adds to a list of macro events already on the radar of traders, including Friday’s Nonfarm Payrolls report and this week’s ISM Manufacturing PMI.
Bitcoin advocate Adam Livingston called the US-Japan action “one of the funniest pieces of elite macroeconomic theater,” pointing out how the Asian economic giant had spent years pinning rates low, monetizing debt, and turning its fiat currency into a funding source for global carry trades. Now it has weakened, with Washington describing it as “substantially undervalued.”
The crypto author noted that Japan needs dollars to defend the yen, and it holds a large stock of US Treasuries, which, if sold, could push American yields higher and raise US financing costs as well as tighten liquidity. However, a bigger FIMA facility allows Japan to borrow dollars against those Treasuries instead of dumping them onto the market.
The crypto community has been watching the yen issue because Japan’s low-rate environment supported the yen carry trade for years. Investors borrowed the currency cheaply and placed money into higher-yielding assets, like stocks and cryptocurrencies. Last week, analyst EGRAG CRYPTO warned that a fast unwind of such carry trade-funded positions could force selling across risk assets, including BTC, if the yen strengthens too quickly.
Where Crypto Stands This Week
At the time of writing, the global cryptocurrency market cap was holding near $2.2 trillion after a slight 0.8% dip in 24 hours. BTC was trading closer to $63,000 than $62,000, down about 1% on the day and over 4% across one week. Meanwhile, Ethereum (ETH) sat near $1,800, about 6% from where it was a week ago.
Analyst Daan Crypto Trades observed that Bitcoin and the broader crypto market have underperformed the recent bounce in tech stocks. He attributed the pattern to a liquidity rotation where speculation returns more readily to equities once they recover, leaving crypto lagging unless stocks move sideways for a stretch.
The post Here’s Why Crypto Traders Need to Watch the Fed’s H.4.1 Report This Week appeared first on CryptoPotato.
Cardano’s native token is among the best-performing cryptocurrencies (from the top 10 club) over the past week.
Its renewed momentum has naturally drawn more attention, with some market observers now projecting further gains.
The Rally Goes on?
ADA experienced a sudden and rather unexpected revival this weekend, rising to a monthly peak of around $0.19. As of this writing, it trades just south of that mark, representing a 13% increase on a seven-day scale.
The most probable catalyst for the upswing seems to be the accumulation from whales, with Ali Martinez revealing that these big investors have purchased more than 240 million tokens in just five days.
Meanwhile, X user JAVON MARKS believes that ADA’s recent performance resembles that of 2020-2021, which was followed by a massive bull run towards an ATH. That said, the analyst set a target of $2.90, which is currently 1,300% away.
Leon Voss Official also chipped in, claiming that ADA has broken above a long-term descending trendline that had acted as persistent resistance.
“Daily candle comes on stronger side and now obvious touch the support for further confirmation to hold above $0.17. That’s connected to Cardano TVL surge by some +9% over the past week, reclaiming a level of nearly $68 million,” the X user added.
For their part, Crypto Tony said they will look for a short position upon a potential rejection of the recent rally or go long if the price flips the $0.22 zone.
Entering a Dangerous Territory
ADA’s pump is more than evident, yet one should keep in mind the unfavorable condition of the broader crypto market, meaning the bears can regain control at any time and quickly erase the gains.
The Relative Strength Index (RSI) should serve as another warning. Its ratio briefly spiked above 80, easing back to 65, which still keeps it hovering near overbought territory and signals a potential short-term correction.

The post Cardano (ADA) Could Explode to Almost $3 if History Repeats: Analyst appeared first on CryptoPotato.

A Contemporary Services Corporation (CSC) now hiring flyer is displayed for job opportunities as an event security guard at an Inspire Together job and resource fair in Los Angeles, California on July 29, 2026.
Patrick T. Fallon | Afp | Getty Images
The Bureau of Labor Statistics is set to release the employment picture for July on Friday, and economists are expecting a gain of 85,000 jobs in the month, according to Dow Jones consensus estimates.
However, traders on prediction market platform Kalshi think those figures may come in lower.
Speculators place just a 47% chance that employers added more than 80,000 jobs in July, but they also give a 60% chance that they added more than 70,000 jobs in the month.
The contracts on the platform ask traders what the jobs number will be for July, asking if the official figure will be above a series of numbers. Contracts are resolved using the official data from the Bureau of Labor Statistics.
A beat compared with consensus estimates isn’t out of the question, even if not likely: traders place a 41% chance employers added 90,000 jobs in July, and just over a one-in-three chance that the number will come in at six figures.
However, traders also think there’s a one-in-three chance the number will come in below 60,000.
Last month, Kalshi traders placed a 63% chance that employers added more than 125,000 jobs in June, above consensus estimates for 115,000. However, the official figure came in much lower, at just 57,000 jobs added.
Disclosure: CNBC and Kalshi have a commercial relationship that includes customer acquisition and a minority investment.

Fake World Assets (FWAs) have reignited attention on Ethereum’s onchain “gacha” niche—an NFT-based system where users pay to spin for randomly selected collectibles. In just days after launch, the protocol reportedly became a top Ethereum gas consumer by fees, underscoring how quickly gamified mechanics can draw speculative participation.
According to DeFiLlama, FWAs briefly ranked as Ethereum’s largest gas consumer over a 24-hour window in late July, with peak daily fees of about $1.53 million on July 25. The project’s token incentive program and the broader appeal of lottery-like gameplay helped drive rapid traction, though skepticism from some market participants suggests much of the current demand may be incentive-driven.
Key takeaways
- Ethereum activity spiked fast: DeFiLlama data shows FWAs briefly became one of Ethereum’s biggest fee consumers by blockspace usage within days of launch.
- Strong early liquidity metrics: Total value locked (TVL) reportedly climbed above $6.15 million by July 31, indicating more than a purely ephemeral burst of interest.
- Fees have normalized after the initial frenzy: Fee revenue eased to roughly $350,000 per day by the latest figures cited in the reporting.
- Demand may be tied to incentives: Investor Simon Dedic argues current participation could be largely fueled by token rewards rather than sustained end-user desire.
- The core bet is on retention: The “real test” for onchain gacha, as framed by critics, will come once incentives fade and novelty wears off.
FWAs surge: from launch to Ethereum gas leader
FWAs are built around an onchain lottery mechanic that trades random NFT outcomes for player participation. Within four days of launch, the protocol reportedly consumed enough Ethereum gas to briefly top the chain’s gas usage rankings by fees over a 24-hour period, according to DeFiLlama.
At the height of the early activity—July 25—FWAs generated about $1.53 million in daily fees, briefly overtaking major stablecoin issuers’ associated onchain activity in the same fee-consumption comparisons. The project’s creators, TokenWorks, publicly celebrated the protocol’s rapid arrival, posting that it had reached a major milestone just days after launch.
While growth appears to have slowed from the peak, the scale remains notable. TVL reportedly rose to more than $6.15 million by July 31. Fee revenue was cited as easing to around $350,000 per day, which implies an annualized run rate of roughly $268 million based on the figures referenced.
How the onchain gacha works
At its core, Fake World Assets uses NFTs as the prize pool. Users pay to interact with an onchain “gacha” machine that selects a randomly chosen NFT backed by Ether. Instead of purchasing a specific NFT directly, participants buy the right to spin and potentially receive one of many collectibles.
TokenWorks has positioned FWAs as part of the broader onchain gacha evolution. The system is described as “latest” within Ethereum-based protocol experiments that apply randomness and game-like purchasing behavior to tokenized collectibles. The prize catalog, as reported, draws from multiple recognizable collections, including CryptoPunks, Azuki, Lil Pudgys, and Art Blocks.
Those who hold NFTs can also participate in the protocol differently: NFT holders are described as liquidity providers who deposit collectibles alongside ETH and receive a share of protocol fees while their NFT remains in the pool. Players, meanwhile, purchase spins for the chance to receive a random NFT and then decide whether to keep the prize or redeem most of its attached ETH value.
Blockworks Research is referenced in the source reporting for an additional detail: around 70% of purchasers allegedly choose to convert their winnings to FWA rather than keeping the received asset, suggesting the system is currently functioning as much like an ETH-linked bet as it is a pure collectible acquisition.
Supporters see gamified commerce; critics worry about incentives
Not everyone is convinced that FWAs represent durable demand. Simon Dedic, founder of Moonrock Capital and an early backer of onchain collectible platforms, expressed enthusiasm for gamified commerce while singling out specific concerns about FWA’s current appeal.
Dedic’s skepticism centers on whether participation reflects genuine consumer interest or is mainly driven by token incentives. In the remarks cited, he characterized the activity as targeted at “crypto degens” seeking to gamble and speculate—an important distinction because incentive-led engagement can diminish quickly once rewards decline.
Other participants and commentators in the reporting highlight the novelty of the combined roles inside the mechanism. The protocol blends player behavior (seeking a favorable random outcome) with “house” behavior (earning fees as an NFT liquidity provider), which some see as a more engaging primitive than simple onchain lotteries or typical NFT marketplaces.
Still, the source framing makes clear that the sustainability question is unresolved. Dedic argues that the industry may be moving toward more gamified shopping behavior as Gen Z’s purchasing power grows, but he also notes a preference for selling assets people actually want—such as widely demanded collectibles—rather than forcing interest through rewards for assets that have little independent pull.
The retention test: novelty vs. real utility
Even if FWAs can keep drawing transaction volume, the long-term question is whether the protocol can continue without strong incentive support. The early numbers—high peak fees, rising TVL, and significant early volume and purchase counts mentioned in the source—suggest there is real attention and a willingness to pay for the mechanic.
However, “hype” can be measured in weeks, not months. If users continue spinning even after incentives taper off, that would indicate the system has found something closer to a retail use case. If activity drops sharply once token rewards lessen, FWAs may follow the pattern of other short-lived crypto experiments that attract bursts of attention but fail to convert them into durable user demand.
What makes the outcome particularly relevant for the broader market is that onchain gacha is part of a wider trend: tokenized versions of familiar collectibles and randomized purchase mechanics. If FWAs demonstrate sustained retention, they could strengthen the case that gamified retail primitives can coexist with token liquidity models. If they fail, it may reinforce the view that the current wave is mostly speculation riding on incentives.
For now, readers should watch how fee generation and participation evolve as token incentives change, and whether a majority of users keep engaging for the collectible mechanic itself rather than primarily for conversion to incentive-linked rewards.


Circle has acquired nearly 1,000 blockchain patents from IBM, giving the USDC issuer what it describes as the largest blockchain patent portfolio in the United States.
Summary
- Circle acquired nearly 1,000 issued patents spanning more than 680 patent families.
- The portfolio covers blockchain, banking, insurance, cloud security, and enterprise infrastructure.
- Circle has not disclosed the purchase price or explained whether it could enforce the patents against competitors.
- CRCL initially gained about 2%, but later fell after Morgan Stanley cut its target to $38.
Circle takes control of IBM’s blockchain portfolio
Circle announced the acquisition on July 27, saying it had purchased core assets from IBM’s blockchain patent portfolio. The transaction covers more than 680 patent families and nearly 1,000 issued patents worldwide.
The intellectual property spans blockchain systems, financial services, banking, insurance, supply-chain verification, enterprise infrastructure, and secure cloud operations. Circle did not disclose the financial terms.
Circle said the portfolio would support USDC, the Circle Payments Network, its Arc blockchain, and tools designed for artificial intelligence agents. The two companies also plan to consider further commercial agreements.
“Intellectual property is critical to advancing our mission and expanding adoption of onchain infrastructure,” Circle General Counsel Sarah Wilson said.
Wilson added that the acquisition would expand Circle’s ability to develop infrastructure for internet-based finance.
Patent deal raises concerns over possible enforcement
Circle’s announcement did not state whether the company intends to license the patents, use them defensively, or enforce them against other blockchain businesses.
That lack of detail has prompted questions about how Circle could use its newly acquired intellectual property. In an Aug. 3 commentary, Fortune’s Jeff John Roberts warned that the patents could become legal leverage against competitors or startups.
Roberts argued that Circle could theoretically seek licensing payments, bring infringement cases, or transfer patents to separate entities that pursue enforcement. However, Circle has not announced plans to take any of those actions.
The concerns also stem from IBM’s mixed record in commercial blockchain development. IBM previously backed several enterprise blockchain projects, including supply-chain and trade-finance platforms, but many failed to achieve broad adoption.
A large patent portfolio does not necessarily indicate that the underlying products reached commercial success. Still, issued US patents can give their owner the right to restrict others from using covered inventions, subject to their validity and scope.
Circle has also not announced a public defensive patent pledge comparable to commitments used by some other digital-asset companies. Such pledges generally promise that patents will not be used offensively against developers acting in good faith.
US blockchain firms face new intellectual property risk
Circle’s position as the largest US holder of blockchain-related patents could affect companies building stablecoin, payments, interoperability, and enterprise ledger products.
The practical impact will depend on the language of individual patent claims and whether Circle chooses to enforce them. Any infringement dispute would also face review in US courts, where defendants can challenge whether a patent is valid or applies to their technology.
For Circle, the acquisition may provide protection as it expands beyond reserve income from USDC. Arc, Circle Payments Network, cross-chain services, and agent-based payment tools could expose the company to a broader set of technology competitors.
It may also strengthen Circle’s bargaining position in licensing or partnership negotiations. Still, without an enforcement policy, developers and competitors have limited visibility into whether the portfolio will function mainly as a defensive shield or a commercial asset.
CRCL falls despite initial reaction to IBM deal
Fortune reported that Circle shares rose about 2% following news of the acquisition. That gain did not hold as separate concerns about the company’s USDC business weighed on CRCL on Aug. 3.
Circle shares fell nearly 5% to around $59 after Morgan Stanley downgraded the stock to underweight and cut its price target from $106 to $38. The bank cited weaker USDC supply forecasts, pressure on reserve income, and a potential shift toward lower-margin transaction revenue.
Morgan Stanley reduced its USDC supply estimates by 33% for 2027 and 44% for 2028. The downgrade was separate from the IBM patent acquisition, although both developments reflect Circle’s attempt to establish revenue sources beyond interest earned on USDC reserves.
Investors will now watch for details on how Circle intends to integrate, license, or enforce the patents. Until the company provides those details, claims that it will use the portfolio against competitors remain speculative.
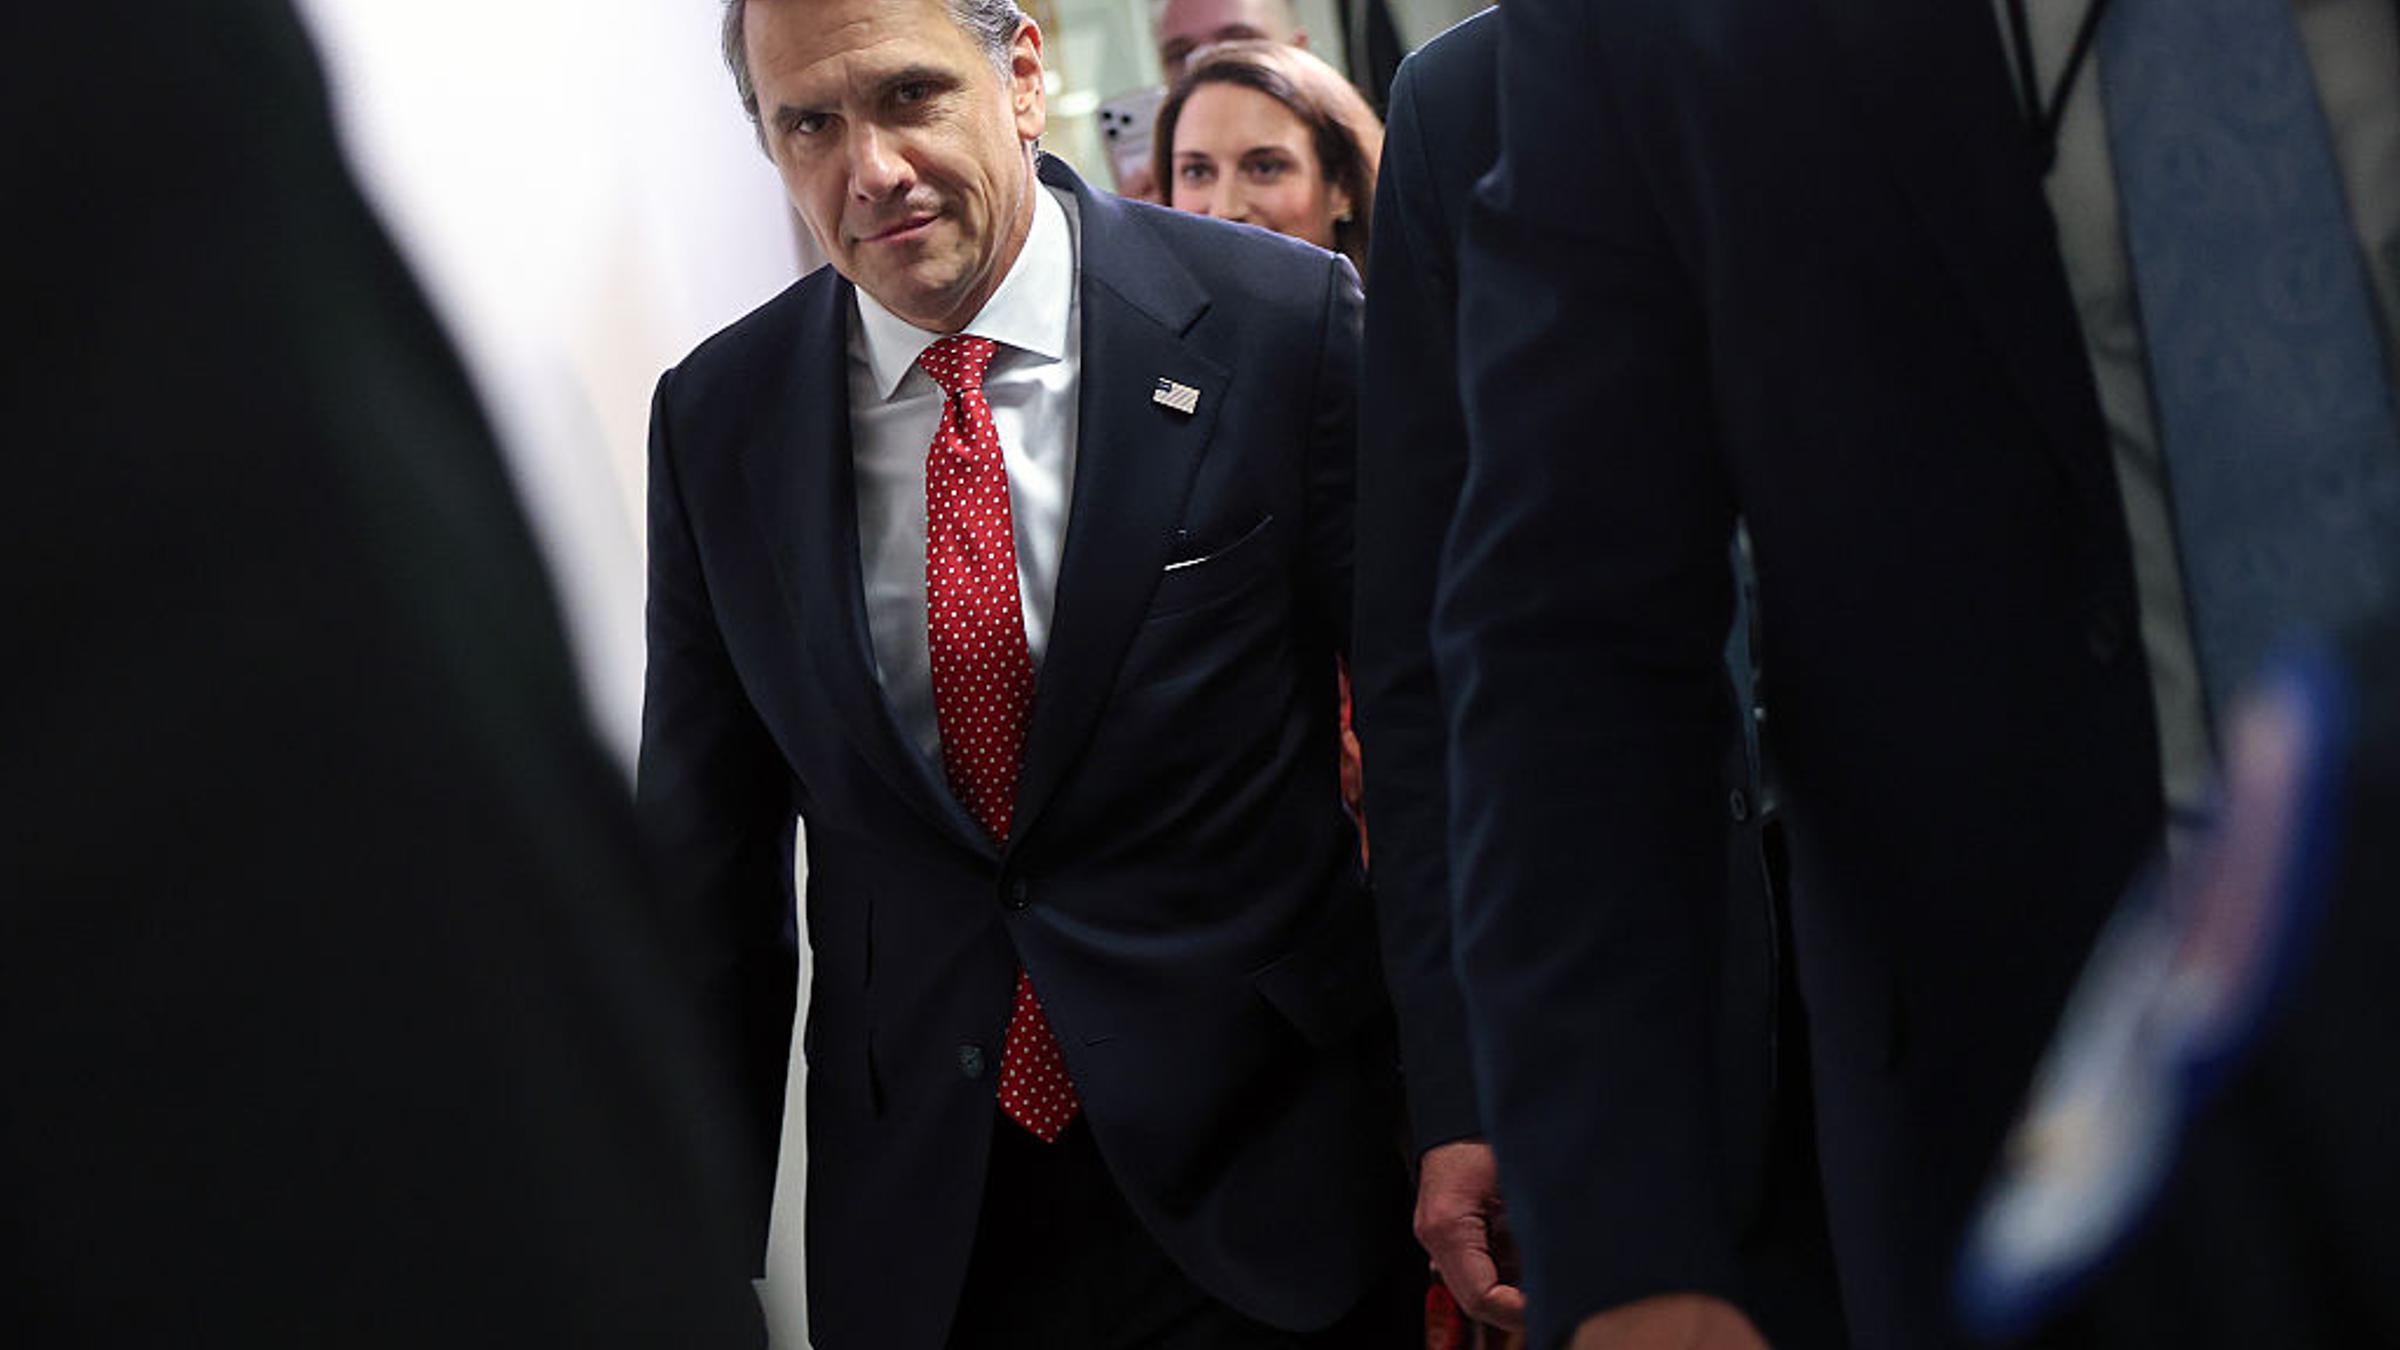
Blanche also clarified that the written order did not imply that the fund had ever been operational.
“No Members were appointed; no funds were transferred; no process for receiving claims was established; no claims were paid,” the retraction order said. “This Order establishes, beyond any doubt, that there is no Fund.”
In a joint statement Monday, Cornyn and Tillis said they were “pleased” by Blanche’s decision and “look forward to voting to advance his nomination out of the Senate Judiciary Committee soon.”
The Judiciary Committee is scheduled to vote on whether Blanche should replace Pam Bondi as Attorney General on Tuesday. With Tillis and Cornyn back in his corner, Blanche is expected to move forward without further Republican opposition.
Could Trump revive the fund?
The “anti-weaponization fund” stemmed from the Justice Department’s settlement of Trump’s lawsuit against the IRS over the leak of his tax returns. It was formally established May 18.


U.S. Treasury Secretary Scott Bessent confirmed Sunday that the U.S. joined Japan in coordinated foreign exchange intervention last Friday, calling it a move to counter “disorderly yen movements.” The USD/JPY pair almost hit 164 its weakest level since 1986 before snapping back to 156.5 on Monday.
“We will not hesitate to participate in further joint intervention,” Bessent wrote on X, adding that the U.S. “strongly supports Japan’s decisive market and monetary steps to correct the substantial undervaluation of the yen.”
For the crypto market, August 2024 marked a bloodbath caused by the unwind of the yen carry trade. When the Bank of Japan (BOJ) hiked interest rates to 0.25% unexpectedly that month, the yen strengthened, and BTC collapsed from roughly $62,000 to $49,000 in a week, roughly a 20% drawdown, as leveraged carry investors sold risk assets to cover yen-denominated losses.
The BOJ held rates at 1% last week, while Governor Kazuo Ueda’s flagged AI demand and yen weakness as the two factors pushing inflation above 2%.
Different this time?
However, with everyone expecting bitcoin to fall alongside a strong yen, CoinDesk analysis shows the opposite. Bitcoin’s 52-week rolling correlation with USD/JPY had hit -0.90, suggesting BTC was actually falling alongside a weakening yen, which is the opposite of carry-trade logic. Analysis shows it was more likely broad U.S. dollar strength, not the yen.
Japanese bond yields are still surging regardless of the announcement, with the 30-year yield approaching 4%, while bitcoin has remained relatively flat above $63,000.
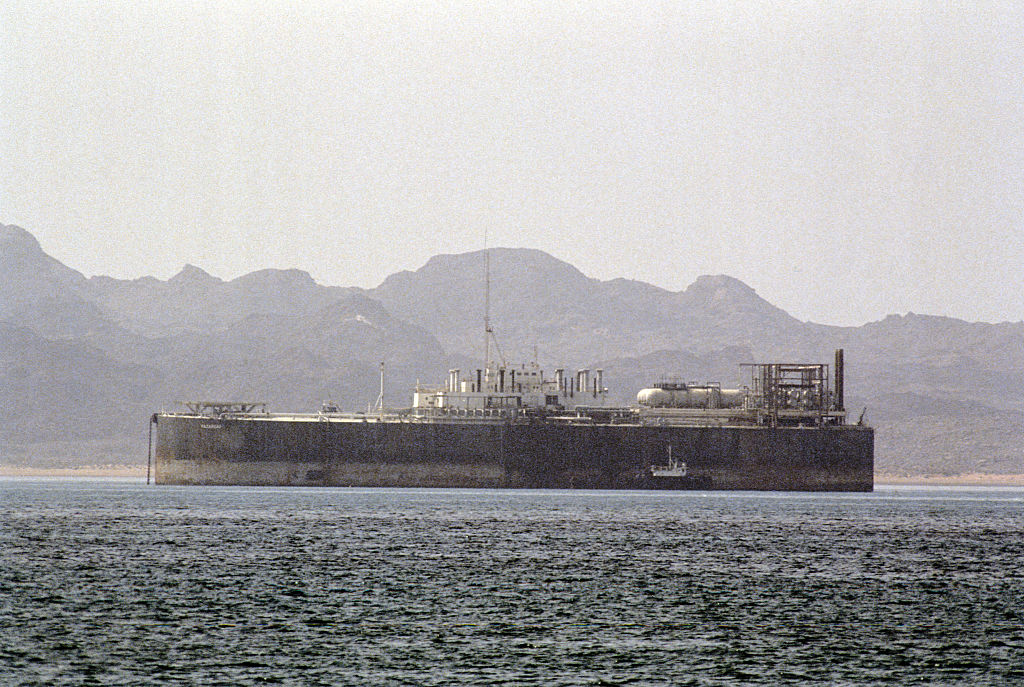
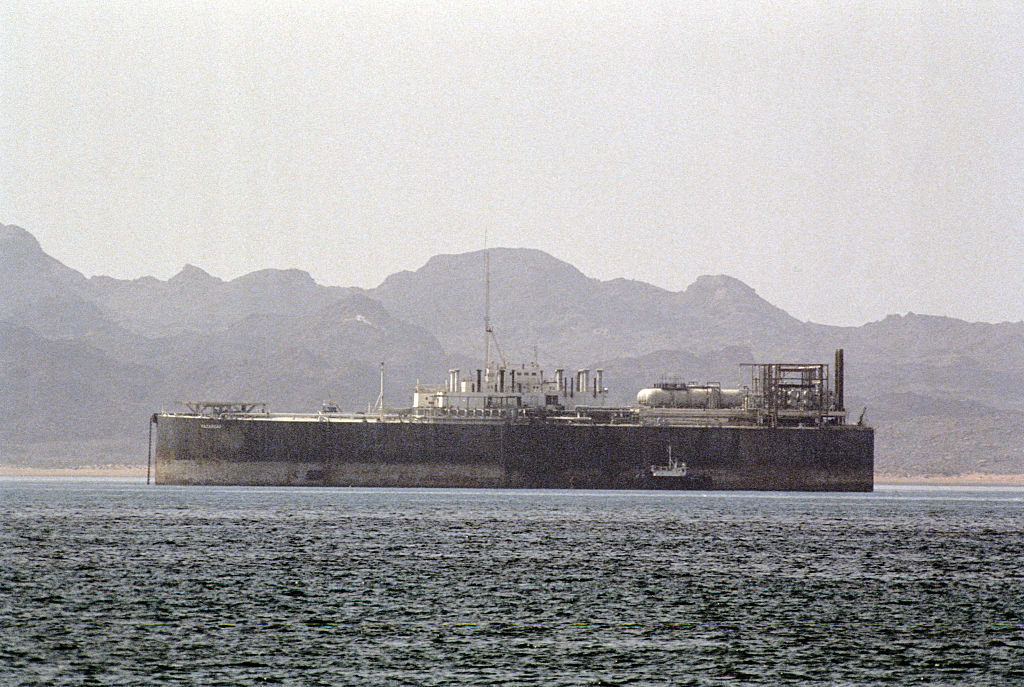
Iran is expanding the theater of war with an eye on the Strait of Hormuz. Last week, according to U.S. Central Command, more than 30 Iranian-directed drones attacked American forces and Saudi energy installations near Riyadh and the Eastern Province. On July 28, the Islamic Revolutionary Guard Corps (IRGC) spread the battle to Jordan, firing a fresh volley of ballistic missiles at U.S. forces in the country.
American and Saudi aircraft answered in Iraq, striking targets across seven provinces, where the Popular Mobilization Forces—militias funded by, and loyal to Tehran—counted 20 dead. There were strikes on targets in Iran, too, and threats of more to come. President Donald Trump, who only four days earlier had called off a 13-day bombing campaign, promised that the Islamic Republic was “going to get a beating.”
Oman’s most recent attempt to find an off-ramp that would satisfy all the belligerents collapsed. Muscat had reportedly handed Tehran a Gulf-backed plan for joint management of the Strait of Hormuz, under which Iran would not exercise sole control and any fees would be voluntary. Iran’s deputy foreign minister, Kazem Gharibabadi, rejected it. The Islamic Republic, he countered, should run one full lane through its own waters and part of the other—and Tehran would consider “any action” to keep control of the strait, including resuming the war.
And so, here we are: Iran has restarted its on-again, off-again war with the U.S. over the administrative terms of a shipping lane. The American-Saudi response, punitive in its immediate purpose, must also be understood as an effort to break Iran’s grip on the strait. This is not where we began. When the U.S. and Israel struck Iran on Feb. 28, they had a list: regime change, elimination of the nuclear program, destruction of missile capabilities, dismantling of proxy militias.
Tehran initially turned Hormuz into an instrument of defense, closing the strait to make the conflict unaffordable for everyone else. The U.S. answered with a naval blockade to make it unaffordable for Iran. Each was using the waterway to force the other to stop. Somewhere in the past five months, the instrument became the objective. In March, I argued in these pages that the strait was Iran’s real nuclear option—a weapon cheaper than a nuclear bomb and immune to American or Israeli bunker-busting munitions. That was right as far as it went. But I misjudged the ambition.
Tehran has spent the summer turning a blockade into a business. And now it is going on the offensive to protect it. Consider what a ship’s master must now do to enter the Persian Gulf. According to Windward, a According to Windward, a maritime intelligence firm, he must first communicate with the Persian Gulf Strait Authority, a regulatory body that Iran established in May. Then he must file a Vessel Information Declaration: ownership, insurers, crew manifest, cargo and intended routing. A permit follows once the paperwork is accepted and a fee is paid.
No official tariff has been published, but Lloyd’s List has reported vessels paying as much as $2 million per transit, and since mid-March, every recorded passage using the corridor controlled by the IRGC rather than the normal route. J.P. Morgan estimates that a fully operational regime could earn Tehran $70 billion to $90 billion a year.
Minefields are lifted when wars end; customs houses are not.
The Malacca model with a twist
The Omani plan deserves more credit than it has received. Contributions of the kind collected in the Strait of Malacca—where Indonesia, Malaysia, and Singapore charge ships fees for navigation assistance, environmental protection, and search-and-rescue services are entirely lawful. Article 43 of the Law of the Sea Convention encourages strait states and user states to cooperate. One Western diplomat likened the scheme to a voluntary carbon offset for airline passengers: check the box if you like.
But the Malacca fund works because Indonesia, Malaysia, and Singapore have never claimed the right to stop a ship. Nobody pays them for permission, because permission was never theirs to sell. Iran has stopped the ships, and says it will stop them again.
India, Pakistan, Thailand, and the Philippines have all since made their own arrangements with Tehran. But one of very states whose model Oman hopes to replicate has refused to do so. Asked in Parliament whether his country would negotiate passage or pay Iran a toll, Singapore’s foreign minister Vivian Balakrishnan minced no words: “It is not a license to be supplicated for. It is not a toll to be paid.”
Once a state establishes the right to charge, buying it back gets expensive. A little history lesson: Denmark charged tolls on ships entering the Baltic for more than four centuries, and it took a treaty, in 1857, and a large cash payment to stop the practice. Designed to prevent a repeat of that episode, Articles 26, 38 and 44 of the Law of the Sea Convention forbid any coastal state from charging ships merely for passing through an international strait.
Another instrument, the Montreux Convention, allows Turkey to recover costs, but not to impose a transit fee for passage through the Bosphorus, the Sea of Marmara, and the Dardanelles. The rules for canals, like the Suez canal and the Panama canal, are different because they are not natural bodies of water: somebody had to dig them.
Iran signed the Law of the Sea Convention in 1982 but never ratified it, objecting from the start to the transit-passage rule it is now defying. A state that objects consistently from the beginning is not bound by an emerging custom. Iran has been that objector for four decades, and now it proposes to collect.
On Mar. 30, Iran’s parliament passed a law to formally impose transit fees on commercial vessels passing through the Strait of Hormuz, codifying Iranian sovereignty over the strait “while also creating a source of revenue,” as Mohammadreza Rezaei Kouchi, an Iranian lawmaker, told Iranian state media. “We provide its security, and it is natural that ships and oil tankers should pay such fees.”
Except that some ships don’t pay. Malaysia’s transport minister announced in March that Iran’s ambassador had exempted Malaysian vessels “because we are a friendly party.” A charge that can be waived for friends is not a fee so much as a tribute.
What Washington signed
The International Maritime Organization saw the danger in April. A spokesperson for the UN shipping agency explained that no international agreement permits tolls for transit through straits, and a toll of ships sailing through Hormuz would set a “dangerous precedent.” Only days earlier, Trump had mused to ABC News about a joint U.S.-Iranian toll system. A charge on Hormuz, he said, would be a “beautiful thing.”
Two months later, Trump signed an initial agreement that seemed to formalize the arrangement. Paragraph 5 of the Islamabad Memorandum of Understanding, which Trump signed at Versailles on June 17 during a dinner with President Emmanuel Macron of France, has Iran undertaking to arrange safe passage for commercial vessels “with no charge, for 60 days only.” Sixty days sounds suspiciously like a trial subscription. The agreement also committed Iran to talks with Oman “to define the future administration and maritime services” in the Strait of Hormuz, in line with “the sovereign rights of coastal states” of the strait.
The agreement conceded that the strait has an administration, and that it is a matter for the coastal states. It conceded that free passage now has an expiration date. That expiration falls around Aug. 16. General License X, a waiver issued by Department of Treasury’s Office of Foreign Assets Control, that made the reopening commercially possible, lapses five days later. Nobody has agreed on what comes next.
But Iran’s latest missile and drone attacks must be read as a statement of intent: Tehran is ringing the bell, and the tolls are coming for us all.

Taylor Wimpey West Scotland makes further donation to Share Alike in East Kilbride

Patriots RB TreVeyon Henderson Says ‘Apart From Jesus I Can’t Do Anything’ in Faith Reflection

Coldcard Hit By Suspected Fourth Attack Wave As Losses Mount


-

 Business5 days ago
Why Trees Belong on the Risk Register
-

 Fashion3 days ago
Weekend Open Thread: Wit & Wisdom
-

 Politics3 days ago
Meta enters AI-training agreement with far-right ‘propaganda rag’ Newsmax
-
 Entertainment6 days ago
‘Stargate’ Creator’s New Sci-Fi Series Returns for Season 3 Tomorrow
-
 Crypto World2 days ago
MicroStrategy Post-Earnings CLARITY Act Push Could Add New Catalyst for Its Stock
-

 Politics6 days ago
The Part of the Electric Transition Nobody Wants to Discuss
-

 Business6 days ago
Major shareholder moves on Canyon
-

 Crypto World2 days ago
XRP Ledger v3.3.0 brings five institutional features
-

 News Videos4 days ago
Bitcoin Enters the 3rd Stage of the Bear Market
-

 Crypto World6 days ago
Kraken Enables Retail Access to Jersey Mike’s IPO via Tokenized Shares
-

 Tech7 days ago
New macOS Sequoia & Sonoma security updates for older Macs
-

 Politics4 days ago
Luke Littler’s dominance sparks GOAT debate
-

 News Videos6 days ago
Claude: Build Financial Dashboards in Minutes (2026)
-

 Business6 days ago
Johnson & Johnson agrees to $5.5B settlement over talc cancer claims
-

 Sports4 days ago
Seema Kaliramna Wins Discus Throw Bronze, Takes India’s CWG Medals Tally To 17
-

 Crypto World1 day ago
Crypto PAC spending tops $2M in Michigan House race
-

 Business3 days ago
Trump Announces Hamas Disarmament Agreement as Iran Strikes Kuwait Air Base and US Attacks Pause Overnight
-
 Crypto World3 days ago
New York sues Kalshi over prediction market gambling
-
 Tech5 days ago
Gemini can now summarize the messiest comment threads in Google Docs
-

 Tech1 day ago
ESET tracks rise in malicious AI skills and adaptable malware
You must be logged in to post a comment Login