
Crypto World
Bollinger Bands Creator Diverges With Traders as Bitcoin Breakout Begins
Bitcoin (BTC) is attempting its first Bollinger Bands breakout in months, while creator John Bollinger is more bullish than some traders.
Key points:
- Bitcoin faces stiff resistance as it attempts daily candle closes above the upper Bollinger Band.
- Volatility comes on cue after the Bands’ tightest-ever conditions last month.
- Creator John Bollinger takes advantage of positive trading signals as part of his investment program.
Responses mixed as Bitcoin tests Bollinger Bands ceiling
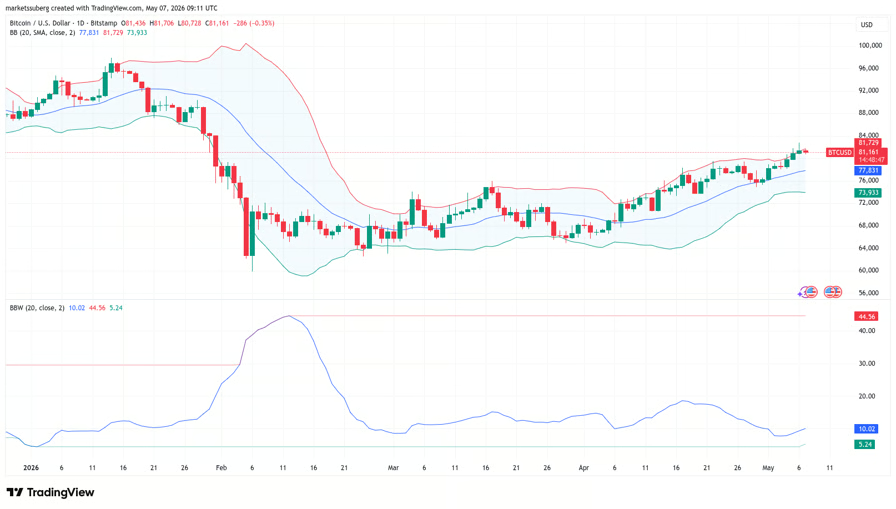
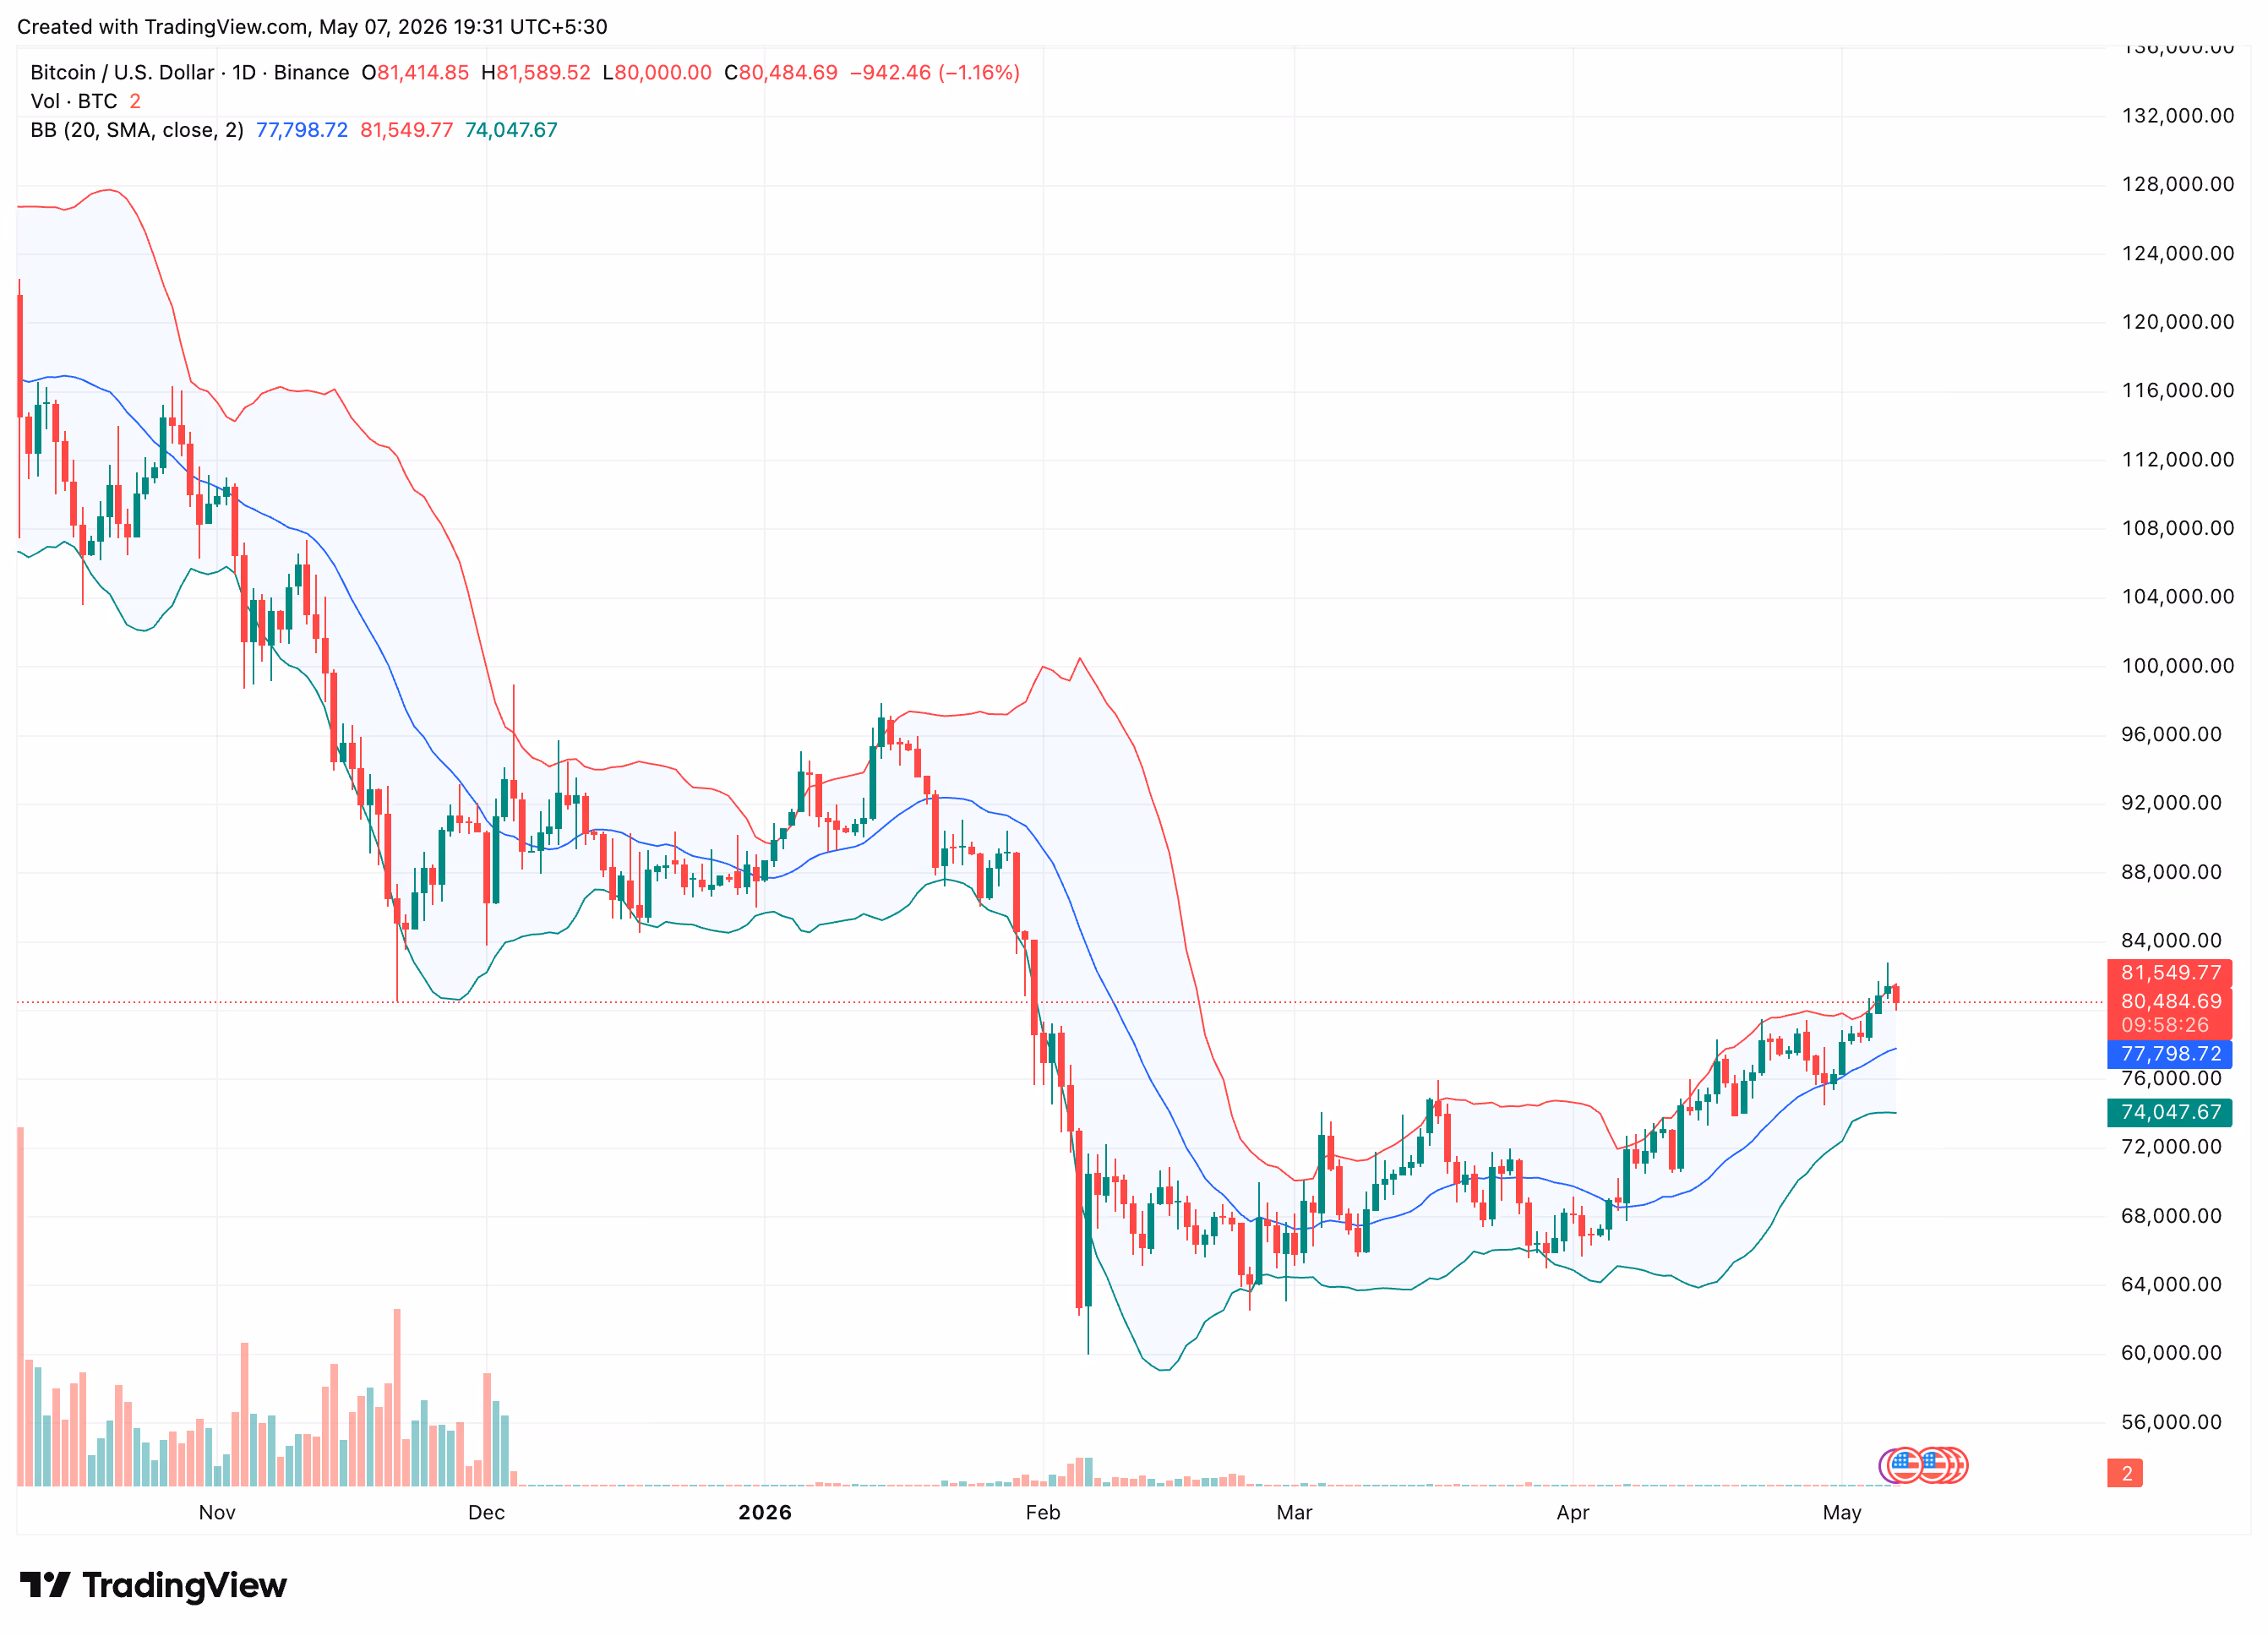
Data from TradingView confirms that on Wednesday, BTC/USD saw its second daily close above the upper Bollinger Band on the daily chart, something it has not achieved since mid-January.
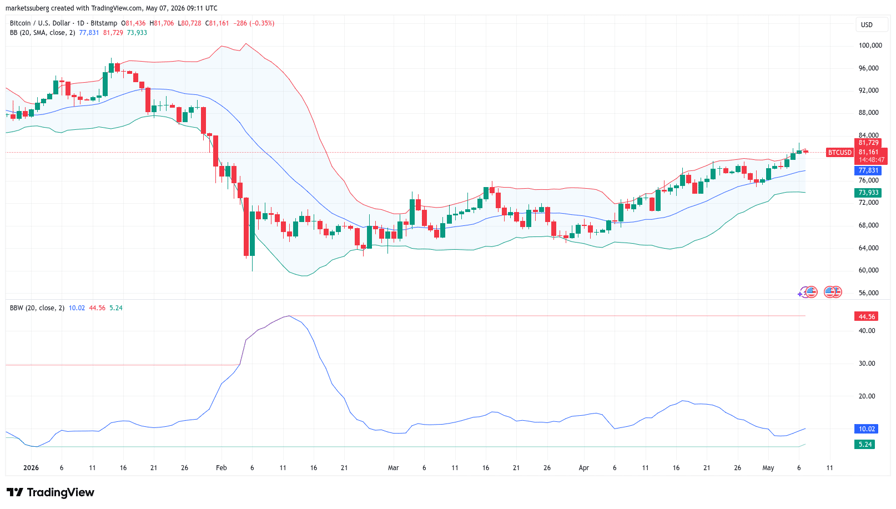
BTC/USD one-day chart with Bollinger Bands data. Source: Source: Cointelegraph/TradingView
The Bollinger Bands indicator, used to assess both volatility and momentum, recently saw the narrowest gap between its constituent trend lines ever recorded for Bitcoin.
This led to predictions of a breakout move, with the direction open to debate, as well as heightened volatility to come.
Commenting on the visit to the upper band, however, trader SuperBro noted that the price was now in an area full of potential points of rejection.
“Closed above the upper Bollinger Band, above the trendline on closing prices, but just below the log trendline on wicks,” they wrote in a post on X.
SuperBro added that most potential liquidations now belonged to long positions below the price, with shorts already taken out.
“There are relatively few short liquidations remaining up to 85K compared to long liquidations down to 74K,” they continued.
“However, bulls still have the momentum advantage and I don’t yet see a good reversal setup. Despite the liquidation imbalance, I’m holding tight to see if we can blast through.”
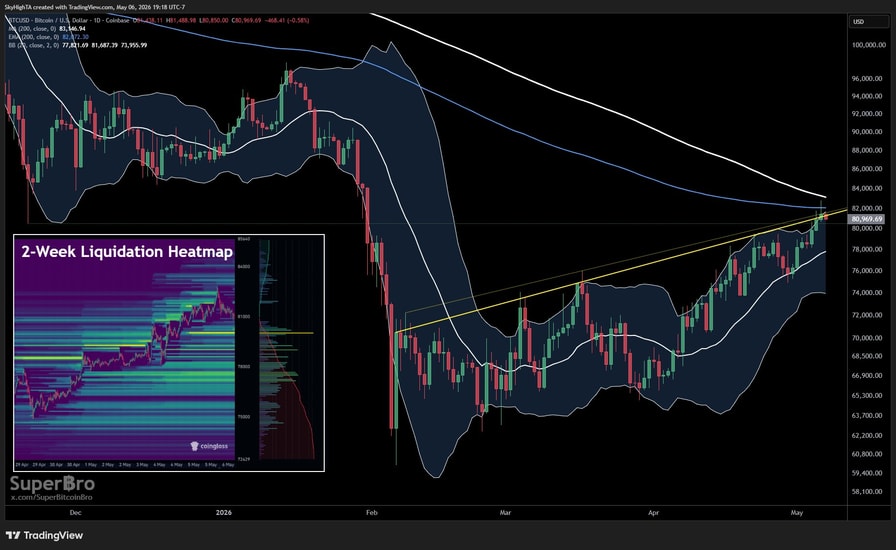
BTC/USD one-day chart with order-book liquidity data. Source: SuperBro/X
Bollinger, the indicator’s creator, revealed that one of his investment fund’s proprietary trading models had flipped positive on Bitcoin, and had taken a position accordingly.
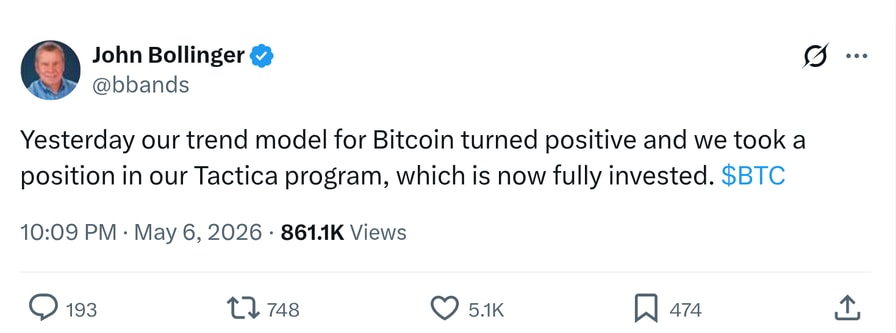
Source: John Bollinger/X
“Overheated” Bollinger signal returns after 18 months
Wednesday also saw another Bollinger Band milestone, this time concerning the market value to realized value (MVRV) ratio for speculative investors.
Related: Bitcoin can crash to $50K if ‘most critical’ bear market test fails: Analysis
The metric, recently covered by Cointelegraph, compares Bitcoin’s market cap to the price at which the supply last moved, also known as its “realized cap.”
A Bollinger Bands derivative entered “overheated” territory for the first time since late 2024, the X analytics account Frank Fetter noted.
At the time, BTC/USD was building its first visit to $100,000 in history.
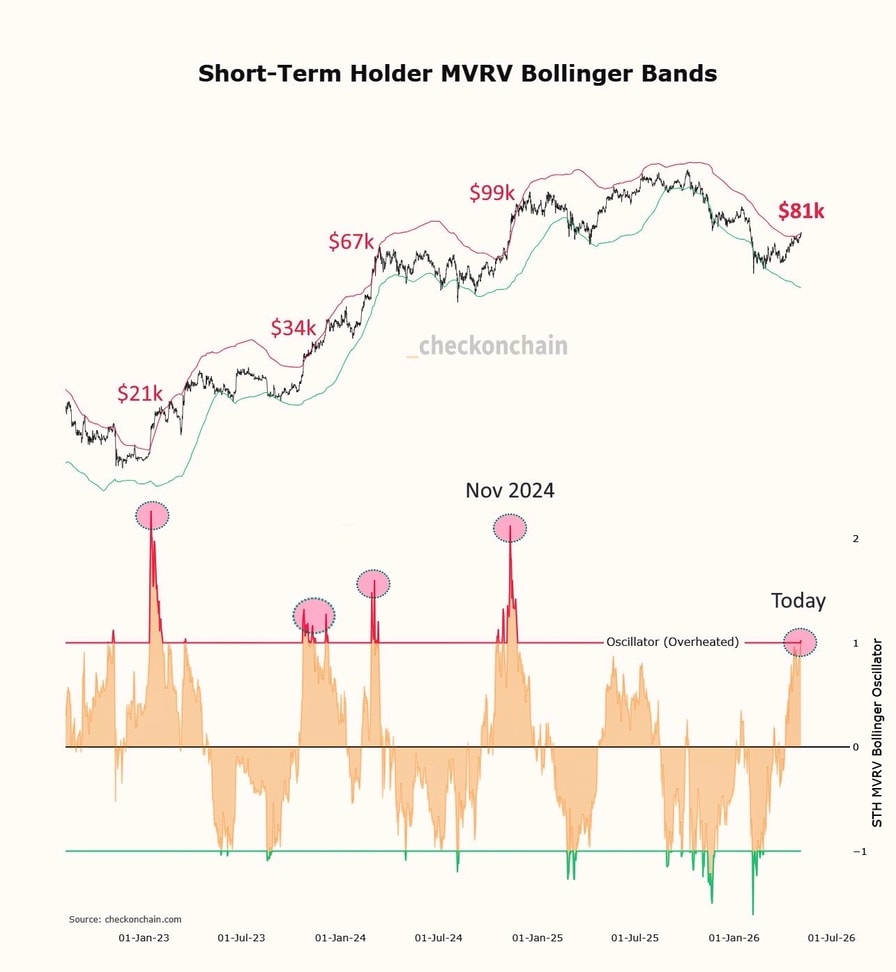
Bitcoin short-term holder MVRV ratio with Bollinger Bands oscillator. Source: Frank Fetter/X
Asked whether “overheated” conditions implied a price reversal, the account said this was “not necessarily” a given outcome.


Bitcoin can be worth a lot more than today, according to a prominent crypto strategist at VanEck. Matthew Sigel, head of digital assets research, told CNBC that Bitcoin could hit seven figures within the next five years, with a longer-term model projecting as high as $2.9 million by 2050. The comments underscore a shifting narrative: while the asset remains volatile, a growing chorus of institutional researchers portrays Bitcoin as a mega-trend with a multi-decade adoption arc.
Sigel framed his outlook as the base case for Bitcoin, arguing that the asset’s trajectory will mirror its broader integration into financial and corporate strategy rather than a straight-line ascent. In a discussion on CNBC’s Halftime Report, he said: “Bitcoin going up for us is the base case. We think this asset is going to reach a million dollars over the next several years.” He later clarified that the milestone could arrive in “half a decade,” drawing a parallel to a gradual expansion of video game adoption across age groups—an analogy meant to capture mainstreaming rather than a sudden leap.
His time horizon aligns with VanEck’s base-case long-term model, which envisions Bitcoin scaling to as much as $2.9 million by 2050. The fund house frames this as a probabilistic outcome that reflects a deepening allocation by institutions and sovereign actors over time, even as shorter-term volatility remains a defining feature of the market.
Key takeaways
- VanEck’s base-case: Bitcoin could reach $1 million within five years, with a $2.9 million target in the longer term (2050).
- Long-horizon bull thesis sees Bitcoin as a megatrend increasingly influenced by formal reserve-style adoption, including a potential central-bank bid.
- Near term, Bitcoin remains highly cyclical and volatile, with price action likely to reflect macro cycles rather than a steady ascent.
- Current market positioning appears fragile, as Sigel notes that the rally has not shown froth in derivatives and seems driven by short covering rather than widespread enthusiasm.
- Broader consensus among prominent investors is mixed, with several high-profile forecasters crafting ambitious long-run targets while skeptics flag scalability and regulatory risks.
Bitcoin’s megatrend vs. the daily drumbeat of cycles
Sigel framed Bitcoin as a “very cyclical asset” that will not move in a straight line to a million dollars. The absence of a central authority to cushion downturns, he suggested, means that drawdowns and rallies will occur in waves. Yet, the argument for a longer-term transformation remains compelling to him, particularly if Bitcoin begins to enter mainstream financial systems as a reserve-like asset for some institutions or even official balance sheets.
Looking at the immediate backdrop, Sigel pointed to Bitcoin’s correlation with the Nasdaq as a sign that macroeconomic forces are currently shaping price action. The indicator, he noted, has risen to its highest level in about five years, suggesting the market’s trajectory is closely tied to broader risk-on or risk-off cycles rather than idiosyncratic crypto-driven moves alone. Not everyone is convinced, however. Some prominent voices have urged caution on Bitcoin’s scalability and the risk that it may struggle to displace traditional safe-haven assets in the face of regulatory and sovereign currency risks. For instance, Ray Dalio has acknowledged Bitcoin as a possible store of value but has questioned its capacity to serve as a global reserve asset. Critics like Peter Schiff have argued that Bitcoin lacks intrinsic value and may not supplant gold as a hedge, tempering seven-figure forecasts with questions about real-world utility and governance.
The debate over Bitcoin’s price trajectory reflects a broader tension in the crypto space: a mix of aggressive long-run forecasts anchored in growing institutional adoption and more cautious calls that emphasize regulatory risk, scalability concerns, and competition from alternative assets. In that context, the idea of Bitcoin entering a multi-decade growth phase—driven by reserve-like demand from institutions and possibly sovereign adopters—remains a compelling narrative for many investors, even if timing and pace remain uncertain.
Beyond price targets, analysts point to several milestones that could influence the trajectory in the coming years. These include clearer regulatory frameworks, improved on-chain scalability and infrastructure, the emergence of more asset-class-native products (such as regulated futures, ETFs, and custody solutions), and measurable increases in real-world usage—not merely speculative trading activity. Each development could alter the risk-reward calculus for institutions and retail participants alike.
For readers seeking additional context, the discussion around Bitcoin’s long-run potential is frequently linked to broader market commentary and independent research. Commentary from outlets like Cointelegraph, discussions around ARK Invest’s projections, and cross-industry observations help paint a fuller picture of where the crypto market may be headed as it negotiates regulatory, technological, and macroeconomic headwinds. In short, the near term may remain challenging, but the longer-term thesis remains intact for many observers who view Bitcoin as a structural shift in how value is stored and transferred globally. The coming years will reveal whether the secular trend converges with a more favorable macro environment and a steadier path to widespread institutional involvement.
Readers should watch for signals of genuine reserve-like demand entering official balance sheets, regulatory developments that clarify safe-harbor pathways for institutions, and real-world use-case expansion that moves beyond speculative trading to utility and liquidity provision in both traditional and digital financial ecosystems.
Near-term positioning and macro drivers
What the wider market is watching

South Korea’s Finance Ministry has confirmed that a long-delayed tax on crypto gains will take effect as scheduled in January 2027.
Moon Kyung-ho, director of the ministry’s income tax division, announced at an emergency parliamentary forum on virtual asset taxation held at the National Assembly Members’ Office Building in Seoul on Thursday, according to South Korea news outlet Edaily. The forum was hosted by Representative Park Soo-young of the People Power Party and the Korea Tax Policy Association.
“We will proceed with virtual asset taxation as scheduled in January next year,” Moon said in what appears to be the first public confirmation from the ministry that the crypto tax framework will move forward after multiple postponements.
Under the current Income Tax Act, profits generated through the transfer or lending of virtual assets will be categorized as “other income” beginning Jan. 1, 2027. Investors earning more than 2.5 million Korean won ($1,800) annually from crypto activities will face a 22% tax, including a 20% income tax and 2% local tax. The rule applies to an estimated 13.26 million investors.
Related: Bithumb wins temporary court stay on South Korea suspension: Report
South Korea prepares tax guidance
Moon said the National Tax Service is currently finalizing guidance on the new system and has held several working-level meetings with South Korea’s five major exchanges, including Dunamu (Upbit), Bithumb, Coinone, Korbit and Gopax, to prepare a draft notice.
He added that the notice would be published for legislative review during 2026. Speaking to reporters after the forum, Moon walked back his use of the word “soon,” clarifying that the notice would arrive sometime this year, not imminently.

Moon Kyung-ho at the National Assembly Members’ Office Building in Yeouido, Seoul. Source: Edaily.
South Korean regulators have delayed the crypto tax twice before, pushing the start date from 2025 to 2027 amid political disagreement and industry pushback over exchange readiness and the threshold level. More recently, the ruling People Power Party proposed a bill to scrap the tax altogether before its 2027 rollout.
Related: Samsung SDS wins deal to build South Korea’s blockchain securities system: Report
South Korea’s crypto industry pushes back on AML rules
As Cointelegraph reported, proposed changes to South Korea’s anti-money laundering (AML) rules have drawn sharp criticism from the country’s crypto industry. DAXA, an industry body representing 27 registered virtual asset service providers, warned that requiring exchanges to flag all overseas-linked transfers of 10 million won or more as suspicious would increase reported cases by 85 times, from around 63,000 last year to over 5.4 million, making compliance unworkable in practice.
The Financial Services Commission and Financial Intelligence Unit proposed the amendments on March 30, with a public comment period running through May 11 and final rules expected in July.
Magazine: South Korea gets rich from crypto… North Korea gets weapons
The creator of the popular technical analysis indicator Bollinger Bands has taken a position in bitcoin, an asset his own indicator is currently flashing bullish on.
John Bollinger, who developed the indicator in the 1980s, said in an X post that one of his investment fund’s proprietary trading models had flipped positive on bitcoin and taken a position accordingly.
Bollinger bands are volatility bands that sit two standard deviations above and below the 20-day moving average of a token’s price. A wider gap between the two bands indicates volatile conditions, while a tighter band indicates calm.
A break above the upper band traditionally signals strong upward momentum, especially after a period of compression.
Bitcoin closed above its upper Bollinger Band on the daily chart on Wednesday, the second such close since mid-January, with the price sitting at $80,484 against an upper band reading of $81,549, per TradingView data. The breakout followed the asset’s tightest-ever band reading. These so-called squeezes often set the stage for big moves in either direction.

The chart shows bitcoin’s daily price swings in candlestick format with Bollinger bands.
The setup heading into the weekend is whether bitcoin establishes a foothold above the upper band. That would be a bullish technical signal, while a rejection here puts the price back in the chop zone.
Bitcoin traded above $80,000 at press time. The token is up roughly 9% over the past 30 days but remains 36% below its October 2025 all-time high of $126,000.

Ethereum (ETH) is sitting at a crossroads that, according to a popular analyst, could define the next major chapter for the second-largest cryptocurrency.
That call landed as the asset slipped almost 4% in 24 hours, failing at the $2,400 range while facing growing pressure from short sellers betting against a near-term recovery.
What the Weekly Chart is Telling Us
Crypto analyst EGRAG CRYPTO posted a detailed breakdown on X on Thursday, arguing that ETH has spent a significant period compressing inside what he describes as a “massive Ascending Triangle structure” on the weekly timeframe.
The asset has continued to respect what he calls the macro “ETH Line,” a long-standing support level that has anchored the chart for years.
The setup is binary, at least in the near term, since a breakdown from the current structure points toward $1,600, which EGRAG labeled the “structural failure zone,” while a successful breakout would target $4,800 at the initial trigger level.
They also floated a much larger upside target of $33,000 if euphoric market conditions return, though their near-term focus stayed on the fight between support and resistance.
“$4,800 = breakout trigger. $1,600 = structural failure zone. ETH is approaching decision time,” they wrote.
The market right now is in an uncomfortable holding pattern. Fellow trader Ted Pillows posted that ETH has repeatedly failed to hold above $2,400, and that spot demand was still weak.
“Until that changes, ETH will continue to underperform the market,” he claimed.
That assessment matches up with on-chain positioning data shared by analyst CW8900 earlier today, who noted that high-leveraged long positions have decreased noticeably while short interest has risen slightly.
According to them, there’s a cluster of short positions sitting between current prices and $2,500, with a clean break above that level having the potential to trigger a quick move toward $3,000.
Why the Backdrop Is More Bullish Than Price Suggests
There are other supporting signals outside the chart that suggest ETH’s weakness may be temporary.
For example, a CryptoOnchain report from Tuesday noted a sharp rise in Ethereum staking inflows, with the seven-day average going from around 28,200 to nearly 144,000 by May 5, removing more ETH from liquid circulation and possibly reducing selling pressure in case demand holds steady.
Elsewhere, analyst Ali Martinez pointed out that ETH had rallied more than 30% since a SuperTrend buy signal flashed in mid-March.
That move brought the asset to its Realized Price, sitting around $2,380, which represents the average value at which all tokens last moved on-chain. Breaking and holding above it would shift most ETH holders from being underwater to being in profit, which on past occasions became a point where selling pressure softened.
Further, he identified $2,772 and $2,921 as the next meaningful supply concentrations above that level.
After briefly touching $2,400 yesterday, Ethereum had dropped back closer to $2,300 at the time of writing. But the drop notwithstanding, it’s still up about 11% over the past month and roughly 27% on the year.
The post Ethereum Nears Critical Breakout Point as Analyst Eyes $1.6K or $4.8K Move appeared first on CryptoPotato.
Solana (SOL) price trades near $90 with the daily chart printing a familiar bottoming structure as buyers flip exchange flow back to net outflows for five straight sessions.
The setup links an 11% rebound, a developing reversal pattern, and a fresh shift in spot demand. Whether SOL converts that into a 14% breakout depends on a heavy supply cluster sitting just above price.
Price Builds Reversal Structure on 11% Rebound
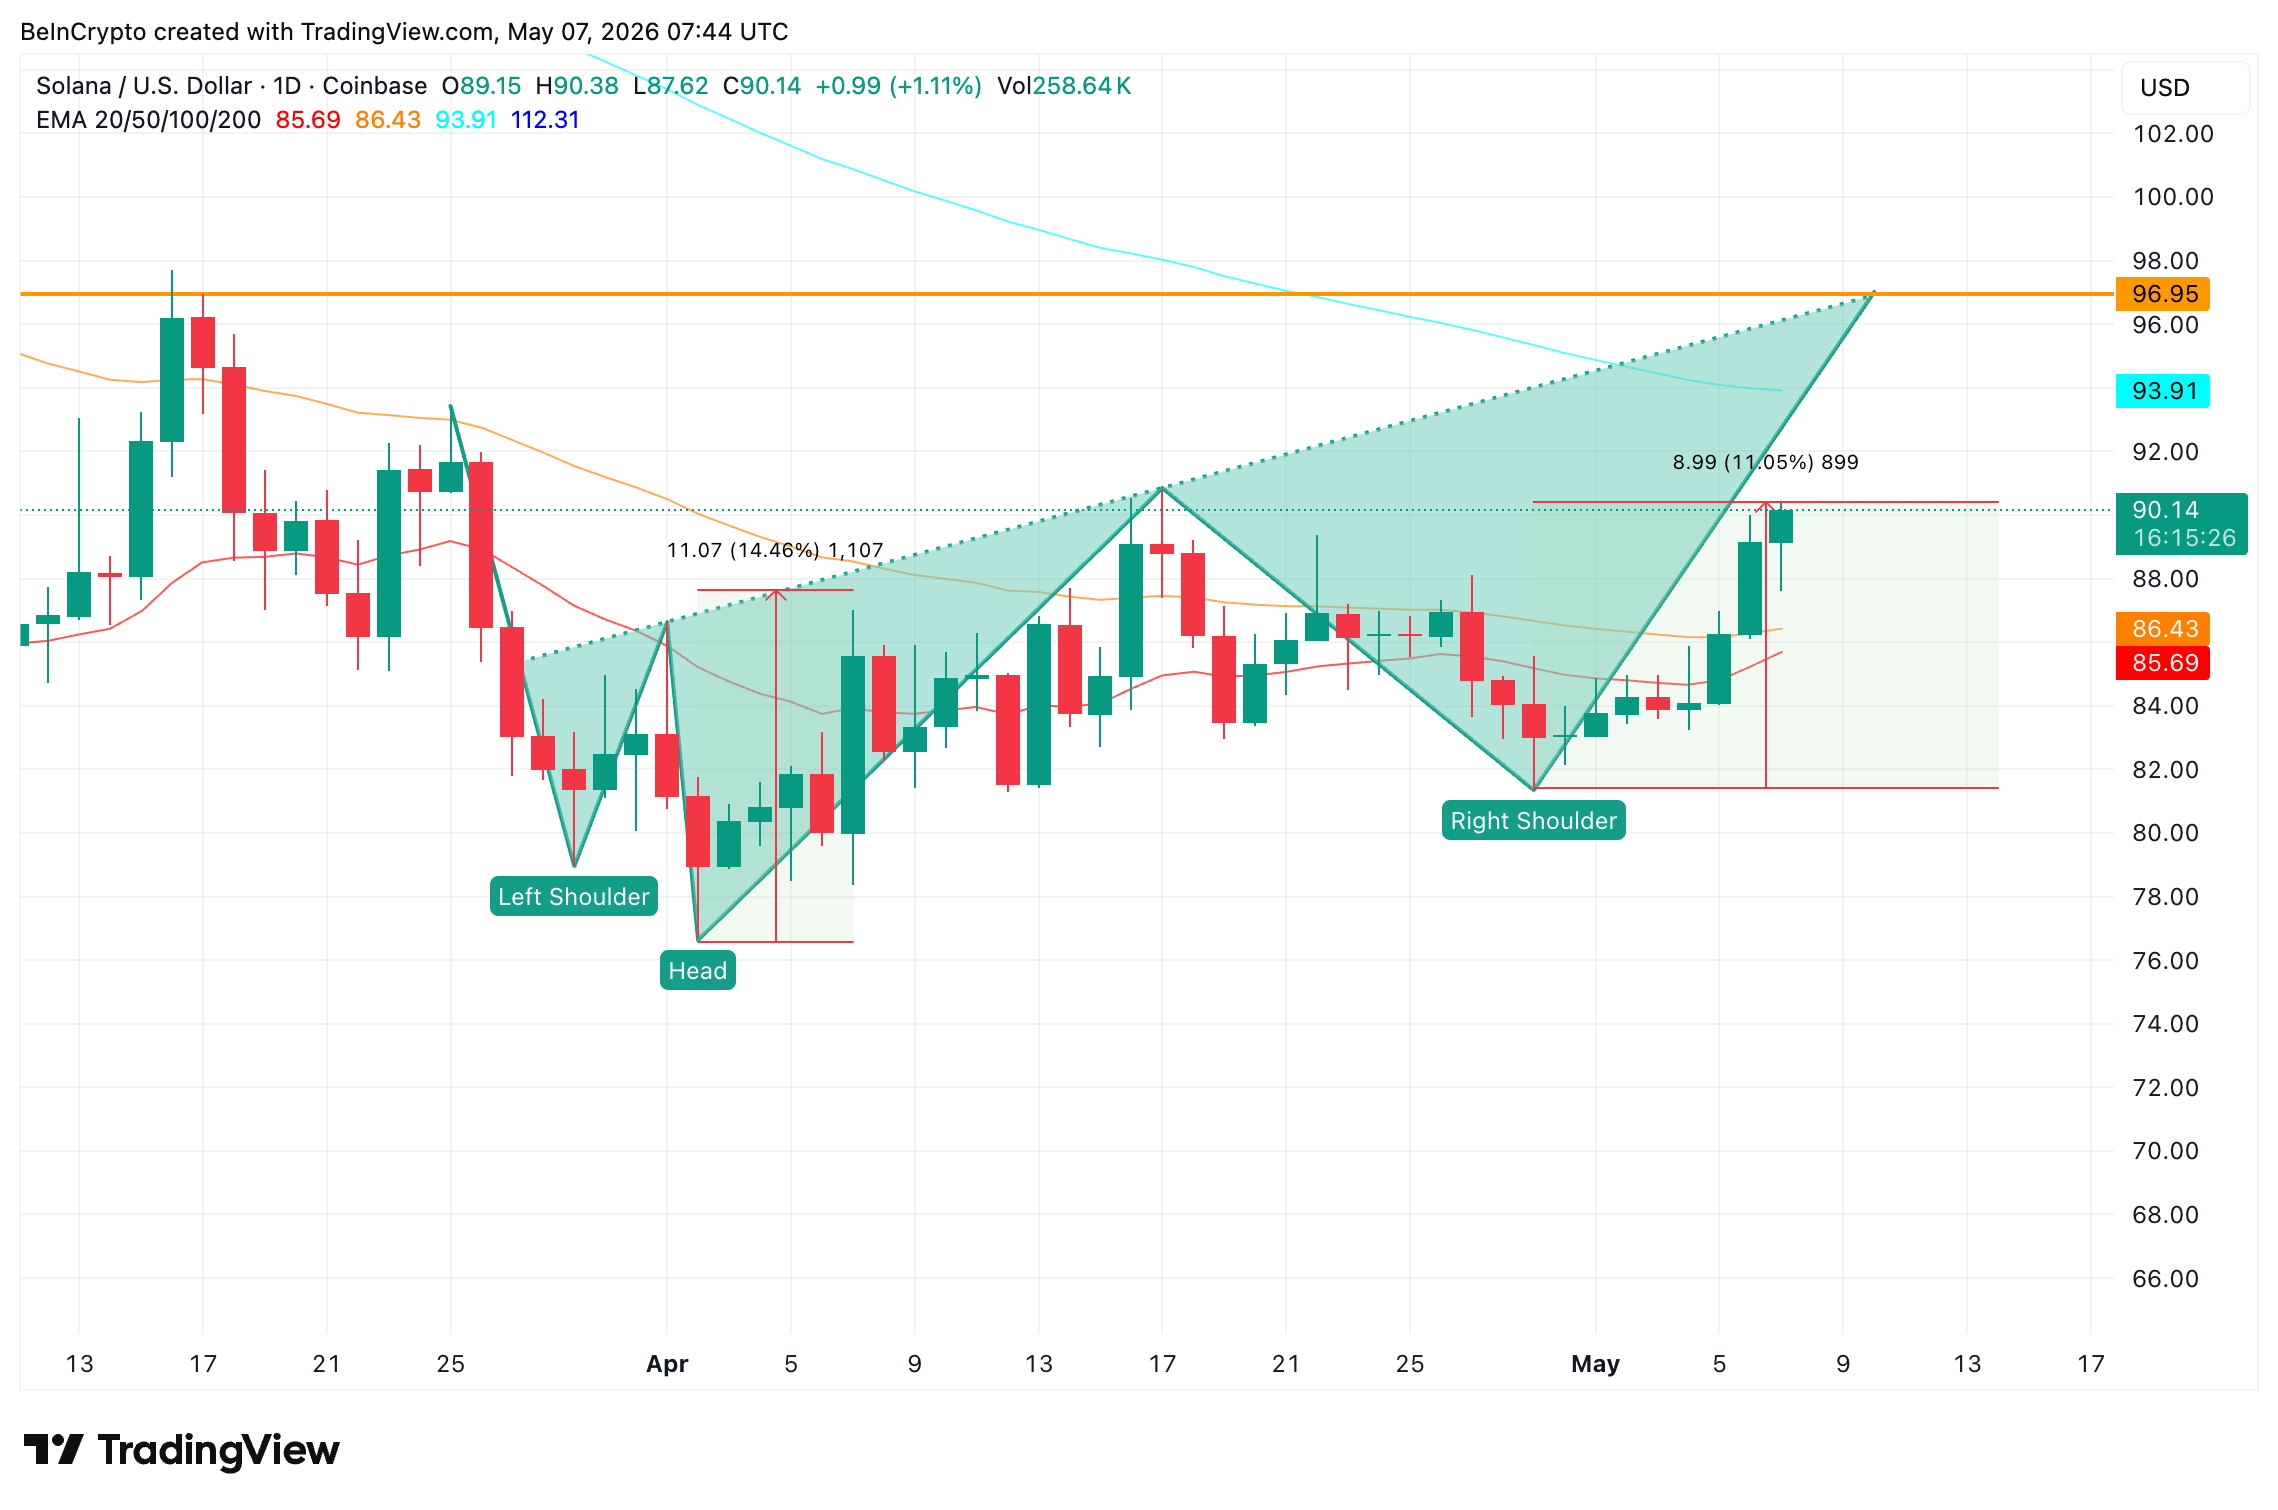
The daily chart shows Solana carving an inverse head-and-shoulders since late March. The right shoulder formed in late April. SOL has rallied roughly 11% off that floor, working back up toward the neckline that defines the breakout trigger.
Want more token insights like this? Sign up for Editor Harsh Notariya’s Daily Crypto Newsletter here.
The moving average stack adds context. The 20-day exponential moving average (EMA), a trend indicator that gives weight to recent price moves, is closing in on the 50-day for a potential bullish crossover.

Both shorter EMAs sit below the 100-day EMA, which still caps the rally from above. A confirmed bullish cross marks the first momentum signal. Also, the possible price reclaim of the 100-day EMA at around 93.91 makes the second momentum cue.
Pattern follow-through, however, still depends on flow data backing the bid.
Buyers Pull SOL Off Exchanges as a Supply Cluster Comes Into View
Glassnode data shows the exchange net position change has flipped to buying. The metric tracks SOL flowing in and out of exchanges. April 22 through May 1 ran heavy on inflows, with single-day readings reaching almost 1.4 million SOL pushed onto exchanges.
That trend reversed. For five straight sessions through May 6, SOL has been pulled OFF exchanges. The latest day printed 543,961 SOL in net outflows. The shift suggests buyers may be absorbing supply faster than sellers can place it.

A second on-chain layer reinforces the read. Glassnode’s cost basis distribution heatmap maps the price ranges where holders acquired their coins. The metric shows roughly 5.41 million SOL is concentrated in a tight band sitting just above current price.
That cluster historically acts as resistance. Holders at break-even tend to sell into strength, especially when their entry was a recent bottom.

If these holders do not sell into the strength and keep holding the stash, the 14% breakout thesis might start making sense. For now, pattern, flow, and supply distribution all line up. The price ladder now reveals where each pivot sits on the chart.
Solana Price Levels That Decide the 14% Breakout
With the pattern, flow flip, and supply cluster aligned, the focus shifts to the price ladder. Technical levels drawn from the right-shoulder low at $81.29 show that SOL is now fighting the 0.618 level at $90.03.
A clean reclaim opens $92.41 (0.786 Fibonacci). That level overlaps with the 5.41 million SOL cost basis cluster between $91.70 and $92.43. The cluster acts as the first major supply wall.
Above that sits the 100-day EMA at $93.91, the next moving average hurdle. The neckline of the inverse head-and-shoulders runs at $96.95. A clean break activates the pattern. The measured move projects 14.45% upside, taking SOL toward $111.00.

The downside ladder is just as defined. Failure to hold above $90.03 exposes $86.69 (0.382) and $84.63 (0.236). A loss of $81.29, the right-shoulder floor, weakens the entire Solana price pattern.
The flow flip and pattern setup lean toward the upside read. The 5.41 million SOL supply cluster has yet to be tested, however, and the 100-day EMA still sits above the rally. A close above $96.95 separates a 14% Solana price breakout toward $111.00 from a slide to the $81.29 invalidation floor.
The post Solana Bulls Reclaim Control After Weeks of Selling, Eye 14% Breakout appeared first on BeInCrypto.
Crypto World
Changelly report highlights growing stablecoin use in everyday spending ahead of May 15 infrastructure discussion


Changelly uncovers the main stablecoin trends for 2026, and hosts a podcast with Stablerail on stablecoin infrastructure every business must build on May 15, 2026.
May 6, 2026 — Changelly has published new findings on stablecoin usage trends, indicating a shift from trading-focused activity toward everyday payments, portfolio liquidity management, and consumer spending behavior.
The report combines Changelly platform data from 2025 with survey results conducted jointly by Changelly and Simple among more than 3,000 users. According to the findings, stablecoins are increasingly being used as active financial tools rather than solely as trading infrastructure.
To further explore these developments, Changelly will host a live discussion titled “The Rise of Stablecoins: Infrastructure Every Business Must Build” on May 15, 2026. The session will feature John Adam Khandjian, CGO at Changelly, and Alex Emelian, CEO and Co-Founder of Stablerail, discussing how stablecoin infrastructure is evolving for businesses involved in international transactions.
Stablecoin activity expands beyond trading
According to the report, stablecoin supply surpassed $300 billion in 2025, while annual on-chain transaction volume approached $46 trillion.
Changelly’s internal data showed that:
- 23.78% of completed transactions involved stablecoins
- Stablecoin transaction sizes were approximately five times larger than non-stablecoin transactions
The report also found that stablecoin swap participation increased 33% year-over-year, while flows between crypto assets and stablecoins remained relatively balanced, suggesting users increasingly treat stablecoins as an active liquidity layer rather than solely a defensive asset.
Everyday spending behavior becomes more visible
Survey data conducted by Changelly and Simple indicated broader stablecoin use in day-to-day spending activity:
- 60.6% of respondents reported spending through crypto-linked cards
- Average transaction sizes were approximately €40
- Most spending activity was concentrated in categories such as groceries and transportation
The findings suggest that stablecoin usage patterns are increasingly resembling traditional debit card behavior.
The report also identified education and user understanding as a more significant barrier than infrastructure. While 59% of crypto card users reported no technical issues, 58% of non-users cited lack of understanding as the primary obstacle to adoption.
Upcoming discussion on stablecoin infrastructure
The May 15 discussion will focus on the role of stablecoins in international payments and digital financial infrastructure.
Topics expected to be covered include:
- The role of stablecoins as an onboarding layer into crypto
- The shift from passive holding toward active spending and usage
- Why product design and user understanding are becoming increasingly important drivers of adoption
The session will include a 20-minute discussion followed by a live Q&A segment.
About Changelly
Changelly is an instant crypto exchange platform and a trusted crypto API provider serving over 600 companies and 12 million users worldwide. It offers secure crypto-to-crypto exchange, fiat on-ramp/off-ramp APIs, and crypto payment processing. Discover how businesses can enhance their crypto offerings with Changelly’s business products. Follow Changelly on LinkedIn for updates on new features and industry trends.
About Stablerail
Stablerail is the AI neobank for stablecoin-native companies moving 6–8 figures monthly. One self-custodial account to hold, swap, pay, invoice, get fiat IBANs, spend on cards, and earn yield. AI screens every payment for sanctions, taint, and policy match before anyone signs.
Bitcoin’s (BTC) relief rally to $82,000 appears to be cooling off, and analysts say key levels must be reclaimed for BTC price to “confirm a durable continuation higher.”
Key takeaways:
- Bitcoin must break resistance at $85,000-$88,000 to confirm that the bottom is in.
- Profit-taking on rallies must cool down for a sustained breakout in BTC price.
Bitcoin must reclaim $88,000 as support
Bitcoin’s 7% climb over the last week to $81,000 saw it reclaim key levels, including the true market mean at $78,200 and short-term holder (STH) cost basis at $79,100.
If the price sustains above these two levels, the 50% drawdown from the $126,000 all-time high to sub-$60,000 levels in February “would rank among the shortest episodes of its kind in Bitcoin market history,” Glassnode said in its latest Week Onchain newsletter, adding:
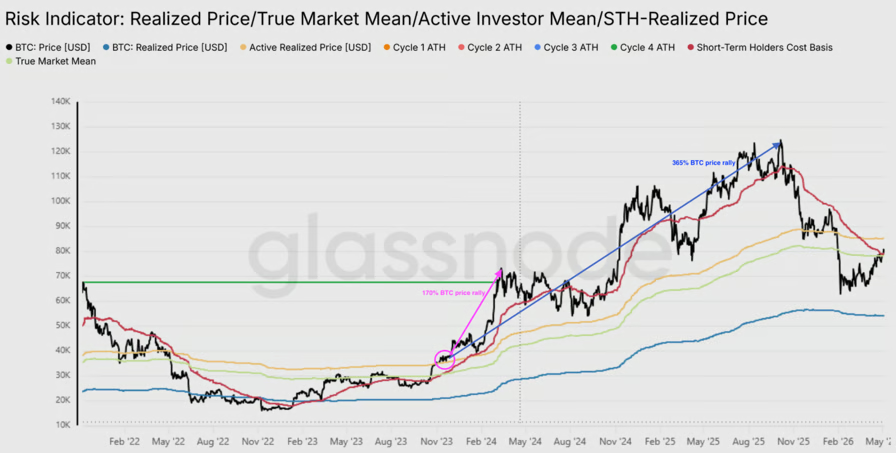
“Attention now shifts to the next major resistance at the Active Realized Price near $85.2K, which tracks the cost basis of all non-dormant supply and represents the next structural threshold the market must reckon with.”
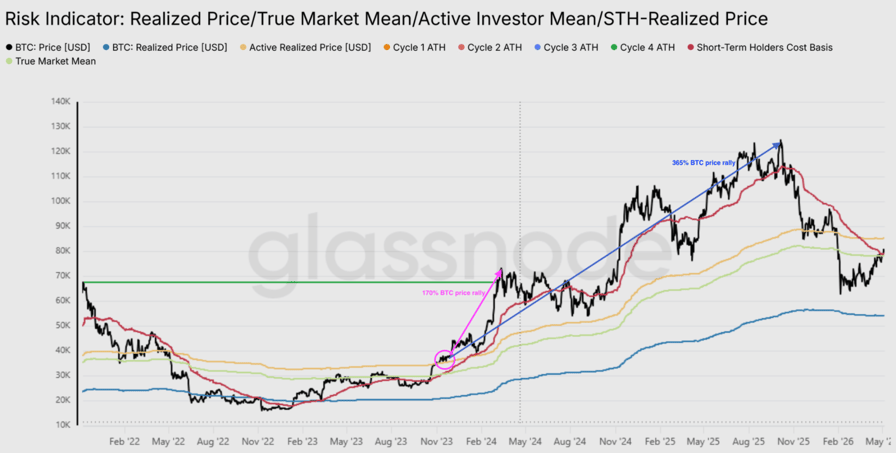
Bitcoin risk indicator. Source: Glassnode
The last time Bitcoin reclaimed its active realized price, in October 2023, it was followed by a 170% rally to its previous all-time high of $74,000 reached in March 2024. These gains increased to 365% once the price hit its current record highs above $126,000.
Related: Bitcoin Bollinger Bands push key breakout as creator acts on ‘positive’ signal
Bitcoin’s realized price by age cohorts reveals other major levels of resistance sitting higher up: the realized price of the three-to-six-month investor cohort at $88,880, the 12-month-18-month cost basis at $93,450 and the average purchase price of the six-to-12-month investor cohort at $111,850.
“For the bottom to be confirmed, price needs to clear $88.88K and hold – not wick through, not retest and fail,” CryptoQuant analyst IT Tech said in a Thursday Quicktake note, adding:
“Until then, every rally into $85K-$88K is walking straight into distribution from November 2025-Feb 2026, buyers desperate to get out flat.”
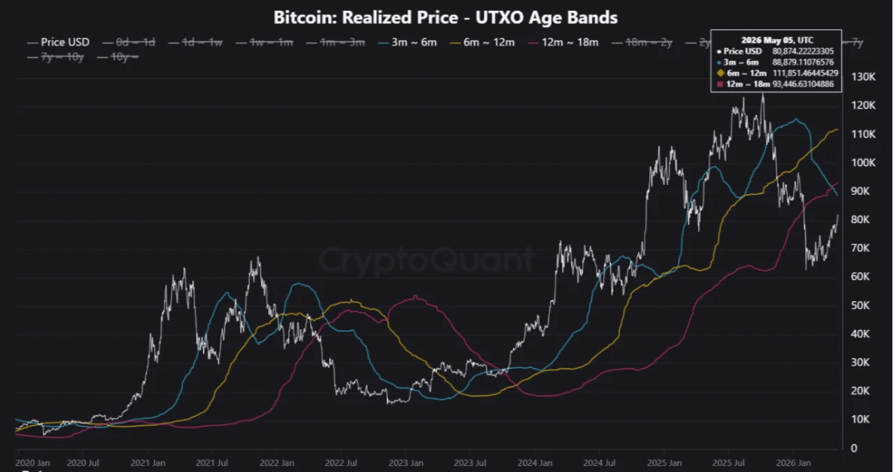
Bitcoin realized price – UTXO age bands. Source: CryptoQuant
A sustained move above that level could put recent buyers back in profit and reduce sell pressure, confirming a “durable continuation higher,” Glassnode added.
Analyst MikybullCrypto highlighted Bitcoin’s core levels of resistance before a “mega solid trend change,” including $88,000 and $92,000, based on Fibonacci level analysis.
“Overcome these resistances, then $100K is guaranteed.”
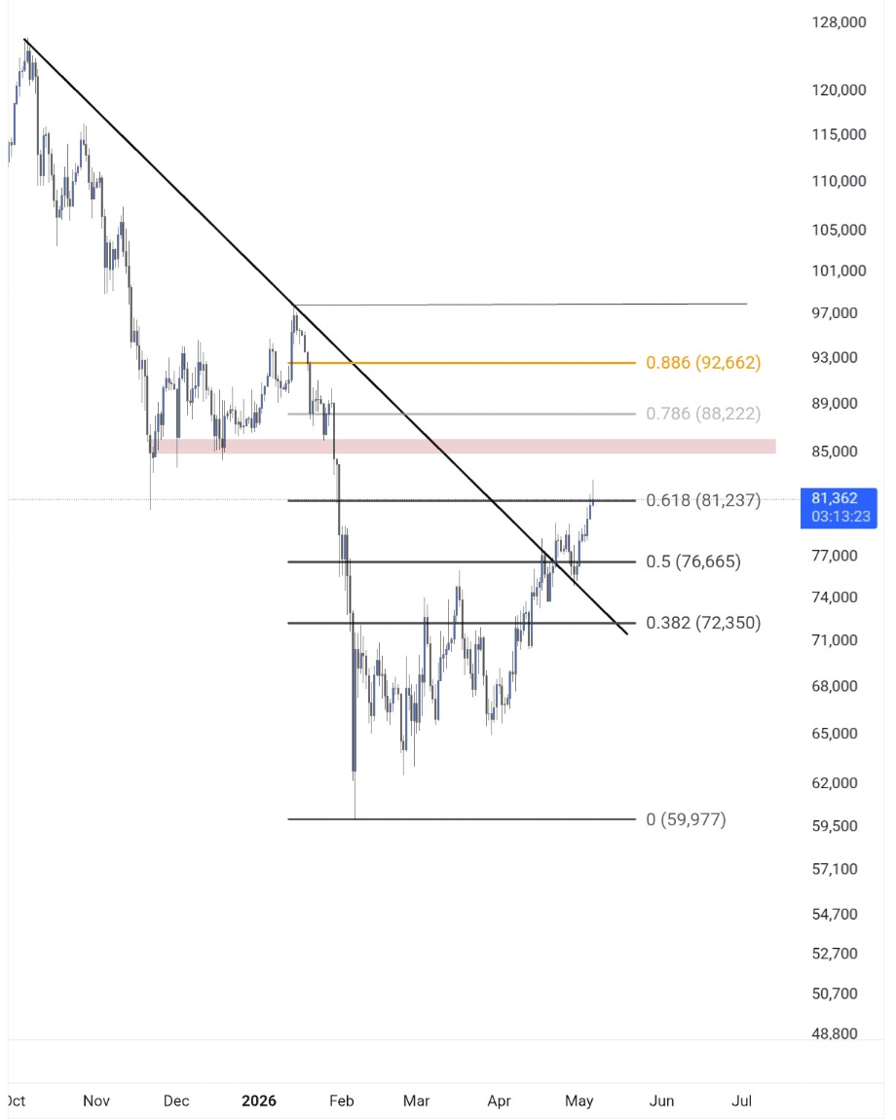
BTC/USD daily chart. Source: MikybullCrypto
Profit-taking by long-term holders could delay BTC price recovery
Bitcoin’s current pullback below $81,000 could be attributed to increased profit-taking by long-term holders.
Additionally, the 14-day simple moving average of profit realized by investors who have held BTC for more than one year has increased to about $180 million per day following the recent rally.
Should the current recovery continue, “this distribution pressure is likely to intensify,” Glassnode said, adding:
“The market’s ability to absorb this gradual increase in supply while sustaining the price above the True Market Mean will be the defining test of whether the current recovery has genuine structural legs.”
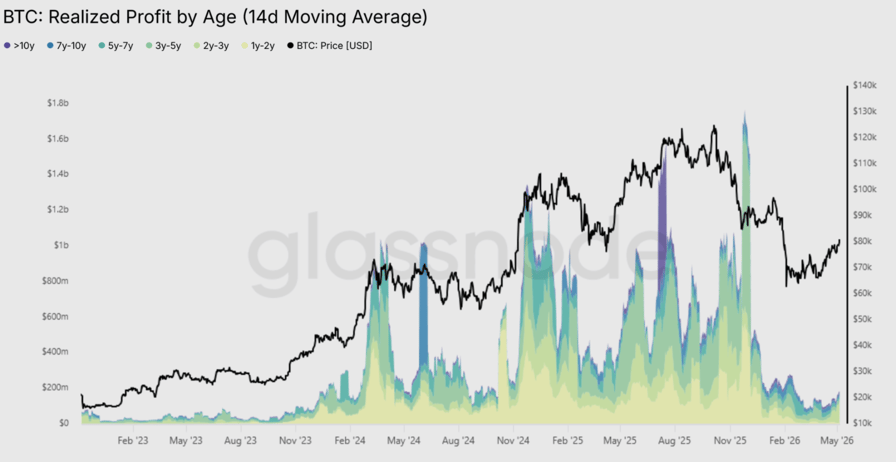
Bitcoin realized profit by age. Source: Glassnode
Meanwhile, realized losses remain elevated at $479 million per day, approximately 140% above the $200 million per day cycle baseline.
A sustained compression of this indicator below $200 million per day would serve as a strong indicator that selling exhaustion is setting in and confirm a “more durable recovery regime,” Glassnode said, adding:
“Until that threshold is reached, the dual weight of long-term holder profit taking and top-buyer distribution at thin loss margins is likely to anchor the current rally.”
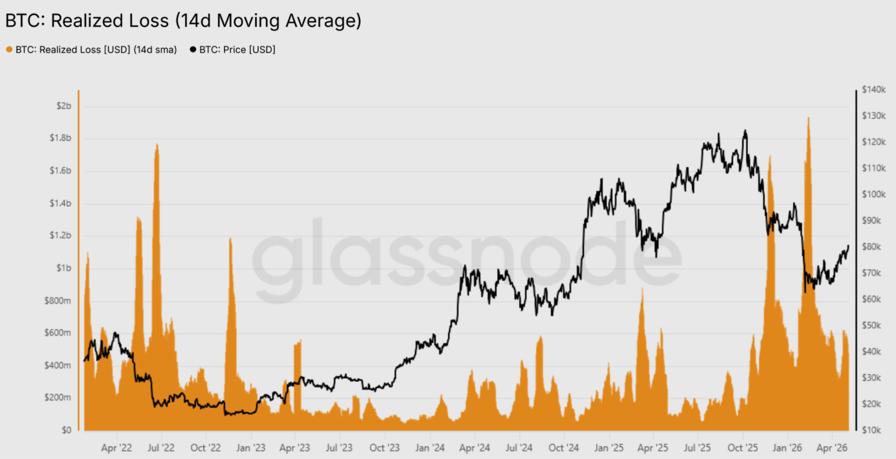
Bitcoin realized loss. Source: Glassnode
Crypto World
$202 Million Bitcoin Whale Move Ignites Supercycle Buzz as Legendary Signals Flash Bullish
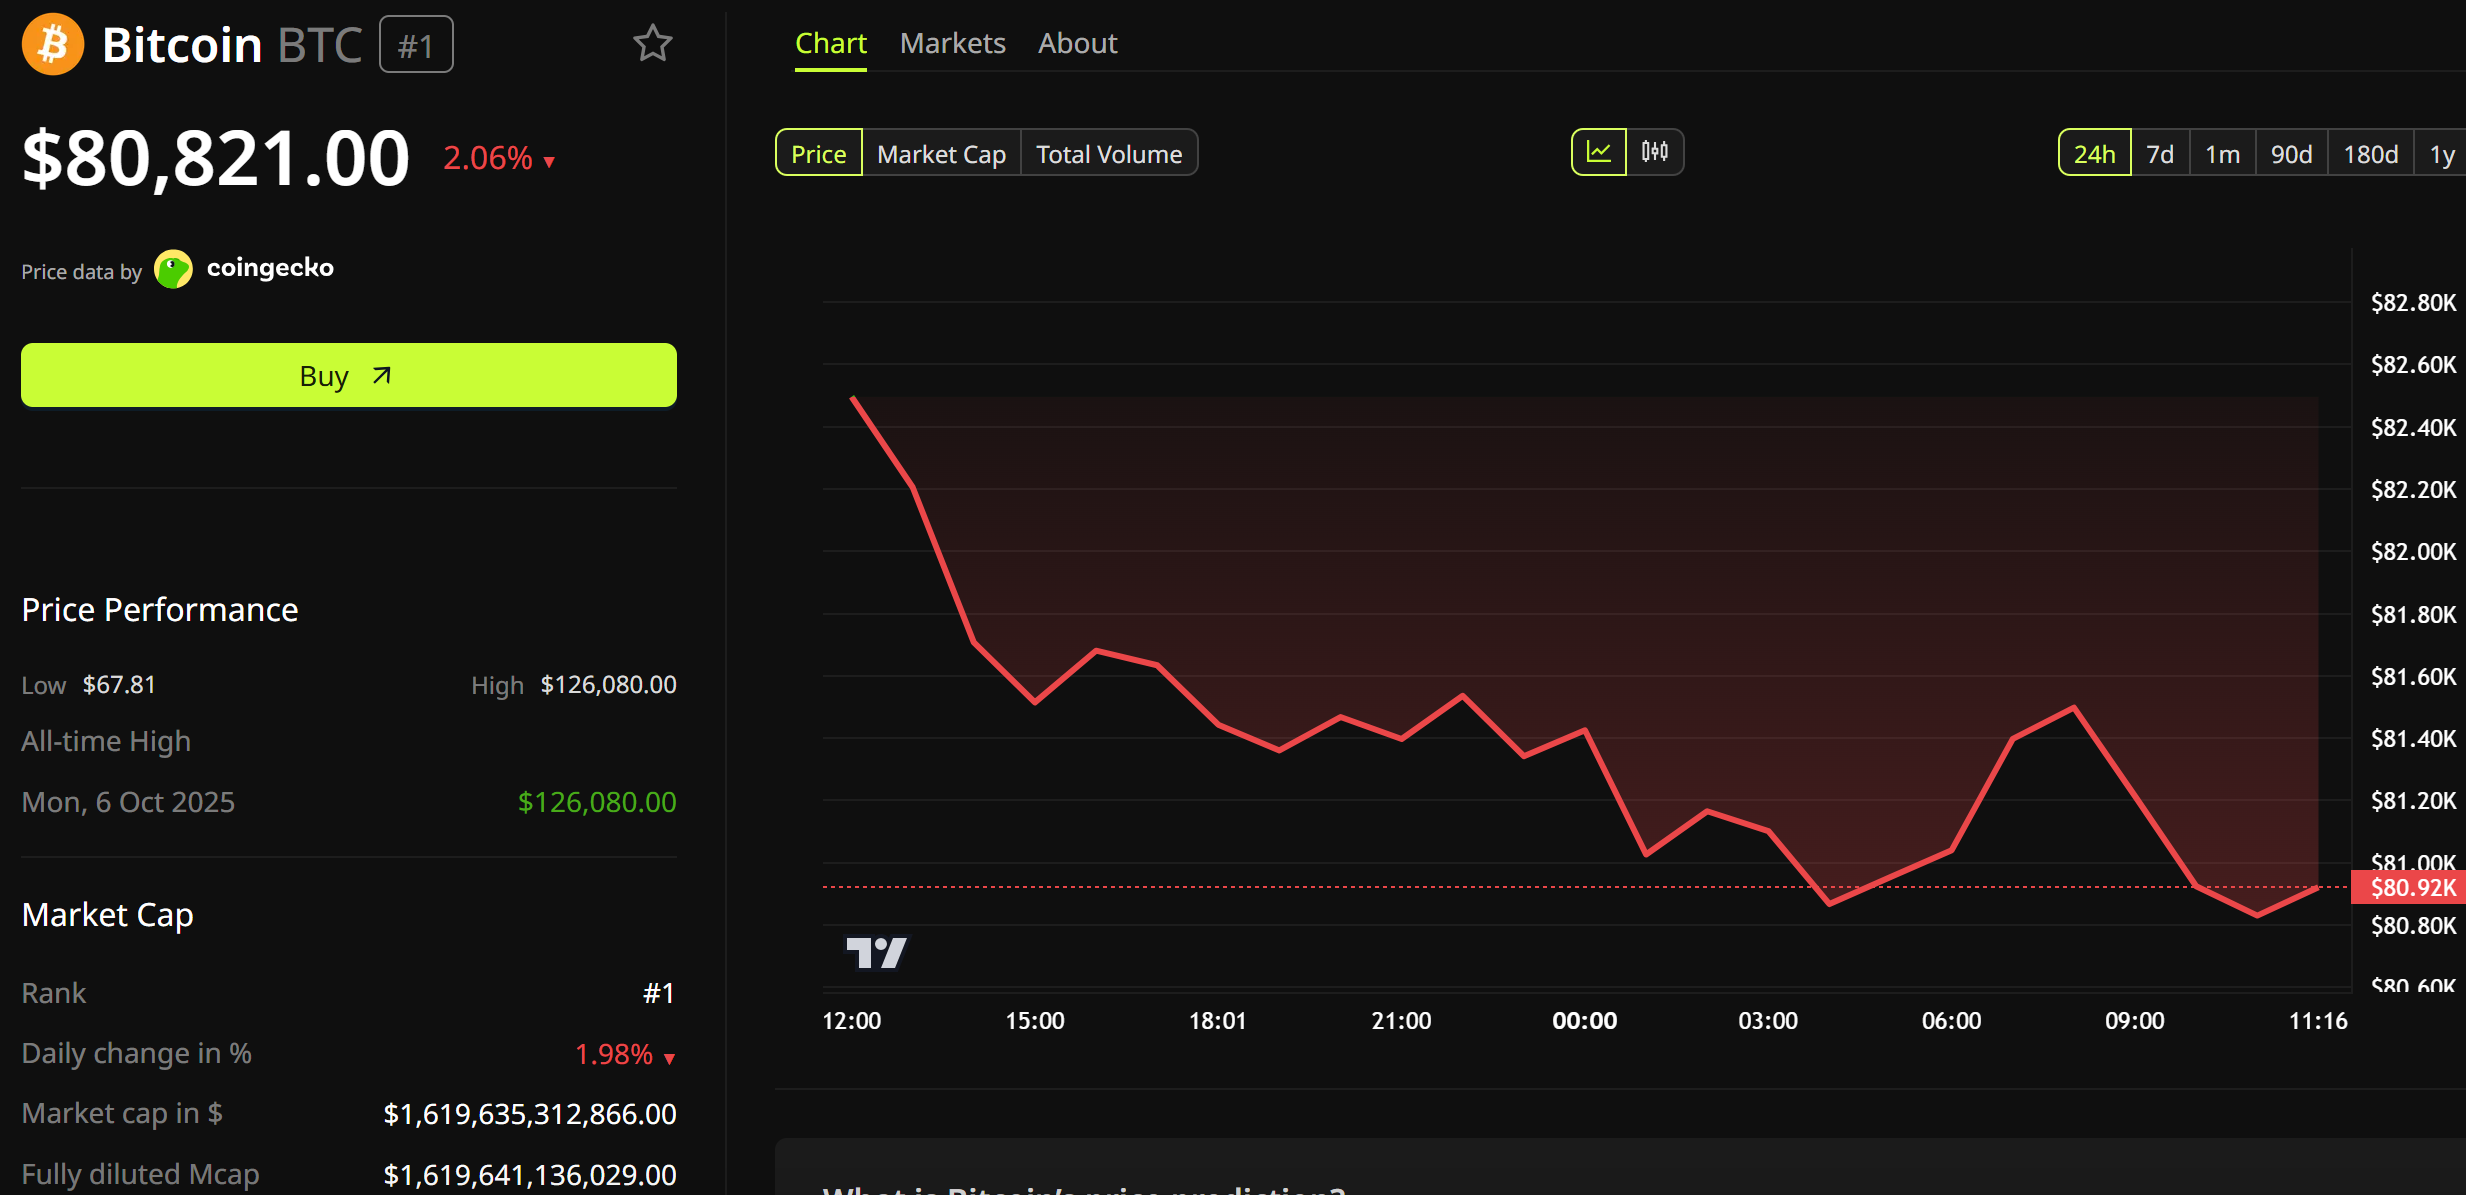
A new Bitcoin (BTC) whale wallet withdrew 2,500 BTC worth $202 million from Binance in one hour Thursday. The transfer drew attention from on-chain trackers monitoring smart money flows.
The withdrawal landed alongside a cluster of bullish technical signals from named analysts. Among them, a position change from John Bollinger and a rare weekly RSI reset flagged by market quants.
Bitcoin Whale Move Tightens Exchange Liquidity
Lookonchain shows wallet bc1qhx received the funds in two transfers, 2,250 BTC and 250 BTC, plus a small test. Exchange outflows of this size often reflect accumulation or self-custody by an institutional buyer rather than retail movement.
The withdrawal lands at a moment when Bitcoin exchange reserves have tightened. Reduced sell-side liquidity on centralized venues can amplify upside moves, particularly when paired with structural demand from regulated buyers.
Bitcoin traded near the $80,000 area through the period, reflecting a partial recovery from the recent dip. Replies to the Lookonchain post leaned bullish, with traders citing accumulation rather than panic.

Bollinger and RSI Signals Add to the Bullish Cluster
John Bollinger created the Bollinger Bands indicator. His firm’s Tactica trend program flipped positive on Bitcoin and went fully invested. He flagged the position publicly on Wednesday.
Trader FinFreedom flagged the move on X, framing the indicator’s inventor going long as a contrarian bullish signal.
“The inventor of Bollinger Bands just took a position in Bitcoin…and you’re bearish,” he stated.
Quant analyst Frank cited data showing Bitcoin’s short-term holder MVRV bands breaking above the overheated zone. That marks the first such break since November 2024.
According to the analyst, the bands move with price, so the print is not automatically a top signal.
In the same tone, macro commentator Brett pointed to a separate signal on the weekly RSI. The metric dipped below 30 and crossed above 50, a pattern seen only four times before in Bitcoin’s history.

“Each time this has occurred, the bottom was in,” Brett said.
Whether the signal cluster marks a confirmed bottom remains an open question. The next weekly close will test whether the RSI cross holds.
Continued exchange outflows would add weight to the accumulation case. A failure to hold the cross could quickly cool the bullish narrative.
“Bitcoin’s rally into the mid $80ks has many bears questioning their thesis, especially as several key recovery signals are now starting to flip constructive. However, the road higher is unlikely to be smooth, and multiple major resistance zones still remain overhead,” analysts at Chokeonchain warned.
The post $202 Million Bitcoin Whale Move Ignites Supercycle Buzz as Legendary Signals Flash Bullish appeared first on BeInCrypto.
The price has entered a flat channel. Can it break away?
PI Network (PI) Price Predictions: Analysis
Key support levels: $0.16
Key resistance levels: $0.20, $0.28
PI is Stuck in a Channel
Since the price bottomed at 13 cents, PI has entered a range between 16 and 20 cents. The price has been trading between these levels since early March, and any attempt to break away was rejected.
For example, in late April, buyers tried to break above the 20-cent resistance, but the buying momentum was quickly stopped after the selling volume spiked twice. This pushed PI back towards the support at 16 cents.

Momentum is Flat
Momentum has turned flat without a clear direction since March as PI’s price bounced between the limits of its trading channel. This can also be seen across the momentum indicators that are bouncing around their mid-range.
While volume increased in late April and May, it was not enough to drive a breakout above 20 cents. However, another attempt at that key resistance could be successful. In such a case, bulls will target 28 cents next.

Daily RSI is Stuck Around 50
In the past week, the daily RSI has been hugging the midpoint at 50. This shows a lack of clear momentum, which has pushed the price to move sideways around 18 cents. Ideally, PI holds here to make a higher high which could build a bullish bias for an eventual breakout.
To build confidence in a breakout, the daily RSI will need to move above 50 points and approach 70, which would signal that buyers are returning. That can also coincide with a new attempt at breaking the $0.20 resistance.

The post Pi Network (PI) Price Predictions for This Week appeared first on CryptoPotato.
Crypto World
Whirlpool says Iran war causing ‘recession-level industry decline.’ The shares are down 20%
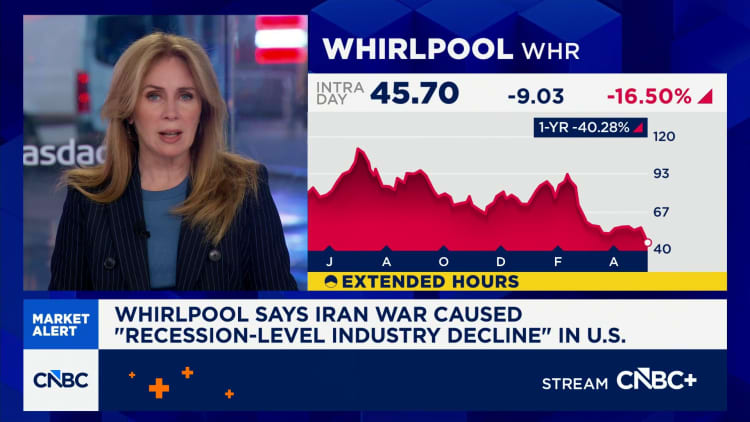

Whirlpool shares tumbled Thursday after the iconic appliance maker warned that the war in Iran triggered a severe downturn, underscoring how sharply higher fuel prices and collapsing consumer confidence are beginning to weigh on big-ticket purchases.
“War in Iran resulted in recession-level industry decline in the U.S. as consumer confidence collapsed in late February and March,” the company said in its earnings filing.
The comments marked one of the starkest corporate warnings yet about the economic fallout from the conflict and contrasted with more resilient spending trends recently highlighted by companies tied to travel and services.
Shares of Whirlpool, maker of washers, dryers, dishwashers and other home appliances, dropped a whopping 20% in premarket trading.
CEO Marc Bitzer said Whirlpool moved quickly to cut costs and adjust pricing as macroeconomic conditions deteriorated.
“We acted decisively to address pricing and costs in the face of rapid deterioration in macroeconomic conditions,” Bitzer said in a statement. “Now, with Section 232 changes in favor of domestic manufacturers, Whirlpool Corporation is structurally positioned to win with our American-made products.”
The company also slashed its full-year earnings guidance roughly in half, cutting its forecast to a range of $3 to $3.50 a share from a prior outlook of about $6 a share. Whirlpool said it would also suspend its dividend as it prioritizes paying down debt.
Analysts at JPMorgan said the lower earnings outlook was driven by higher raw material inflation, a larger net tariff impact and weaker price and product mix benefits.
While companies such as Uber and Disney have reported little evidence of consumers pulling back on travel, entertainment and convenience spending, the comments from the Maytag parent suggest strain may be emerging in bigger-ticket categories such as washers, dryers and kitchen appliances.
Consumer confidence, according to a University of Michigan survey, touched a record low at one point in April as the Iran war spiked gasoline prices. The stock market has rebounded since mid-April on hope the U.S. and Iran could come to a deal that ends the fighting. U.S. oil prices are still above $90 a barrel, however, as traders wait to see if a peace proposal can be worked out.

GMP statement after officer acquitted of causing mum’s death

Providers Advancing Modern Workforce Readiness

VanEck’s Sigel Projects Bitcoin to Hit $1M in Five Years
Manchester United reach agreement with Casemiro over contract clause amid transfer speculation

US brings back mandatory military draft registration

Steven Gerrard disagrees with Gary Neville over ‘shock’ Chelsea and Arsenal claim | Football


-

 NewsBeat4 days ago
Channel 5 – All Creatures Great and Small series 7 new post
-

 Crypto World6 hours ago
Upbit adds B3 Korean won pair as Base token gains Korea access
-
 Tech6 days ago
Trump’s 25% EU auto tariff breaches Turnberry Agreement that also covers semiconductors and digital trade
-
 NewsBeat7 hours ago
NCP car park operator enters administration putting 340 UK sites at risk of closure
-
 Sports6 days ago
Paul Scholes issues Marcus Rashford reality check as agreement emerges over Man United star
-

 Entertainment6 days ago
Met Gala 2026 Rumored Guest List Is Turning Heads
-

 Business6 days ago
Strait of Hormuz Blockade Persists Amid US-Iran Standoff, Sending Oil Prices Soaring
-
Entertainment6 days ago
New on Prime Video in May 2026 — Full List of Movies and Shows
-

 Sports6 days ago
Cavaliers vs. Raptors Game 6 live score, updates, highlights from 2026 NBA playoffs first-round series
-

 Tech6 days ago
Meta ends Sama contract after Kenyan workers report seeing intimate footage from Ray-Ban smart glasses users
-
 Sports6 days ago
David Benavidez responds to team Canelo saying the fight will never happen
-

 Entertainment6 days ago
Kylie Jenner Hit With Second Lawsuit From Ex-Housekeeper
-

 Entertainment6 days ago
Young and the Restless Next Week: Cane Arrested & Matt’s Deadly New Scheme!
-
Entertainment5 days ago
New Netflix Movies in May 2026 — My Top 3 Picks to Stream
-

 Business4 days ago
Luka Doncic Injury Update: Doncic’s Hamstring Recovery Slows Lakers’ Hopes Against Thunder: Can He Run Yet?
-
 Sports6 days ago
IPL 2026: ‘Love you darling’- Hardik Pandya’s reaction to MS Dhoni steals the show |Watch | Cricket News
-
 Crypto World5 days ago
Pi Network Mandates Protocol 23 Upgrade for All Mainnet Nodes Before May 15 Deadline
-

 Entertainment4 days ago
Melissa Joan Hart and More Stars Attend 2026 Kentucky Derby
-

 Sports6 days ago
Bayern won’t hand bottom side Heidenheim ‘gifts’ despite PSG game
-

 Sports6 days ago
What Preity Zinta Said After Punjab Kings’ First Defeat Of IPL 2026
You must be logged in to post a comment Login