

Crypto World
Whirlpool says Iran war causing ‘recession-level industry decline.’ The shares are down 20%
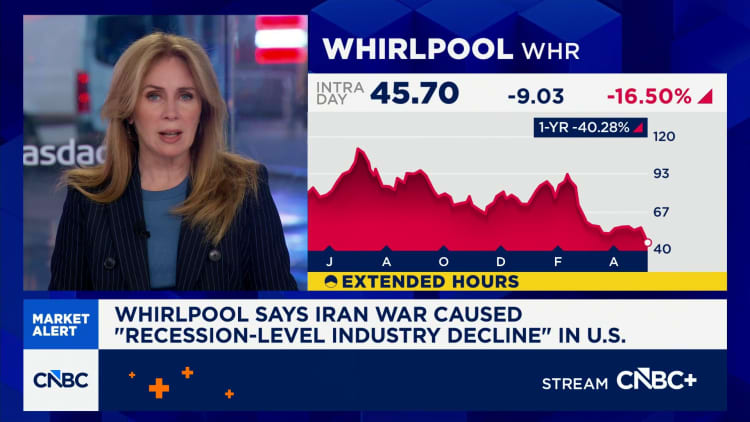

Whirlpool shares tumbled Thursday after the iconic appliance maker warned that the war in Iran triggered a severe downturn, underscoring how sharply higher fuel prices and collapsing consumer confidence are beginning to weigh on big-ticket purchases.
“War in Iran resulted in recession-level industry decline in the U.S. as consumer confidence collapsed in late February and March,” the company said in its earnings filing.
The comments marked one of the starkest corporate warnings yet about the economic fallout from the conflict and contrasted with more resilient spending trends recently highlighted by companies tied to travel and services.
Shares of Whirlpool, maker of washers, dryers, dishwashers and other home appliances, dropped a whopping 20% in premarket trading.
CEO Marc Bitzer said Whirlpool moved quickly to cut costs and adjust pricing as macroeconomic conditions deteriorated.
“We acted decisively to address pricing and costs in the face of rapid deterioration in macroeconomic conditions,” Bitzer said in a statement. “Now, with Section 232 changes in favor of domestic manufacturers, Whirlpool Corporation is structurally positioned to win with our American-made products.”
The company also slashed its full-year earnings guidance roughly in half, cutting its forecast to a range of $3 to $3.50 a share from a prior outlook of about $6 a share. Whirlpool said it would also suspend its dividend as it prioritizes paying down debt.
Analysts at JPMorgan said the lower earnings outlook was driven by higher raw material inflation, a larger net tariff impact and weaker price and product mix benefits.
While companies such as Uber and Disney have reported little evidence of consumers pulling back on travel, entertainment and convenience spending, the comments from the Maytag parent suggest strain may be emerging in bigger-ticket categories such as washers, dryers and kitchen appliances.
Consumer confidence, according to a University of Michigan survey, touched a record low at one point in April as the Iran war spiked gasoline prices. The stock market has rebounded since mid-April on hope the U.S. and Iran could come to a deal that ends the fighting. U.S. oil prices are still above $90 a barrel, however, as traders wait to see if a peace proposal can be worked out.


South Korean tech giant LG Electronics is working with the Ethereum layer-2 network Arbitrum to build a blockchain-based advertising network aimed at serving the digital ad industry.
Arbitrum would give advertisers and publishers a shared database of ad inventory and track how customers interact with advertisements, with the company exploring how to bring the service to market this year, Fortune reported on Thursday.
“We are evaluating whether this approach can deliver meaningful value to advertisers, publishers and audiences,” said Samuel Byungsun Park, the head of LG Electronics’ blockchain research lab.

LG Group’s headquarters is in Seoul, South Korea. Source: Seoul Institute
Digital ad spend is estimated to have reached $679 billion in 2025, making up 68% of worldwide ad spend, according to global advertising giant Dentsu.
Traditional ad networks require costly intermediaries to automate and manage the buying and selling of ad space between advertisers and publishers.
A blockchain-based ad network would cut out intermediaries, aiming to make ad buys more efficient and provide transparency to advertisers about who their ads have reached.
“It means that you can basically run the market in an automated way in software,” Arbitrum co-founder Steven Goldfeder told Fortune. “You don’t need manual intervention.”
The price of Arbitrum (ARB) gained 5.44% on Thursday on news of the new layer-2 blockchain, which Arbitrum confirmed on X.
Cointelegraph contacted Arbitrum and LG Electronics for comment.
Related: Citi launches blockchain marketplace for private companies’ shares: Report
LG has been exploring opportunities in crypto for nearly a decade.
In 2018, LG CNS, a subsidiary of the LG Corporation, launched an in-house blockchain called “Monachain” aimed at businesses that could be used for digital authentication, payments and supply chain management.
LG Electronics developed a decentralized crypto wallet called Wallypto using the Hedera Hashgraph network at the height of the 2022 NFT boom. It served as a companion wallet for the LG Art Lab, an NFT platform that allowed users to display digital artwork on their TVs.
The NFT platform was shut down in June 2025, adding to a wave of NFT marketplace closures that year, while LG Electronics terminated Wallypto a few months later in September.
Magazine: Does ‘Paper Bitcoin’ mean there’s an unlimited supply of BTC?

TLDR
- Avalanche Treasury debuted on Nasdaq under ticker AVAT.
- AVAT closed down 38.1% at $1.85.
- The listing followed a $675 million SPAC merger.
- AVAX rose 1.27% to trade at $6.66.
- The firm plans to acquire over $1 billion in AVAX.
Avalanche Treasury Co. dropped sharply on its first day as a public company after completing a $675 million SPAC merger. The AVAX-focused treasury firm closed down 38.1% at $1.85 after debuting on Nasdaq under the ticker AVAT. Despite the decline, the stock gained 2.7% in after-hours trading as the company outlined plans to expand its presence across the Avalanche ecosystem.
Shares Slide Despite Avalanche Growth Strategy
According to the company, Avalanche Treasury intends to support long-term development across the Avalanche network. The firm said it will deploy capital into ecosystem investments, validator infrastructure, and enterprise partnerships. Executives described the strategy as a way to increase participation in blockchain infrastructure. The company also said the listing offers investors exposure to Avalanche-related growth opportunities. Nasdaq trading began on Thursday following completion of the merger transaction.
Chief executive Bart Smith outlined the company’s investment approach in a public statement. “AVAT intends to deploy capital deliberately to compound Avalanche’s ecosystem value over time,” Smith said. He added that the strategy resembles a corporate treasury model focused on ecosystem expansion. Smith said the company views Avalanche as a platform for institutional finance development. The firm plans to allocate capital across several areas of the network.
While AVAT shares declined, the underlying Avalanche token recorded modest gains. AVAX rose 1.27% during the past 24 hours and traded at $6.66. However, the token remained down 33.7% over the previous month. The stock and token moved in different directions during the company’s first session. Market activity followed the completion of the public listing.
Merger Created Large AVAX Acquisition Platform
As it was reported by Blockonomi earlier, Avalanche Treasury first announced its merger agreement with Mountain Lake Acquisition Corp. in October 2025. The transaction included projected treasury funding of $460 million. It also provided an initial discounted AVAX allocation worth $200 million through the Avalanche Foundation. Company executives said the structure supports future capital deployment plans. The merger officially closed before trading began this week.
The company previously stated its intention to acquire more than $1 billion worth of AVAX. Beyond token accumulation, management plans to support ecosystem infrastructure projects. Future investments may include enterprise integrations and protocol-level initiatives. The firm said these efforts are intended to strengthen Avalanche adoption. Capital allocation decisions will focus on opportunities within the network.
According to company data, Avalanche has attracted more than $1.02 billion in institutional funds. The network has also facilitated over $1.65 billion in tokenized real-world assets. Avalanche Treasury said more than 550 projects currently operate across the ecosystem. Those figures formed part of the company’s public market pitch. Management cited them when discussing future growth opportunities.
Wall Street And Crypto Veterans Back The Firm
Avalanche Treasury’s leadership team combines experience from traditional finance and digital assets. Smith spent more than two decades at Susquehanna and AllianceBernstein before joining the company. Chief operating officer Laine Litman previously helped scale Hidden Road Partners. Hidden Road later became part of Ripple through an acquisition. The company said those backgrounds support its institutional strategy.
The firm’s advisory and board network includes several blockchain industry figures. Ava Labs founder Emin Gün Sirer participates alongside Dragonfly partner Rob Hadick. Other advisors include Blockworks chief executive Jason Yanowitz and Aave founder Stani Kulechov. The company said these individuals contribute industry expertise and strategic guidance. Their involvement spans both blockchain and traditional finance sectors.
Avalanche Treasury has also secured backing from multiple financial and crypto firms. Supporters include Dragonfly, ParaFi Capital, VanEck, FalconX, Galaxy Digital, Pantera Capital, and Kraken. Hadick said Avalanche has become a preferred blockchain platform for enterprise use cases. He added that a public treasury vehicle could provide institutions with a new entry point. Avalanche Treasury joins other AVAX-focused treasury firms, including AVAX One Technology Ltd.


Binance Wallet’s SpaceX IPO campaign attracted about $557 million in subscription funds, showing strong onchain demand for tokenized exposure to the planned listing.
Summary
- Binance Wallet’s SpaceX IPO campaign drew about $557 million from 27,689 onchain addresses, Dune data showed.
- Smaller subscriptions dominated address count, but larger wallets provided most funds committed to the campaign.
- The campaign offers tokenized SpaceX exposure through SPCXx, but final allocations are not guaranteed.
Binance Wallet campaign draws $557M
Dune data showed that Binance Wallet’s SpaceX IPO subscription campaign attracted about $557 million from 27,689 addresses. The figures show strong demand for SPCXx, a tokenized security product tied to SpaceX’s potential IPO.
The campaign allows eligible users to submit subscription applications through Binance Wallet. The product is linked to xStocks and gives users a chance to receive SpaceX tokenized securities after issuance.
Binance listed 135 USDC as the indicative price per token, excluding fees. The campaign also carries a 5% underwriting fee and uses USDC as the supported subscription token.
The campaign does not promise final allocation. “Submitting a subscription application only represents an expression of subscription interest and does not guarantee that the application will receive an allocation of SPCXx,” Binance said.
Large wallets supply most funds
The Dune data showed that addresses contributing $20,000 or less made up 81.48% of participants. However, those smaller wallets accounted for only 18.39% of total subscription funds.
Addresses contributing more than $20,000 and up to $100,000 made up 16.69% of participants. This group supplied 57.67% of total funds, making it the largest source of capital in the campaign.
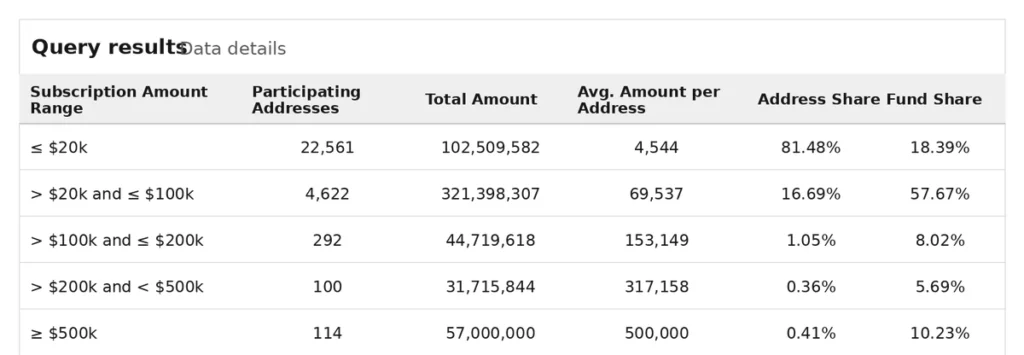
A smaller number of larger wallets also played a clear role. A total of 114 addresses contributed $500,000 or more, representing 10.23% of total funds.
The split shows broad address participation, but capital remained concentrated among bigger subscribers. That pattern is common in high-demand tokenized offerings, where smaller users raise participation numbers while larger wallets drive funding totals.
Tokenized SpaceX demand keeps rising
Binance said SPCXx is the first project under its Wallet IPO Campaign. The company said the campaign aims to connect traditional capital markets with onchain financial markets.
Users who receive final allocations will get SPCXx tokens after issuance is completed. Binance said the token is designed to offer exposure to price performance related to the SpaceX IPO.
The product does not represent direct ownership of SpaceX shares. Binance said holders do not receive voting rights, dividend rights, or other shareholder rights tied to normal equity ownership.
As previously reported by crypto.news, Binance recently expanded its tokenized stock lineup while teasing a future SpaceX-linked product. The exchange added tokenized products tied to Circle, Nvidia, Tesla, Micron, and Sandisk as demand for onchain stock exposure increased.
SpaceX IPO draws crypto market attention
SpaceX’s planned listing has become a major focus across crypto markets. Traders have also used pre-IPO perpetual contracts and other tokenized products to gain price exposure before a public listing.
SpaceX’s planned IPO has drawn heavy investor demand, raising questions about whether the listing could pull capital from digital assets, as previously reported. The offering has also driven activity across crypto exchanges offering SpaceX-linked products.
The Binance Wallet subscription data adds another measure of that demand. It shows that tokenized IPO products are drawing both small wallet participation and large capital commitments.
The next focus will be final allocation, token distribution, and how much committed USDC converts into SPCXx tokens. Binance has said the final offering price will be determined after the subscription period ends.


Blockchain is no longer just a story of Wall Street banks and brokers leveraging the technology to optimize finance. Now, corporates are embracing distributed ledger to streamline business operations.
LG Electronics, the South Korean consumer electronics giant spanning TVs, laptops, and home appliances, with annual global revenue of over $60 billion, is building a blockchain-based advertising network and has chosen Arbitrum to help build it out.
LG told Fortune it has developed its own layer-2 blockchain network in collaboration with Arbitrum, a layer 2 protocol that enables low-cost, high-speed transactions on Ethereum.
LG’s move is part of a broader trend of corporations seeing operational potential in blockchain technology. Walmart has used the technology to transform food safety and reduce the time needed to trace a product through its supply chain to just 2.2 seconds, down from over six days. IBM has built blockchain-based supply chain solutions, while Microsoft has integrated blockchain into its Azure cloud platform for enterprise applications.

HashKey Holdings Limited approved a share repurchase plan of up to HK$100 million as its Hong Kong-listed stock rebounded after recent pressure.
Summary
- HashKey approved a HK$100 million buyback using company funds, excluding global offering proceeds from repurchases.
- The buyback runs until the next AGM, with timing and price left to board discretion.
- HashKey shares rose 10.51% to HK$3.05 after trading near their 52-week low recently.
HashKey clears HK$100M buyback plan
HashKey Holdings Limited, listed under stock code 3887, said its board approved an on-market share repurchase plan after the mandate passed at its annual general meeting on June 11, 2026. The company plans to use up to HK$100 million of its own funds for the buyback.
The company said the funds will not include proceeds from its global offering. The repurchase period will run from the approval date until the end of the next annual general meeting.
HashKey said the buyback will follow Hong Kong Stock Exchange listing rules, the Takeovers Code, share buyback rules, Cayman Islands company law, and other rules that apply to the company. The board will decide the timing, size, and price of any repurchases based on market conditions.
The company also warned that the plan does not guarantee that shares will be bought back. It said the board will keep discretion over whether to carry out any repurchases.
Shares rebound after recent pressure
HashKey shares rose 10.51% to HK$3.05 in the latest trading data. The stock had recently traded near its 52-week low, adding attention to the company’s decision to approve a repurchase plan.
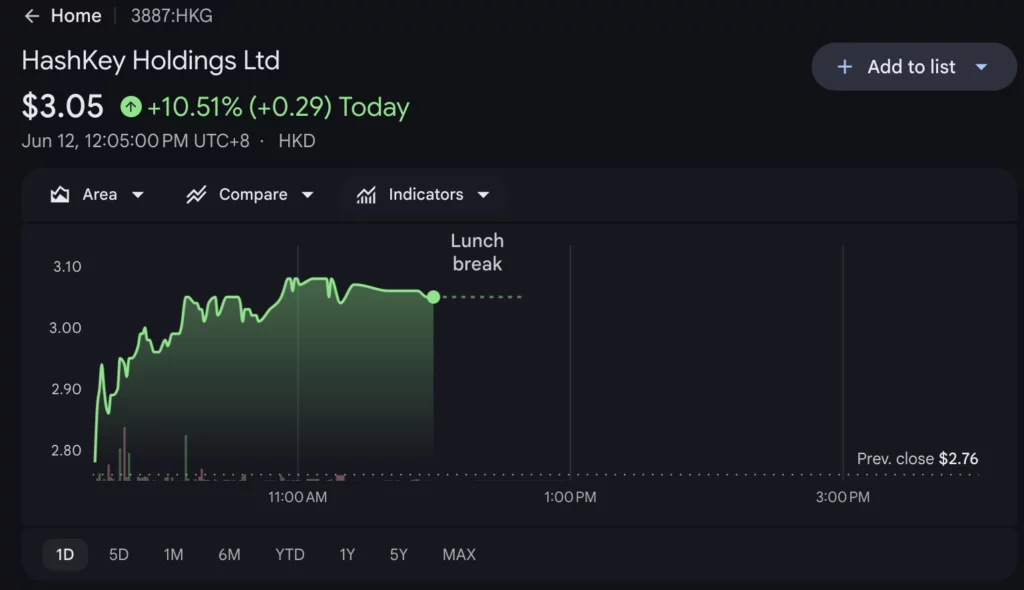
The stock’s latest move followed a weak period for the shares. Recent market data showed HashKey had declined sharply year-to-date before the rebound, while the stock also fell over the past week.
The buyback comes as the company tries to show confidence in its listed shares. “We believe that the current value of the Company’s shares does not fully reflect the Group’s strategic positioning and growth potential in the Web3 digital financial infrastructure space,” said Chairman and Chief Executive Officer Dr. Xiao Feng.
The company said it will fund the buyback from internal resources. That detail is important because it separates the repurchase plan from proceeds raised through the global offering.
Web3 expansion adds context
HashKey is one of Asia’s listed digital asset companies. Its business covers digital asset trading, technology services, investment management, on-chain services, and financial infrastructure.
As previously reported by crypto.news, HashKey launched its Hong Kong IPO with a targeted raise of up to $215 million. The company’s listing came as Hong Kong continued to expand its regulated digital asset market.
HashKey has also remained active after listing. Its asset management arm led a $40 million investment in SignalPlus, a crypto derivatives trading platform, with HashKey Group contributing $20 million in cash.
The group also signed a memorandum of understanding with Oceanus Group to develop stablecoin settlement infrastructure for global trade finance. The partnership targets digital settlement tools for cross-border commerce and trade finance.
Buyback follows Hong Kong crypto push
HashKey’s buyback comes during a wider shift in Hong Kong’s digital asset market. Local regulators have continued to expand rules for licensed crypto platforms, tokenized assets, and stablecoin activity.
As previously reported by crypto.news, Hong Kong has moved to widen crypto licensing and stablecoin rules as part of its 2026-27 financial policy agenda. The city has also supported work around tokenized bonds and regulated digital asset infrastructure.
For HashKey, the buyback places focus on both share performance and capital use. The company must now decide whether market conditions support actual repurchases under the approved mandate.
The plan gives the board room to act while keeping control over timing and price. Investors will watch whether HashKey uses the mandate, and how the stock reacts after its latest rebound.

The risk-off mood that hammered crypto all week is reversing. Bitcoin is back in the green, and the trigger was a sudden de-escalation in the Iran war.
Bitcoin traded at $63,550 on Friday, up 1.6% on the day and 1.4% over the week, per CoinDesk data. Days earlier it had fallen to levels last seen in 2024 – below $60,000 – but has recovered and climbed back to a weekly gain.
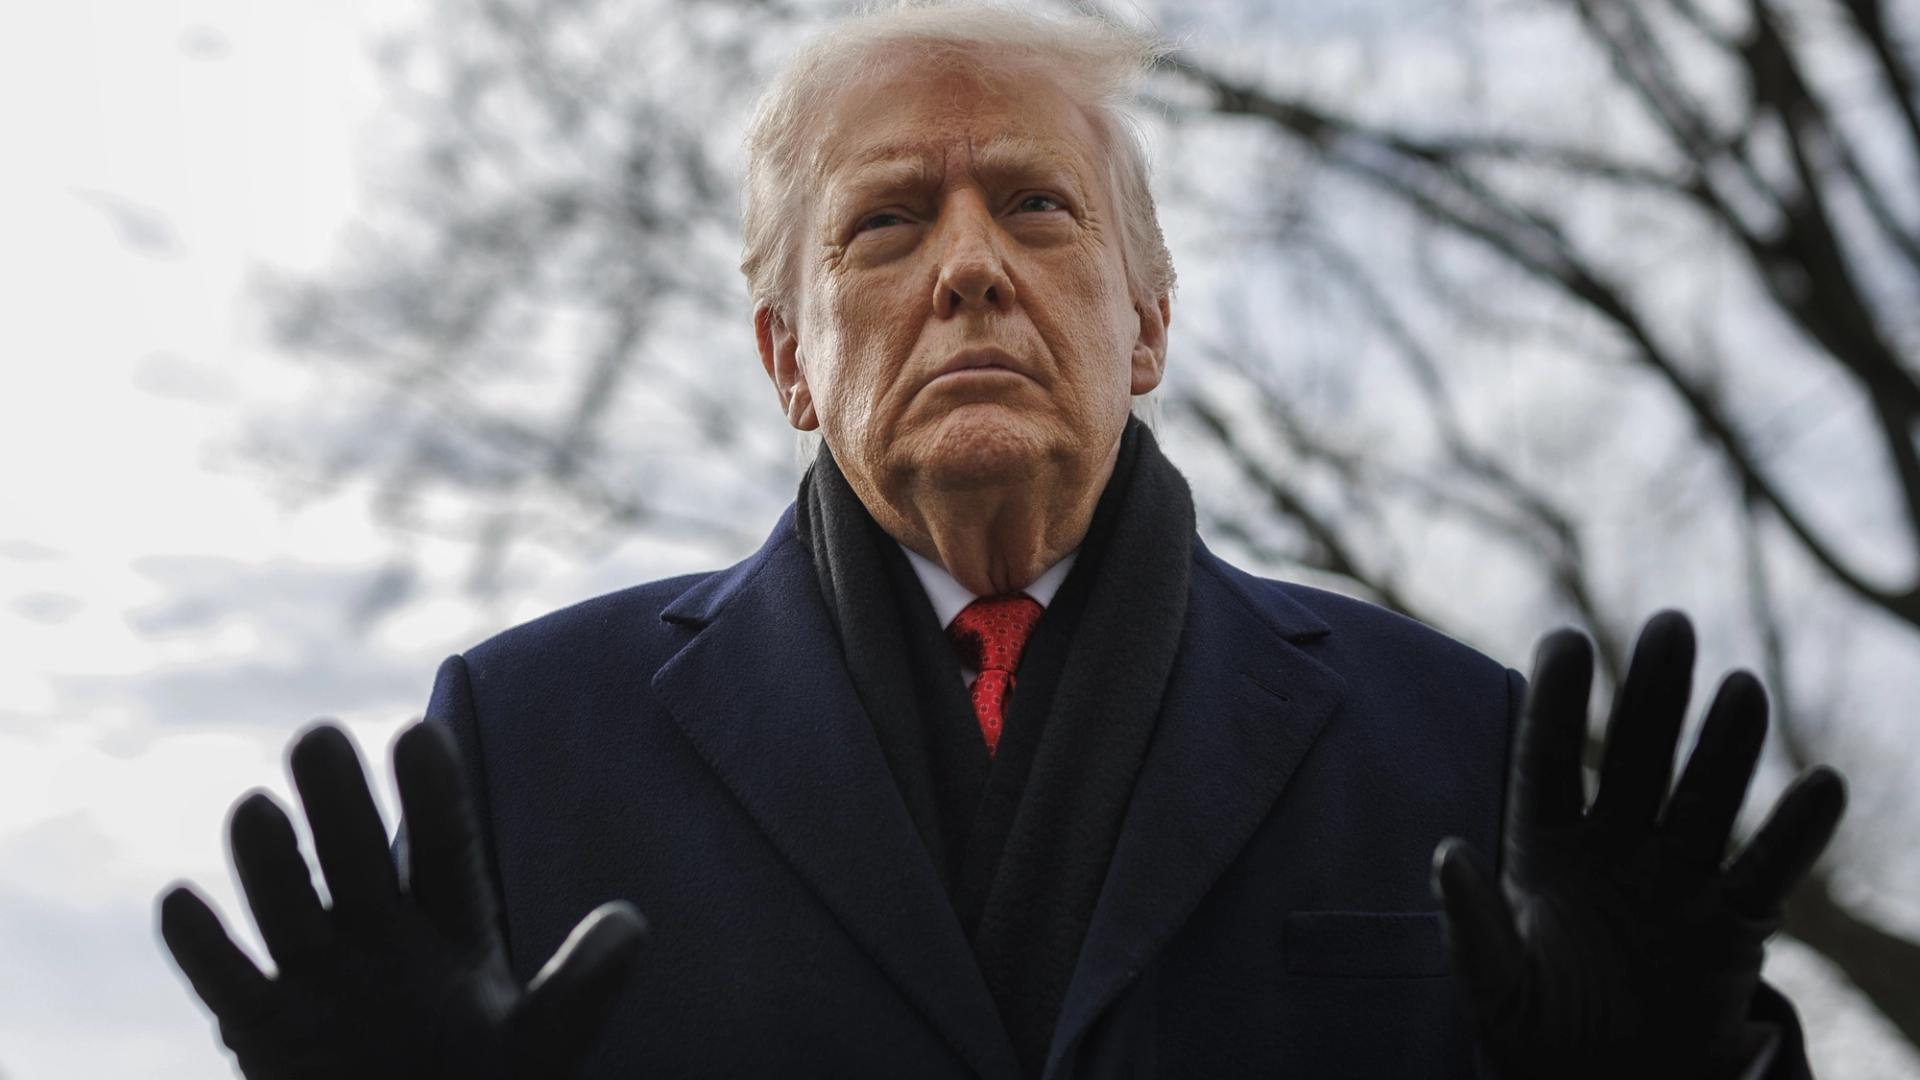
A key catalyst came as President Donald Trump said the US was close to a deal with Iran and that he had “ended the war with Iran today.” Markets read it as the end of a conflict that has whipsawed prices for more than 100 days. Brent crude dropped 2% to about $88.50 a barrel, while gold and silver prices surged.
The move extended to stocks. South Korea’s Kospi, a gauge for AI stocks, rose 8.4%. MSCI’s Asia Pacific index gained 3.5%, its biggest rise in two months. US stock futures pointed higher and European shares were set to open up 1.8%.
Ethereum has bounced back after falling near the $1,500 support level, but the broader market trend for the leading crypto asset remains bearish.
In fact, ETH could still see further downside as an important on-chain metric is gearing up to revisit historically significant territory.
Bottom Signal
Crypto analyst Ali Martinez said Ethereum’s Delta Price metric, created by Alphractal, has successfully identified the last two major ETH market bottoms. The indicator is currently positioned near $700 and measures the relationship between investor cost basis and miner production costs.
According to Martinez, if previous market patterns repeat, Ethereum risks falling toward the $700 range again before beginning its next upward trend.
Despite rising negative sentiment around the asset’s recent price performance, Ethereum’s network growth has continued to accelerate. Data shared by Santiment revealed that the blockchain now has nearly 195 million non-empty wallets, around 230% more than Bitcoin’s 59 million wallets.
According to the analytics platform, the gap between the two networks has steadily expanded across multiple market cycles even as the crowd sentiment fell into extreme fear territory. Ethereum is now only about 5 million wallets away from reaching the 200 million milestone.
Santiment attributed much of the network’s growth to Ethereum’s strong presence in DeFi, staking, and broader on-chain activity, where users actively engage with applications instead of only holding tokens.
ETH OI On Binance
Meanwhile, derivatives market activity around Ethereum has also started showing signs of recovery. While Ethereum recently entered deeply oversold territory, some traders have viewed this as an opportunity and started increasing their exposure to the asset through futures markets. CryptoQuant observed that Binance recently recorded a new all-time high in Ethereum open interest measured in ETH terms, with nearly 3.7 million ETH currently tied to futures contracts on the exchange.
As a result, Binance now accounts for more than 44% of total Ethereum open interest. Meanwhile, Binance’s weekly average Taker Buy/Sell Ratio climbed from 0.95 to 1.0, which indicates that traders are gradually moving back toward buying activity after months of stronger selling pressure in Ethereum futures markets.
The post Ethereum (ETH) Could Crash to This Level Before Next Bull Run, Says Analyst appeared first on CryptoPotato.
TLDR:
- Litecoin has fallen over 20% in a week as traders monitor support near the $40 level.
- Joao Wedson says LTC lost key on-chain levels, with $34 and $29 now in focus.
- Futures open interest dropped from $411 million to $283 million, reflecting weaker trader activity.
- LitVM and Nexus Wallet developments continue attracting attention despite ongoing market weakness.
Litecoin (LTC) remains under pressure as the broader cryptocurrency market struggles with weak sentiment and declining investor participation.
The digital asset recently traded near $42.55, following a steep weekly decline of more than 20%. Market participants are closely watching whether current price levels represent an accumulation period or the beginning of a deeper correction.
Litecoin Technical Structure Remains Under Pressure
Recent market data points to growing bearish sentiment around Litecoin. Analysts have warned that the asset is approaching a critical area near the $40 level. A break below that zone could expose LTC to further downside in the near term.
Crypto analyst Joao Wedson addressed Litecoin’s market structure in a recent post on X. According to Wedson, LTC has underperformed most major altcoins and has already lost several important on-chain support levels. He noted that the next major areas of interest sit around $34 and $29.
Wedson also stated that large holders have increased short pressure on Litecoin during recent weeks. He added that LTC has historically experienced aggressive bear market cycles.
During those periods, the asset often traded below key support levels before entering longer accumulation phases.
At the same time, derivatives market activity continues to weaken. Litecoin futures open interest has dropped to approximately $283 million from a previous peak of $411 million. The decline suggests that many leveraged traders have reduced their exposure as market conditions deteriorated.
Market sentiment within derivatives platforms has also shifted. The long-to-short ratio recently fell to 0.88, indicating that bearish positions currently outweigh bullish ones. As a result, traders remain cautious while monitoring broader market movements.
Ecosystem Development Continues Despite Market Weakness
Although price action remains weak, Litecoin’s development ecosystem continues to attract attention. One of the most discussed initiatives is LitVM, a planned smart contract layer designed to bring decentralized finance functionality to the Litecoin network.
Supporters believe the project could expand Litecoin’s utility beyond payments. While the technology is still under development, community discussions surrounding LitVM remain active despite the current market downturn.
Meanwhile, Litecoin’s merged mining relationship with Dogecoin continues to provide network security benefits.
The arrangement allows miners to secure both networks simultaneously, helping maintain stable incentives for mining participants. Developers are also paying close attention to recent updates involving the Nexus Wallet.
The wallet improvements have generated renewed interest among community members who support Litecoin’s merchant-focused use cases. Those developments have helped maintain engagement even as market prices move lower.
For now, traders are focused on broader cryptocurrency market conditions. Litecoin’s near-term direction may depend heavily on Bitcoin’s ability to stabilize after recent volatility.
A stronger market environment could help support recovery efforts across major digital assets. Until clearer signals emerge, market participants are expected to remain focused on key support levels, derivatives activity, and ongoing ecosystem developments.
Those factors will likely shape Litecoin’s next major move as investors assess whether the current decline reflects an accumulation period or continued market weakness.
Ripple has announced an important development concerning users in South America.
The firm is expanding its partnership with Bitso to bring MXNB, Bitso’s Mexican peso-backed stablecoin, to the XRP Ledger for enterprise settlement.
As part of the collaboration, MXNB will be integrated into Ripple’s Payments on Decentralized Exchange infrastructure. The asset will work together with RLUSD – the firm’s dollar-backed stablecoin- and will support cross-border liquidity between the US dollar and the Mexican peso.
It also builds on Ripple and Bitso’s long-running payments relationship in Latin America, as Bitso now serves over 10 million users.
Stablecoin Liquidity Takes Center Stage
The main purpose of the collaboration is to make enterprise payments between the US and Mexico more efficient. MXNB is designed to give institutions peso-denominated liquidity on-chain, while RLUSD will provide the dollar side of the settlement.
Commenting on the matter was Silvio Pegado, Ripple’s Managing Director of Latam, who said:
“Ripple and Bitso have spent years building payment infrastructure that operates at real-world scale across Latin America. […] By bringing together RLUSD and MXNB on the XRPL Permissioned DEX, we’re helping create regulated, onchain liquidity infrastructure purpose-built for enterprise cross-border payments. This is the next evolution of how value moves between dollars and pesos.”
The development also provides RLUSD with additional real-world payment context. As CryptoPotato reported, Mastercard recently expanded its stablecoin strategy to include assets such as RLUSD, USDC, USDG, PYUSD, USDP, and more across networks including Ripple’s XRPL, Ethereum, Solana, Base, etc.
That broader push shows that stablecoins are being positioned for settlement and payment infrastructure more so than just crypto trading.
By the way, this is a point we discussed at length in our recent interview with BitGo’s COO. You can find it here.
XRPL Upgrade Gives More Ecosystem Context
It’s also worth noting that the announcement comes right as the XRPL Ledger approaches a notable technical upgrade – version 3.2.0.
It’s expected to reduce node memory usage by around 40%, improve network efficiency, and rebrand the core server software to “xrpld.”
The next thing to watch would be if more enterprises start using MXNB and RLUSD for live settlement flows across the US and Mexico.
The post Important Ripple (XRP) Announcement, June 11 appeared first on CryptoPotato.

Avalanche Treasury Co. had a weak first trading session on Nasdaq as its stock closed sharply lower under the ticker AVAT.
Summary
- AVAT closed 38.13% lower as investors priced Avalanche exposure through a new Nasdaq-listed treasury vehicle.
- Avalanche Treasury holds about 15 million AVAX while the token remains near early 2021 levels.
- AVAX traded at $6.64, with monthly losses keeping pressure on ecosystem-linked public market shares.
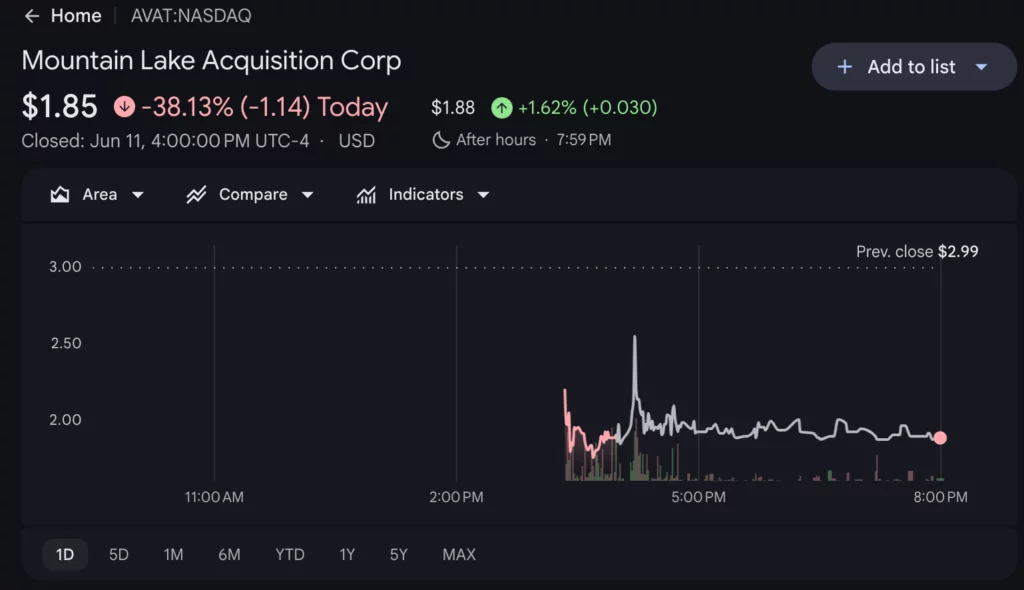
Avalanche Treasury Co. closed at $1.85 on Thursday, down 38.13% in its Nasdaq debut. Google Finance data showed the stock opened at $2.99, reached a high of $3.00, and fell as low as $1.75 during the session.
The stock later moved to $1.88 in after-hours trading, up 1.62%. Volume stood near 497,580 shares, while the company’s market value was listed at about $486.37 million.
The listing followed Avalanche Treasury’s merger with Mountain Lake Acquisition Corp., a SPAC transaction valued at about $675 million. The company now trades as a public market vehicle tied to the Avalanche ecosystem.
Company says it is not just holding AVAX
Avalanche Treasury Co. said it aims to give public market investors exposure to Avalanche without requiring them to hold the AVAX token directly. The company is structured as an operating company and digital asset treasury.
Chief Executive Bart Smith said the company plans to put capital to work across the Avalanche ecosystem. He said, “It is not a bet on price,” framing the company as an ecosystem investment vehicle rather than a passive token holder.
The company is backed by investors and industry names including Dragonfly, ParaFi Capital, VanEck, Galaxy Digital, Pantera Capital, CoinFund, Kraken, FalconX, and Borderless. Its board and advisory group also includes Ava Labs founder Emin Gün Sirer and Aave founder Stani Kulechov.
Avalanche Treasury holds about 15 million AVAX tokens, equal to roughly 3.5% of circulating supply. That gives the company direct exposure to AVAX price moves while also leaving room for staking, infrastructure, and ecosystem investments.
AVAX price remains under pressure
AVAX traded near $6.64 on June 12, according to crypto.news market data. The token was up 2.09% over 24 hours, but remained down 13.02% over seven days and 33.3% over the past month.
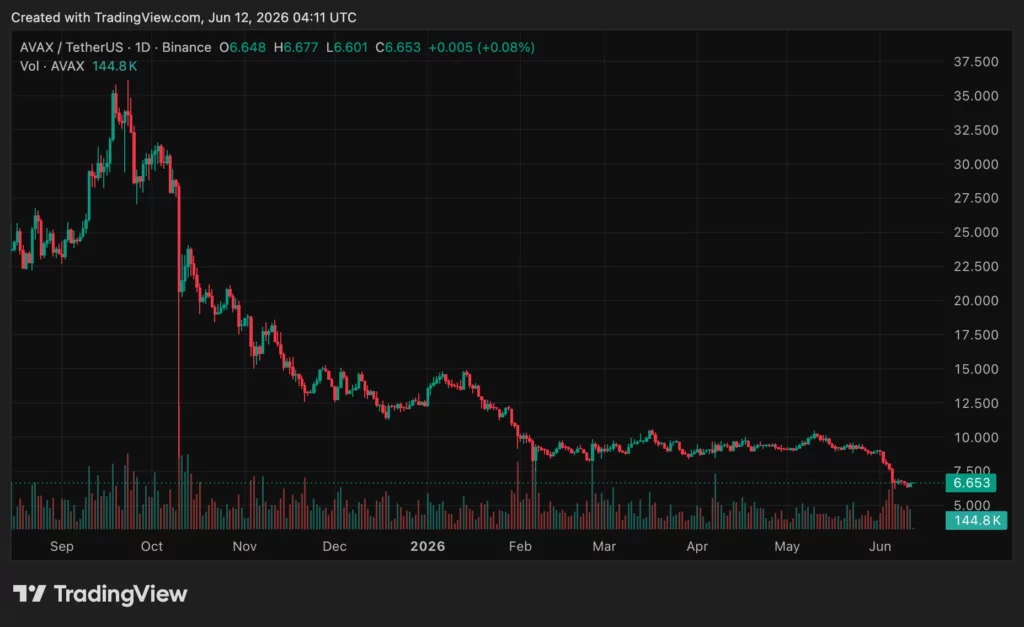
The token’s 24-hour trading volume stood at about $184.9 million, while its market cap was near $2.87 billion. AVAX traded between $6.48 and $6.67 over the latest 24-hour period.
The token remains far below its November 2021 all-time high of $144.96. Current data shows AVAX is still down more than 95% from that peak, keeping pressure on companies linked to its market value.
Earlier market reports showed AVAX had fallen to levels last seen in early 2021 after a wider crypto liquidation wave. That backdrop made AVAT’s first trading session harder, as investors weighed both the company’s structure and the token’s weak trend.
Treasury firms face a harder market
AVAT’s debut comes as digital asset treasury firms face a tougher market. These companies have tried to offer public equity exposure to crypto assets, but falling token prices have tested investor demand.
Recent crypto.news reporting also showed pressure around BitMine’s Ethereum treasury strategy. BitMine moved to raise $300 million through preferred stock while market conditions continued to challenge crypto-linked public companies.
Avalanche Treasury is trying to separate itself from simple token-holding vehicles. Its model depends on active capital use across the Avalanche network, not only the value of AVAX on its balance sheet.
The first trading session showed that investors remain cautious. AVAT now has to prove that a listed Avalanche treasury can create value during a weak altcoin market.

‘A kind gentleman anonymously paid for our meal in York’

Sea Swift amends contracts after ACCC action

LG Electronics, Arbitrum Launch Blockchain Ad Network


-

 Fashion6 days ago
Weekend Open Thread: Evereve – Corporette.com
-
 Crypto World7 days ago
Jensen Huang Approves Samsung, SK Hynix, and Micron for NVIDIA (NVDA) HBM4 Memory Supply
-
 Entertainment5 days ago
The Best Mystery Series of All Time Is Surging on Streaming 30 Years After It Ended
-

 NewsBeat4 days ago
Alexander Zverev wins the French Open to finally earn a 1st Grand Slam title
-

 Crypto World4 days ago
Anatomy of the June crypto crash: Fed, Iran, Saylor
-

 Tech6 days ago
Suspicious Polyfill login prompts pop up on Toshiba, Muji websites
-
Crypto World5 days ago
Senator Cynthia Lummis Calls CLARITY Act the Most Consequential Financial Legislation of This Generation
-

 Tech7 days ago
Microsoft launches MXC, an OS-level sandbox for AI agents, with OpenAI and Nvidia already on board
-

 Tech5 days ago
Microsoft unveils seven homegrown AI models in new bid for ‘long term self-sufficiency’
-

 Business7 days ago
(VIDEO) Justin Bieber Delivers Surprise Happy Birthday Serenade to Diners at Los Angeles Mexican Restaurant
-
 NewsBeat4 days ago
Alexander Zverev conquers demons and outlasts Flavio Cobolli to win French Open for first major title
-

 Business4 days ago
High Stakes for Wembanyama as New York Pushes for 3-0 Lead
-

 Tech6 days ago
Von der Leyen’s AI envoy pick draws conflict-of-interest fire
-
 Business5 days ago
The Pain Points Taking a Fragile Tech Rally Down a Notch
-
 Crypto World4 days ago
Eli Lilly (LLY) Stock Surges 4% Following Breakthrough Sleep Apnea Trial Results
-

 Tech7 days ago
Meta steals a tactic from Tesla and builds data centers in tents
-

 Tech6 days ago
Hackers now exploit SolarWinds Serv-U flaw to crash servers
-
Crypto World7 days ago
LBank Surpasses 25 Million Users Worldwide as AFA Partnership Continues to Drive Global Growth
-

 Crypto World5 days ago
Trump’s AI Ownership Plan Could Benefit Anthropic at OpenAI’s Expense
-

 Tech4 days ago
Notion restores access to Anthropic after service disruption
You must be logged in to post a comment Login