
Crypto World
bonding curves, Pump.fun, and the math behind rug pulls



Most meme coin guides explain culture and community. This one explains plumbing: the bonding curve formula that sets the price, the graduation threshold that moves a token to a real exchange, and the arithmetic that shows why the vast majority of buyers lose money before a single meme goes viral.
Summary
- A bonding curve is a smart contract that mints tokens on demand and prices each successive unit higher than the last, removing the need for a traditional order book or market maker.
- Pump.fun, the largest meme coin launchpad, allocates 800 million of each token’s one billion supply to its bonding curve and graduates the token to a decentralized exchange once the curve accumulates roughly 85 SOL.
- Fewer than two percent of all tokens launched on Pump.fun ever reach graduation, meaning the bonding curve itself is where the overwhelming majority of trading activity and losses occur.
- A rug pull on a bonding curve platform does not require removing liquidity in the traditional sense; it requires only that insiders accumulate tokens cheaply at the bottom of the curve and sell into the buying pressure of later arrivals.
- The math of any convex bonding curve guarantees that late buyers pay exponentially more per token than early buyers, creating a structural transfer of value from latecomers to early participants regardless of the creator’s intentions.
The popular narrative frames meme coins as jokes that accidentally made money. The reality is more mechanical than that. Every meme coin that trades on a launchpad like Pump.fun follows an identical mathematical structure, and that structure determines who profits and who loses before a single holder posts a rocket emoji. Understanding the bonding curve, the graduation process, and the wallet concentration patterns that precede most collapses is not optional for anyone putting capital into this market.
What a bonding curve actually does
A bonding curve is a pricing function embedded in a smart contract. When a buyer sends SOL to the contract, the contract mints new tokens and sends them to the buyer at a price determined by how many tokens have already been sold. When a seller sends tokens back, the contract burns them and returns SOL at the current curve price.
The simplest version of the formula is:
Price = k * (supply sold)^n
In this equation, k is a scaling constant and n determines the steepness of the curve. When n equals 1, the price rises linearly with each token sold. When n is greater than 1, the price rises exponentially, meaning the gap between what early buyers paid and what late buyers pay widens dramatically as more tokens enter circulation.
The critical property is that the contract itself holds the reserve. There is no counterparty. The SOL that buyers send in sits inside the contract and is available for sellers to withdraw when they sell back. This creates automatic liquidity at every price point on the curve, which is why bonding curve tokens can trade immediately after creation without anyone needing to seed a liquidity pool.
The tradeoff is that this liquidity is thin by design. Because the price is a function of cumulative supply, even a moderately sized sell order pushes the price significantly lower. The contract guarantees you can sell, but it does not guarantee the price at which you sell will resemble the price at which you bought.
How Pump.fun structures a token launch
Pump.fun, which launched on Solana in January 2024, standardized the meme coin creation process into a single transaction. A creator pays a small fee, names the token, uploads an image, and the platform deploys a bonding curve contract with fixed parameters.
Every Pump.fun token has the same structure:
Total supply: 1 billion tokens. No exceptions.
Bonding curve allocation: 800 million tokens go into the curve. These are the tokens available for purchase during the pre-graduation phase.
Graduation reserve: 200 million tokens are held back. These tokens, along with the SOL accumulated in the curve, form the initial liquidity pool when the token graduates.
Graduation threshold: The bonding curve completes when it accumulates approximately 85 SOL from purchases. At that point, the token “graduates” and migrates to PumpSwap, the platform’s own automated market maker. Before March 2025, graduation sent tokens to Raydium, a third-party decentralized exchange.
Fee: Pump.fun charges a one percent fee on every trade that occurs on the bonding curve. This fee alone generated hundreds of millions of dollars in revenue during the platform’s first year of operation.
The standardization is the key innovation. Because every token uses identical contract parameters, buyers do not need to audit the smart contract for hidden functions. The risk surface shifts entirely from the contract code to the market dynamics and wallet distribution.
The graduation bottleneck
The graduation threshold is where theory meets reality. Reaching 85 SOL of cumulative purchases sounds modest, but the graduation rate tells a different story.
Across the millions of tokens launched on Pump.fun since January 2024, fewer than two percent have ever reached graduation. The remaining 98 percent die on the bonding curve, meaning they never accumulate enough buying pressure to migrate to a real trading venue.
For the tokens that do graduate, the transition creates a structural shift. On the bonding curve, the contract itself provides liquidity. After graduation, liquidity depends on the pool seeded by the 200 million reserved tokens and the accumulated SOL. If the pool is small relative to the holders who want to sell, slippage on exit can be severe.
The graduation event often triggers the first wave of selling. Early buyers who entered at the bottom of the curve now hold tokens that have appreciated by orders of magnitude. Many of them sell into the post-graduation liquidity, which pushes the price down and traps later buyers who entered near the top of the curve expecting graduation to be a catalyst for further appreciation.
The arithmetic of who wins and who loses
The bonding curve’s convex shape creates a mathematical certainty: the average buyer loses money.
Consider a simplified example. Suppose a token’s bonding curve prices the first 100 million tokens at 0.000001 SOL each and the last 100 million tokens at 0.0001 SOL each, a 100x increase. The first buyer spends 0.1 SOL and receives 100 million tokens. The last buyer spends 10 SOL and receives 100 million tokens.
Both buyers hold the same number of tokens, but the last buyer paid 100 times more. If the price settles anywhere below the last buyer’s entry, the last buyer is underwater. The first buyer can sell at any price above 0.000001 SOL and turn a profit.
Scale this across thousands of buyers, and the pattern becomes clear: the bonding curve redistributes value from late buyers to early buyers. This is not a bug. It is the intended function of the mechanism. The curve incentivizes early participation by rewarding those who take risk when the token has no community, no narrative, and no trading volume.
The problem is that the people who benefit most from this structure are often the creators themselves and their associates, who can buy at the absolute bottom of the curve in the same block that the token is deployed.
Now extend the arithmetic to the total SOL deposited into the curve. If the curve accumulates 85 SOL before graduation, that 85 SOL is the total capital base supporting all token holders. But the token’s implied market capitalization at the graduation price is much higher than 85 SOL, because the market cap is calculated by multiplying the last traded price by the total supply. The difference between the implied market cap and the actual SOL in the contract is the gap that makes exits painful. There is not enough SOL in the system for every holder to sell at the last traded price. Someone must sell at a loss for anyone else to sell at a profit. The bonding curve does not create wealth. It redistributes the SOL that buyers deposited, minus the platform’s one percent fee on every trade.
How rug pulls work on bonding curve platforms
A traditional rug pull involves a creator removing liquidity from a decentralized exchange pool, leaving holders with tokens that cannot be sold. Bonding curve platforms change this dynamic.
On Pump.fun, the bonding curve contract is standardized and the creator cannot modify it after deployment. There is no liquidity to remove during the curve phase because the contract itself is the liquidity. This leads many buyers to assume they are safe from rug pulls on bonding curve platforms. They are not.
The modern meme coin rug pull has three common forms:
Insider accumulation. The creator or a coordinated group buys a large percentage of the available supply at the bottom of the curve using multiple wallets. Because early curve prices are near zero, acquiring 20 to 30 percent of the supply costs very little SOL. The insiders then promote the token on social media, driving external buyers onto the curve. As the price rises, the insiders sell their holdings back into the curve or on the post-graduation DEX, extracting the SOL that later buyers deposited.
Bundled launches. A creator deploys the token and purchases a large allocation in the same transaction or the same block, ensuring no one else can buy before them. On-chain analysis tools can detect bundled transactions, but most retail buyers do not check before buying.
Post-graduation dump. After a token graduates, the creator’s reserved allocation or accumulated holdings are sold into the DEX liquidity pool. Because post-graduation pools are typically small, concentrated selling can drain the pool and crash the price in seconds. The token remains technically tradable, but at a fraction of its graduation price.
None of these require the creator to insert malicious code into the contract. The standardized contract is functioning exactly as designed. The extraction happens through market dynamics, not technical exploits.
On-chain signals that precede most collapses
The advantage of bonding curve platforms is that every transaction is public. The disadvantage is that most buyers never look at the data.
Several on-chain patterns consistently appear before meme coin collapses:
Wallet concentration. If the top 10 wallets (excluding the bonding curve contract) hold more than 30 percent of the circulating supply, the token is structurally fragile. A coordinated sell from those wallets will overwhelm available liquidity.
Creator wallet activity. Check whether the deployer wallet or wallets funded by the same source have already begun selling. Blockchain explorers and dedicated meme coin analytics tools show wallet funding trees, which reveal when multiple “independent” buyers are actually controlled by the same entity.
Velocity of new holders. A sudden spike in new holders driven by a single social media post or influencer promotion, followed by a plateau, suggests the buying pressure is temporary. Sustainable price action on bonding curve tokens typically shows a steady accumulation of holders, not a single burst.
Time between deployment and significant volume. Tokens that see large buy volume in the first minutes after deployment often have coordinated insider buying. Organic discovery of a new token rarely happens within the first block.
Social media timing. Compare when the first large purchases appeared on-chain with when the first promotional posts appeared on social media. If the wallet accumulation predates the promotion by hours or days, the promotion is likely a distribution event, not a discovery event.
What this does not cover
This guide explains the mechanics of bonding curves, launchpad economics, and the market dynamics that produce losses. It does not cover:
- Tax treatment of meme coin profits and losses, which varies by jurisdiction and is evolving rapidly.
- The social and cultural dynamics that determine which meme coins attract attention. Virality is real and valuable, but it is not a mechanical process that can be analyzed the same way as a bonding curve.
- Cross-chain meme coin platforms on Ethereum, Base, or other networks. The core bonding curve mechanics are similar, but fee structures, graduation thresholds, and DEX integrations differ.
- Celebrity and influencer token launches, which follow the same bonding curve mechanics but carry additional reputational and legal considerations that are outside the scope of this guide.
Practical checks before buying any meme coin
Before sending SOL to a bonding curve, run these checks:
Check the holder distribution. Use a Solana block explorer or a meme coin analytics dashboard to see how many wallets hold what percentage of the supply. If the distribution is heavily concentrated, the risk of a coordinated dump is high.
Check for bundled transactions. Look at the token’s first few transactions. If the creator’s wallet or wallets funded from the same source bought a large portion of the supply in the deployment block, the launch was not organic.
Check the creator’s history. Most launchpad platforms track the creator wallet’s previous deployments. If the wallet has launched dozens of tokens that all collapsed shortly after, the pattern speaks for itself.
Check the curve position. Understand where on the bonding curve the current price sits. If the curve is 70 percent filled, you are paying prices much higher than early buyers. The remaining upside before graduation may not justify the risk relative to what you would lose if the curve reverses.
Set a loss limit before buying. Bonding curve tokens can lose 80 percent of their value in minutes. Decide before purchasing how much you are willing to lose, and sell if the token hits that level. The curve guarantees you can sell; it does not guarantee you will want to.
Understand your position on the curve. The percentage of the bonding curve that has been filled tells you where you sit in the queue of buyers. If you are buying when the curve is 90 percent full, nearly all of the upside between the initial price and the graduation price has already been captured by earlier buyers. Your potential gain is limited to whatever premium the market assigns after graduation, minus the slippage you will face when selling into post-graduation liquidity.
What to watch
Regulatory attention to launchpad platforms. The SEC and international regulators have not yet taken formal action against bonding curve launchpads, but the volume of trading and the frequency of losses make regulatory scrutiny increasingly likely.
Platform fee changes. Pump.fun’s one percent trading fee is a significant revenue source. Changes to this fee, or the introduction of new fee structures on competing platforms, would alter the economics of token creation and trading.
Graduation destination changes. The shift from Raydium to PumpSwap in March 2025 changed where post-graduation liquidity lives. Further changes to graduation mechanics or liquidity seeding would affect the risk profile of tokens that reach the threshold.
Anti-bundling tools. Several analytics platforms now flag bundled launches automatically. As these tools improve and become more widely used, the effectiveness of insider accumulation strategies may decrease, though new evasion methods will likely follow.
Cross-chain competition. Bonding curve launchpads on Base, Ethereum, and other chains are gaining volume. Fragmentation of meme coin trading across chains affects liquidity depth and graduation dynamics on every platform.
What is a bonding curve in meme coin trading?
A bonding curve is a mathematical formula embedded in a smart contract that sets the price of a token based on how many tokens have been sold. As more tokens are purchased, the price rises along the curve. As tokens are sold back, the price falls. The contract itself holds the reserve currency (typically SOL) and provides automatic liquidity at every point on the curve.
How does Pump.fun work?
Pump.fun is a meme coin launchpad on Solana where anyone can create a token by paying a small fee. The platform deploys a standardized bonding curve contract with a fixed supply of one billion tokens, 800 million of which go into the curve. When purchases accumulate roughly 85 SOL, the token graduates to PumpSwap, a decentralized exchange, where it begins trading with traditional pool-based liquidity.
What does it mean when a meme coin graduates?
Graduation is the moment when a bonding curve token accumulates enough buying volume to migrate from the launchpad’s internal trading mechanism to a decentralized exchange. On Pump.fun, this happens at approximately 85 SOL. After graduation, the token trades in a standard liquidity pool, which changes the liquidity dynamics and price behavior.
Why do most meme coins fail?
Fewer than two percent of tokens launched on Pump.fun reach graduation. Most tokens fail because they never attract enough buying interest to fill the bonding curve. Without sustained demand, the price stalls or declines as early buyers sell, and the token becomes effectively abandoned while still technically tradable at near-zero prices.
Can you get rug pulled on Pump.fun?
Yes. While Pump.fun uses standardized contracts that prevent the creator from modifying the code or removing liquidity from the bonding curve, rug pulls still occur through market manipulation. Insiders buy large allocations at the bottom of the curve, promote the token to attract external buyers, and then sell their holdings into the rising price, extracting the capital that later buyers deposited.
How can you spot a meme coin rug pull before it happens?
Check the holder distribution for concentration in a few wallets, look for bundled transactions in the deployment block, review the creator wallet’s history of previous launches, and examine whether early buying activity appears coordinated. None of these signals guarantee a rug pull is imminent, but their presence significantly increases the probability.
What is the difference between a bonding curve and a liquidity pool?
A bonding curve uses a mathematical formula to mint and burn tokens, with the contract itself acting as the sole counterparty. A liquidity pool pairs two tokens in a smart contract, and the price is determined by the ratio of tokens in the pool. Bonding curves provide liquidity from the moment of creation without external providers, while liquidity pools require someone to deposit both tokens before trading can begin.
Is buying early on a bonding curve a guaranteed way to profit?
No. Buying early means you pay a lower price per token, but the token must attract enough subsequent buyers to push the price above your entry before you can profit. Since over 98 percent of bonding curve tokens never reach graduation, the most common outcome for early buyers is that the token attracts minimal interest and their investment approaches zero. Early entry improves the odds relative to late entry, but the base rate of failure is extremely high.
This article is for informational purposes only and does not constitute financial, investment, or legal advice. Meme coin trading carries extreme risk, including the potential for total loss of capital. Always conduct your own research before making any investment decision. Information current as of August 4, 2026.

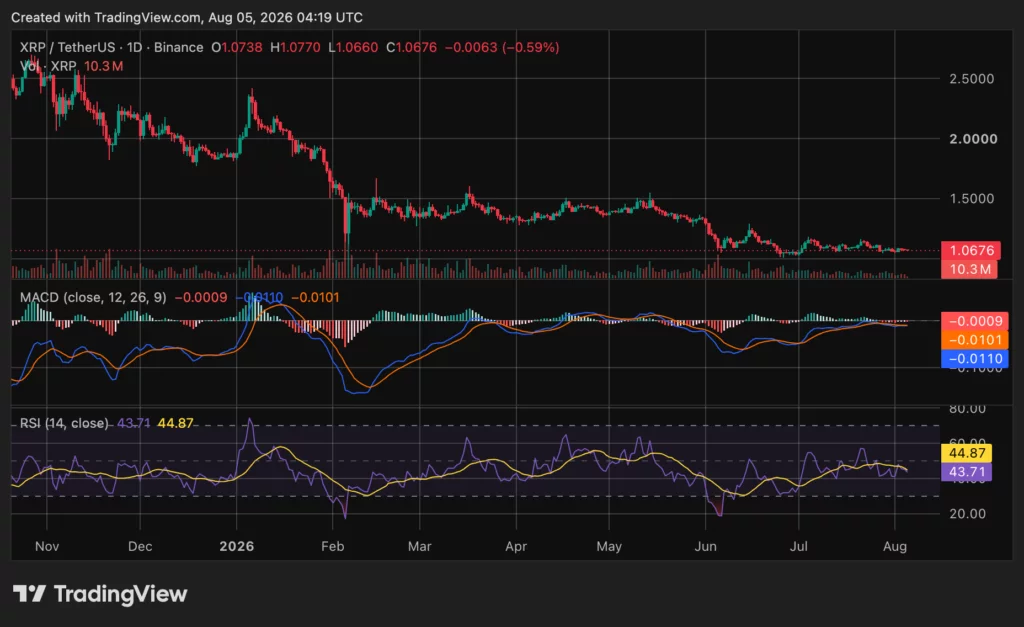
XRP extended its decline on Aug. 5, 2026, trading near $1.07 as buyers struggled to move the token away from its lower range.
Summary
- XRP trades near $1.07 as weak momentum keeps the token pinned above crucial technical support.
- CoinGlass data shows open interest near $2.25 billion after leveraged positions continued unwinding across exchanges.
- CryptoQuant sees balanced liquidations and neutral funding, suggesting positioning reset rather than forced capitulation currently.
- U.S. spot XRP ETFs reportedly logged four consecutive inflow days despite the token’s weak price.
- A sustained break below $1.05 could expose $1.00, while $1.10 remains the first recovery hurdle.
crypto.news data showed XRP down about 0.9% over 24 hours, with trading volume near $911.7 million and market capitalization around $66.7 billion. XRP remained the sixth largest cryptocurrency.
The decline left XRP close to the $1.05 to $1.06 area that has repeatedly attracted buyers since late June. However, momentum indicators, spot flows and derivatives positioning offer little evidence of a confirmed recovery.
The current setup is not a typical liquidation collapse. Leverage has declined, funding remains close to neutral and liquidations have been relatively balanced. These conditions may reduce the risk of an immediate forced selloff, but they also show that traders have limited conviction in a rebound.
XRP price remains trapped near its lower range
The supplied XRP/USDT daily chart shows a broad decline from above $2.50 to around $1.0676. Recent candles have formed a narrow consolidation close to the bottom of that move. XRP has not established a sustained recovery above $1.10, leaving the short term structure weak.
The relative strength index stood at 43.71, below both the neutral 50 level and its moving average of 44.87. The reading shows that buying momentum remains limited, although XRP has not entered deeply oversold territory on the daily chart.
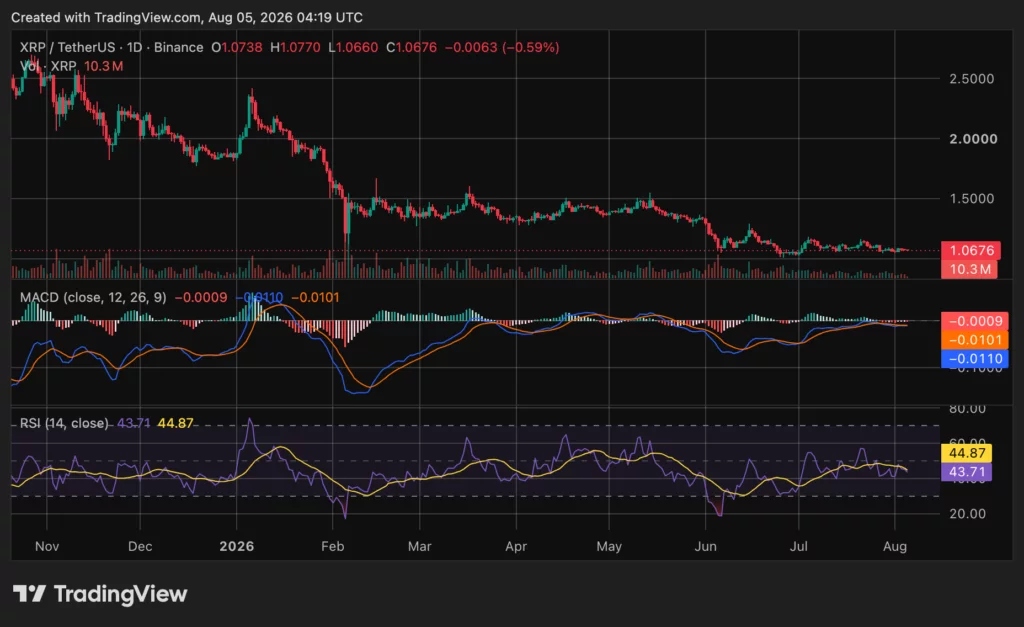
MACD also remains mildly bearish. The MACD line was near negative 0.0110, below the signal line around negative 0.0101. The histogram remained slightly negative at about negative 0.0009. The small difference between the lines points to weak downside momentum rather than a sharp acceleration.
The immediate technical test sits between $1.05 and $1.06. A daily close below that range could expose the psychological $1 level and the late June lows around $1.01. XRP briefly broke the $1.05 area on July 28 before buyers returned. The earlier decline also pushed the four hour RSI into oversold territory, but that reading did not create a lasting reversal.
A recovery above $1.10 would provide the first evidence that buyers are regaining control. XRP would then need to clear the $1.13 to $1.15 region, which has repeatedly limited advances since June.
Analyst Ali Charts described $1.06 as the deciding level. His upside estimates of “$1.35 and $1.64” depend on XRP holding support and confirming a recovery. His downside levels of “$0.80 and potentially $0.62” require a clear breakdown. Neither path has been confirmed.
Other social media forecasts calling for “$23” or “$50+” are highly speculative. Those targets sit far above the current price and are not supported by present momentum, verified institutional forecasts or an established breakout structure.
Lower leverage points to a quiet positioning reset
CoinGlass data showed XRP futures volume near $1.35 billion and total derivatives open interest around $2.25 billion at the time of reporting. The price on the platform stood near $1.067. The supplied data snapshot showed volume falling 10.27% and open interest declining 5.59% over 24 hours.
Falling price and falling open interest usually mean traders are closing positions rather than adding aggressive new shorts. This can reduce the fuel available for large liquidation driven moves. It does not, however, establish that spot buyers are ready to take control.
A separate CryptoQuant analysis found that its XRP open interest measure had fallen into a six month range low between 362 million and 369 million. The estimated leverage ratio also declined toward 0.139 to 0.142, close to the lowest reading during the same period.
CryptoQuant contributor CryptoOnchain also noted that funding remained between roughly negative 0.009 and positive 0.010 during the latest decline. Long and short liquidations alternated rather than producing a one sided cascade. The analyst interpreted the structure as a positioning reset rather than forced capitulation.
Network valuation also compressed faster than reported transaction activity. CryptoOnchain said the network value to transactions ratio fell 42.7% compared with its three month average, while transaction count declined 23.3%. This may indicate that market valuation weakened faster than ledger usage, but it does not provide a reliable timing signal for a price reversal.
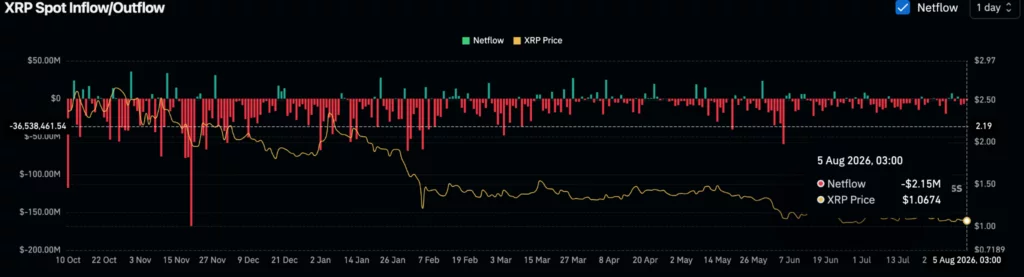
The supplied CoinGlass spot flow chart recorded a net outflow of about $2.15 million on Aug. 5. Recent negative readings have been smaller than the large outflow spikes recorded in late 2025. Selling pressure appears less intense, but sustained positive flow would offer stronger evidence that demand is improving.
U.S. XRP demand has not produced a breakout
U.S. spot XRP exchange traded funds have continued attracting capital despite weak price performance. Recent flow data reportedly showed four consecutive inflow sessions totaling about $15.4 million.
XRP nevertheless remained near $1.08 during that period, showing that the purchases were not large enough to overcome selling elsewhere in the market.
As crypto.news reported in an earlier analysis, five U.S. spot XRP funds launched between November and December 2025 and had attracted roughly $1.5 billion by mid 2026. The funds created a new regulated source of demand, but XRP remained confined to a range around $1.00 to $1.13.
This divergence suggests that ETF inflows alone have not been enough to change the wider trend. Fund purchases must compete with token sales, exchange activity, derivatives hedging and weaker demand across offshore spot markets.
Regulated derivatives activity provides another U.S. market signal. CME Group data showed activity across its standard XRP futures contracts, while the settlement page listed prior day open interest of 6,894 contracts. CME contract data cannot be compared directly with CoinGlass totals because the products use different contract sizes and reporting methods.
The legal risk surrounding Ripple has also changed. The SEC and Ripple dismissed their appeals in August 2025. The district court’s final judgment remained in force, including a $125.04 million penalty and an injunction concerning future registration violations. The dismissal removed the active appeal, but it did not erase the court’s findings involving Ripple’s institutional sales. The SEC litigation release confirms that status.
Wider U.S. legislation remains unresolved. The CLARITY Act has reached the Senate calendar, but it still requires sufficient floor support, reconciliation with other legislative text and presidential approval. Seven Democratic senators said in July that the Republican proposal still fell short on several matters, and no final Senate vote had been confirmed by Aug. 5.
A confirmed vote or renewed delay could influence sentiment toward XRP and other U.S. traded digital assets. It would not, by itself, guarantee a sustained price move.
Ripple developments have not changed near term momentum
Ripple announced strategic investments in ZILO and Licuido on Aug. 3. The companies plan to add transfer agency, token issuance, trading and collateral tools to Ripple’s institutional infrastructure on the XRP Ledger. Ripple did not disclose the investment amounts or financial targets. The official company announcement described RLUSD as a settlement asset for tokenized fund transactions.
As crypto.news reported in related coverage, the investments support Ripple’s broader move into tokenized capital markets. They have not yet produced disclosed revenue, transaction volume or XRP demand that can be tied directly to the token’s price.
The XRP Ledger also faced a validator manifest flood in late July. Developers released xrpld version 3.2.1 to restrict the processing and storage of untrusted manifests. The ledger continued closing normally, and no confirmed loss of funds or altered transactions was reported. Node operators were urged to install the update.
The next price signal will likely come from the market itself. Traders will watch whether XRP can hold $1.05, reclaim $1.10 and build stronger volume above $1.15. Open interest should also stabilize without price making new lows. Continued ETF inflows would be more constructive if they coincide with positive spot flows and stronger momentum.
A break below $1.05 would keep $1.00 exposed. A confirmed daily recovery above $1.15 would weaken the immediate bearish structure. Until either event occurs, XRP remains in a low conviction range with reduced leverage and limited bullish confirmation.
FAQs
Is XRP oversold?
Not on the supplied daily chart. Its RSI near 43.71 remains below neutral but above the conventional oversold level of 30. Shorter time frames have reached oversold readings during recent declines, although those readings did not confirm a lasting bottom.
Does falling open interest support an XRP recovery?
It can reduce liquidation risk because fewer leveraged positions remain open. A recovery still requires stronger spot demand, improving momentum and price confirmation above resistance.
Why have XRP ETF inflows not lifted the price?
ETF demand represents only one part of the market. It can be offset by direct token selling, hedging, weak offshore demand and distributions from existing holders.
What are the main XRP levels to watch?
The immediate support range is $1.05 to $1.06, followed by $1.00. Initial resistance sits near $1.10, with stronger confirmation required above $1.13 to $1.15.
Disclosure: This article does not represent investment advice. The content and materials featured on this page are for educational purposes only.
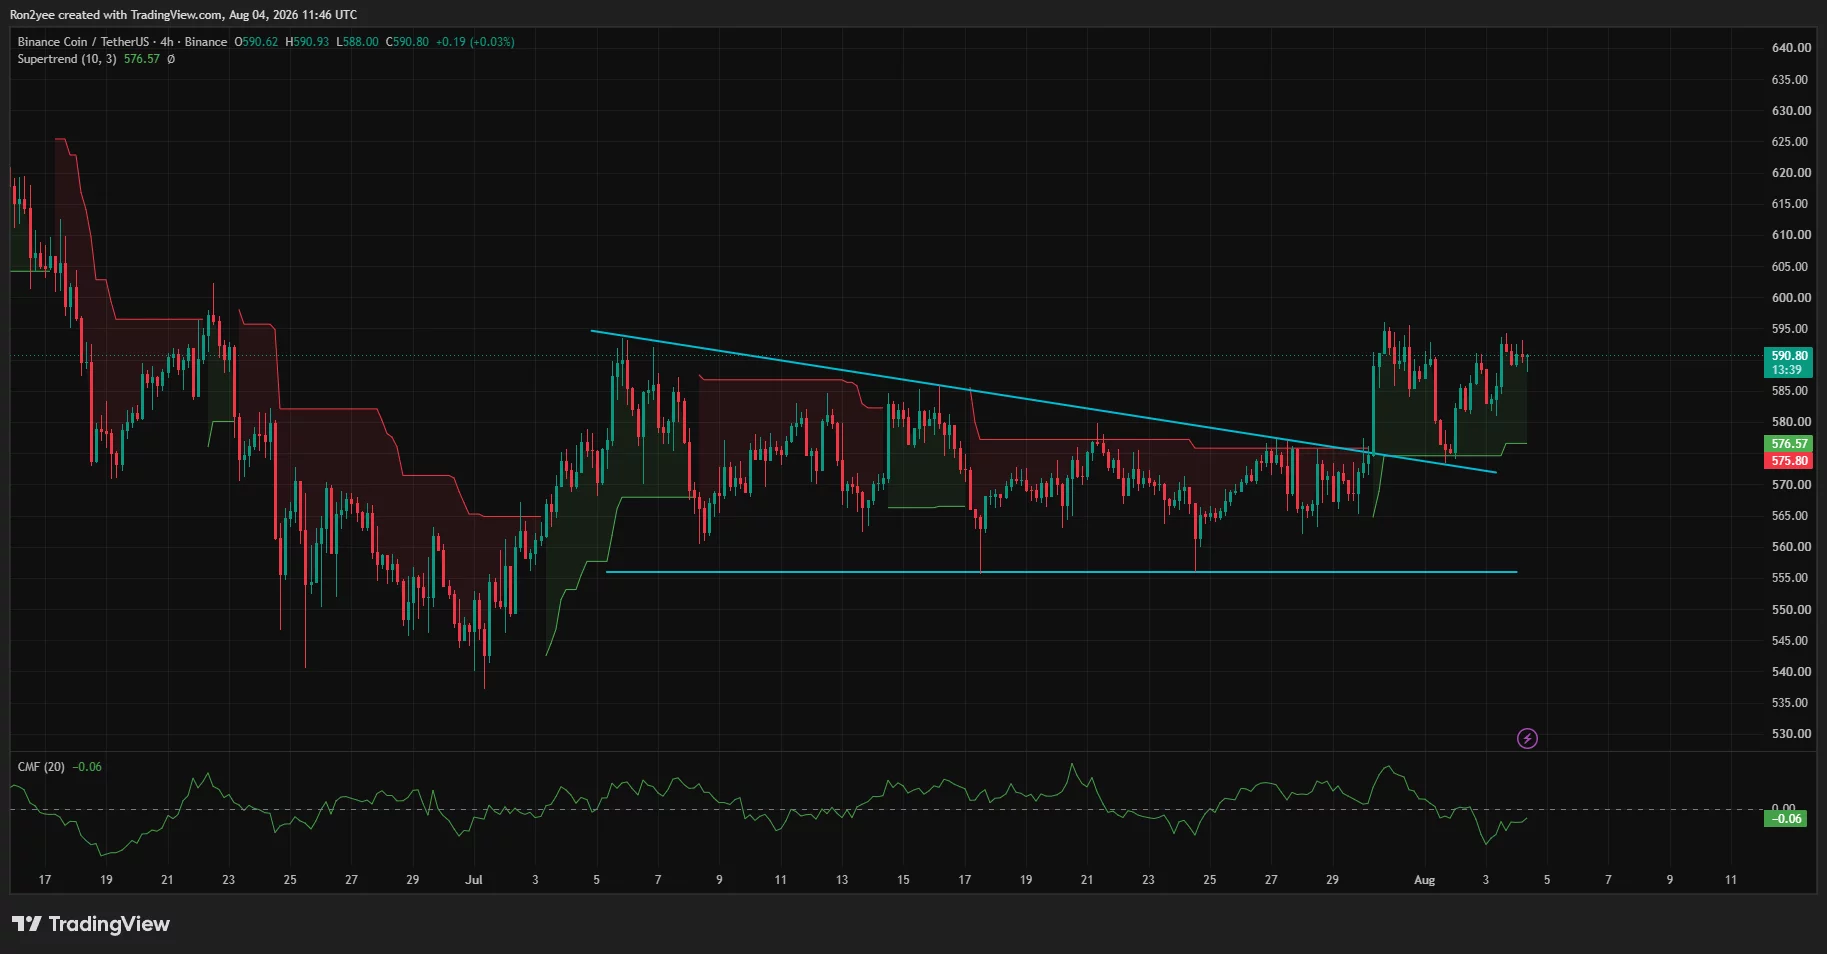
BNB price traded near $590 on Tuesday after holding a trendline breakout, but resistance at $592 and a large liquidation cluster above $605 could decide its next move.
Summary
- BNB price broke above a descending trendline and successfully retested the former resistance as support.
- The daily RSI has risen to 57.45, while the MACD remains in bullish territory.
- $592 to $600 is the immediate resistance zone separating BNB from a larger recovery.
- The liquidation heatmap shows concentrated short liquidity around $605 to $610.
BNB price holds breakout above $581
According to data from crypto.news, BNB (BNB) price was trading at $590.10 at press time after moving between $588 and $593.09 during the daily session. The token has gained roughly 4% over the past week, recovering from a recent low near $566.
The 4-hour chart shows that BNB broke above a descending trendline that had capped its recovery since early July. Buyers then defended a retest near $576 before pushing the price back toward $590.
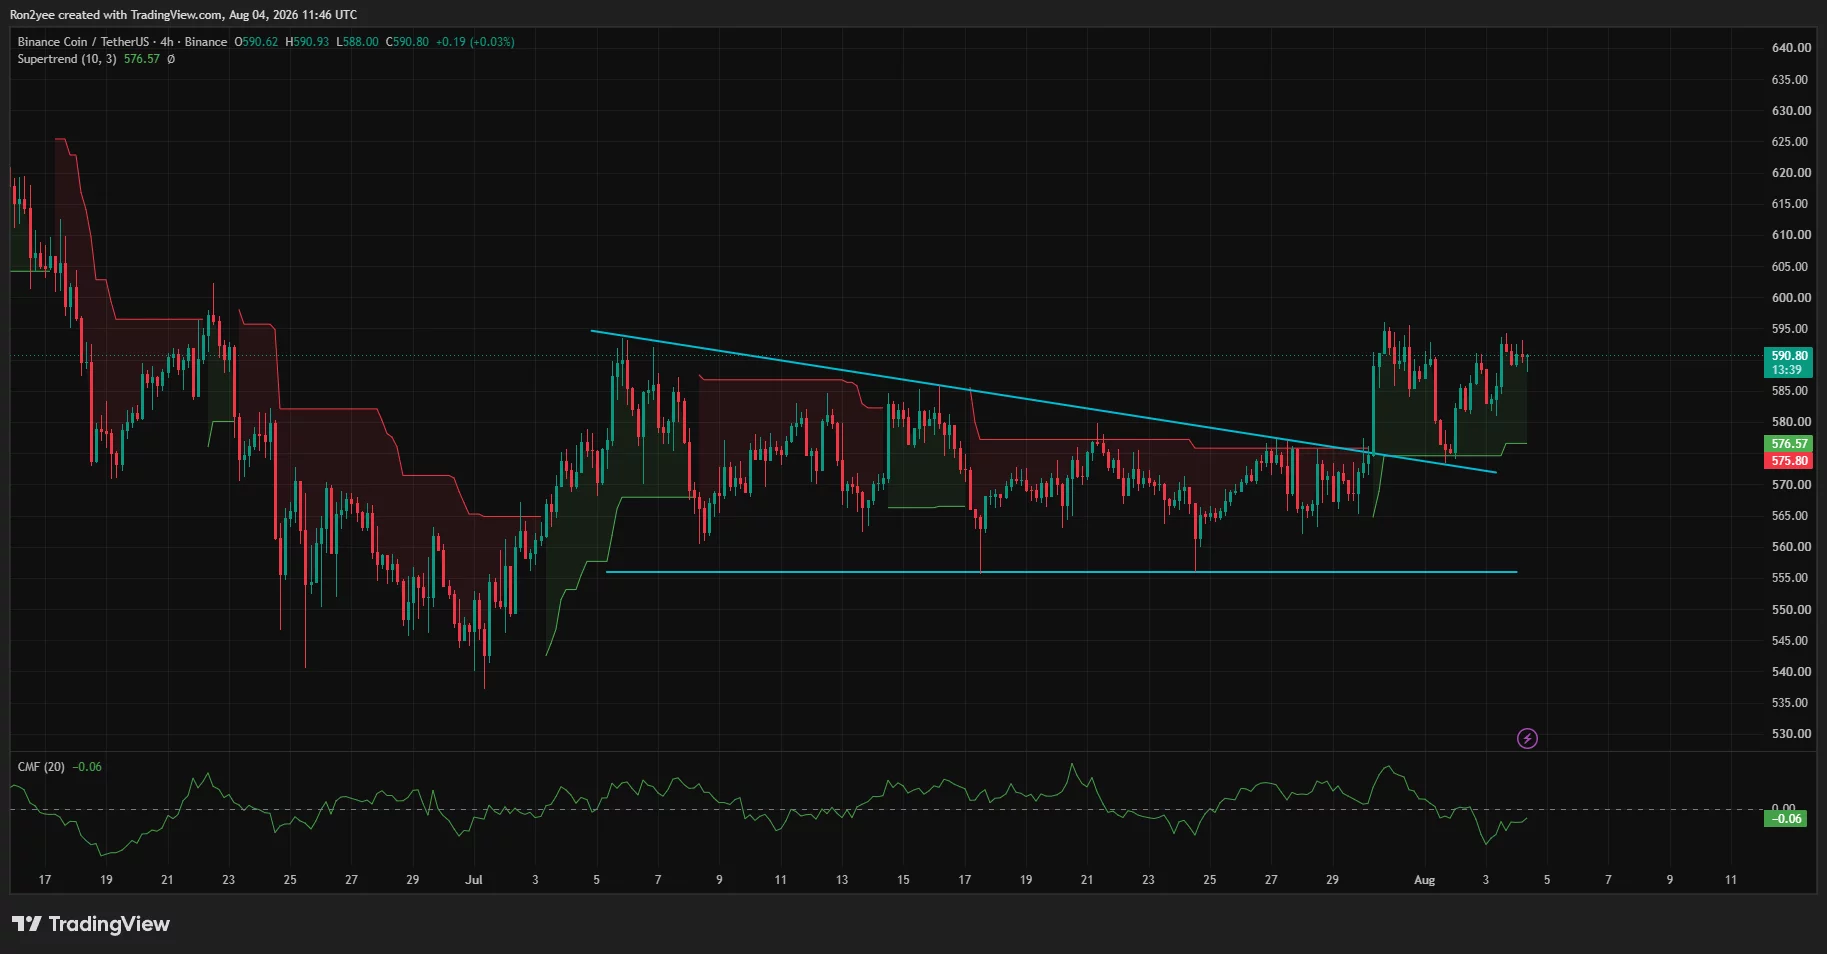
This sequence converted the former trendline resistance into short-term support. BNB also remains above the 4-hour Supertrend, currently positioned near $576.57, keeping the short-term structure bullish.
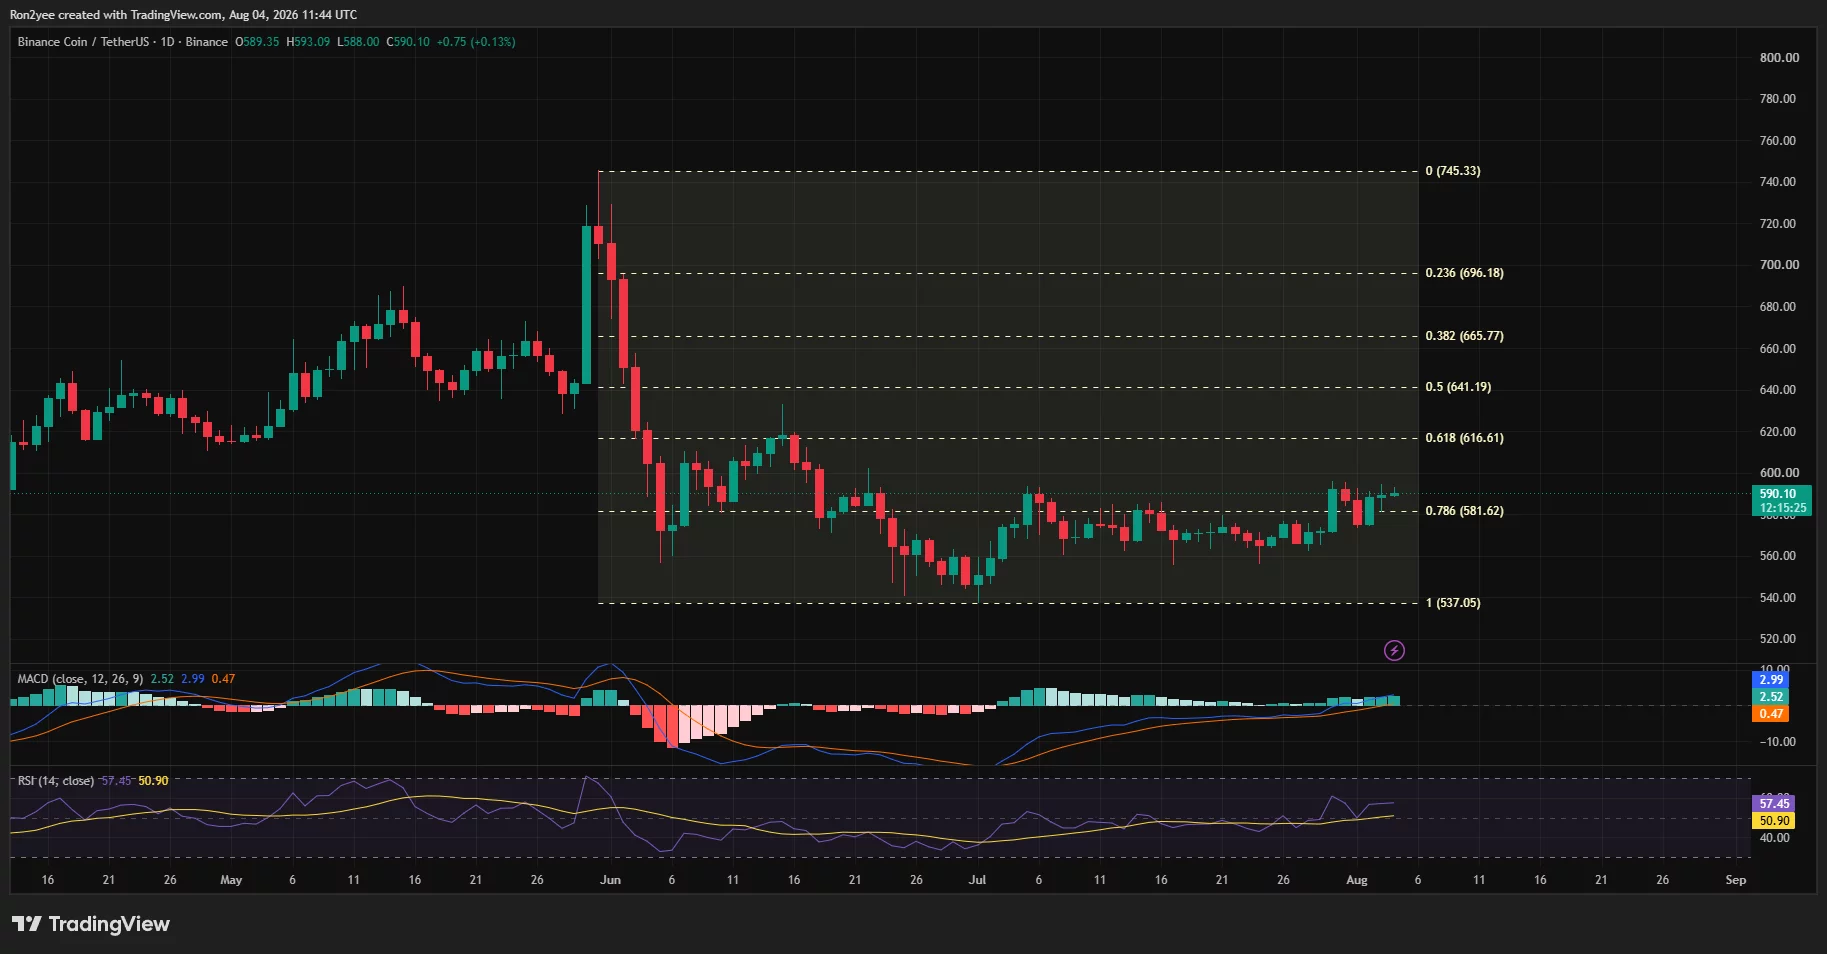
The daily chart provides another important level at $581.62. This marks the 78.6% Fibonacci retracement of BNB’s decline from $745.33 to $537.05. Holding above it strengthens the breakout, while a daily close below the level would weaken the current setup.
However, the Chaikin Money Flow reading on the 4-hour chart remains at -0.06. This shows that capital inflows have not fully confirmed the price recovery, leaving the move vulnerable if buying volume fades.
What is driving the BNB move?
Rising network activity has supported BNB’s recovery. BNB Chain recorded approximately $19 billion in weekly decentralized exchange volume, placing it ahead of Ethereum and Solana during the measured period.
Network utilization also increased from roughly 17% to almost 30%. Higher activity can support demand for BNB because the token is used to pay transaction fees and deploy contracts across the network.
The chain’s latest quarterly burn provides a longer-term supply tailwind. BNB Chain removed approximately 1.62 million BNB, worth about $932 million at the time, during its 36th quarterly burn in July. The reduction left the total supply near 133.17 million BNB.
These fundamentals have helped BNB outperform a largely range-bound altcoin market. Still, the immediate move appears primarily technical, following the confirmed breakout and retest visible on the 4-hour chart.
$592 could decide whether BNB reaches $616
BNB is now testing $592, a level that has repeatedly acted as resistance during 2026. The token briefly traded above this area but has yet to establish a decisive daily close beyond it.
A confirmed break above $592 would bring the $600 psychological barrier into focus. The one-week liquidation heatmap shows the largest nearby concentration of leveraged positions between $605 and $610.
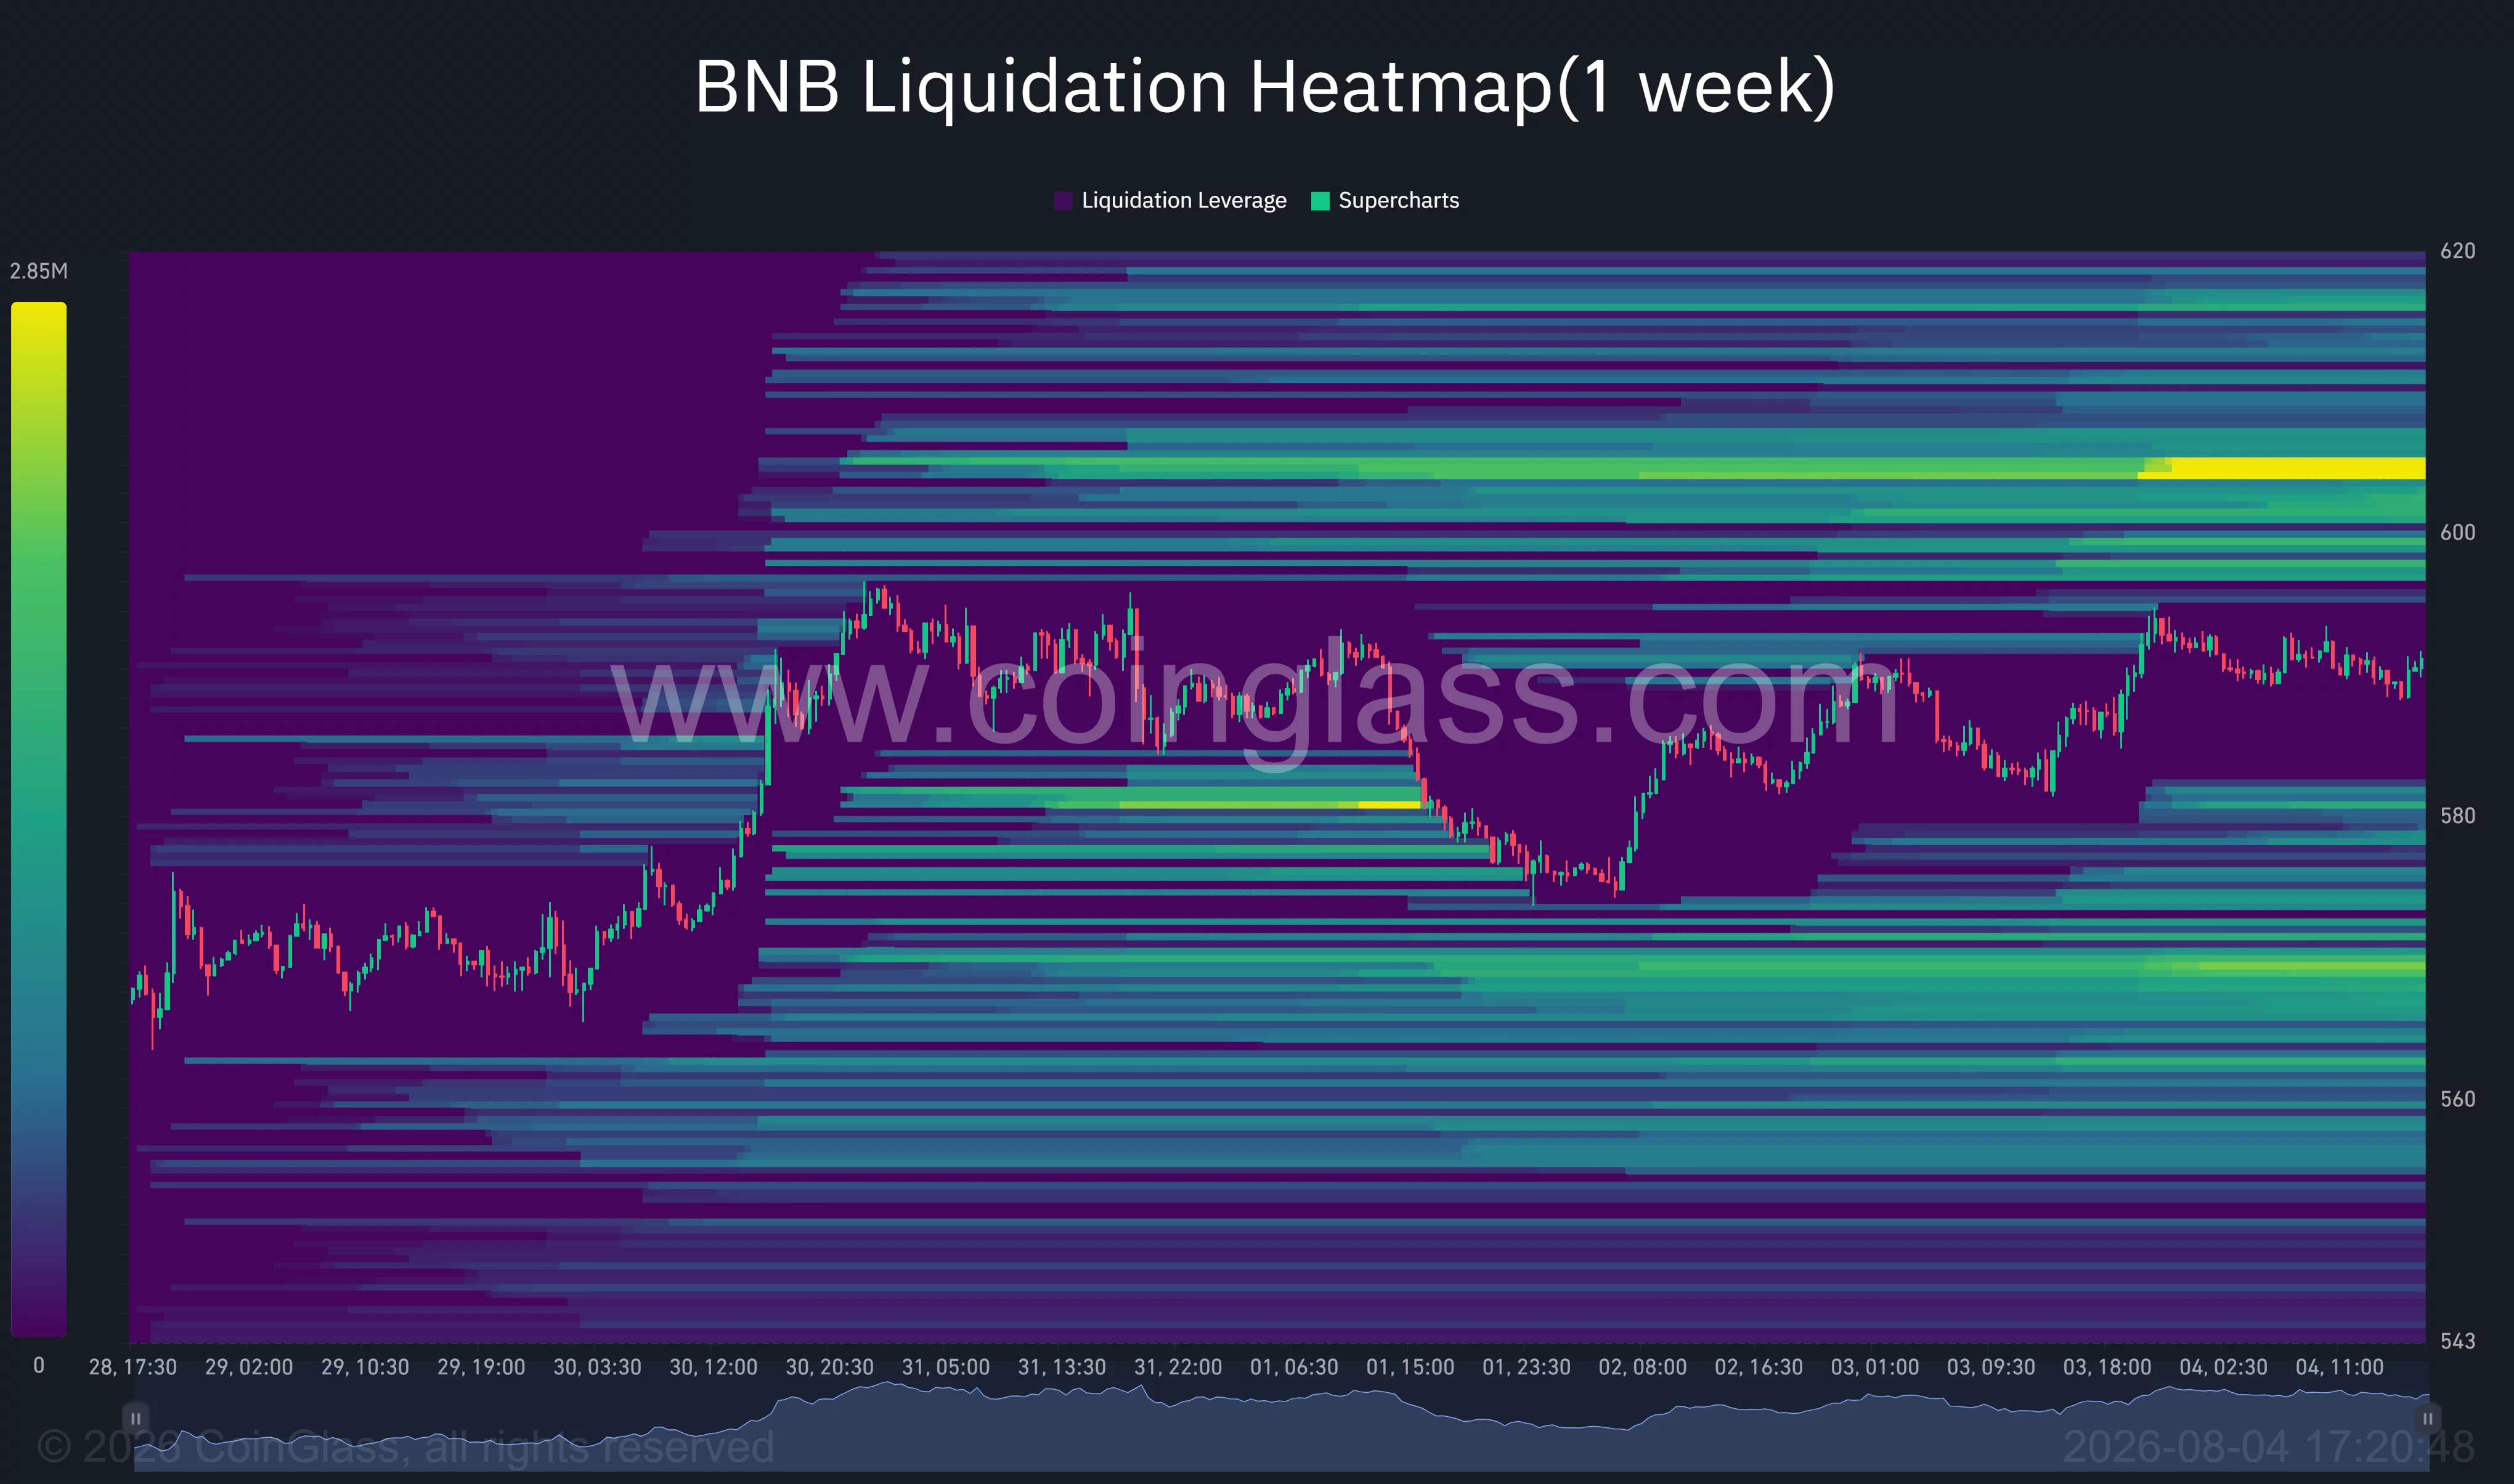
If BNB moves into that range, forced short liquidations could add buying pressure and accelerate the advance. The next chart-based target would then sit at $616.61, corresponding to the 61.8% Fibonacci retracement.
Beyond $616, the daily chart identifies additional resistance at $641.19 and $665.77. Those targets would require stronger spot demand because BNB would be moving into a broader supply zone created during its June decline.
The daily MACD supports the bullish case. The MACD line remains above its signal line, while the positive histogram stands near 0.47. RSI has climbed to 57.45, above its moving average of 50.90 but still below overbought territory.
Analysts see the retest as bullish confirmation
Crypto analyst Batman said BNB had reclaimed its 50-day moving average and successfully retested the breakout zone.
“This opens up a big move ahead,” the analyst wrote.
Satoshi Stacker also identified $592 as the key level separating a broader uptrend from a temporary recovery. The analyst said flipping that resistance into support would strengthen the case that BNB has moved beyond a relief bounce.
The bearish scenario begins if BNB fails at $592 and loses $581.62. In that case, the 4-hour Supertrend area between $575.80 and $576.57 would provide the next support.
Below that zone, the liquidation heatmap shows liquidity around $567, while the 4-hour chart places major horizontal support near $556. A break beneath $556 would invalidate the current higher-low structure and expose the daily range floor around $537.
US liquidity remains the main external risk
For US investors, BNB’s breakout remains sensitive to broader dollar liquidity and Federal Reserve expectations. Higher Treasury yields or a renewed risk-off move could limit demand for altcoins even if BNB Chain activity remains strong.
Geopolitical pressure and elevated oil prices add to that risk by keeping inflation concerns active. If those conditions push US rate expectations higher, BNB may struggle to attract enough capital for a sustained move through $600.
For now, the technical structure favors buyers while BNB remains above $581.62. A daily close above $592 would improve the probability of a move toward the $605–$616 region, while a loss of $576 would return the token to its previous consolidation range.
Disclosure: This article does not represent investment advice. The content and materials featured on this page are for educational purposes only.


Western Union and stablecoin payments company Rain launched Stablecard on Aug. 4, giving customers in 37 markets a way to receive, hold and spend Western Union’s USDPT stablecoin.
Summary
- 37 markets now offer Western Union Stablecard access, with expansion targeting more than 60 markets.
- USDPT remittances can fund a Visa card for spending online, in stores, or at ATMs.
- Anchorage Digital Bank issues USDPT on Solana and publishes monthly independent reserve attestation reports online.
- Western Union’s second quarter digital transactions rose 25%, supporting its wider shift toward digital services.
- Solana Explorer showed 5.92 million USDPT outstanding, above the amount covered by June’s attestation report.
The product combines a digital wallet with a Visa card and is available through dedicated applications on Apple’s App Store and Google Play.
USDPT is issued by Anchorage Digital Bank on Solana and is redeemable at a one to one rate for U.S. dollars. Customers can receive eligible Western Union transfers into the Stablecard wallet, transfer USDPT from compatible wallets or exchanges, and spend through Visa merchants or ATMs.
The companies did not identify every launch market in their announcements. Western Union said it is “targeting 60+ markets by the end of the year,” making that figure a planned expansion rather than current availability. Access, fees and individual features will depend on local rules and geographic requirements.
Western Union Stablecard connects USDPT to Visa spending
The official Western Union announcement describes Stablecard as a way to receive funds, retain their value in USDPT and spend through Visa without first moving the balance into a conventional bank account. Customers can also add the virtual card to Apple Pay or Google Pay.
The application gives users several funding routes. They can transfer USDPT from a supported crypto wallet or exchange, or use a “Cash Redirect” feature to move an eligible Western Union remittance into Stablecard. The store listings say users must complete identity verification, although they do not need a credit check or minimum balance.
Users can still access cash through ATMs or participating Western Union locations. However, the applications warn that ATM charges, foreign exchange costs and other fees may apply. The card is issued through a third party, Nimbus LLC, doing business as Third National, according to the store disclosures.
The consumer launch follows USDPT’s May introduction. As crypto.news reported, Western Union initially positioned the token as an always available settlement asset for agents, partners and future customer products. Stablecard now adds a direct spending function to that infrastructure.
Rain provides the wallet, card and compliance layer
Rain built the mobile application, embedded wallet and card infrastructure supporting the product. Its Stablecard case study says its Visa programs can operate at more than 175 million merchant locations across over 200 countries and territories.
Rain also argues that stablecoin settlement could reduce Western Union’s reliance on prefunded bank accounts. Remittance companies traditionally place money in local accounts before customers request payouts. Rain says USDPT could allow capital to move when demand arises rather than remaining idle for days. This is Rain’s assessment of the expected operating benefits. Western Union has not disclosed realized savings from Stablecard.
Rain’s social media statement that “$100B a year for 100M customers is moving onchain” needs context. Its longer case study uses those figures to describe Western Union’s existing annual network scale. It does not say that all $100 billion has already migrated to Solana or Stablecard. Neither company released transaction volume, active user numbers or revenue for the new product.
The launch arrives as Western Union’s digital channel grows faster than its retail operation. The company’s second quarter results showed branded digital revenue rising 7% and digital transactions increasing 25% from a year earlier. Digital activity represented 32% of consumer money transfer revenue and 43% of transactions.
Western Union’s total quarterly revenue nevertheless declined 1% to about $1 billion. Management cited weakness in the Americas retail business, lower margins and higher expenses. Stablecard therefore forms part of a broader effort to grow digital services while the legacy retail operation faces pressure.
U.S. oversight gives USDPT a regulated structure
Anchorage Digital Bank, a national trust bank overseen by the Office of the Comptroller of the Currency, issues and redeems USDPT. Western Union says reserves can include bank deposits, U.S. Treasury bills and similar cash equivalents. The official Solana contract address is published on the company’s USDPT information page.
Anchorage also publishes monthly reserve reports reviewed by an independent accounting firm. Its June 30 attestation recorded 21,581 redeemable USDPT and $122,245 of reserve assets. Those reserves consisted of $3,116 in cash and $119,129 in a money market fund.
Onchain supply has since grown. The official Solana Explorer displayed approximately 5.92 million USDPT at the time of reporting. That figure is not covered by the June 30 snapshot because the tokens were apparently minted after its reporting date. Anchorage’s reserve page listed only May and June reports as of Aug. 5, so the next attestation will provide a newer comparison between circulating tokens and reserve assets.
The federal banking structure does not make USDPT a government guaranteed asset. Western Union states that the token is not issued, approved or guaranteed by the U.S. government and is not protected by FDIC insurance. This distinction matters for consumers who may associate a federally supervised issuer with deposit insurance.
The next test is adoption across 60 markets
Western Union’s immediate target is to expand Stablecard from 37 markets to more than 60 before year end. The company has not provided a market by market timetable, expected card count or revenue forecast. Publishing the complete availability list would also clarify where remittance receipt, digital wallet transfers and cash withdrawal features are active.
Future reserve reports will show whether USDPT supply continues growing after the consumer launch. Usage data will be equally important because minted supply does not reveal how frequently customers receive remittances, use cards or retain balances in the application.
Exchange access could support that growth. As previously reported, Bybit added USDPT trading, transfers and custody in June, initially connecting the asset with fiat channels in Latin America. Western Union has also said wider exchange support and additional cash access services are planned.
Stablecard moves Western Union’s stablecoin strategy from settlement infrastructure into a consumer product. The next evidence will come from active users, payment volume, market expansion, fees and updated reserve disclosures rather than the size of Western Union’s existing remittance network.
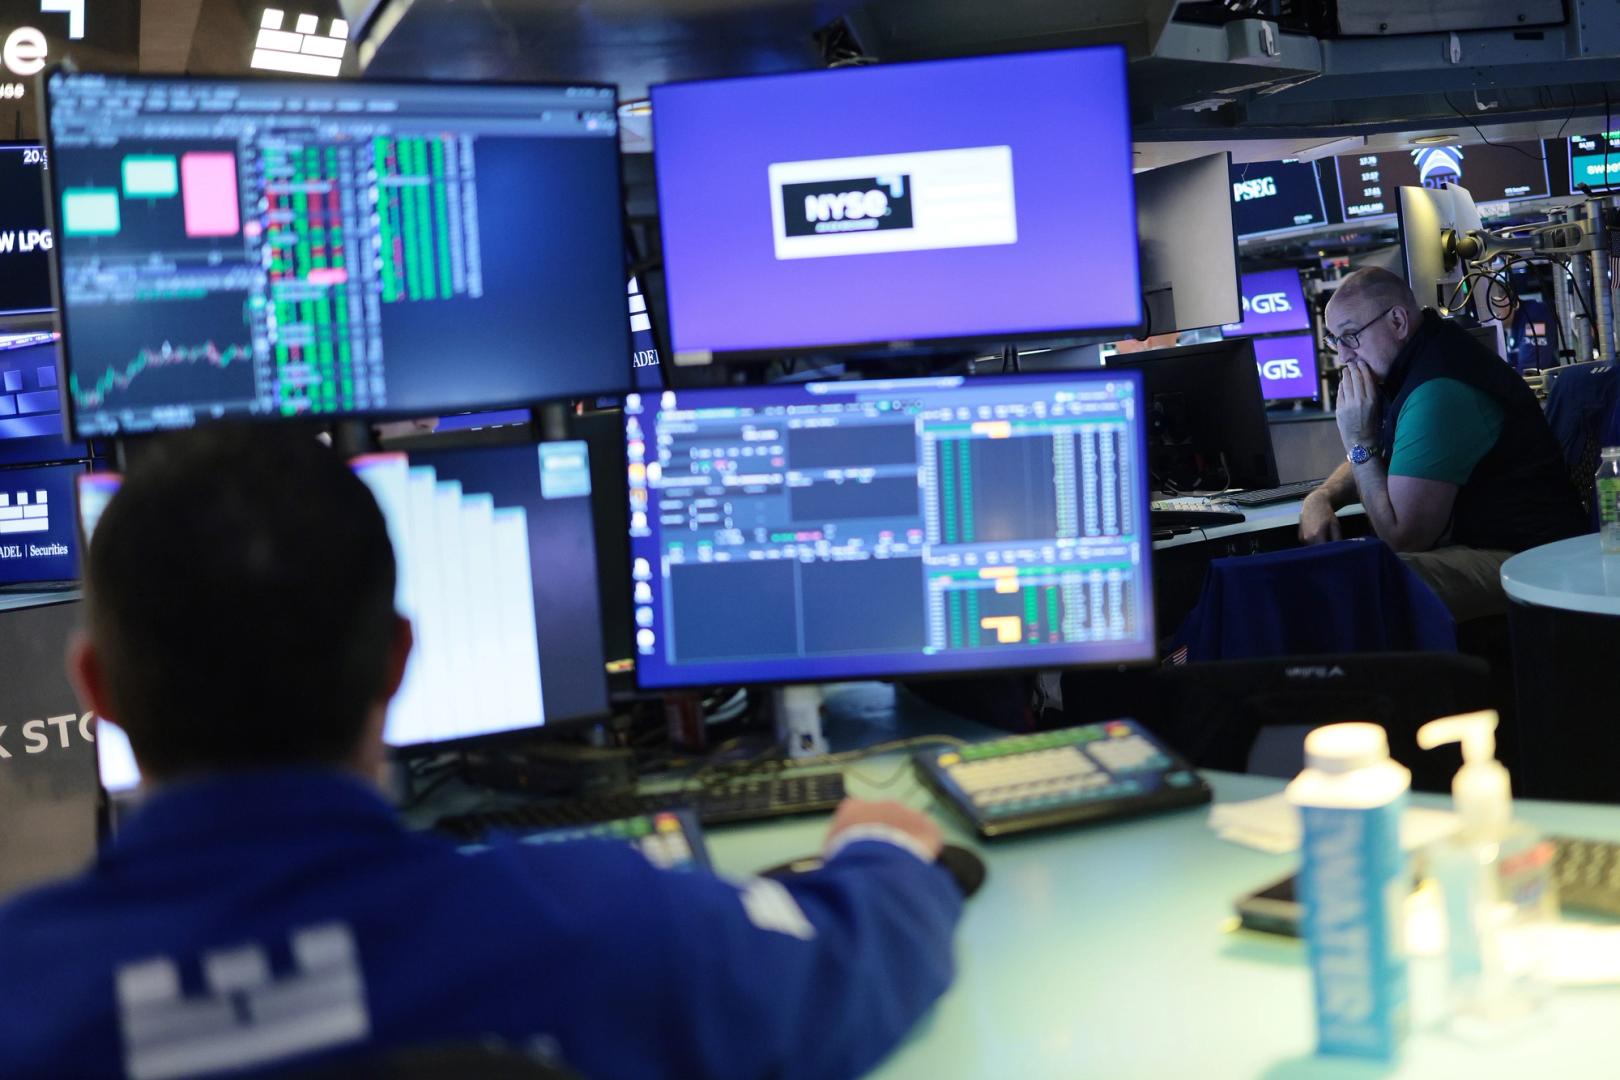
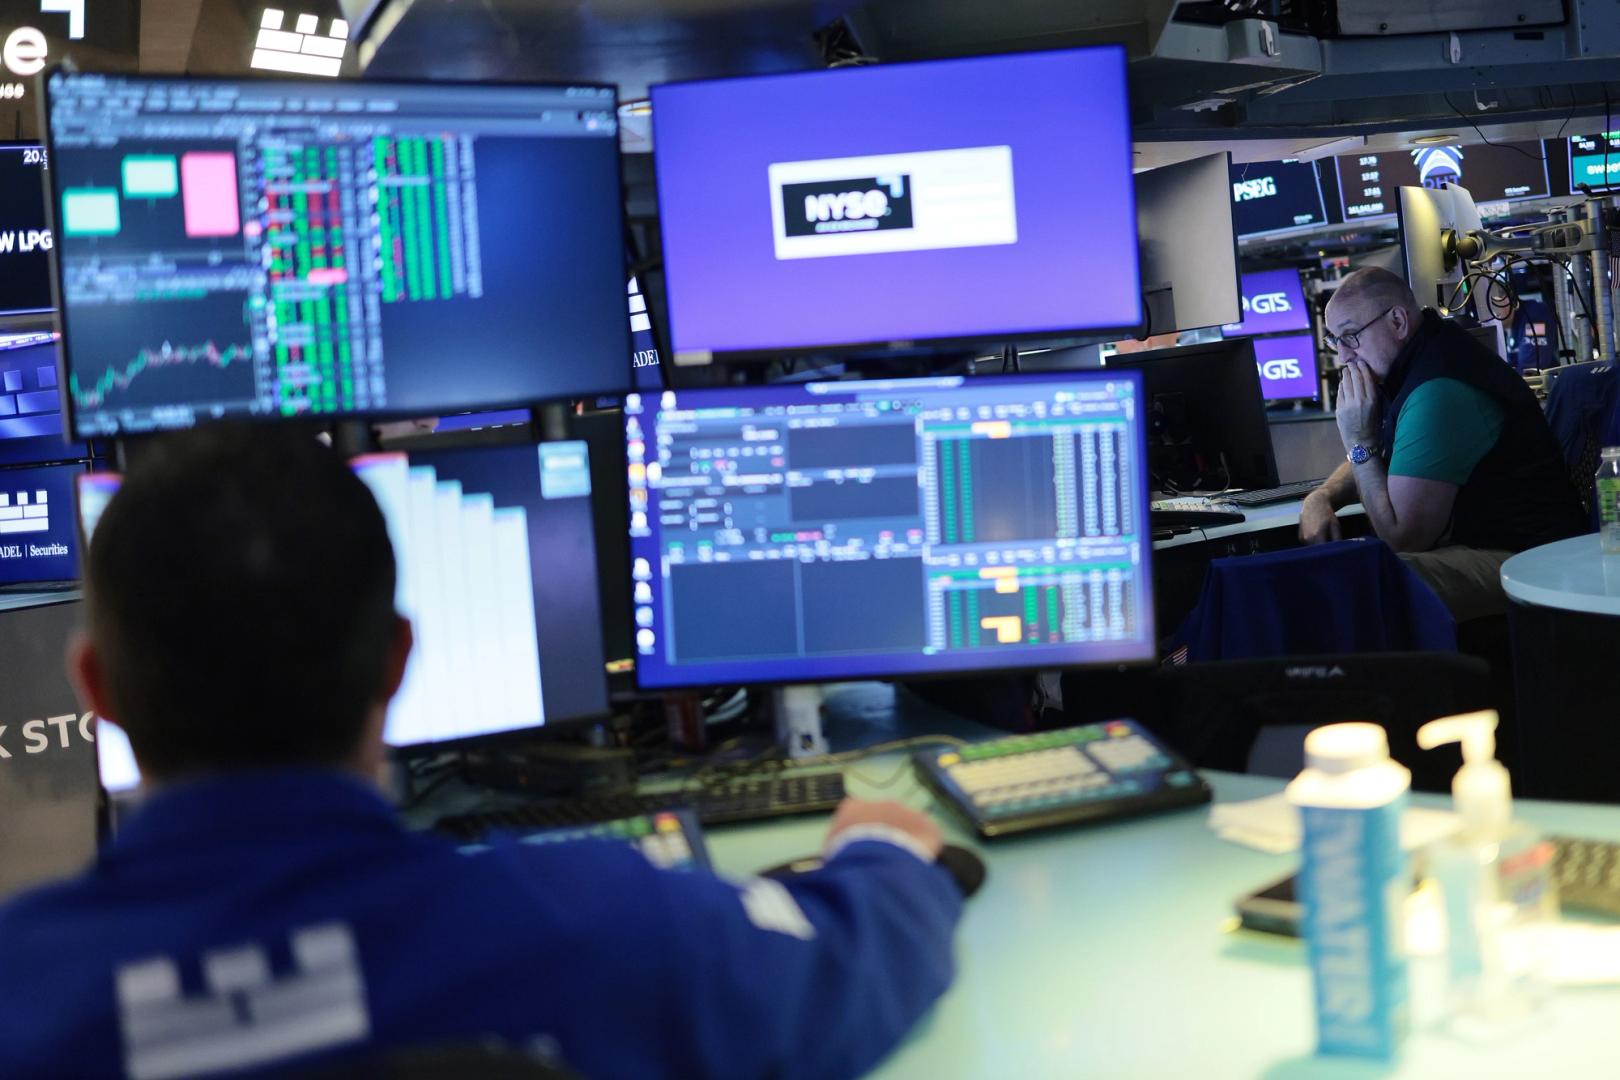
SK Hynix rose 6.4% after the Seoul open and Nvidia added over 2% after hours, though AMD dropped 9% on a soft sales outlook and SpaceX fell 7.5% on higher projected AI spending.
Brent crude fell 1.1% to about $78.50 a barrel after Axios reported Washington, Tehran and Oman were close to an agreement to reopen the Strait of Hormuz, with an announcement targeted for Wednesday. Treasuries and gold both advanced as traders trimmed bets on further rate hikes.
Equities are printing records while bitcoin sits roughly 49% below the $126,000 it reached last October, and the second-largest asset is falling on the week.
Cheaper oil, easing rate expectations and a risk-on equity bid have now failed to move crypto for three straight sessions, which points the drag inward rather than at the macro.
Watch what happens if the Hormuz announcement lands Wednesday as reported. That is the cleanest macro catalyst crypto will get this week, and a market that cannot rally on a confirmed deal after failing to rally on the prospect of one is telling you the buyers are elsewhere.
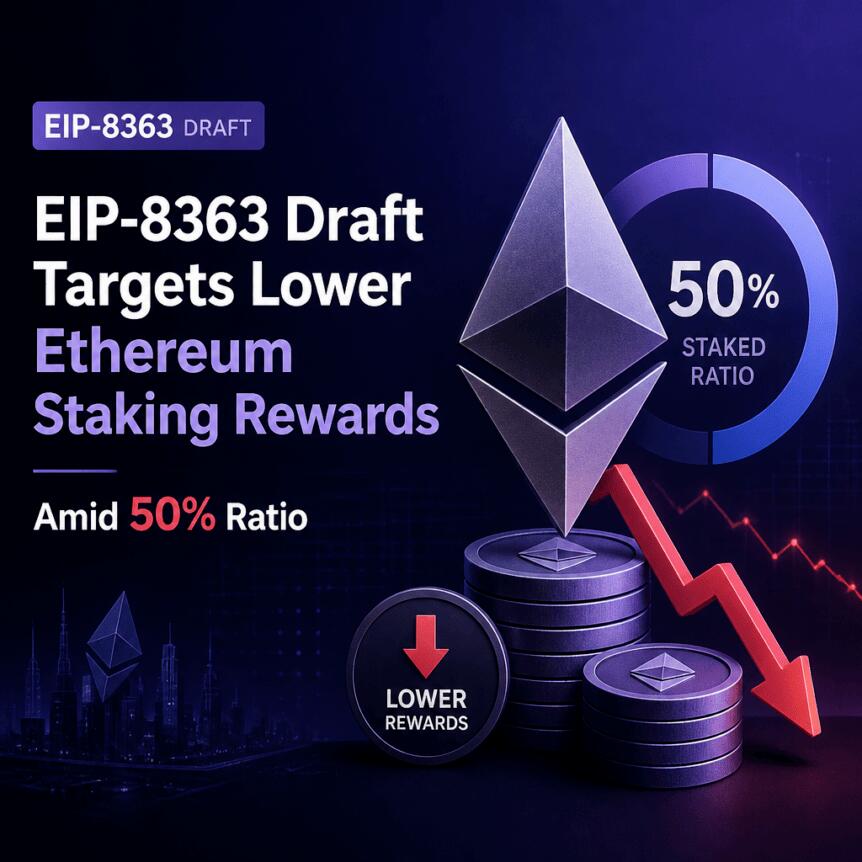
A draft Ethereum Improvement Proposal from a group of six researchers and developers—including Ethereum Foundation’s Justin Drake—would change how new ETH is issued to validators. The “Tapered Issuance Burn” proposal, provisionally numbered EIP-8363, aims to reduce validator rewards more aggressively as more ETH is staked, with an increasing portion of consensus rewards burned to curb long-term inflation.
The proposal targets a fixed staked-ETH threshold of 60.25 million ETH (about 50% of the current ETH supply). As the staking ratio approaches that level, the burn mechanism would intensify, reaching 100% deduction once the threshold is met. The changes are designed to phase in over roughly 18 months. The draft is published on GitHub as an EIP draft.
Key takeaways
- EIP-8363 would “taper” validator issuance by burning an increasing fraction of consensus rewards as staking grows.
- The mechanism is tied to a threshold of 60.25 million staked ETH, at which point the deduction would reach 100%.
- Critics argue the proposal could disadvantage solo validators and reduce DeFi borrowing and yield tied to staking rewards.
- Some developers and community members also question whether there is enough time for careful review, given its proximity to proposal deadlines around Ethereum’s Hegotá upgrade.
- The draft has not been approved or scheduled and is not currently included in Hegotá.
A proposed monetary lever tied to staking saturation
The authors’ central concern is the trajectory of staking. According to the draft’s advocates, under the current issuance and incentive curve, staking rewards would not meaningfully “turn off,” even if nearly all ETH were staked. One of the proposal’s authors, Jérôme de Tychey, argued that this creates a persistent incentive to stake, raising the question of what ultimately stops the process.
In the proposal discussion, de Tychey also highlighted the potential for growing concentration of ETH held through large custodians and staking derivatives. The thesis is not only about dilution from issuance, but about the role of ETH as “a neutral, trustless store of value.” He warned that unchecked issuance could increasingly shift the ecosystem’s “working money” from raw ETH to intermediated staking claims.
As described in the draft’s framing, EIP-8363 would bound and make issuance more predictable. The proposal sketches a scenario in which issuance would peak at roughly 0.5% of ETH supply per year at its highest point (with about 20% of ETH staked), then decline toward zero as the staking ratio reaches the 60.25 million ETH threshold.
Supporters also position the change as complementary to existing Ethereum supply-reduction mechanics, including EIP-1559 and the protocol’s Blob burn structure. De Tychey argued that, with these in place, Ethereum’s net supply trend could more often decrease, while the network maintains a “sustainable security budget.”
Why the timing is drawing fire
Even though EIP-8363 is still an early draft, its publication came shortly before a deadline being discussed in relation to Ethereum’s Hegotá upgrade. Some community members see the schedule pressure as a process risk, especially for a change that would affect monetary policy.
Community developer Greg Koumoutsos said the proposal “clearly doesn’t leave adequate time for community review” of a monetary-policy change of this magnitude. In response to some confusion around the timetable, the article’s reporting indicates that the relevant Aug. 6 deadline is for pull requests proposing additional EIPs for Hegotá, rather than a deadline for deciding which proposals will ultimately be included.
Ethereum community organizer Trent Van Epps indicated that the selection process could continue until Nov. 8. According to the reporting, Hegotá is likely to reach mainnet in the second quarter of 2027, based on the project schedule referenced in the coverage.
Developer and DeFi concerns: solo validators, institutions, and yield markets
While the proposal’s goals are framed as reducing dilution and strengthening neutrality, it has met backlash from parts of the Ethereum development ecosystem, including stakers and DeFi builders.
One line of criticism is that lowering staking rewards could reduce institutional demand for ETH. The article notes concerns about whether reward cuts could affect how institutions interpret yield and exposure, and it points to linked coverage about institutional staking interest.
Another major critique centers on validator structure. The argument from some quarters is that solo validators would be hit harder because they generally face higher relative costs than larger operators. According to the reporting, Mike Silagadze, CEO of Ether.Fi, said the mechanism would push out solo stakers not subsidized by entities such as the Ethereum Foundation. His view is that the staking landscape would become dominated by large centralized organizations, leaving users to hold ETH indirectly while those operators capture the remaining incentive structure.
De Tychey disputed the “guaranteed solo exit” framing. In a response on the Ethereum Magicians forum, he argued that users of large staking providers must pay fees, which could make such services less attractive as rewards fall. However, the reporting also emphasizes that related research is “contested,” leaving the economic second-order effects uncertain.
Beyond validator economics, critics warn that staking reward changes could ripple into DeFi markets that depend on staking yield. Stani Kulechov, founder of Aave, characterized the proposal as harmful—arguing it could weaken institutional demand for ETH and reduce borrowing activity across DeFi. His critique is that the proposal does not achieve its intended outcome and could negatively affect Ethereum’s broader ecosystem incentives.
Backers see bounded inflation and potentially long-run upside
Support for EIP-8363’s direction is not confined to the proposal’s authors. The coverage also points to Grayscale research leadership. In May, Grayscale head of research Zach Pandl said limiting staking incentives would be “positive for the price of Ether over time,” framing the idea as part of improving Ethereum’s long-run economic profile.
In the proposal’s own narrative, the change is designed to address a specific economic tension: a world where staking keeps expanding, issuance continues unabated, and more of the ecosystem’s exposure becomes mediated through staking derivatives. Supporters argue that burning an increasing share of rewards as staking rises can cap issuance growth and reduce dilution, while still maintaining security incentives early in the process.
Yet, with the draft at an early stage and schedule constraints under debate, the most immediate takeaway is that the proposal is not yet a policy. It is one part of a larger, contested set of considerations about Ethereum’s monetary future as staking participation rises and as staking derivatives evolve.
As Ethereum approaches the Hegotá selection window, readers should watch for how the community evaluates EIP-8363’s economic modeling—especially the projected impact on solo validators, liquid staking incentives, and DeFi borrowing flows—and whether the proposal is revised, delayed, or replaced by alternatives before any formal inclusion.

For years, decentralized finance (DeFi) has been marketed as an alternative financial system powered by blockchain technology. Early adopters embraced concepts like self-custody, liquidity pools, yield farming, decentralized exchanges, and governance tokens. While these innovations transformed the crypto landscape, they also created a steep learning curve that discouraged mainstream adoption.
Ironically, the future success of DeFi may depend on making it invisible.
The next billion users are unlikely to care whether an application is decentralized. They won’t ask which Layer 2 network it runs on, what consensus mechanism secures it, or whether the transaction passes through a smart contract. Instead, they’ll simply expect payments to be instant, investments to be accessible, savings to generate competitive returns, and financial services to work seamlessly.
Just as billions of people use the internet without understanding TCP/IP or cloud infrastructure, the next generation of financial users may rely on DeFi every day without realizing it.
The Evolution of Technology: Infrastructure Becomes Invisible
History shows that transformative technologies disappear into the background once they mature.
People don’t think about:
- DNS when visiting a website
- SSL certificates when shopping online
- Cloud servers when streaming movies
- Cellular protocols when sending messages
The same pattern is emerging for blockchain.
Early crypto products forced users to understand wallets, gas fees, bridges, private keys, seed phrases, and token standards before completing even simple transactions.
Future applications will hide all of that complexity.
Users will simply press “Send,” “Invest,” “Borrow,” or “Earn.”
Behind the scenes, decentralized infrastructure will handle everything automatically.
Better User Experience Wins Every Time
Most consumers prioritize convenience over technology.
When someone opens a banking app, they rarely ask:
- Is this database decentralized?
- Which consensus algorithm validates this transfer?
- Is this settlement happening on-chain?
They only ask:
- Is it fast?
- Is it secure?
- Does it work?
The winners in Web3 will be projects that abstract away blockchain complexity instead of highlighting it.
Invisible infrastructure creates visible value.
Smart Wallets Remove Friction
Traditional crypto wallets expect users to:
- Store seed phrases
- Manage gas tokens
- Sign complex transactions
- Switch networks manually
- Recover lost accounts independently
These requirements remain intimidating for newcomers.
Modern smart wallets are changing the experience through features such as:
- Social recovery
- Passkey authentication
- Biometric logins
- Sponsored gas fees
- Automatic network switching
- Session keys for trusted applications
The result feels much closer to using a modern fintech app than a traditional crypto wallet.
Users benefit from blockchain security without wrestling with blockchain complexity.
Stablecoins Will Lead the Way
Millions of people may first experience DeFi through stablecoins rather than cryptocurrencies.
Imagine opening a payment app that allows users to:
- Send money globally in seconds
- Receive salaries instantly
- Earn yield automatically
- Pay merchants internationally
- Save in digital dollars
The average user doesn’t need to know that:
- Liquidity pools process transactions
- Smart contracts generate yield
- On-chain protocols manage settlement
- Decentralized infrastructure secures transfers
To them, it’s simply a better financial application.
Embedded Finance Is Becoming Embedded DeFi
Traditional companies increasingly integrate financial services directly into their platforms.
The same trend is happening in Web3.
Soon, decentralized finance may power:
- Gaming economies
- Ride-sharing apps
- Freelance marketplaces
- Creator platforms
- E-commerce websites
- AI agent payments
- Social media rewards
Users may never download a separate DeFi app.
Instead, financial functionality becomes part of the products they already use every day.
AI Will Become the User’s Financial Interface
Artificial intelligence is making DeFi dramatically easier to navigate.
Rather than manually comparing protocols, users may simply ask:
“Find me the safest place to earn the highest yield.”
Or:
“Swap my assets using the cheapest route.”
Or:
“Move my savings into lower-risk opportunities.”
AI agents can analyze liquidity, optimize transactions, monitor risk, and execute strategies across multiple protocols—all without requiring users to understand the underlying mechanics.
Instead of learning DeFi, users interact with intelligent assistants.
Compliance Can Exist Without Sacrificing Decentralization
One of DeFi’s biggest challenges has been balancing openness with regulatory expectations.
Emerging technologies—including decentralized identity, zero-knowledge proofs, and selective disclosure—allow users to verify eligibility or compliance without exposing unnecessary personal information.
This enables financial applications that are both privacy-preserving and regulation-friendly.
For users, the process feels no different than signing into any trusted online service.
Cross-Chain Complexity Will Disappear
Today’s users often struggle with:
- Multiple wallets
- Token bridges
- Different gas assets
- Separate blockchain ecosystems
Future infrastructure will increasingly abstract these details.
Applications will automatically determine:
- The cheapest network
- The fastest settlement path
- The most liquid market
- The lowest transaction cost
Users simply initiate an action.
The protocol decides everything else.
Businesses Care About Results, Not Blockchains
Enterprises adopting blockchain rarely advertise which blockchain powers their operations.
Instead, they focus on outcomes like:
- Lower operating costs
- Faster settlement
- Greater transparency
- Reduced fraud
- Improved automation
As blockchain infrastructure matures, businesses will increasingly treat it as back-end technology rather than a customer-facing feature.
This shift mirrors how companies rely on cloud computing today without making it the centerpiece of their marketing.
The Real Competition Isn’t Other Blockchains
- Transaction speed
- TPS numbers
- Consensus models
- Layer architectures
But mainstream users compare products differently.
They compare DeFi against:
- Banking apps
- PayPal
- Venmo
- Cash App
- Revolut
- Apple Pay
If decentralized applications deliver a smoother experience with lower costs and greater accessibility, users won’t care what’s happening behind the interface.
Convenience beats complexity.
The Future Is Financial Infrastructure, Not Financial Identity
Many projects still compete over:
The first generation of crypto enthusiasts proudly identified as DeFi users.
The next generation probably won’t.
They’ll simply use applications that are:
- Faster
- Cheaper
- More secure
- Globally accessible
- Available 24/7
- More rewarding
Whether those applications rely on smart contracts, decentralized liquidity, or blockchain consensus will be largely irrelevant to them.
That is the ultimate sign of success.
When users stop noticing the technology and start focusing solely on the value it delivers, DeFi will have evolved from a niche innovation into a foundational layer of the global financial system.
Final Thought
The next billion DeFi users won’t be attracted by buzzwords like liquidity mining, staking, or decentralized exchanges. They’ll be drawn by intuitive apps that solve real financial problems with speed, affordability, and reliability. As wallets become smarter, stablecoins become more common, AI simplifies financial decisions, and blockchain infrastructure fades into the background, DeFi will increasingly function as an invisible engine powering everyday digital experiences.
The greatest achievement of decentralized finance may not be convincing the world to use DeFi—it may be reaching a point where people benefit from it every day without ever needing to know it’s there. In that future, DeFi won’t be a niche category of finance; it will simply be finance.
REQUEST AN ARTICLE
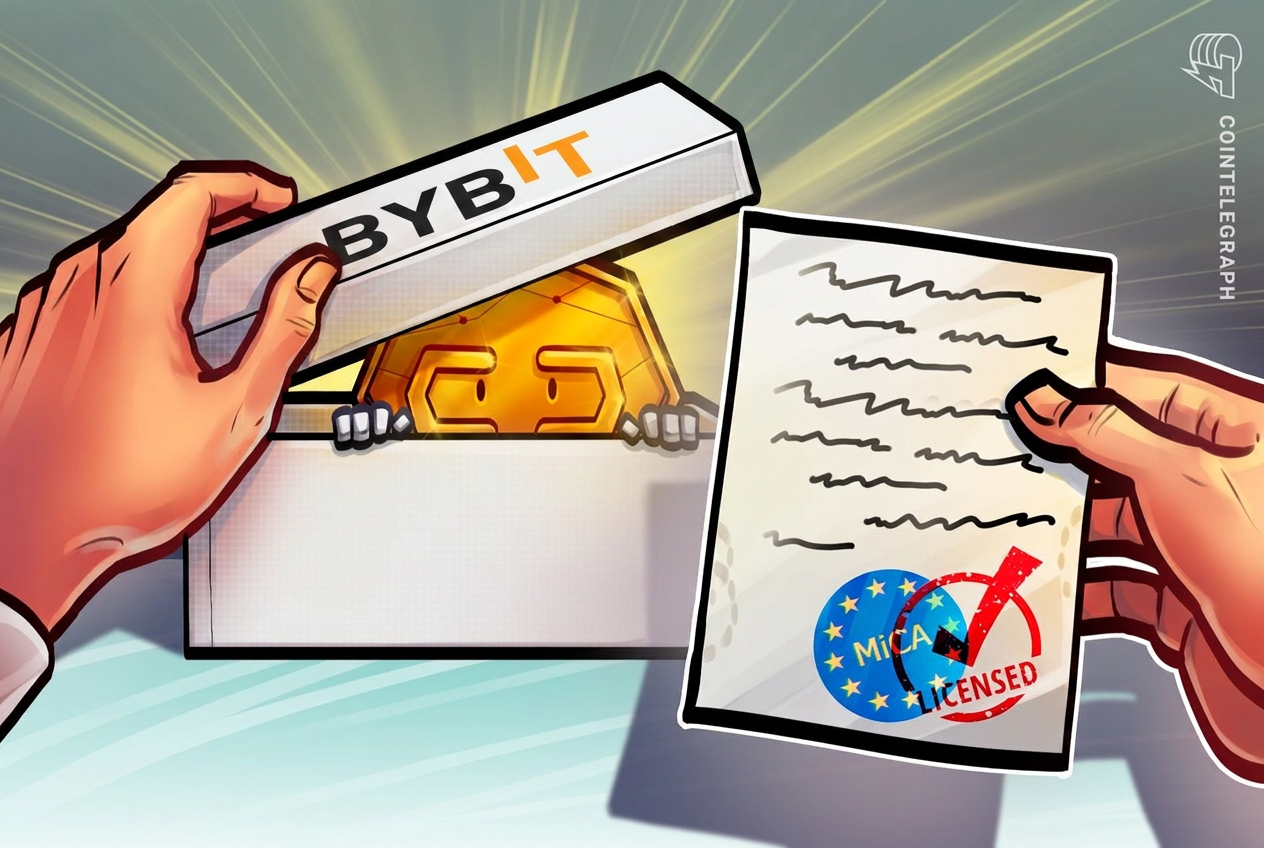
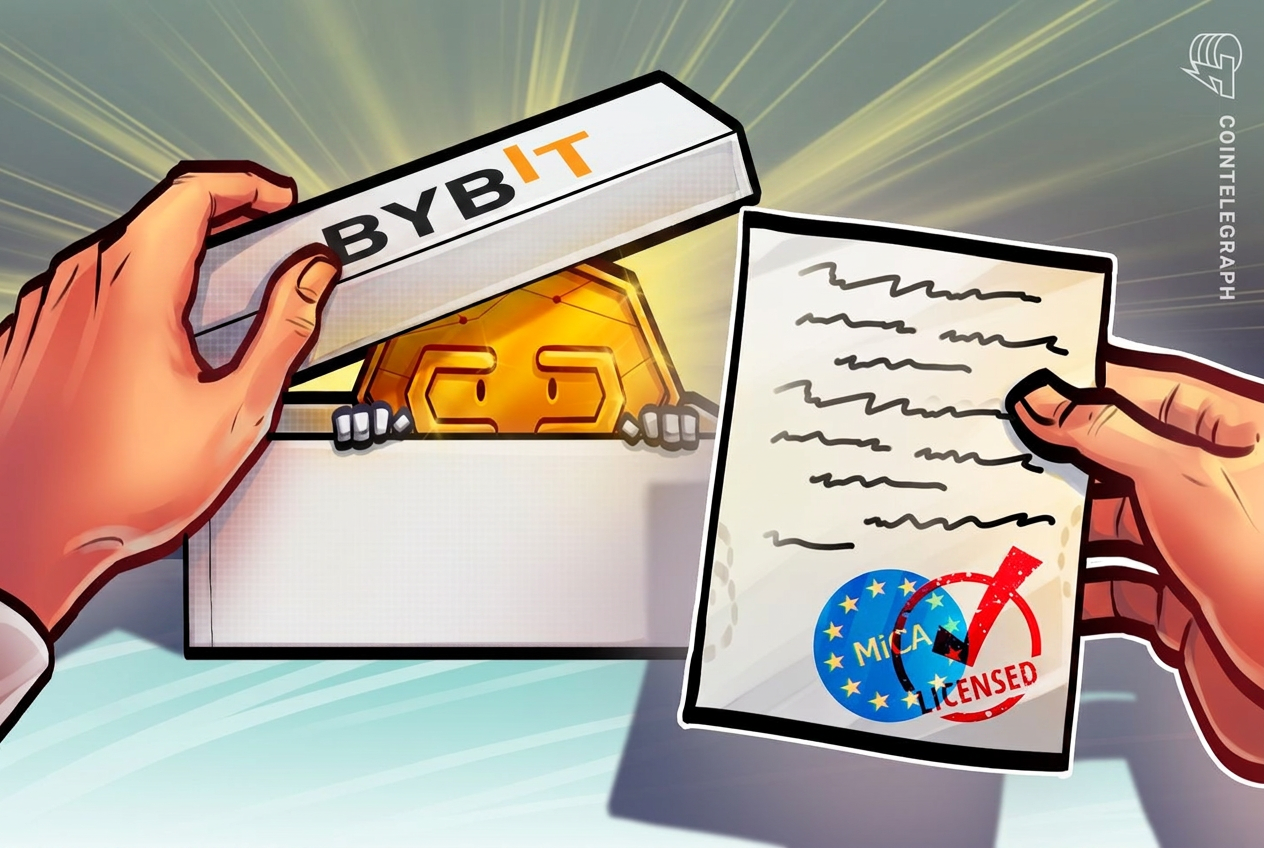
Bybit’s European payments subsidiary has secured an electronic money institution license in Austria, providing the exchange with a regulatory basis to add payment and e-money services to its regional platform.
On Tuesday, Bybit said Bybit Payments GmbH received the license from Austria’s Financial Market Authority. The authorization provides a legal basis for future payment capabilities, which may include person-to-person payments, merchant payment solutions, open banking features and card products.
The payment services will be offered through Bybit.eu alongside services provided by Bybit EU GmbH, a separate Austrian entity authorized under the European Union’s Markets in Crypto-Assets Regulation since May 2025. Bybit.eu serves users across the European Economic Area (EEA), with Malta excluded.
Bybit has not specified the reason why Malta was excluded, but said on its website that services are available only in jurisdictions where applicable MiCA passporting requirements have been met.
Bybit said the two entities will maintain distinct regulatory permissions and responsibilities. Bybit EU GmbH is authorized to provide crypto custody, exchange, placement and transfer services, while Bybit Payments GmbH will handle regulated electronic money and payment products as they are introduced.
The exchange said the new regulatory milestone could help strengthen its relationship with banks, payment providers and enterprises while reducing its reliance on third-party payment infrastructure.
Related: Crypto exchange Bybit launches in Indonesia after NOBI acquisition


Bitdeer Technologies Group said on Aug. 4 that its Tydal Data Center subsidiary signed a 16-year colocation and services agreement with Volta Tydal AS for an artificial intelligence and high-performance computing campus in Norway.
Summary
- Bitdeer signed a 16-year Norway colocation agreement expected to generate $4.7 billion in contracted revenue.
- The Tydal campus will deliver 121 megawatts of IT capacity using renewable Norwegian power sources.
- An eight-year extension could raise total contract value to approximately $8 billion across twenty-four years.
- Bitdeer retains full ownership of Tydal while Volta supplies customer, financing and technology relationships globally.
- Two construction phases target completion by December 2026 and March 2027, subject to execution risks.
The contract covers 121 megawatts of critical IT capacity, supported by about 133 MW of total power. Bitdeer expects approximately $4.7 billion in contracted payments during the initial term. A one-time eight-year renewal option could raise the potential contract value to about $8 billion over 24 years.
Bitdeer’s $4.7 billion deal contracts 121 MW
The agreement assigns the full 121 MW to Volta, which plans to support a leading AI laboratory using NVIDIA graphics processing units. Dell Technologies will act as technology provider, according to Bitdeer’s announcement. The parties did not name the end customer.
Bitdeer said the lease averages about $202 per kilowatt each month during the first 16 years. The tenant will reimburse electricity costs, while contract payments will rise 3% annually. Management estimates average annual revenue of $2.4 million per IT MW and a project net operating income margin of roughly 90%.
Those figures are company projections rather than GAAP revenue or operating profit. Bitdeer said total contract value assumes full performance of the agreement. The company’s estimated margin also excludes financing costs, depreciation, corporate expenses and other items that can affect consolidated earnings.
Tydal converts Bitcoin infrastructure into AI capacity
The deal advances Bitdeer’s plan to shift part of its power portfolio from Bitcoin mining toward AI colocation. In March, the company hired Data Center Installations AS to convert Tydal into a 180 MW gross facility built around NVIDIA reference designs. Bitdeer said the completed campus could become one of Norway’s largest AI data centers.
The Volta contract uses 133 MW of that planned gross capacity. Bitdeer is developing two additional halls totaling 47 MW for possible AI and HPC customers during the second half of 2027. The company will retain full ownership of the site, and it issued no shares or warrants in connection with the Volta transaction.
Bitdeer has been expanding AI infrastructure while retaining a large Bitcoin mining operation. Its June update showed 73 EH/s of self-mining capacity, 990 BTC produced during the month and about $76 million in AI cloud annualized run-rate revenue at 95% utilization.
Financing and termination terms temper the headline value
The project still requires about $500 million of capital expenditure, or approximately $4 million per contracted IT MW. Bitdeer plans to raise additional debt to finance construction and other infrastructure projects. Leading financial institutions have been engaged, but the company has not disclosed the expected borrowing cost, maturity or final structure.
Volta’s obligations are expected to receive about $1.3 billion in letters of credit arranged by affiliates of J.P. Morgan and another global financial institution. The support remains subject to customary conditions. Bitdeer may terminate the agreement if Volta misses specified milestones tied to that credit package.
The tenant also has a no-fee termination right after ten years, despite the stated 16-year base term. The optional eight-year extension is not guaranteed. Construction delays, financing costs, equipment availability and customer performance could therefore reduce the timing or value of the expected payment stream.
Bitdeer had disclosed the Tydal lease in June but said it remained subject to conditions outside its control. The Aug. 4 release supplies the commercial terms and identifies Volta as the counterparty, marking a step beyond the earlier conditional announcement.
BTDR rises before Bitdeer’s Aug. 10 earnings
Bitdeer shares rose after the announcement. The latest verified market quote placed BTDR near $11.37, about 7.8% above the previous close. Earlier reports described a larger intraday move, but the stock had given back part of that gain by the latest reading.
The rally reflects investor interest in long-duration AI infrastructure contracts, though the stock remains exposed to construction and financing risk. Bitdeer reported $188.9 million in first-quarter revenue, a $159.5 million net loss and $297.7 million in cash and restricted cash at March 31. Borrowings stood near $1.9 billion.
In related coverage, crypto.news examined how Bitcoin miners including Bitdeer, IREN and HIVE are repurposing power-rich facilities for AI workloads. The strategy can produce steadier contracted revenue than mining, but it also requires large upfront spending and dependable customers.
Bitdeer will report second-quarter results on Aug. 10 before an 8 a.m. Eastern Time conference call. Investors will be watching for financing details, construction progress, accounting treatment and any update on when the Tydal revenue can begin entering reported results
Polymarket is reportedly in preliminary talks with prospective investors about raising roughly $1 billion at a valuation above $20 billion.
Summary
- Polymarket is reportedly discussing a new $1 billion raise at a valuation exceeding $20 billion.
- April’s financing reportedly valued Polymarket at $15 billion and included D.E. Shaw and G Squared.
- ICE confirmed a $600 million March investment after making an earlier $1 billion Polymarket investment.
- July prediction market volume reached $50.6 billion, with Kalshi handling $37.7 billion across its platform.
- Polymarket US operates through QCX, a CFTC designated market, amid state challenges to federal authority.
Bloomberg reported the discussions on Aug. 4, citing people familiar with the private negotiations.
The company has not announced a deal. A Polymarket spokesperson declined to comment on the report. The fundraising amount, valuation and investor group should therefore be treated as “preliminary” rather than completed financing.
A successful round would place Polymarket near Kalshi, its largest prediction market rival, which secured a $22 billion valuation in May. It would also continue the rapid rise in private valuations across an industry expanding from election contracts into sports, economics, crypto and other real world events.
Polymarket funding talks remain unconfirmed
The reported transaction remains at an early stage. No term sheet, closing date or final investor list has been released. Private funding discussions can change before completion, including the capital raised and the valuation investors ultimately accept.
Comparisons with Polymarket’s October 2025 valuation also require care. Bloomberg referred to a valuation of about $9 billion. However, Intercontinental Exchange’s official announcement said its planned investment reflected an approximate $8 billion valuation before the new capital was added. The figures may use different valuation bases and are not necessarily contradictory.
The April financing also combines reported and confirmed information. Bloomberg said Polymarket completed roughly $1 billion in financing at a $15 billion valuation, with D.E. Shaw and G Squared joining the investor group.
ICE separately confirmed a further $600 million investment on March 27 as part of a Polymarket equity raise. The New York Stock Exchange owner had already invested $1 billion in October 2025. ICE did not disclose the valuation attached to its March investment.
A valuation above $20 billion would be at least 33% higher than the reported April figure. It would also represent more than twice the valuation Bloomberg assigned to Polymarket’s October round.
U.S. expansion supports Polymarket’s valuation case
Polymarket’s return to the U.S. gives the company a regulated growth channel alongside its international platform, which uses crypto settlement.
The CFTC’s official registry lists QCX LLC, doing business as Polymarket US, as a designated contract market. The regulator records its designation date as July 9, 2025. The exchange has since submitted rule changes covering fees, liquidity programs, surveillance and trading procedures.
Bloomberg reported that Polymarket had opened its U.S. exchange following its April financing. Meanwhile, the company’s U.S. access page states that its app is being rolled out to users from a waitlist. This indicates that access may still be expanding in stages rather than being uniformly available.
Revenue growth provides another part of the reported valuation case, although the numbers remain private company metrics. Bloomberg’s sources said Polymarket’s annualized revenue had more than tripled since April to above $1.2 billion.
Reuters reported in June that the platform’s annualized revenue had passed $1 billion. An annualized figure extrapolates recent performance and is not the same as audited revenue collected across a completed financial year.
Trading data also shows that the U.S. venue is gaining activity. As crypto.news reported, Polymarket, Polymarket US and Kalshi generated a combined record of $50.6 billion in July volume.
Kalshi led with $37.7 billion. Polymarket US increased its volume by 54% to $5 billion, while Polymarket’s international venue fell 26% to $7.9 billion. The figures show faster U.S. growth, but they also show that the wider Polymarket business did not expand evenly.
Kalshi’s lead creates a demanding benchmark
Kalshi officially announced a $1 billion Series F round at a $22 billion valuation on May 7. Coatue led the financing, with participation from Sequoia Capital, Andreessen Horowitz, IVP, Paradigm, Morgan Stanley and ARK Invest.
The company said institutional trading volume had risen 800% over six months. Kalshi also said its annualized trading volume increased from $52 billion to $178 billion. Those are company supplied trading figures and should not be confused with revenue.
In related coverage, crypto.news reported that Kalshi claimed more than 90% of U.S. prediction market activity when it announced the financing. Independent July data also showed Kalshi processing almost three times the combined volume of Polymarket’s international and U.S. venues.
Polymarket’s reported target would narrow the valuation gap despite Kalshi’s larger trading volume. Prospective investors may be assigning value to Polymarket’s international reach, crypto settlement infrastructure, brand recognition and relationship with ICE.
Volume alone cannot determine a private company’s worth. Fees, customer retention, compliance costs, market composition and activity after major sporting or political events can affect revenue quality. July open interest fell after the World Cup ended even as monthly trading reached a record.
Regulatory disputes could influence the funding round
Polymarket US holds a federal designation, but several states argue that sports event contracts amount to gambling and remain subject to state laws.
The Nevada Gaming Control Board filed a civil complaint against Polymarket and QCX in January. The regulator asked a state court to stop the companies from offering what it described as unlicensed wagering in Nevada.
As previously reported, Polymarket and Kalshi are involved in a broader dispute over whether the Commodity Exchange Act gives the CFTC exclusive authority over federally registered event contract platforms.
North Carolina has followed a different route. A law signed in July recognizes CFTC regulated prediction markets and establishes a 6% tax on their trading fee revenue beginning in 2027.
These disputes do not prevent Polymarket from discussing financing. However, they could affect market access, legal costs and how investors value the company’s U.S. growth plans.

Crypto trading activity has fallen to its lowest level of 2026.
This is according to data from Kaiko, which shows daily spot volumes across tracked exchanges dropping to around $15 billion last week.
Centralized Exchange Volumes Fall as Trading Activity Cools
According to the Kaiko numbers shared by The Kobeissi Letter, daily trading volumes across 44 spot crypto exchanges have dropped 70% from peak levels in January, with the average daily volume trend also falling 50% since December 2025 to about $20 billion. Furthermore, the six largest exchanges now account for more than 60% of total trading activity.
However, not everyone agrees that crypto liquidation is disappearing, with pseudonymous crypto researcher Emperor Osmo arguing that the drop in trading volume on CEXs mostly reflects changing exchange dynamics.
Data from The Block shows decentralized exchange volume has been climbing all year relative to centralized platforms, going from a ratio near 20% in April to about 24% in July and above 46% so far in August, although the figures from this month are still incomplete.
“Centralized exchanges are simply losing market share to DEXs,” the analyst wrote.
Trader Jeff made a related point from a different angle, noting that stablecoin volume and active addresses are both up from last month and that holders of tokenized real-world assets jumped 51% in 30 days to 1.57 million. “The traders left, but the users stayed,” he wrote, with Wintermute head of OTC Jake O calling the shakeout healthy and arguing that “volume consolidating on the stronger venues is a net positive for the industry.”
Where the Market Is At
That drop has come with major cryptocurrencies trading well below their highs. Bitcoin (BTC), for instance, is changing hands near $64,000, up by about 2% in 24 hours but nearly 50% lower than its October 2025 all-time high. Ethereum (ETH) was trading close to $1,900, down 62% from its peak. XRP and Solana (SOL) are faring even worse, having dropped 70% and 75% from their ATHs, respectively.
Some critics have taken the decline as evidence of a longer-term move away from crypto, with AI becoming a stronger competitor for investor attention and capital. But other participants, including Korean trader Frontier Bet, believe that regulatory development such as approval of the CLARITY Act could attract capital back into crypto markets.
The odds for the bill’s approval have continued to drop, especially after the White House failed to respond to a key counterproposal from Thom Tillis and Ruben Gallego, who are pushing for stronger ethics provisions.
The post Crypto Market Liquidity Dries Up as Daily Volumes Hit 2026 Lows appeared first on CryptoPotato.

Donna Mills Is Already Getting ‘Wildest Requests’ On OF
Fifa’s failed equity plan and football’s growing welfare crisis

McDonald’s (MCD) Q2 2026 earnings

Renter of Home in Anne Heche Crash Denies Settlement With Son

No Jackpot Winner as $257 Million Prize Rolls Over to $269 Million Monday Draw

Weekend Open Thread: Staud – Corporette.com

What is Bitcoin & How it Works | Easy Explanation in Hindi | Nitish Rajput

TRAUMA FINANSIAL NGGAK MESTI KARENA PERNAH SUSAH #annisast #moneymarriageconflict #relationship

Banking on politics — Israel and the Palestinian financial crisis
-

 Business6 days ago
Why Trees Belong on the Risk Register
-

 Fashion4 days ago
Weekend Open Thread: Wit & Wisdom
-

 Politics4 days ago
Meta enters AI-training agreement with far-right ‘propaganda rag’ Newsmax
-

 Politics7 days ago
Reform UK betrays West Mids residents by running from party pledges
-
 Crypto World4 days ago
MicroStrategy Post-Earnings CLARITY Act Push Could Add New Catalyst for Its Stock
-

 Politics2 days ago
Zack Polanski: an incitement to murder Nigel Farage?
-

 Business7 days ago
Major shareholder moves on Canyon
-

 Crypto World4 days ago
XRP Ledger v3.3.0 brings five institutional features
-

 News Videos6 days ago
Bitcoin Enters the 3rd Stage of the Bear Market
-

 Politics6 days ago
Luke Littler’s dominance sparks GOAT debate
-

 Sports5 days ago
Seema Kaliramna Wins Discus Throw Bronze, Takes India’s CWG Medals Tally To 17
-

 Crypto World4 days ago
New York sues Kalshi over prediction market gambling
-

 Crypto World3 days ago
Crypto PAC spending tops $2M in Michigan House race
-

 Business5 days ago
Trump Announces Hamas Disarmament Agreement as Iran Strikes Kuwait Air Base and US Attacks Pause Overnight
-
 Tech7 days ago
Gemini can now summarize the messiest comment threads in Google Docs
-

 Tech3 days ago
ESET tracks rise in malicious AI skills and adaptable malware
-

 Business2 days ago
DTCR: Deleveraging And A Hedge Fund Collapse Point To A Possible AI Bottom
-
 Tech5 days ago
Building A Reproduction PlayStation Motherboard
-

 Tech5 days ago
Gemini Spark can now use Chrome logins and saved passwords to run errands on your behalf
-

 NewsBeat6 days ago
Four people die trying to cross Channel in small boats
You must be logged in to post a comment Login