

Crypto World
BTC Near Range Highs as Exchange Inflows Rise; Could $80K Be Next?


Bitcoin is facing a renewed supply test as on-chain dynamics show rising balance on spot venues and ongoing ETF outflows. In the latest week, exchange netflows rose by roughly 18,000 BTC, while spot BTC exchange-traded funds logged net outflows of nearly 16,000 BTC, a combination that produced around 34,000 BTC of local selling pressure across venues.
Axel Adler Jr., a BTC researcher, said the data point to a persistent local supply imbalance even as price movements suggested a rebound. “BTC exchange and ETF activity continue to show a local supply imbalance,” Adler noted in his assessment of the week’s flow figures, underscoring that the pressure could resurface if absorption by buyers does not improve. He added that the weekly netflows imply that the market may need a shift back toward neutral or negative exchange balances before sustained upside momentum can take hold. Read his full analysis.
Bitcoin weekly exchange netflows. Source: CryptoQuant
The same period also saw spot ETF activity retreat, with net outflows of around 16,000 BTC. Adler noted that institutional flows did not absorb the exchange supply as hoped and, instead, reinforced a risk-off mood that can cap rallies in the near term.
The magnitude of the combined pressure—roughly 34,000 BTC across exchanges and ETFs—highlights the fragility of near-term upside without stronger spot demand. As Adler framed it, the market faces a critical test: can buyers step in sufficiently to absorb ongoing inflows and prevent a renewed slide in supply pressure?
Bitcoin open interest, CVD, and funding dynamics. Source: Velo chart
The wider market context added to the caution. Glassnode analyst cryptovizart pointed out that daily ETF trading volume has cooled to below $20 billion, down from more than $50 billion in late 2025. The softer activity in traditional finance channels suggests fading speculative demand through these venues and weaker spot absorption during rallies. Read the note.
Key takeaways
- Weekly BTC exchange netflows rose by about 18,000 BTC, while spot BTC ETFs logged roughly 16,000 BTC in net outflows, creating ~34,000 BTC of near-term selling pressure.
- Institutional ETF activity has cooled, with daily ETF trading volume dipping below $20 billion from above $50 billion in late 2025, signaling fading speculative demand through traditional channels.
- Open interest on BTC futures declined to about 250,000 BTC during the rebound, before ticking up to roughly 254,000 BTC, suggesting that the rally was driven largely by short-covering rather than new bullish positioning.
- Funding rates cooled to around 0.0026, remaining in positive territory, indicating less crowded long leverage even as the market experiences intermittent pressure.
- Analysts highlight a mixed signal: while some metrics show cooling selling pressure, sustained upside will likely depend on a renewed burst of spot demand and a rise in open interest toward the $80,000 level.
Derivatives dynamics and the path to momentum
The rebound rally toward the $77,800 area came after a brief dip below $75,000, aided in part by a shift in risk appetite following reports of a potential US-Iran peace deal. On-chain and derivatives data paint a picture of a cautious market where buyers have not yet fully absorbed supply. Aggregated Bitcoin open interest fell from about 268,000 BTC during the dip and then hovered near 254,000 BTC, signaling that the move higher was largely driven by short-covering rather than a broad reloading of bullish bets.
Meanwhile, the aggregation of funding rates softened during the advance, sliding to around 0.0026 from earlier peaks near 0.008—still positive, but a sign that long positions are less crowded than in prior rallies. A separate perspective from Rei Researcher on CryptoQuant notes that the daily funding rate has remained negative since February 2026, implying ongoing pressure from short traders in the shorter horizon. Taken together, these signals suggest BTC is stabilizing around the mid-to-upper $70k range even as near-term headwinds persist.
BTC price, spot CVD, aggregated open interest, and funding rate. Source: Velo chart
In the broader context, Glassnode reported that spot CVD and futures CVD metrics have moved higher—up 77.2% and 35.5% respectively—while price momentum softened. The development underscores a market where selling pressure is easing somewhat on a relative basis, but real momentum will likely require a renewed influx of spot demand and a climb in open interest.
Volatility, risk, and what to watch next
Looking ahead, the critical question for BTC remains whether fresh buyers can step in to absorb ongoing exchange and ETF flows. If spot demand fails to strengthen or if open interest fails to rise in tandem with price, the current relief rally risks stalling or reversing. Observers will be watching for shifts in ETF activity, potential catalysts that can restore risk appetite, and any signs that institutional sentiment is ready to re-engage spot markets on a larger scale.
The market still faces a delicate balance between supply pressure and demand absorption. If buyers re-enter with conviction and open interest climbs toward the levels that historically accompany durable upswings, BTC could eye the $80,000 mark in the months ahead. Until then, the data suggests a cautious stance: a quieting of selling pressure at the margin, paired with a need for stronger spot demand to convert relief rallies into sustainable upside.

Fundamental backdrop
In late April 2026, Japan’s Ministry of Finance moved from verbal warnings to direct action, carrying out a currency intervention worth roughly ¥5.5 trillion ($35 billion) — the first since July 2024. The move was triggered by the yen weakening beyond the psychologically significant level of 160 against the dollar.
Additional context comes from the divergence in monetary policy between the ECB and the Bank of Japan: the European regulator continues to leave the door open to tighter policy amid rising inflation expectations, while Tokyo maintains a cautious normalisation path without providing clear guidance on the timing of its next move.
Technical picture
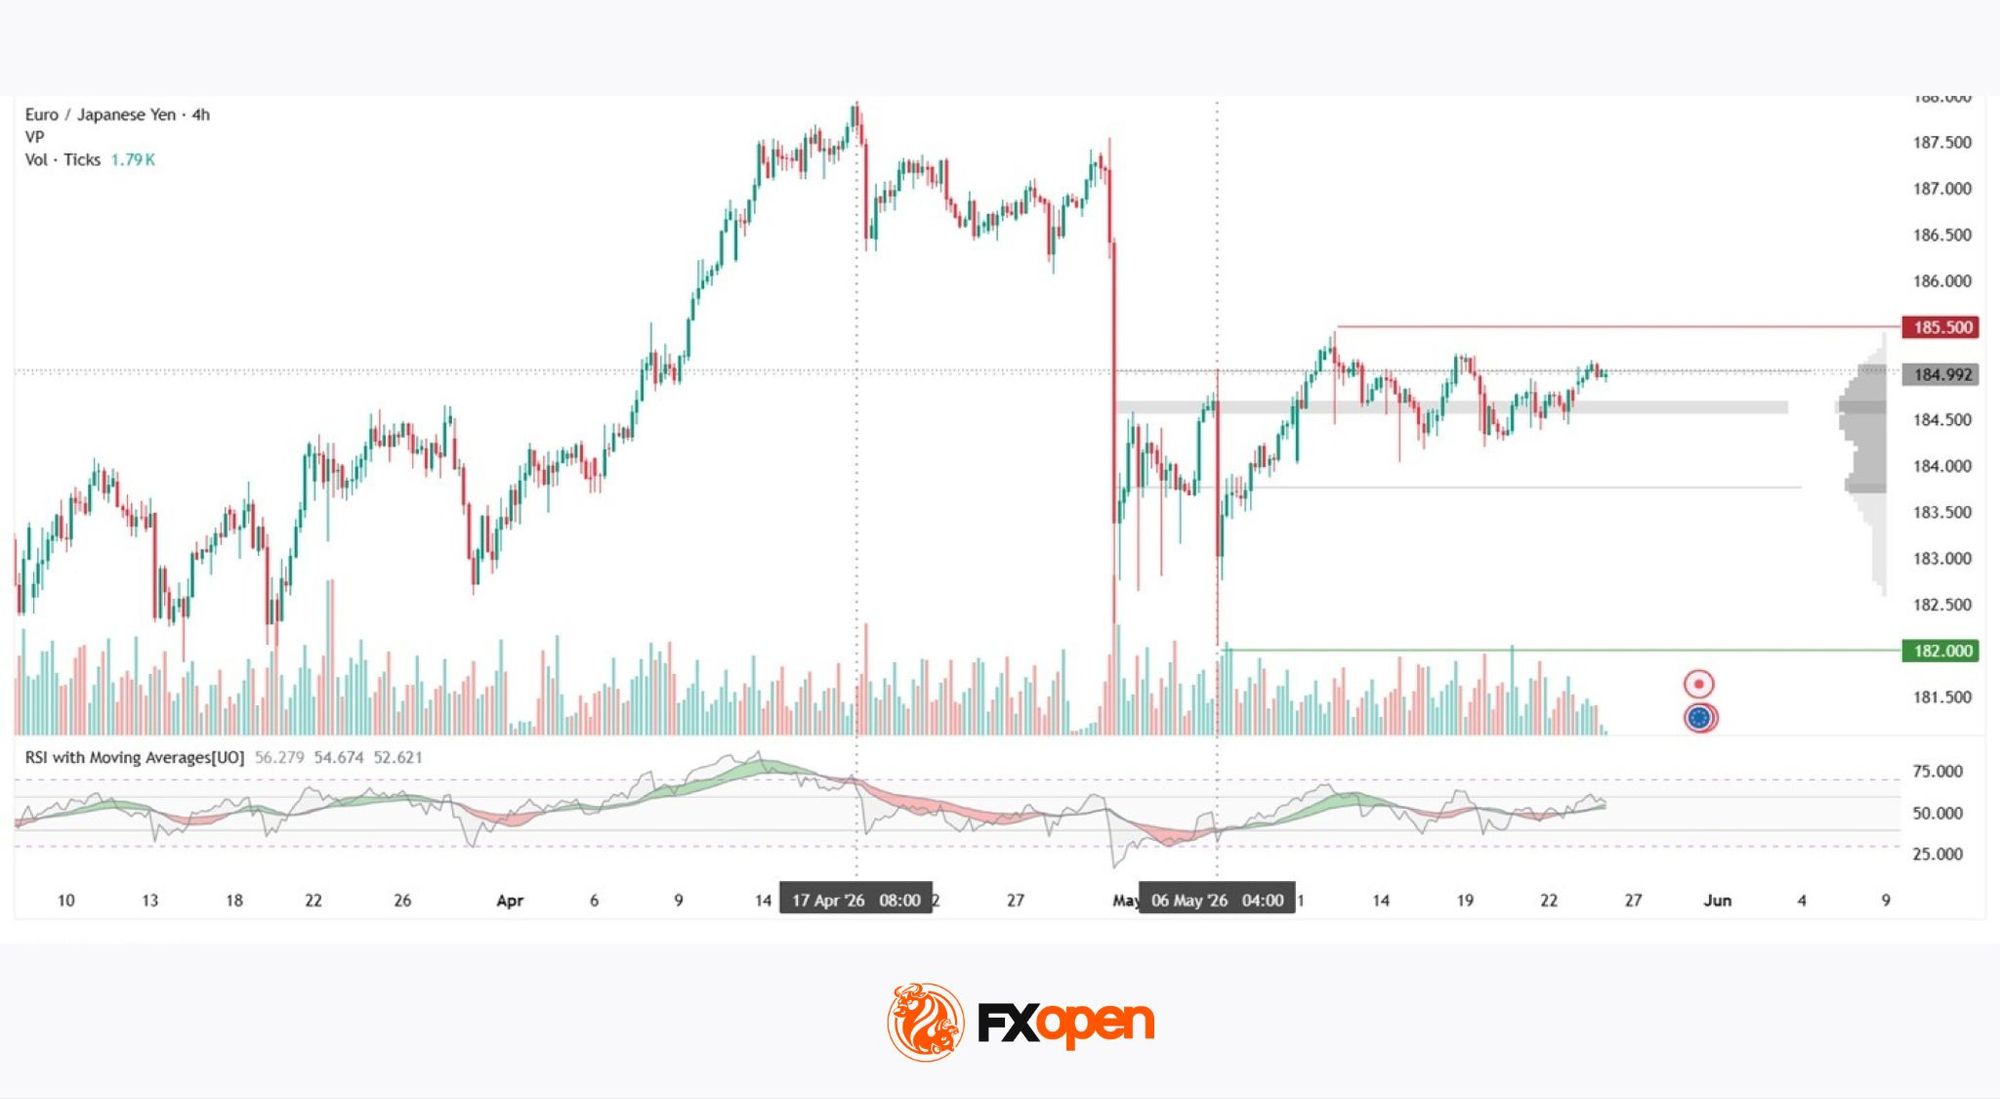
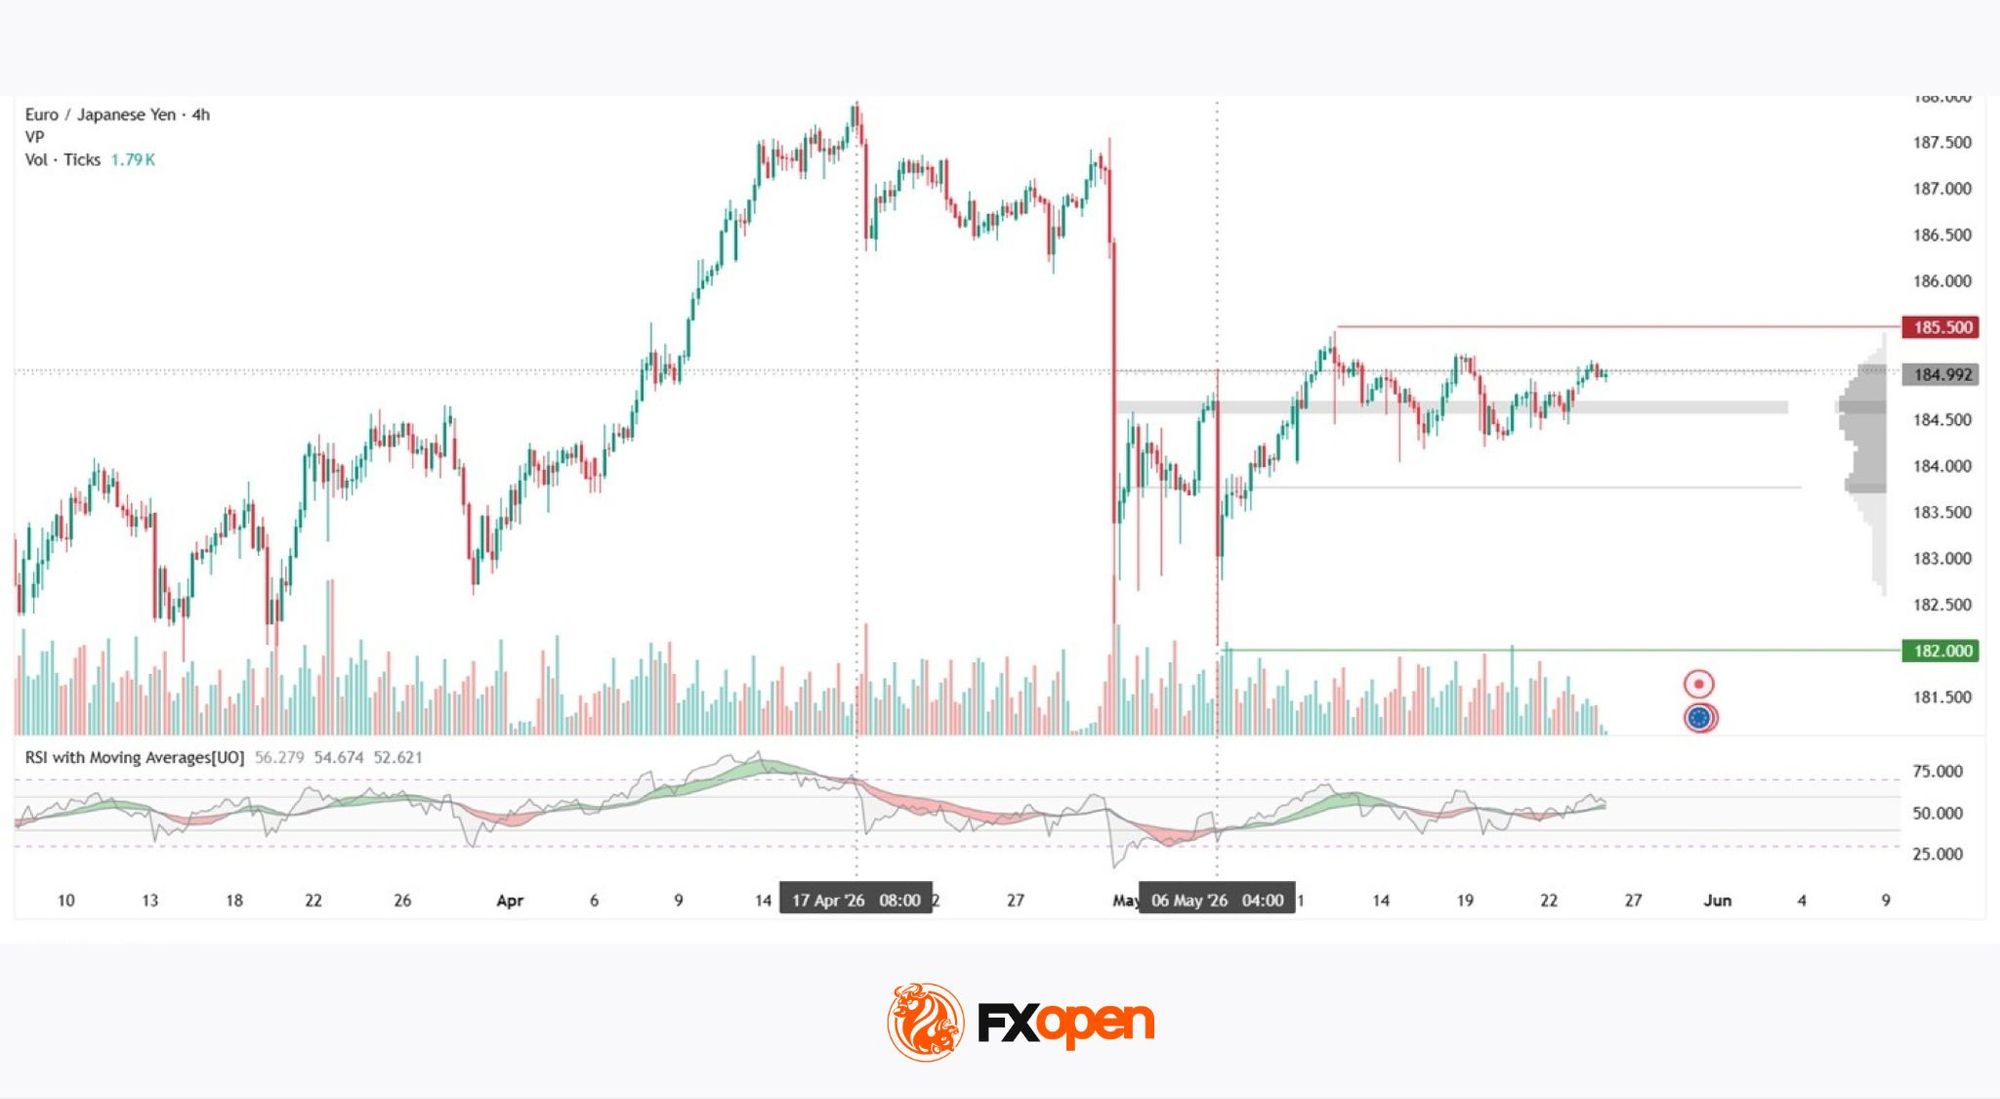
After reaching a local peak near 188 in mid-April, the EUR/JPY pair experienced two impulsive declines. The first occurred on 30 April, when the candlestick recorded an abnormal spike in vertical volume — a direct consequence of the Japanese Ministry of Finance intervention, which saw the yen strengthen by roughly 3% during the session. A second bout of sharp selling pressure followed in early May.
As a result, a horizontal profile formed with boundaries at 183.800–185.000, while the point of control is concentrated within the 184.50–184.70 range.
The price is now testing the upper boundary of the profile — an area where sellers have already shown activity on two separate occasions. The 182 region has held since February and could once again come into focus if pressure resumes: both May sell-offs reversed precisely from this zone, failing to break lower. Meanwhile, the 185.500 area could act as resistance should the current advance continue.
RSI + MA readings stand at 57 / 55 / 53 respectively — all three lines remain in neutral territory, with no clear signs of momentum.
Key takeaways
The current situation is shaped by the clash between interest-rate differentials and the willingness of the Japanese authorities to intervene again if necessary. For now, with RSI offering no directional impulse, the point of control and the profile boundaries remain the key reference levels for assessing the current trading range.
Trade over 50 forex markets 24 hours a day with FXOpen. Take advantage of low commissions, deep liquidity, and spreads from 0.0 pips (additional fees may apply). Open your FXOpen account now or learn more about trading forex with FXOpen.
This article represents the opinion of the Companies operating under the FXOpen brand only. It is not to be construed as an offer, solicitation, or recommendation with respect to products and services provided by the Companies operating under the FXOpen brand, nor is it to be considered financial advice.

Bitcoin prices slid back below $76,500 on Tuesday morning, down 1.5% from its intraday high of $77,700 on Monday.
The move followed reports that the United States had resumed strikes on Southern Iran, targeting missile sites and boats attempting to place mines.
The strikes were carried out “to protect our troops from threats posed by Iranian forces,” but the military was “using restraint during the ongoing ceasefire,” said US Central Command in a statement.
Deal or No Deal?
Just hours before, President Trump posted on Truth Social that negotiations with Iran are “proceeding nicely.”
“It will only be a Great Deal for all or no Deal at all — Back to the Battlefront and shooting, but bigger and stronger than ever before — And nobody wants that!”
Over the weekend, Trump claimed that a deal was “largely negotiated,” leading to hopes that it would be finalized this week.
Crude oil prices, which dipped below $90 for the first time this month on Monday, were back up around 2% as the conflict resumed.
Jeff Mei, chief operations officer at the BTSE exchange, remained optimistic. “We believe that if US attacks on Iran are limited, it’s unlikely that Bitcoin will fall lower than the $70k mark,” he said.
“However, if the conflict looks like it may be sustained over a longer period of time, Bitcoin could very well drop back to the $60k floor reached at the beginning of the conflict.”
Jeff Ko, chief analyst at CoinEx, agreed, telling CryptoPotato on Tuesday that technically, $70,000 remains the “next defended floor for Bitcoin,” while $65,000 would be the “next key stress level” if the macro or geopolitical backdrop deteriorates further.
“That said, I think Bitcoin’s ability to absorb recent macro shocks has actually been quite constructive,” he added.
“The asset has not broken down despite the geopolitical uncertainty, which suggests the market is consolidating rather than entering a full risk-off phase.”
Is BTC About to Fall Further?
Macro trader Jason Pizzino remained bearish, opining on X that Bitcoin looks to be getting ready to test the lows again, like it does every bear market.
“Falling volume, lack of social interest (search volume), and a structure reminiscent of further weakness,” he said.
Bitcoin looks to be getting ready to test the lows again like it does every bear market (or 4-year cycle).
Falling volume, lack of social interest (search volume), and a structure reminiscent of further weakness.
The perma bears will be calling lower and lower prices, while the… pic.twitter.com/KwowfhSWzb
— Jason Pizzino
(@jasonpizzino) May 26, 2026
BTC was trading at $76,480 at the time of writing, with further losses looking imminent.
The post Bitcoin Dips on Renewed US Strikes on Iran: Is the Peace Deal Off? appeared first on CryptoPotato.
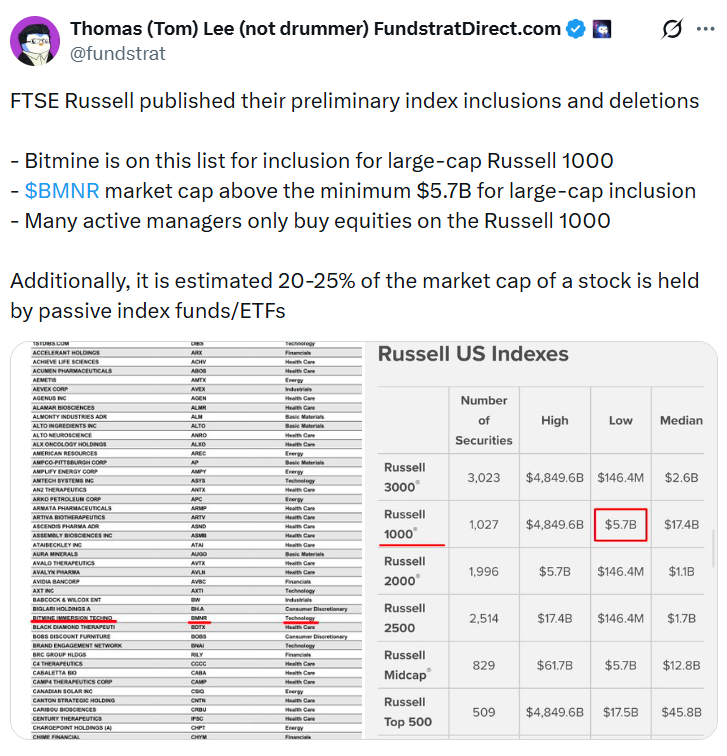
Ether treasury company Bitmine Immersion Technologies has been included in a preliminary list for potential inclusion in the Russell 3000 index, a move that chairman Tom Lee hinted could provide tailwinds for the company’s stock.
FTSE Russell, a subsidiary of the London Stock Exchange Group, published a preliminary index inclusion list for the Russell 3000 on Friday, its index tracking the 3,000 largest companies in the US.
Lee said in an X post Saturday that Bitmine could be included in the Russell 1000, an index tracking the largest 1,000 US companies, due to the index’s minimum market capitalization threshold of $5.7 billion. Bitmine’s market cap was $10.15 billion as of market close on Friday.
Lee said that “many active managers only buy equities on the Russell 1000,” adding that it is estimated that up to 25% of the market cap of a stock included in the index is held by passive index funds or exchange-traded funds.
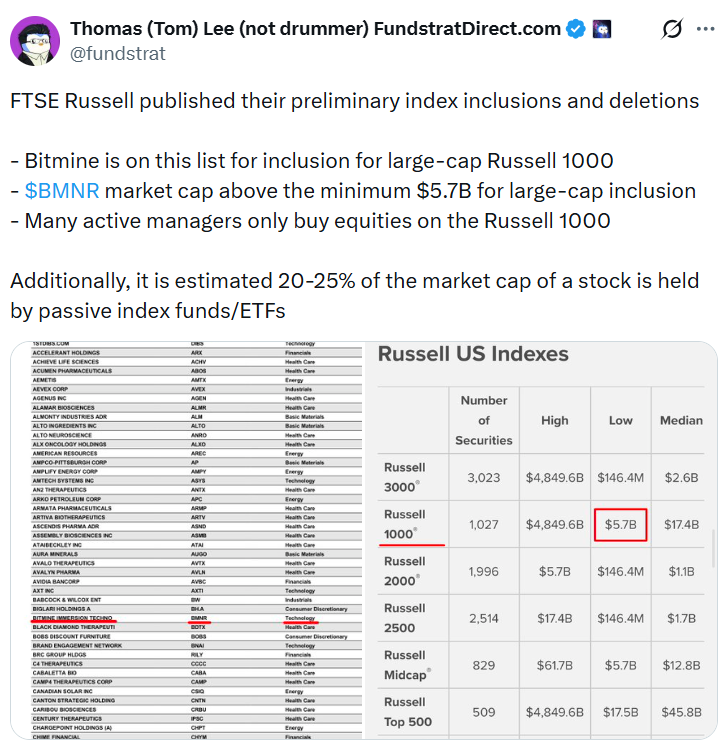
Source: Tom Lee
Bitmine’s inclusion in the Russell 1000 would place it in the same index as major US large-cap equities, including tech giants Nvidia Corporation, Microsoft, and Apple and could trigger automatic buying by passive funds, providing traditional investors with indirect exposure to its Ether holdings.
FTSE Russell will provide further list updates on, June 5, June 12 and June 18, and the newly reconstituted indexes take effect after the US market close on June 26.
Bitmine stock down 30% year to date
Shares in Bitmine Immersion Technologies (BMNR) are down over 30% year-to-date and closed trading on Friday at $18.88. The company announced plans to build an Ether treasury in July 2025. By July 3, its stock had spiked to more than $135. The company disclosed holdings of 163,142 Ether worth about $500 million on July 14 of the same year.
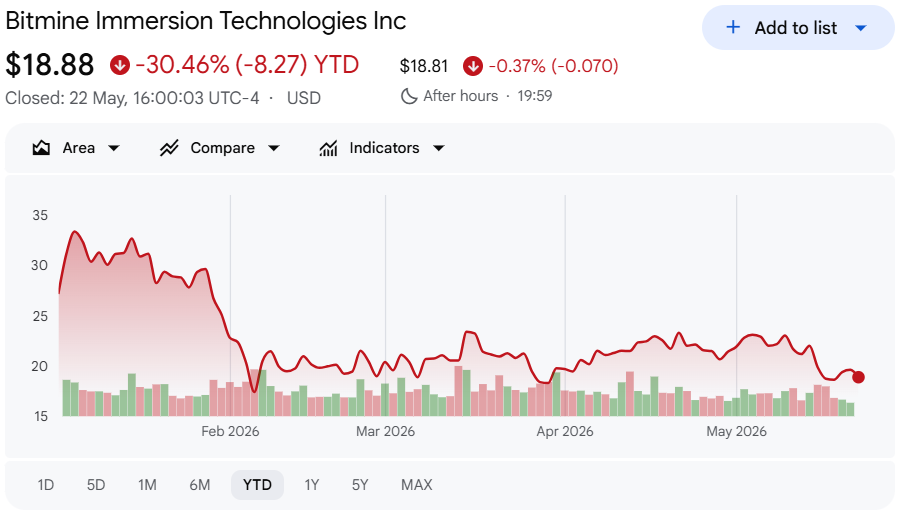
Bitmine’s stock is down over 30% year-to-date. Source: Google Finance
As of last week, Bitmine held 5.28 million Ether, or about 4.37% of Ethereum’s total supply, with the company’s ultimate goal to hold 5% of the token’s circulating supply of 120.7 million. To hit its target of over 6 million Ether, Bitmine needs around 756,538 more in its stash.
Related: Ether pullback was ‘attractive opportunity’ for 71,672 ETH buy: Bitmine’s Lee
Ether is down over 57% from its all-time high of $4,946, according to CoinGecko. BitMine also has an estimated $7.3 billion in paper losses due to the price drop.
However, Lee previously argued that Ether’s steep drawdown may offer another buying opportunity and said last Monday that the company has staked most of its stash, with annualized staking revenues of $289 million.
Magazine: Polymarket seeks Japan entry, Harvard dumps entire ETH position: Hodler’s Digest, May 17 – 23


XRP traded near $1.35 as Santiment’s sentiment ratio fell to 1.1, putting $1.30 support and a short-term rebound setup in focus.


Ondo Finance founder Nathan Allman has died, the company said in a post on X on Tuesday, without disclosing the cause.
“It is with profound sadness that we announce the unexpected passing of Nathan Allman, Ondo’s founder. Our hearts are with his family and loved ones,” the company said. “Nate’s brilliance, humility, and drive shaped every part of what Ondo is today. His belief in the power of technology to create a more open, accessible financial system lives on in everything we build.”
Ian De Bode, Ondo’s longtime president who has led strategy, product, and day-to-day operations for over two years, will serve as CEO. De Bode has the full confidence of the leadership team, the company said.
Allman, a Brown University graduate, founded Ondo in 2021 after working on Goldman Sachs’ digital assets team. Under his leadership, Ondo became a pioneer in tokenized real-world assets, growing total value locked to $3.5 billion.
Major products launched during his tenure include USDY, a yield-bearing stablecoin, OUSG, a tokenized U.S. Treasury fund, and tokenized equities through Ondo Global Markets.
The company said it would continue building what Allman started as the most meaningful way to honor him.
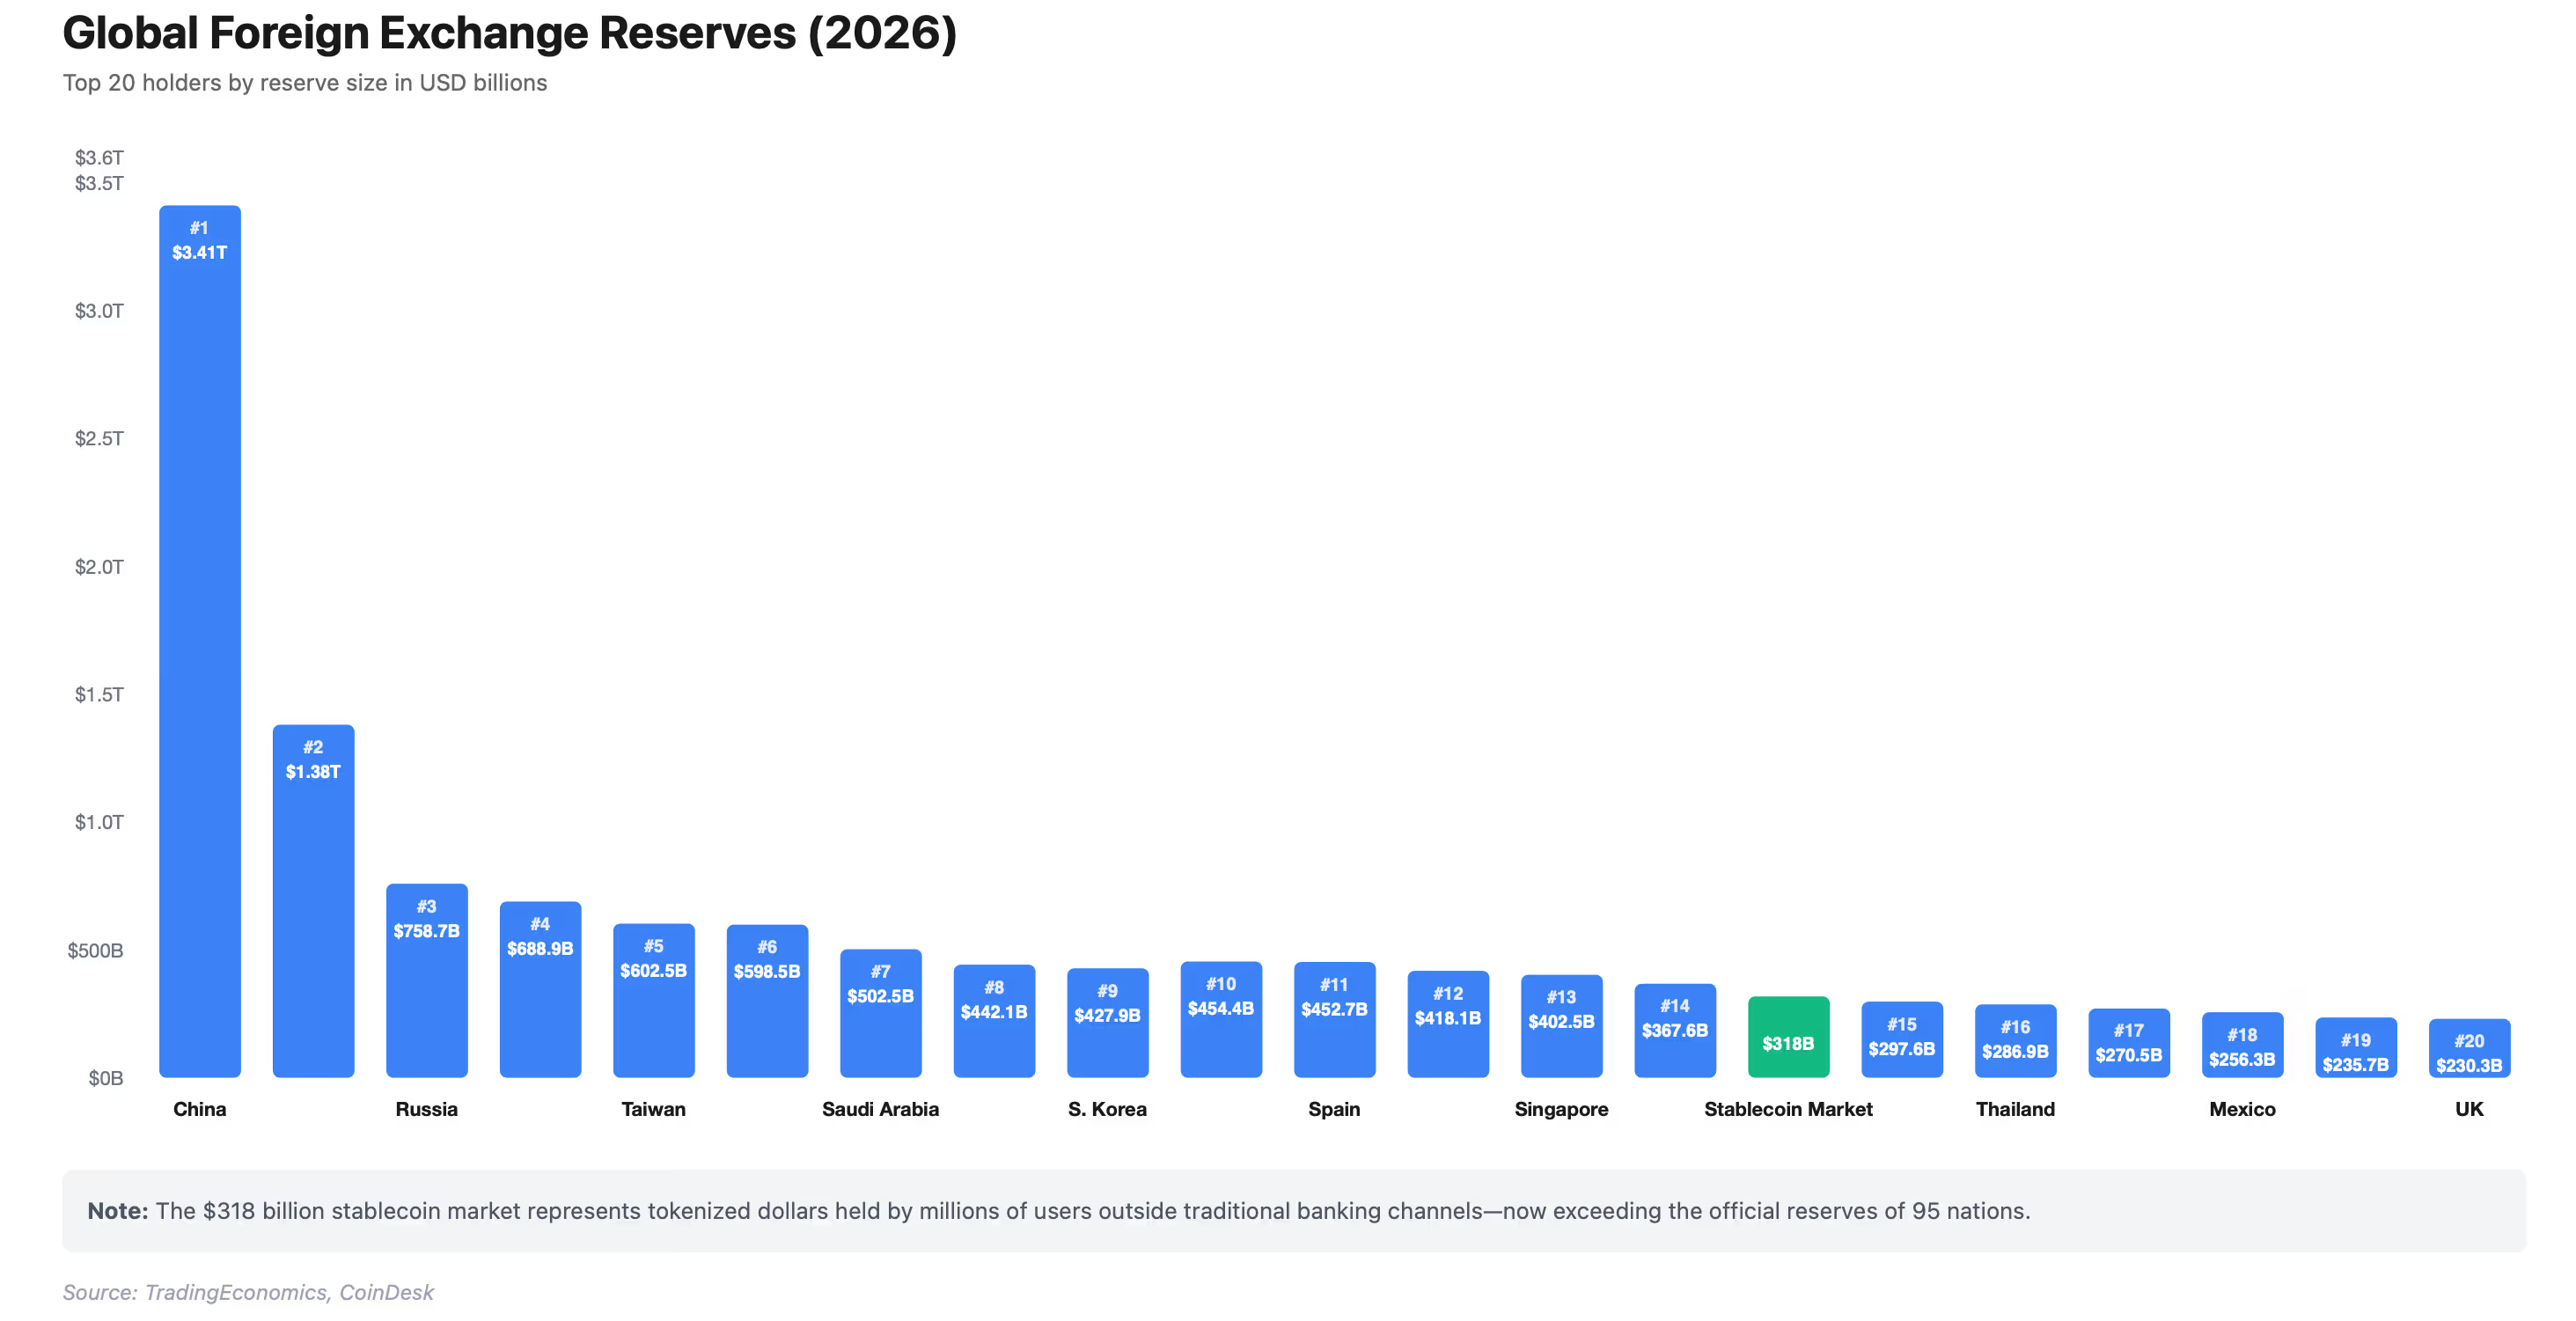
The combined market value of all stablecoins has hit a record high of $322 billion, dwarfing the foreign exchange reserves of 95 countries, including several developed countries.
As of now, their combined market cap is bigger than the FX reserves of Poland, Thailand, Mexico, and developed economies such as the United Kingdom, Canada and even the oil-exporting giant United Arab Emirates.
In essence, the amount of dollars and other fiat currencies held by users outside traditional banking channels now exceeds the official FX reserves, a sovereign protective cover against external economic shocks, of most nations.
Stablecoins are tokenized versions of fiat currencies issued on blockchain. Their values are pegged 1:1 to the U.S. dollar or other currencies such as the euro, yen, Swiss franc and others. Their combined market cap has grown multi-fold in recent years, with most activity concentrated in dollar-pegged coins such as tether and USD Coin (USDC).
The growth is evidence of how fast capital is migrating to blockchain rails.
Foreign exchange (FX) reserves are the dollars, euros, yen, and gold that central banks hold as a buffer to stabilize their currencies, pay foreign debts, and finance energy and other imports. Only 14 nations, led by China, Japan, Russia, India, Taiwan and Germany, hold more FX reserves than the market value of stablecoins.

Double-edged sword
Stablecoins are widely used for trading cryptocurrencies. They allow users to exit volatile tokens without converting back to fiat currencies. For DeFi protocols, they serve as the settlement layer, and for cross-border payments, they provide a faster, cheaper way to move money across borders while bypassing legacy banking channels.
“The use of stablecoins in cross-border payments has grown, notably in corridors where legacy correspondent banking is slow or costly,” a recently released Bank of International Settlements report said. “Cross-border stablecoin flows have grown substantially since 2022, with particularly pronounced activity in regions experiencing high inflation and exchange rate volatility.”
But the ease of moving money comes with a risk.
Stablecoin transactions can trigger capital outflows, leaving already vulnerable current account deficit countries exposed to fiat-currency depreciation.
“Increases in stablecoin flows are associated with subsequent domestic currency depreciation, deviations from covered interest parity and widening wedges between stablecoin-implied and official exchange rates in segmented markets (Aldasoro et al (2026)),” the BIS said.
“These patterns are consistent with stablecoins enabling circumvention of capital controls and providing a relatively frictionless mechanism for EMDE residents to shift savings into dollar-denominated instruments,” the bank added.


Commonwealth Bank of Australia CEO Matt Comyn warned that artificial intelligence (AI) will impact jobs across many industries.
The executive argued that AI will reshape work across the economy, and that downplaying its impact on jobs will not protect workers.
CBA CEO: Pretending AI Won’t Cost Jobs Doesn’t Protect Workers
In an opinion article, Comyn noted that the future of work remains highly uncertain, both in the near term and over the coming decade.
He explained that while certain tasks are likely to become automated and some positions may shrink, other roles are expected to expand.
He also pointed out that many jobs could retain their overall structure even as their skills and responsibilities evolve. According to Comyn, it is far easier to predict which aspects of current work may vanish than to anticipate the entirely new forms of employment that could emerge.
“This will mean real change for people. At CBA, as in many large organisations, some work will be done by smaller teams. At the same time, some career paths will steepen as people use AI to take on more complex work sooner. This will create opportunities for many people, but it will be demanding for everyone. Pretending otherwise does not protect workers. It only ensures they are surprised later,” the executive wrote.
2026 Layoffs Add to AI Job Cut Wave
The statement comes as AI-driven job cuts continue across the tech industry. In April, Bloomberg reported that CBA will eliminate around 120 roles, following a separate round of layoffs announced two months earlier that affected roughly 300 employees.
Meanwhile, website-building platform Wix is reportedly preparing to cut 20% of its workforce, impacting around 1,000 employees across Israel and international operations, according to reports in the Hebrew media.
Follow us on X to get the latest news as it happens
US tech layoffs reached 52,050 in Q1, a 40% jump year over year, according to Challenger, Gray & Christmas. Global tracker TrueUp logged more than 144,000 cuts in 2026, with California already preparing for AI displacement.
Comyn’s warning and the job cuts suggest AI restructuring is moving from individual roles to broader workforce reshaping.
Subscribe to our YouTube channel to watch leaders and journalists provide expert insights
The post CEO of Australia’s Largest Bank Sees AI Workforce Consequences Across the Economy appeared first on BeInCrypto.
This article was updated with a post from Lookonchain.
Ethereum price has slipped into a bearish rounded top structure as institutional outflows, leveraged shorts, and weakening momentum pressure the token below $2,150.
Summary
- Ethereum price has formed a bearish rounded top pattern after failing repeatedly near $2,400, with analysts warning of a possible drop toward $1,900.
- U.S. spot Ethereum ETFs recorded nine straight sessions of outflows, with roughly 114,871 ETH worth $244.79 million exiting funds in one week.
- A trader opened a $100 million leveraged ETH short position as liquidation heatmaps showed heavy resistance clustered around the $2,150 level.
According to data from crypto.news, Ethereum (ETH) price was trading near $2,115 at press time after falling nearly 12% over the past seven days. The token briefly rebounded from the psychological $2,000 support zone as traders continued rotating capital into Bitcoin while risk appetite across altcoins weakened.
Part of the recent selling pressure emerged immediately after the U.S. Senate Banking Committee advanced the CLARITY Act on May 19. Instead of fueling a sustained rally, the regulatory breakthrough triggered a major sell-the-news reaction across Ethereum markets as traders locked in profits following weeks of speculative positioning ahead of the vote.
Institutional sentiment deteriorated further after JPMorgan published a bearish report warning that Ethereum’s future upgrades, including Glamsterdam and Hegotá, could continue weakening the network’s fee-burning mechanism.
Analysts at the bank argued that falling Layer-2 transaction costs were reducing ETH burn activity enough to keep the asset structurally inflationary rather than deflationary, a thesis that damaged confidence among large investors.
At the same time, spot Ethereum ETFs in the United States recorded their tenth consecutive trading session of net outflows on Friday. Data compiled by SoSoValue shows that over the past week, roughly $215 million exited the funds. The persistent selling streak removed a major source of buy-side liquidity just as Bitcoin continued attracting institutional inflows.
On-chain data also signaled weakening conviction among large holders. Whale addresses holding significant ETH balances reportedly dropped from around 1,100 to nearly 1,030 during the correction period.
Meanwhile, the ETH/BTC ratio slid toward 0.027, its lowest level this year, highlighting Ethereum’s underperformance relative to Bitcoin as investors increasingly favored the safer large-cap asset.
Outside crypto markets, easing tensions between the United States and Iran briefly improved sentiment across risk assets after both sides reportedly discussed a temporary ceasefire framework and partial reopening of the Strait of Hormuz.
Oil prices retreated 5$ to $91 on Monday following the headlines, reducing immediate inflation concerns and helping Ethereum stabilize above $2,000 after several sessions of aggressive liquidation-driven selling.
Is Ethereum forming a major bearish reversal pattern?
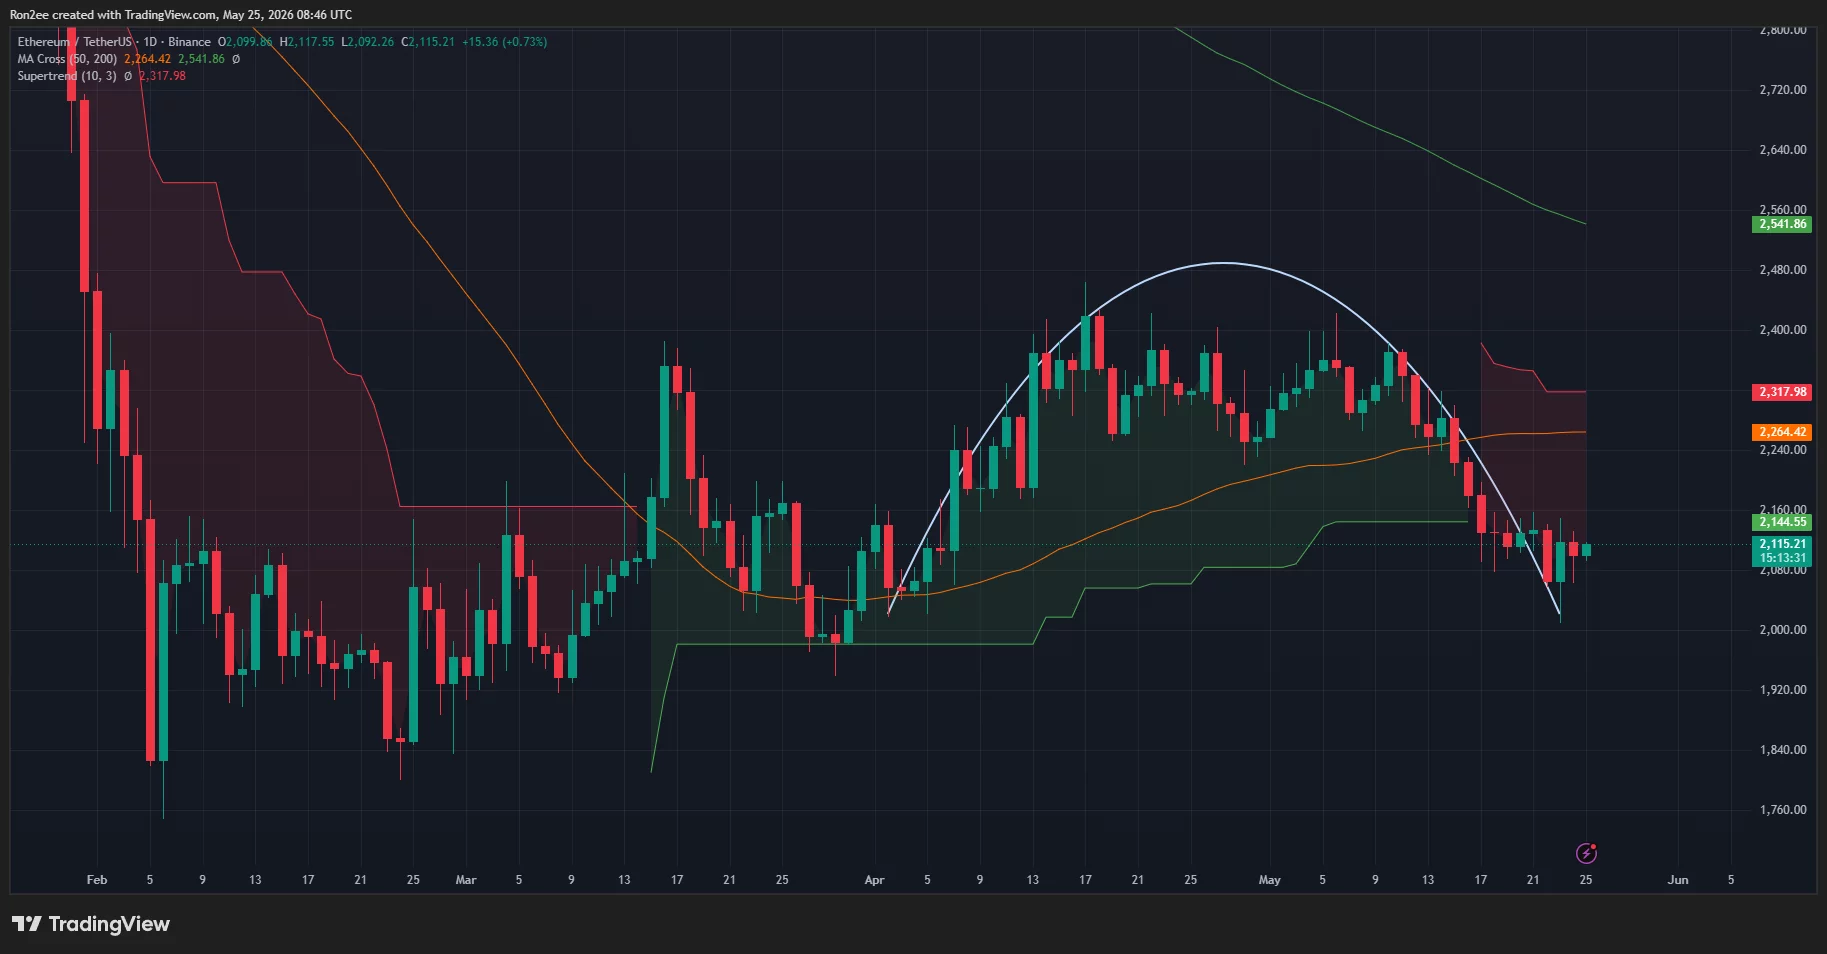
On the daily chart, Ethereum has formed what appears to be a bearish rounded top pattern stretching from mid-April into late May. The structure developed after ETH failed multiple times to sustain momentum above the $2,400 region, gradually transitioning from higher highs into a curved distribution pattern before breaking lower.
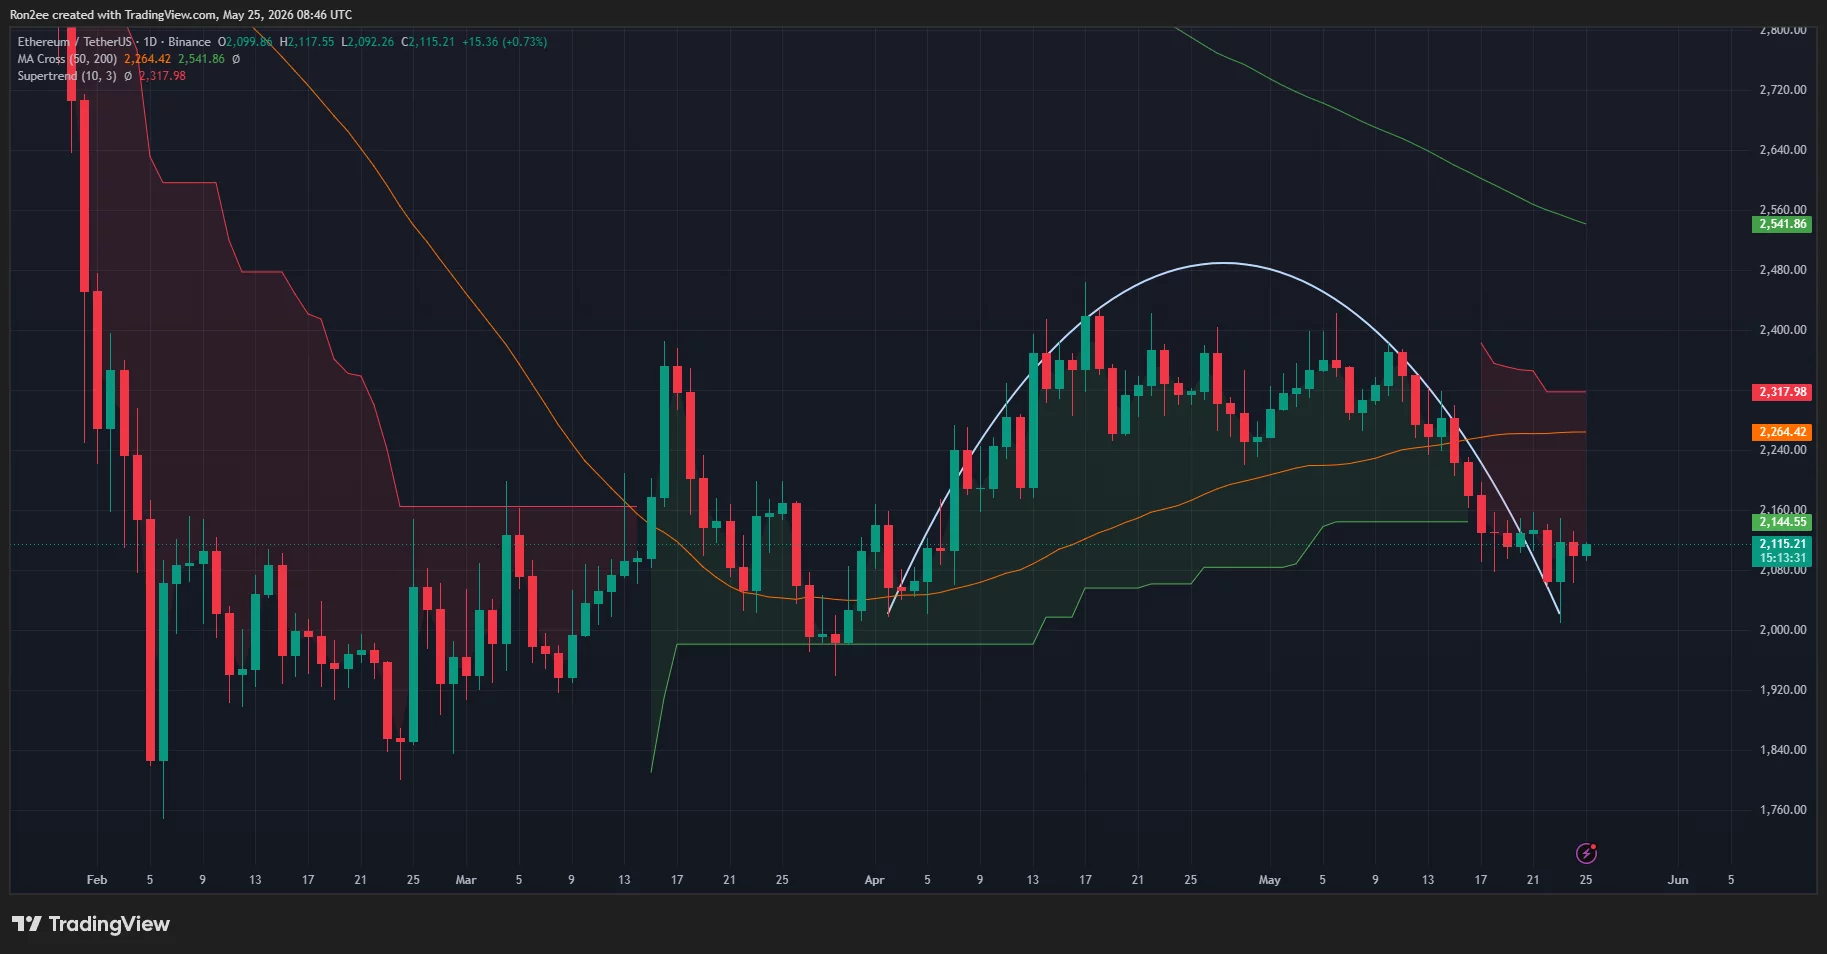
The rounded top neckline around $2,150 has now flipped into immediate resistance. Ethereum attempted to reclaim that level during the latest rebound but sellers quickly rejected the move, reinforcing bearish control over short-term price action.
Technical indicators continue leaning negative. Ethereum remains below the Supertrend resistance near $2,318 while also trading under the 50-day moving average around $2,264. The longer-term 200-day moving average near $2,541 continues sloping downward, showing that the broader trend remains weak despite temporary relief rallies.
A breakdown projection from the rounded top pattern points toward a possible move into the $1,850–$1,900 range if sellers regain momentum. That target aligns with the lower support zone visible on the chart from February’s consolidation period.
Meanwhile, liquidation data from CoinGlass shows heavy leverage concentration between $2,150 and $2,170, creating a major liquidity barrier directly above current price levels. Bright liquidation clusters in that region suggest many short positions could be forced out if ETH successfully reclaims resistance, potentially triggering a short squeeze toward $2,250.
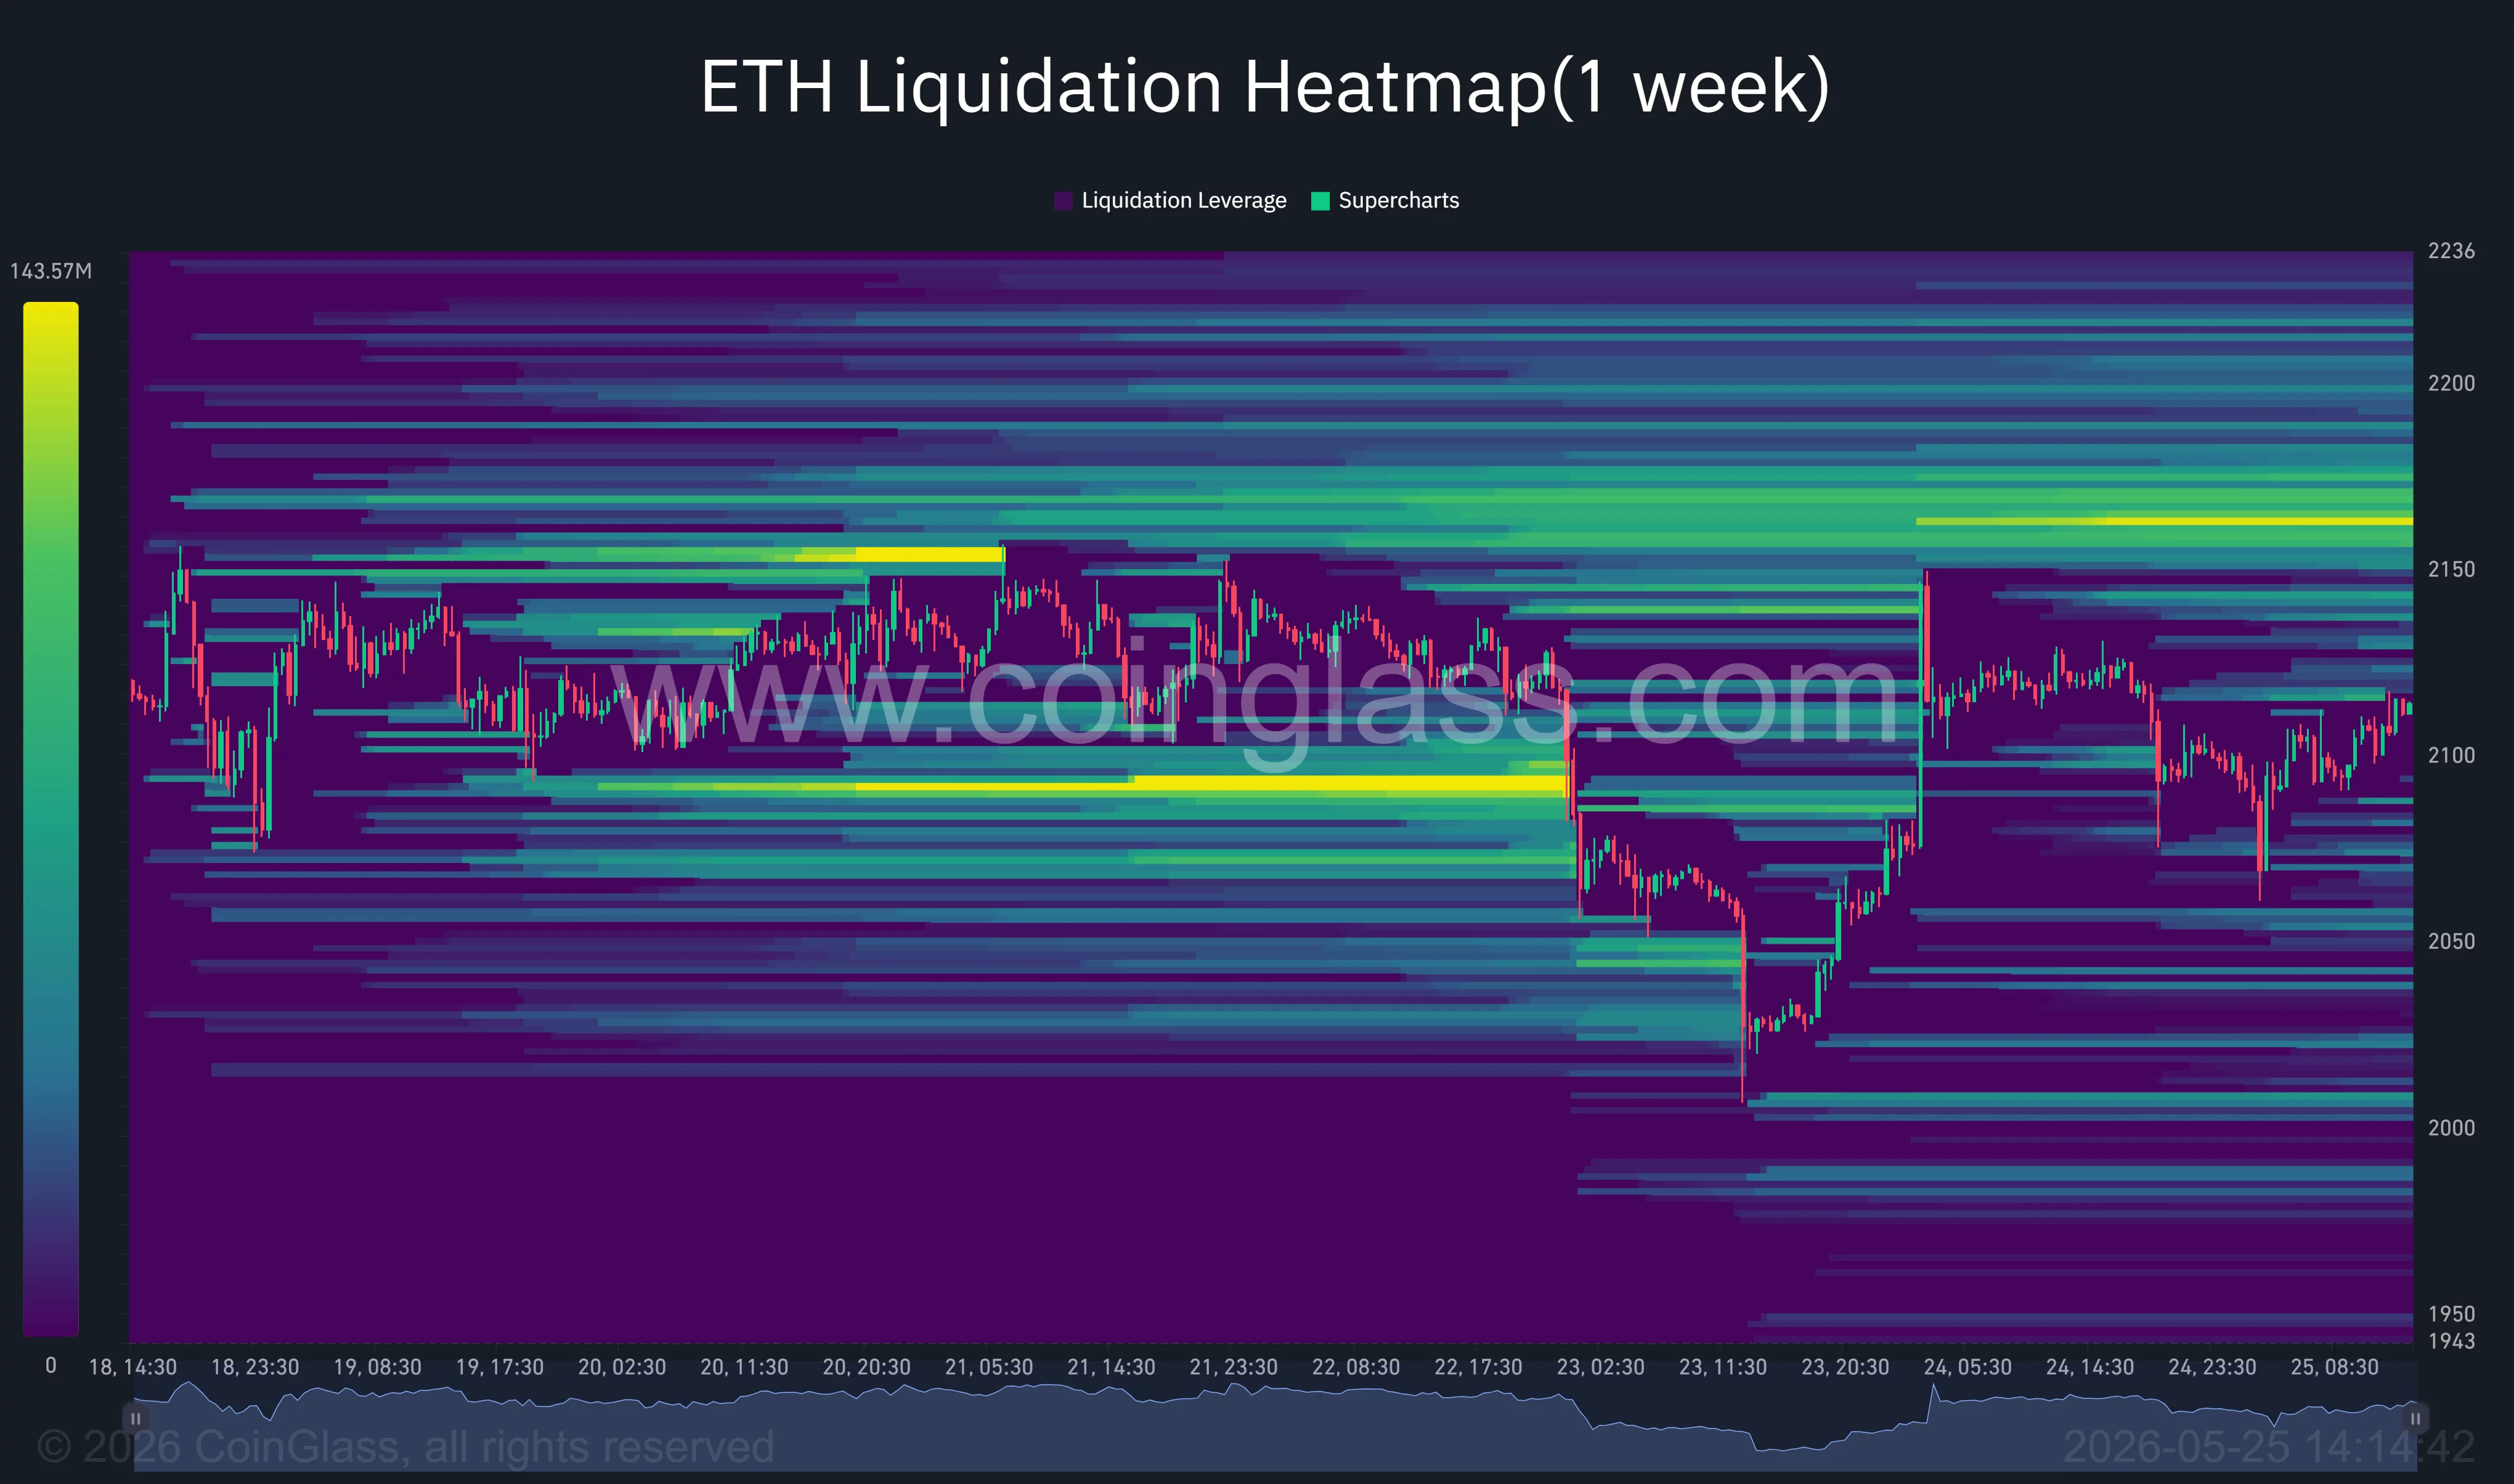
Still, downside liquidity remains substantial below $2,050 and near the $2,000 psychological level. A decisive breakdown beneath those zones could accelerate long liquidations and intensify volatility across perpetual futures markets.
Blockchain tracking platform Lookonchain revealed that a trader recently opened a massive 23x leveraged Ethereum short position worth more than $100 million. According to the post, the position involved roughly 47,600 ETH with a liquidation price near $2,149, placing the trade directly around Ethereum’s current resistance cluster.
Analyst Ted Pillows also warned that Ethereum remains trapped below a critical supply zone.
“ETH bounced back from the $2,000 support level but got rejected from the $2,150 resistance zone,” he wrote on X. “If Ethereum manages to reclaim the $2,150 zone, it could rally quickly towards $2,250. A failure to reclaim means $2,000 will be retested soon.”
Funding rates across major derivatives exchanges have also started turning negative again, suggesting traders are increasingly positioning for downside continuation. Open interest has remained elevated despite the recent correction, a sign that leveraged bets are still heavily active in the market.
What could invalidate Ethereum’s bearish setup?
Despite mounting bearish signals, Ethereum has not yet confirmed a full trend collapse. Bulls continue defending the $2,000 region aggressively, and repeated rebounds from that area indicate that spot demand remains active at lower levels.
Any sustained move back above $2,150 would weaken the rounded top structure significantly. Such a breakout could force leveraged shorts to unwind rapidly, especially given the dense liquidation clusters sitting above resistance. In that scenario, Ethereum could revisit the $2,250 and $2,400 levels relatively quickly.
Furthermore, progress in U.S.-Iran negotiations or a sharper decline in crude oil prices could improve overall risk appetite and reduce inflation fears tied to energy markets. This would likely benefit crypto assets broadly, particularly large-cap tokens like Ethereum that remain sensitive to institutional flows.
Federal Reserve expectations remain another major variable. Traders are still closely watching incoming U.S. inflation and labor market data for clues on future interest rate policy. Any signals supporting earlier rate cuts could weaken the dollar and revive demand for speculative assets.
Stablecoin activity on Ethereum continues providing one bullish structural backdrop as well. The network still dominates global stablecoin settlement volume, and elevated issuance levels suggest underlying blockchain activity has not collapsed despite price weakness.
For now, however, Ethereum remains stuck between heavy resistance near $2,150 and fragile support at $2,000. A decisive move outside that range will likely determine whether the current structure evolves into a deeper crash or another short-term recovery rally.
Disclosure: This article does not represent investment advice. The content and materials featured on this page are for educational purposes only.

Nathan Allman, the founder and CEO of Ondo Finance and a leading light in the tokenization of real-world assets, has died at age 32. Ondo confirmed the loss in a post on X, expressing profound sadness and offering thoughts to Allman’s family and loved ones.
Ondo described Allman as the architect of the company’s mission to reshape finance through open, accessible technology. The firm credited him with driving the tokenization of billions of dollars in traditional assets and building a community of investors around on-chain representations of real-world assets. According to Ondo, the on-chain stack now includes about $3.86 billion in tokenized real-world assets across U.S. Treasuries, stocks, and commodities, with more than 111,680 token holders owning a tokenized RWA issued by Ondo. The company also noted that leadership transitions will occur in the wake of Allman’s passing, while his influence remains embedded in the project’s ongoing work.
Allman’s impact extended beyond Ondo. He previously led the firm’s early efforts in tokenized assets after a stint in Goldman Sachs’ digital asset team. Before joining Ondo, he founded ChainStreet Capital, a crypto hedge fund focused on algorithmic, event-driven trading. Ondo said that its president, Ian De Bode, would assume the role of CEO, with the company stressing that Allman’s mission would continue to guide its development. De Bode described the moment as deeply painful for the Ondo family, while affirming the team’s commitment to executing with excellence in Allman’s memory.
Key takeaways
- Nathan Allman, founder and CEO of Ondo Finance, died unexpectedly at 32, according to a company post on X.
- Ondo says Allman helped bring $3.86 billion worth of tokenized real-world assets on-chain, spanning U.S. Treasuries, stocks, and commodities, with over 111,680 token holders of Ondo-issued RWA tokens.
- Leadership transition: Ondo’s president, Ian De Bode, will become CEO as the company continues Allman’s mission and strategy.
- Allman’s career traced from Goldman Sachs’ digital asset team to founding Ondo and, previously, ChainStreet Capital, a crypto hedge fund.
- The tokenization movement, which Allman helped propel, continues to attract attention from large institutions and funds, including coverage of Wall Street interest in tokenized assets, though details about cause of death remain private.
From Goldman to Ondo: a founder’s path into tokenized finance
Allman’s professional arc reflects a bridge between traditional finance and blockchain-based tokenization. His early work with Goldman Sachs’ digital assets group positioned him at the intersection of regulated markets and cutting-edge technology. The jump to founding Ondo in 2021 found him at the forefront of a sector that aims to bring real-world assets onto public blockchains, enabling on-chain trading, settlement, and fractional ownership. Ondo’s initiatives during his tenure included tokenizing government and corporate securities and expanding access to assets through tokenized structures that could, in theory, offer improved liquidity and accessibility for a broader investor base.
BeyondOndo, Allman’s prior venture, ChainStreet Capital, reflected an emphasis on algorithmic and event-driven strategies within the crypto hedge fund space. His background and approach helped shape a narrative in which traditional assets could be represented and traded on-chain, aligning with broader industry pushback against opaque, opaque intermediaries and toward more open, automated, and auditable markets.
Leadership transitions and what comes next for Ondo
Ondo announced that its president, Ian De Bode, would assume the CEO role in light of Allman’s passing. De Bode told Cointelegraph that the company is grappling with an incredibly sad day and emphasized the personal connection to Allman, describing him as a close friend as well as a founder and visionary. “Nate’s mission has not changed,” De Bode said. “If Nate were here, he would want to continue executing with excellence. We will make him proud.”
In a separate voice, Ondo’s head of marketing and vice president, Ben Grossman, hailed Allman as a “once-in-a-generation founder and visionary” whose contributions helped shape the industry and who would be deeply missed. The company declined to disclose further details about the circumstances of Allman’s death, noting that the family has requested privacy at this time.
The broader implications: tokenization, regulation, and market momentum
Allman’s work placed Ondo at the center of a broader movement toward tokenized real-world assets (RWAs) that has drawn attention from established financial institutions. The idea that tokenized stocks, bonds, and other assets could trade with greater efficiency and transparency has been a persistent theme in industry circles, with large players expressing interest in the potential for improved settlement speed and accessibility. The tokenization wave has also intersected with policy scrutiny and regulatory considerations, as authorities weigh how tokenized RWAs should be treated within existing securities and commodities frameworks.
As the market observes Ondo’s trajectory under new leadership, readers should watch for indications of how the platform plans to scale its tokenized RWA offerings, manage risk around custody and settlement, and engage with potential institutional partners. The broader market remains attentive to whether the software and governance frameworks underpinning tokenized assets can sustain rapid growth amid ongoing regulatory conversations and the evolving appetite of traditional asset managers.
The death of a founder with a lasting imprint on the tokenization narrative inevitably raises questions about future momentum. While De Bode and the Ondo team have pledged continuity and commitment to Nate Allman’s mission, the path ahead will test the resilience of a space still crystallizing its regulatory footing and real-world utility. What remains certain is that Allman’s work helped catalyze a movement that continues to attract both investor interest and institutional curiosity, shaping how markets think about on-chain access to real-world assets.
As Ondo navigates this leadership transition, market watchers will be watching for concrete signals: new product releases or partnerships that extend tokenized RWA access, updates on risk controls surrounding on-chain collateral, and any shifts in governance that might reflect Allman’s ongoing influence. In the near term, the industry’s attention will likely focus on how the platform maintains liquidity, handling of custody, and compliance pathways as it scales the tokenization framework that Allman championed.
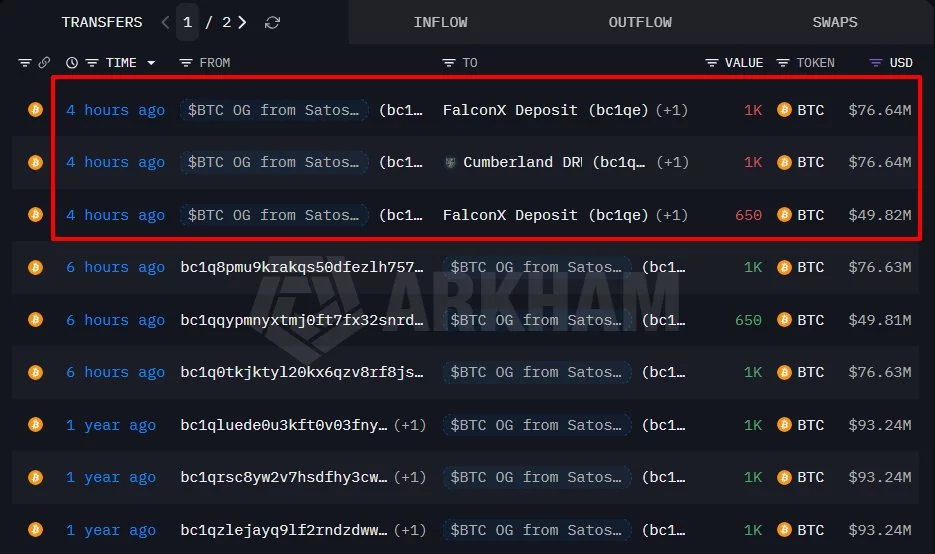
A Satoshi-era Bitcoin whale has transferred more than $200 million worth of BTC to crypto trading firms FalconX and Cumberland as exchange inflows and ETF outflows continue drawing attention across the market.
Summary
- A dormant Bitcoin whale moved 2,650 BTC worth about $203 million to FalconX and Cumberland in three transactions.
- Onchain Lens said the wallet still holds nearly 6,000 BTC valued at around $462 million.
According to blockchain analytics provider Onchain Lens, citing Arkham data, the dormant whale moved 2,650 BTC, valued at roughly $203 million, to FalconX and Cumberland through three separate transactions on Sunday.
Data shared by the analytics firm showed the address still holds nearly 6,000 BTC, currently worth around $462 million.
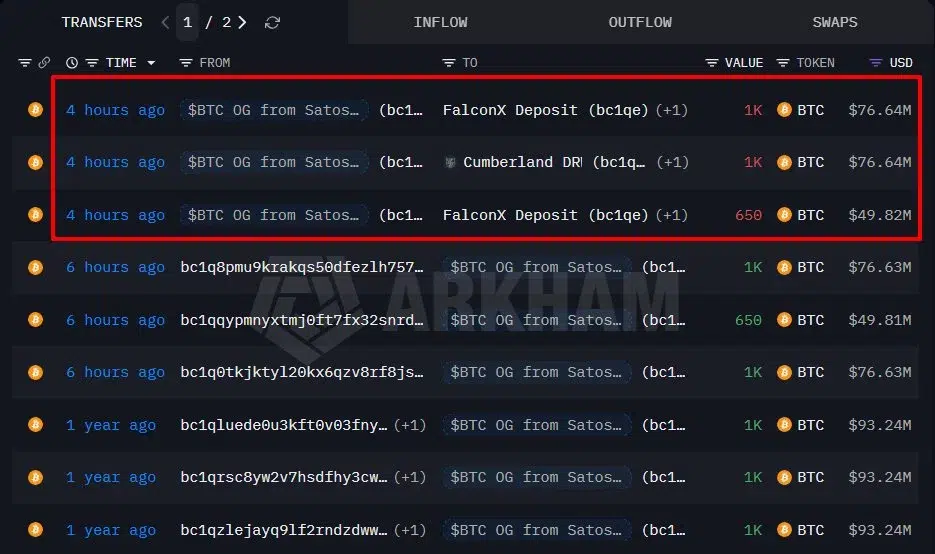
Whale transfers to FalconX and Cumberland. Source: Arkham Intelligence.
Although the transfers do not confirm an immediate sale, large wallet activations tied to early Bitcoin holders often attract market attention because traders watch for signs of additional supply entering the market.
Transfers to firms such as FalconX and Cumberland can sometimes be linked to over-the-counter transactions designed to avoid disrupting spot prices on public exchanges.
However, retail traders frequently interpret dormant whale activity as a bearish signal regardless of whether the coins are sold directly into the market. As such, concerns surrounding a possible liquidity event could increase precautionary selling and expose Bitcoin to another test of the recent $74,600 support level.
Whale transfers emerge as exchange inflows continue rising
The latest whale transaction has appeared during a period of growing concern over rising Bitcoin inflows to exchanges and trading desks.
Earlier this month, another dormant Bitcoin address moved 500 BTC worth about $40.6 million after remaining inactive for more than 12 years. Separately, a different whale transferred nearly $20 million in BTC to Binance last month.
As previously reported by crypto.news CryptoQuant analyst Darkfost said Binance recorded almost 10 consecutive days of elevated Bitcoin inflows.
Binance’s weekly average BTC inflows climbed from 378 BTC on May 16 to 1,190 BTC in less than 10 days.
Darkfost also reported that Binance registered a daily inflow exceeding 3,600 BTC on May 18, while exchange reserves increased from 616,000 BTC on April 24 to 632,000 BTC within one month.
According to the analyst, investors typically move Bitcoin onto exchanges when preparing to sell, reduce exposure, or secure profits during periods of uncertainty. Darkfost linked the inflow trend to market weakness tied to geopolitical tensions and softer appetite for risk assets.
Spot Bitcoin ETFs have also recorded sustained withdrawals during the same period. Crypto.news previously reported that U.S.-listed spot Bitcoin ETFs logged net outflows for six straight trading sessions between May 15 and May 22, with total redemptions reaching $1.26 billion across 11 funds.
While analytics platform Santiment said past ETF outflow streaks have occasionally appeared before long-term accumulation phases, the firm added that weaker ETF demand combined with rising exchange inflows can reduce visible buyer support in the short term.
Bitcoin (BTC) traded around $77,220 at the time of reporting, according to crypto.news price data. After briefly falling to nearly $74,600 on Saturday, the asset recovered modestly but remained well below its October 2025 all-time high near $124,900.

EUR/JPY: Yen Recovers April Losses as the Market Searches for a New Equilibrium

Taylor Swift Skips 2026 AMAs After Scoring Most Nominations

Crypto bill SURGES through committee but MAJOR risks remain


-

 Crypto World5 days ago
Blockchain.com files with SEC for U.S. IPO
-

 Fashion4 days ago
Holiday Weekend Open Thread – Corporette.com
-

 Business4 days ago
Dell Technologies DELL Stock Surges 15% on AI Server Momentum and Analyst Upgrades in 2026
-
 Crypto World4 days ago
Bitcoin Accumulation Weakens as BTC Realized Losses Hit $600M
-
 Crypto World4 days ago
Space X IPO Is ‘Bad News’ for Tech Stocks: But What About Bitcoin?
-

 Politics4 days ago
Makerfield: a tale of two social-media histories
-

 Crypto World3 days ago
Robinhood crypto COO Tanya Denisova exits
-
 Crypto World4 days ago
MicroStrategy’s Saylor Says Miners No Longer Set Bitcoin Price, Another Force Has Taken Over
-

 Business2 days ago
NYT Strands Answers May 24 2026 Revealed for Puzzle No. 812 Theme Summer Essentials
-
 Tech4 days ago
A 0.12% parameter add-on gives AI agents the working memory RAG can’t
-

 Crypto World4 days ago
AI infrastructure race heats up as IREN pitches full-stack strategy, WhiteFiber lands $160M deal
-

 Tech4 days ago
WhatsApp ads could make Irish debut after discussions with DPC
-

 Tech4 days ago
You Can Now Add ChatGPT To PowerPoint
-

 Business4 days ago
Trump Invests $1M-$5M in Kura Sushi USA Chain With 27 California Locations
-
 NewsBeat5 days ago
Charity run by Reform leader Malcolm Offord accused of ‘law breaking’ over Scottish registration
-

 Sports4 days ago
2026 CJ Cup Byron Nelson leaderboard: Brooks Koepka finds putting stroke in Round 1
-

 Crypto World5 days ago
Exa Labs raises $250 million in funding led by a16z
-
Business4 days ago
Goldman Sachs reinstates Ageas stock coverage with neutral rating
-

 Crypto World4 days ago
Trump Media’s Bitcoin Stash Shrinks Again as 2,650 BTC Lands on Crypto.com
-
 Business4 days ago
Marine engineering firm Avantis eyeing expansion on equity boost
You must be logged in to post a comment Login