

Crypto World
CEO of Australia’s Largest Bank Sees AI Workforce Consequences Across the Economy



Commonwealth Bank of Australia CEO Matt Comyn warned that artificial intelligence (AI) will impact jobs across many industries.
The executive argued that AI will reshape work across the economy, and that downplaying its impact on jobs will not protect workers.
CBA CEO: Pretending AI Won’t Cost Jobs Doesn’t Protect Workers
In an opinion article, Comyn noted that the future of work remains highly uncertain, both in the near term and over the coming decade.
He explained that while certain tasks are likely to become automated and some positions may shrink, other roles are expected to expand.
He also pointed out that many jobs could retain their overall structure even as their skills and responsibilities evolve. According to Comyn, it is far easier to predict which aspects of current work may vanish than to anticipate the entirely new forms of employment that could emerge.
“This will mean real change for people. At CBA, as in many large organisations, some work will be done by smaller teams. At the same time, some career paths will steepen as people use AI to take on more complex work sooner. This will create opportunities for many people, but it will be demanding for everyone. Pretending otherwise does not protect workers. It only ensures they are surprised later,” the executive wrote.
2026 Layoffs Add to AI Job Cut Wave
The statement comes as AI-driven job cuts continue across the tech industry. In April, Bloomberg reported that CBA will eliminate around 120 roles, following a separate round of layoffs announced two months earlier that affected roughly 300 employees.
Meanwhile, website-building platform Wix is reportedly preparing to cut 20% of its workforce, impacting around 1,000 employees across Israel and international operations, according to reports in the Hebrew media.
Follow us on X to get the latest news as it happens
US tech layoffs reached 52,050 in Q1, a 40% jump year over year, according to Challenger, Gray & Christmas. Global tracker TrueUp logged more than 144,000 cuts in 2026, with California already preparing for AI displacement.
Comyn’s warning and the job cuts suggest AI restructuring is moving from individual roles to broader workforce reshaping.
Subscribe to our YouTube channel to watch leaders and journalists provide expert insights
The post CEO of Australia’s Largest Bank Sees AI Workforce Consequences Across the Economy appeared first on BeInCrypto.

Crypto World
Bitcoin Tops $67,000 to Two-Week High After Trump Declares US-Iran Deal Complete and Hormuz Reopening
Bitcoin pushed above $67,000 on Monday, its highest level in roughly two weeks, after President Trump said the US-Iran deal was "complete" and that he had authorized reopening the Strait of Hormuz. The largest cryptocurrency traded around $67,170, up 4.9% over 24 hours, touching an intraday high… Read the full story at The Defiant


Ventuals is shutting down its on-chain pre-IPO trading platform and folding its team into another project building on Hyperliquid. The wind-down ends one of the first venues that let traders take leveraged positions on the valuations of private companies like OpenAI and Anthropic. The platform… Read the full story at The Defiant


The rest of the Clarity Act depends on that guarantee, because there is no digital asset market to regulate if the people who build it cannot afford to build it in the U.S. The provision survived the committee markup intact, despite a filed amendment that would have gutted it, and it must stay in through the final vote, fully and without dilution.
Here is why this matters to people who will never read a word of the statute. The engineers who write this software, from core Solana contributors to the designers of new DeFi protocols, publish code that anyone in the world can download and use. They hold no money. They cannot freeze an account or move funds, because they never touch them. Treating a software developer like a bank teller makes about as much sense as calling an email app’s engineer a mail carrier. Treasury’s 2019 FinCEN guidance already recognized that merely providing software or network tools used by money transmitters does not, by itself, make someone a money transmitter. The BRCA aligns the criminal code with that standard.
When laws are murky, regulators and prosecutors fill the gap. Treasury has pursued builders who wrote and released software but never held a customer’s assets. The conviction of Tornado Cash developer Roman Storm for conspiring to operate an unlicensed money transmitting business is the case people know, and it fits a pattern that should worry anyone who cares about American innovation. Cases like it are already pushing developers overseas.
Crypto World
Wallet V Launches Public Performance Benchmark for AI Trading Agents on Hyperliquid and Aster

[PRESS RELEASE – Road Town, British Virgin Islands, June 15th, 2026]
Wallet V, a self-custody Web3 wallet, launched a public performance benchmark for the AI trading agents that its users have configured on the third-party decentralized derivatives platforms Hyperliquid and Aster. The benchmark publishes aggregate cohort performance and is hosted on the Wallet V website.
The benchmark covers 688 agents created by Wallet V users over the prior two months. Each agent was configured by the user, used a large language model selected by the user to generate trading decisions, and executed on Hyperliquid or Aster. Wallet V aggregates the on-platform performance of those agents by underlying model. Performance is refreshed as new agents are deployed.
The cohort spans seven large language model families. Across the cohort, 42 percent of agents recorded a profit and loss balance of zero or higher over the period. Peak agent-level return on investment in the dataset ranged from negative 30 percent on the lowest-performing model to positive 307 percent on the highest. Models represented by fewer than 10 agents in the cohort are reported as directional rather than statistically conclusive.
Agents in the cohort executed strategies as perpetual futures across four asset classes available on Hyperliquid and Aster. These include major digital assets such as BTC, ETH, and SOL; equities, including pre-initial public offering equity exposure; commodities including gold, silver, and oil benchmarks; and major foreign exchange pairs. All instruments are accessed through third-party venues.
“At Wallet V, the focus has been on building infrastructure for the next phase of crypto. This benchmark is what that next phase looks like up close. Users now decide which AI model to configure their agent in the same way institutions evaluate managers, by reviewing observable performance over time,” said Adam Cai, Founder & CEO of Virgo Group.
Wallet V plans to extend the benchmark in subsequent releases. Future releases include the addition of newer model families, support for prediction markets, advanced analytics features for copilot trading and personalized AI prompt generation tailored to each user’s trading style.
The Wallet V applications for iOS and Android are available at dl.walletv.io.
About Wallet V
Wallet V is a Web3 self-custody wallet that gives users access to third-party AI models to configure AI agents and execute user-defined trading strategies. The application connects to third-party platforms supporting cross-chain swaps, perpetual futures, prediction markets, and onchain exposure to tokenized equities.
Wallet V is an incubation project by Virgo Group, a digital asset service provider led by CEO Adam Cai. Virgo Group is backed by investors including Draper Dragon, OKX Ventures, Vaulta Foundation, Cobo Ventures, Waterdrip Capital, and Sora Ventures.
Disclaimer
Trading crypto, perpetual contracts, tokenized assets, and prediction markets involves significant risk of loss and is offered by third-party platforms. Wallet V is a software provider that connects to external platforms and does not offer trading services or AI automation tools directly or indirectly. Wallet V does not provide investment, tax, or legal advice. Access to certain products may be restricted in some jurisdictions.
The post Wallet V Launches Public Performance Benchmark for AI Trading Agents on Hyperliquid and Aster appeared first on CryptoPotato.
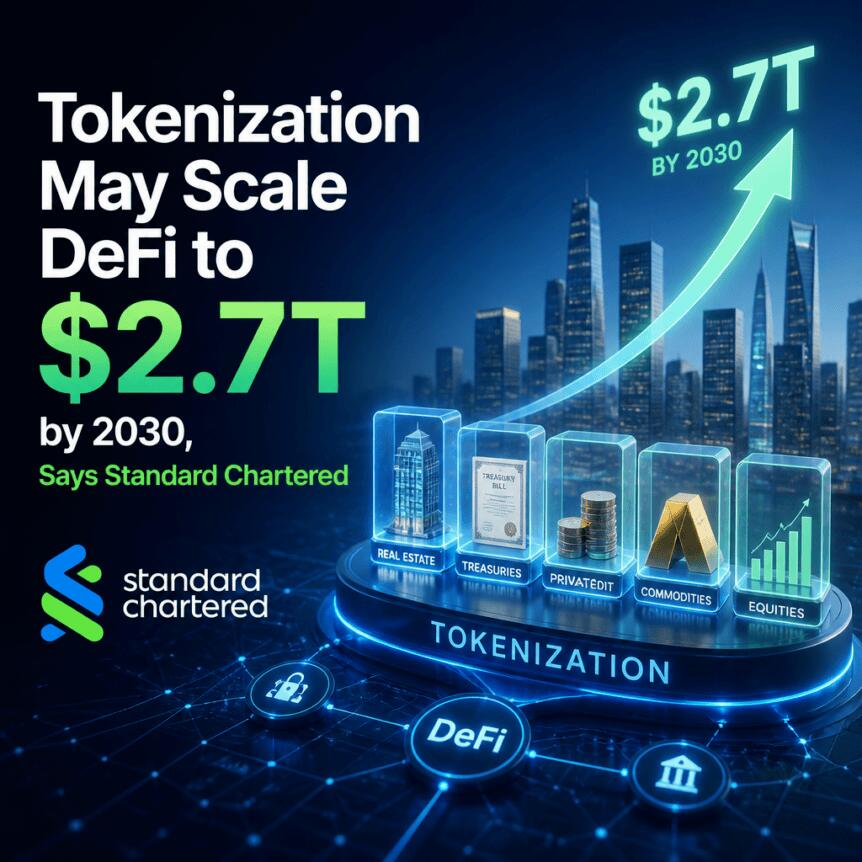
Standard Chartered is projecting a major expansion of decentralized finance activity tied to tokenized assets, forecasting that the total value of tokenized assets actively used in DeFi could rise from today’s small base to roughly $2.7 trillion by the end of 2030.
In a research note released on Monday, Geoff Kendrick, head of digital assets research at Standard Chartered, said the growth would be powered by two streams: tokenized real-world assets (RWAs) finding their way into onchain lending, liquidity and trading venues, and crypto-native assets being routed through DeFi protocols.
Key takeaways
- Standard Chartered expects tokenized assets active in DeFi to grow 37x to about $2.7 trillion by 2030.
- Only a small portion of currently circulating stablecoins and tokenized RWAs are used in DeFi today, according to the bank.
- Standard Chartered forecasts the share of tokenized value used in DeFi to increase to 30% by 2030, from around 3.5% currently.
- The bank sees Uniswap as a plausible hub for tokenized markets as more assets move onchain.
- Other industry voices warn that tokenization alone does not ensure liquidity or unified markets, and may increase fragmentation.
Standard Chartered’s 2030 DeFi tokenization forecast
Kendrick’s central estimate is that the amount of tokenized assets “active in DeFi” will expand by a factor of 37 by the end of 2030. He framed DeFi protocols as the next major channel for wealth-building and scaling exposure to onchain assets.
The bank’s assumptions start from a relatively low present-day level of DeFi participation. Kendrick said only about 3% of stablecoins and roughly 10% of tokenized RWAs are currently used in DeFi. From there, Standard Chartered projected a substantial shift in utilization: the proportion of tokenized assets used in DeFi should rise to about 30% by the end of 2030, up from around 3.5% at present.
While the directional logic is straightforward—more tokenization could mean more onchain activity—Standard Chartered’s own math implies a demanding pathway. Reaching the $2.7 trillion outcome would require both rapid growth in the underlying stock of onchain assets and a steep increase in the fraction of tokenized value actually routed into DeFi protocols.
Previous RWA outlook, and why DeFi adoption is the crux
The forecast builds on earlier work from Standard Chartered, including a previous projection that non-stablecoin tokenized RWAs could reach $2 trillion by the end of 2028. That earlier view highlighted tokenized money-market funds and US equities as major components of projected growth.
However, Monday’s note puts the spotlight on utilization rather than issuance. Tokenization may increase the total addressable market, but investors ultimately benefit from an ecosystem where tokenized assets can be accessed, traded, and used efficiently—often through DeFi infrastructure.
This is where Standard Chartered’s numbers become both persuasive and challenging. A near ninefold rise in the share of tokenized value used in DeFi would be required to support the $2.7 trillion estimate, suggesting that liquidity routing, custody, compliance frameworks, and market-making would all need to evolve alongside the growth of tokenized supply.
Liquidity fragmentation remains a key concern
Some market participants have cautioned that tokenization does not automatically solve liquidity and market-structure problems. Axis CEO Chris Kim previously told Cointelegraph that issuing “the same asset” across multiple blockchains and formats can lead to siloed liquidity, pricing gaps, and higher costs—factors that can limit how easily tokenized assets trade even as overall market size increases.
Similarly, Oya Celiktemur, Ondo Finance’s sales director for Europe, the Middle East and Africa, said at Paris Blockchain Week in April that tokenizing an illiquid asset does not “magically” make it liquid. The implication for Standard Chartered’s outlook is clear: the path to a larger DeFi share likely depends on whether market design and distribution reduce fragmentation rather than amplify it.
Why Uniswap could matter for tokenized markets
Kendrick also pointed to decentralized exchanges as potential distribution and liquidity layers for tokenized assets. In his view, Uniswap could develop into a key hub for trading tokenized markets as more of these assets move onto public blockchains.
He cited Uniswap’s scale, its brand recognition, and its long operational history through multiple crypto market cycles. Kendrick argued these strengths could be especially relevant to traditional financial institutions, which are likely to prioritize security, reliability, and established operational risk management when integrating tokenized RWAs into onchain systems.
Standard Chartered further suggested that if Uniswap can “commercialise enough” and secure enough TradFi partnerships to scale, its market cap-to-transaction fees multiple could rise—potentially narrowing the gap with Coinbase, according to the bank’s framing.
What to watch next
For investors and builders, the next signal will be whether tokenized assets increasingly find meaningful DeFi usage—moving beyond issuance headlines into sustained liquidity, cross-venue trading efficiency, and deeper integrations with major market participants. Standard Chartered’s forecast may be directionally aligned with tokenization trends, but the durability of that growth will likely hinge on whether fragmentation and liquidity limitations can be reduced as adoption accelerates.
Bitcoin has reclaimed the $66,000 level after remarks from U.S. President Donald Trump and reports of a tentative U.S.-Iran peace agreement revived risk appetite across global markets.
Summary
- Bitcoin climbed nearly 5% to $66,829 after Trump said oil ships were moving through the Strait of Hormuz and reports pointed to a tentative U.S.-Iran peace agreement.
- Oil prices fell 5.7% to a two-month low below $80, while spot Bitcoin ETFs recorded $85.9 million in inflows and Strategy added 1,587 BTC worth about $100 million.
- More than $168 million in Bitcoin short positions were liquidated as BTC broke above key resistance near $65,150 and reclaimed bullish momentum.
According to data from crypto.news, Bitcoin (BTC) climbed nearly 5% to an intraday high of roughly $66,829 on June 15 before settling near $66,460 at press time.
Bitcoin price rallied following comments from U.S. President Donald Trump, who wrote on Truth Social that ships carrying oil were once again moving through the Strait of Hormuz, a key route for global energy supplies.
“Ships are starting to move, many loaded up with Oil, out of the Strait of Hormuz. They are going along the Southern “Highway,” which is totally safe, secure, and pristine. There are other areas of travel, also!!!”
The comments arrived shortly after reports that the U.S. and Iran had reached a tentative peace agreement expected to reduce risks surrounding the strategic waterway.
Crude oil fell about 5.7% to below $80 per barrel, hitting its lowest level in two months and unwinding part of the geopolitical risk premium that had built up during recent weeks. The decline eased concerns about renewed inflationary pressure and helped improve appetite for risk assets after a difficult start to June.
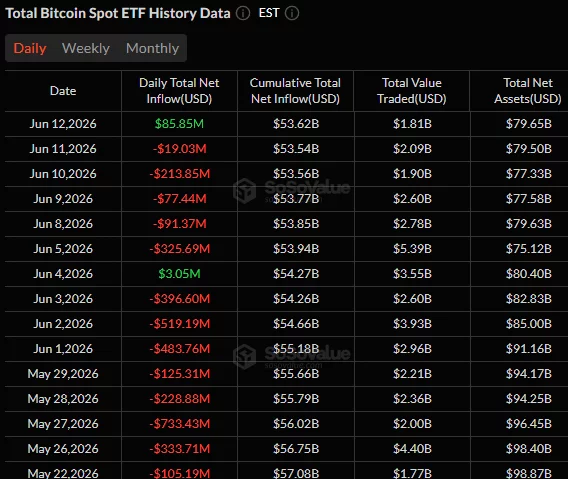
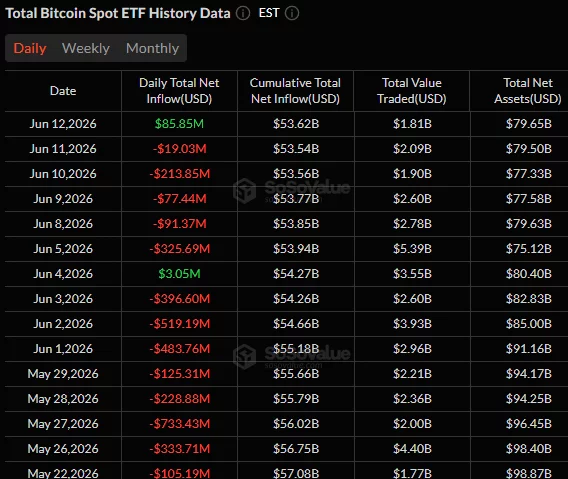
Institutional flows also showed early signs of stabilization. U.S. spot Bitcoin ETFs attracted $85.9 million in net inflows after five consecutive days of withdrawals. Even so, the rebound remains limited in scope. According to SoSoValue data, the funds have recorded positive flows on just two trading days since May 15 and have collectively lost roughly $5.71 billion over the past five weeks.
Alongside the return of ETF demand, corporate accumulation re-emerged as a source of support. As reported by crypto.news, Strategy disclosed the purchase of 1,587 BTC worth approximately $100 million, just two weeks after its first reported Bitcoin sale in years raised questions about whether the company’s long-standing accumulation strategy was changing.
The latest acquisition helped restore confidence among investors who viewed the earlier sale as a potential sign of weakening institutional conviction.
Bitcoin breaks above key resistance as short sellers unwind
On the daily chart, Bitcoin has reclaimed a major support-turned-resistance zone near $65,150 that had repeatedly acted as a pivot throughout March and April. Bitcoin price has now moved back above that level after briefly falling below $60,000 during last week’s sell-off.
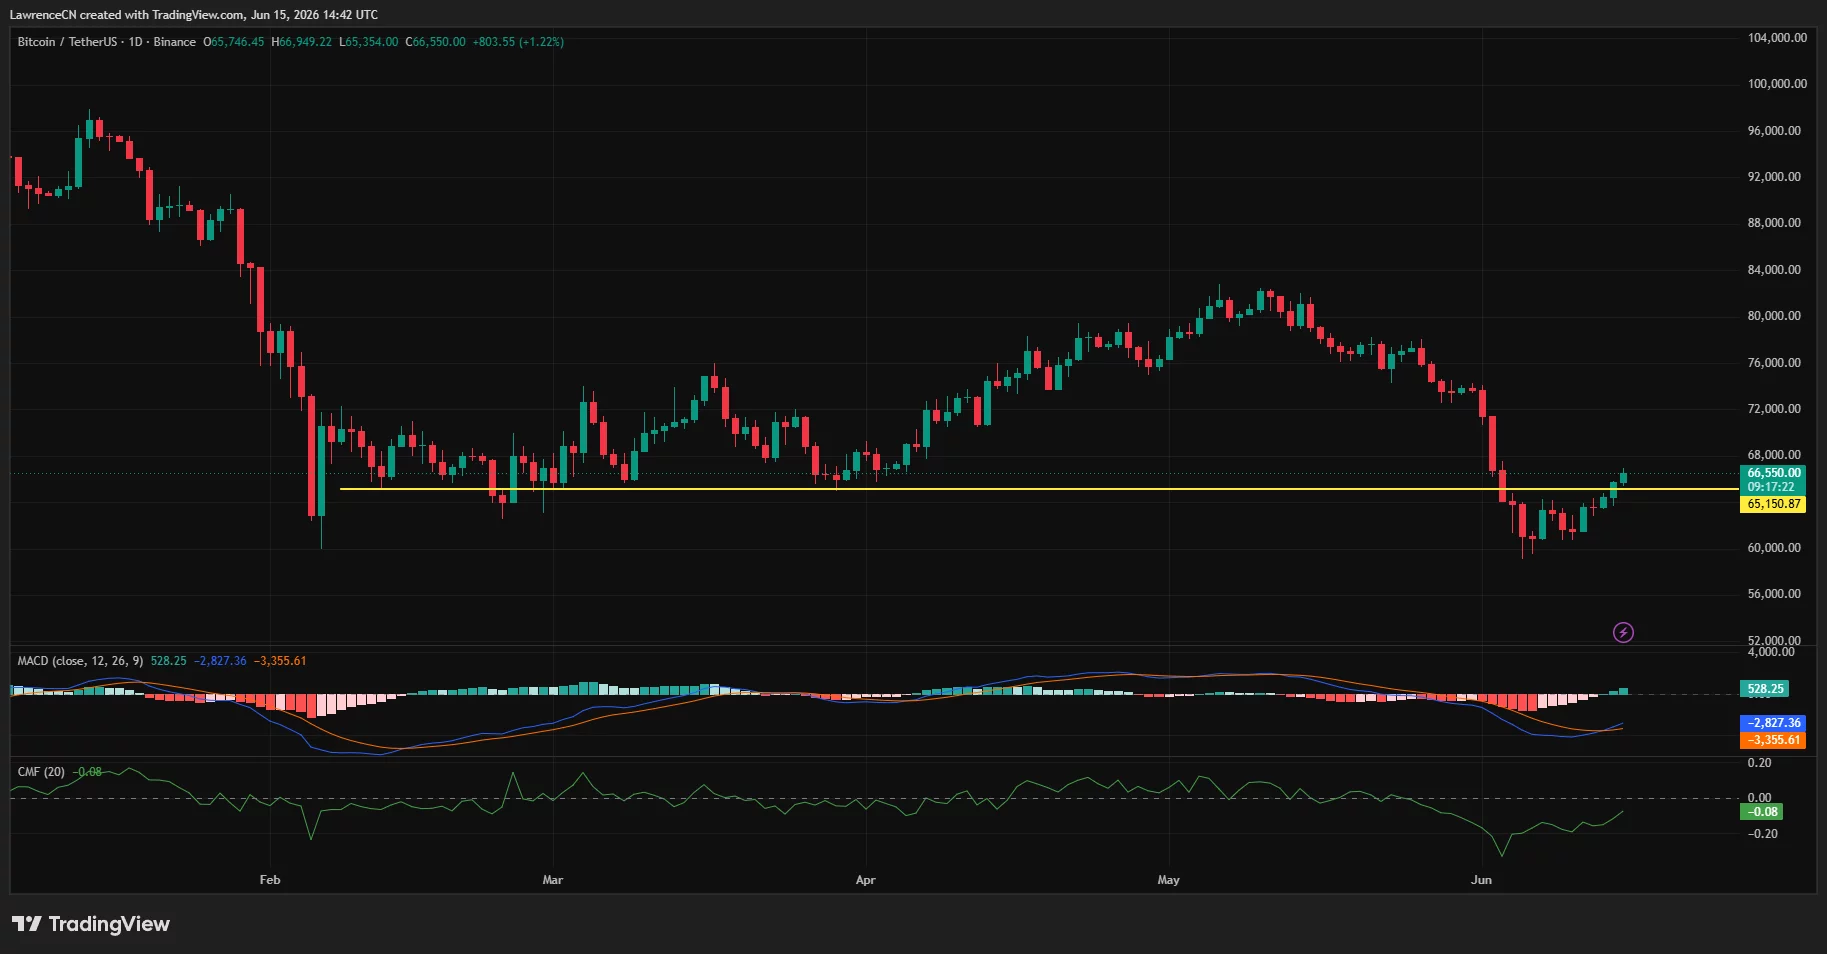
Momentum indicators have improved alongside the recovery. The daily MACD has produced a bullish crossover while its histogram has turned positive for the first time since the June decline began. Chaikin Money Flow has also recovered from deeply negative territory, suggesting capital is returning to the market after weeks of distribution.
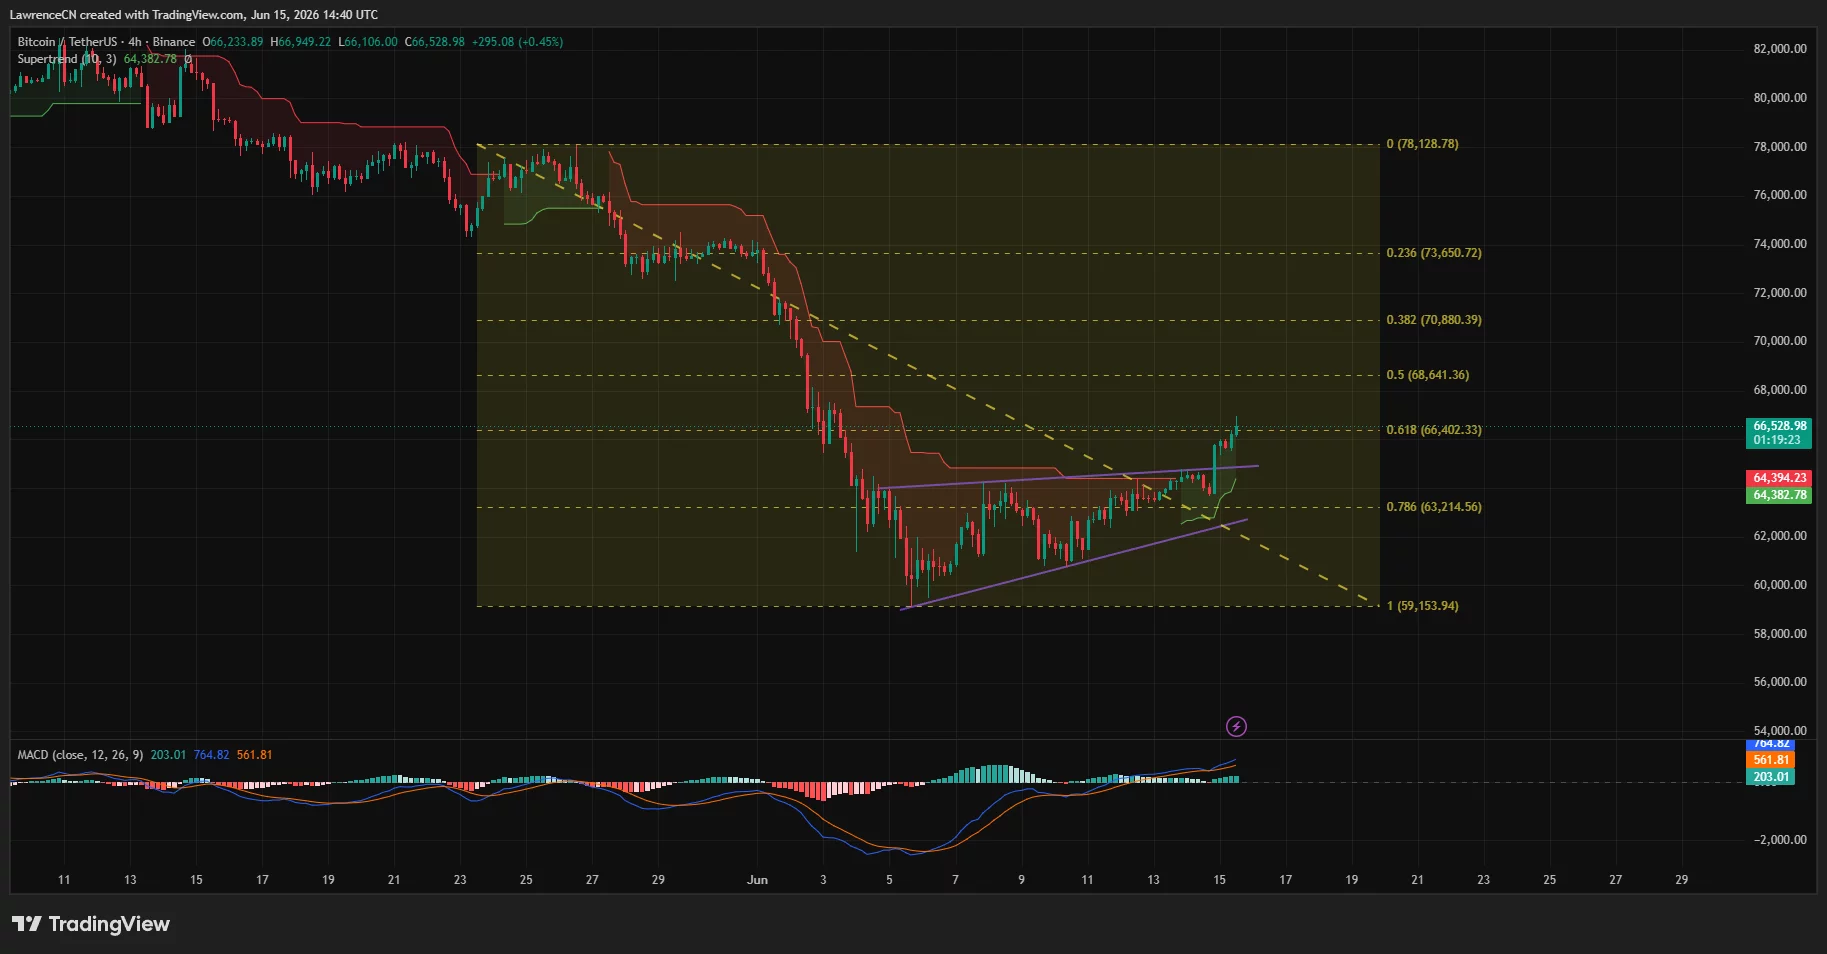
The four-hour chart shows Bitcoin breaking out from a descending trendline that had capped price action since late May. Bulls have also pushed the asset above the 61.8% Fibonacci retracement level near $66,402, placing the next resistance zone around $68,640, which aligns with the 50% retracement level. Beyond that, the $70,880 region represents another key hurdle.
Derivatives activity accelerated the move. CoinGlass data showed more than $556.5 million in crypto liquidations over the past 24 hours, including roughly $459.9 million from short positions.
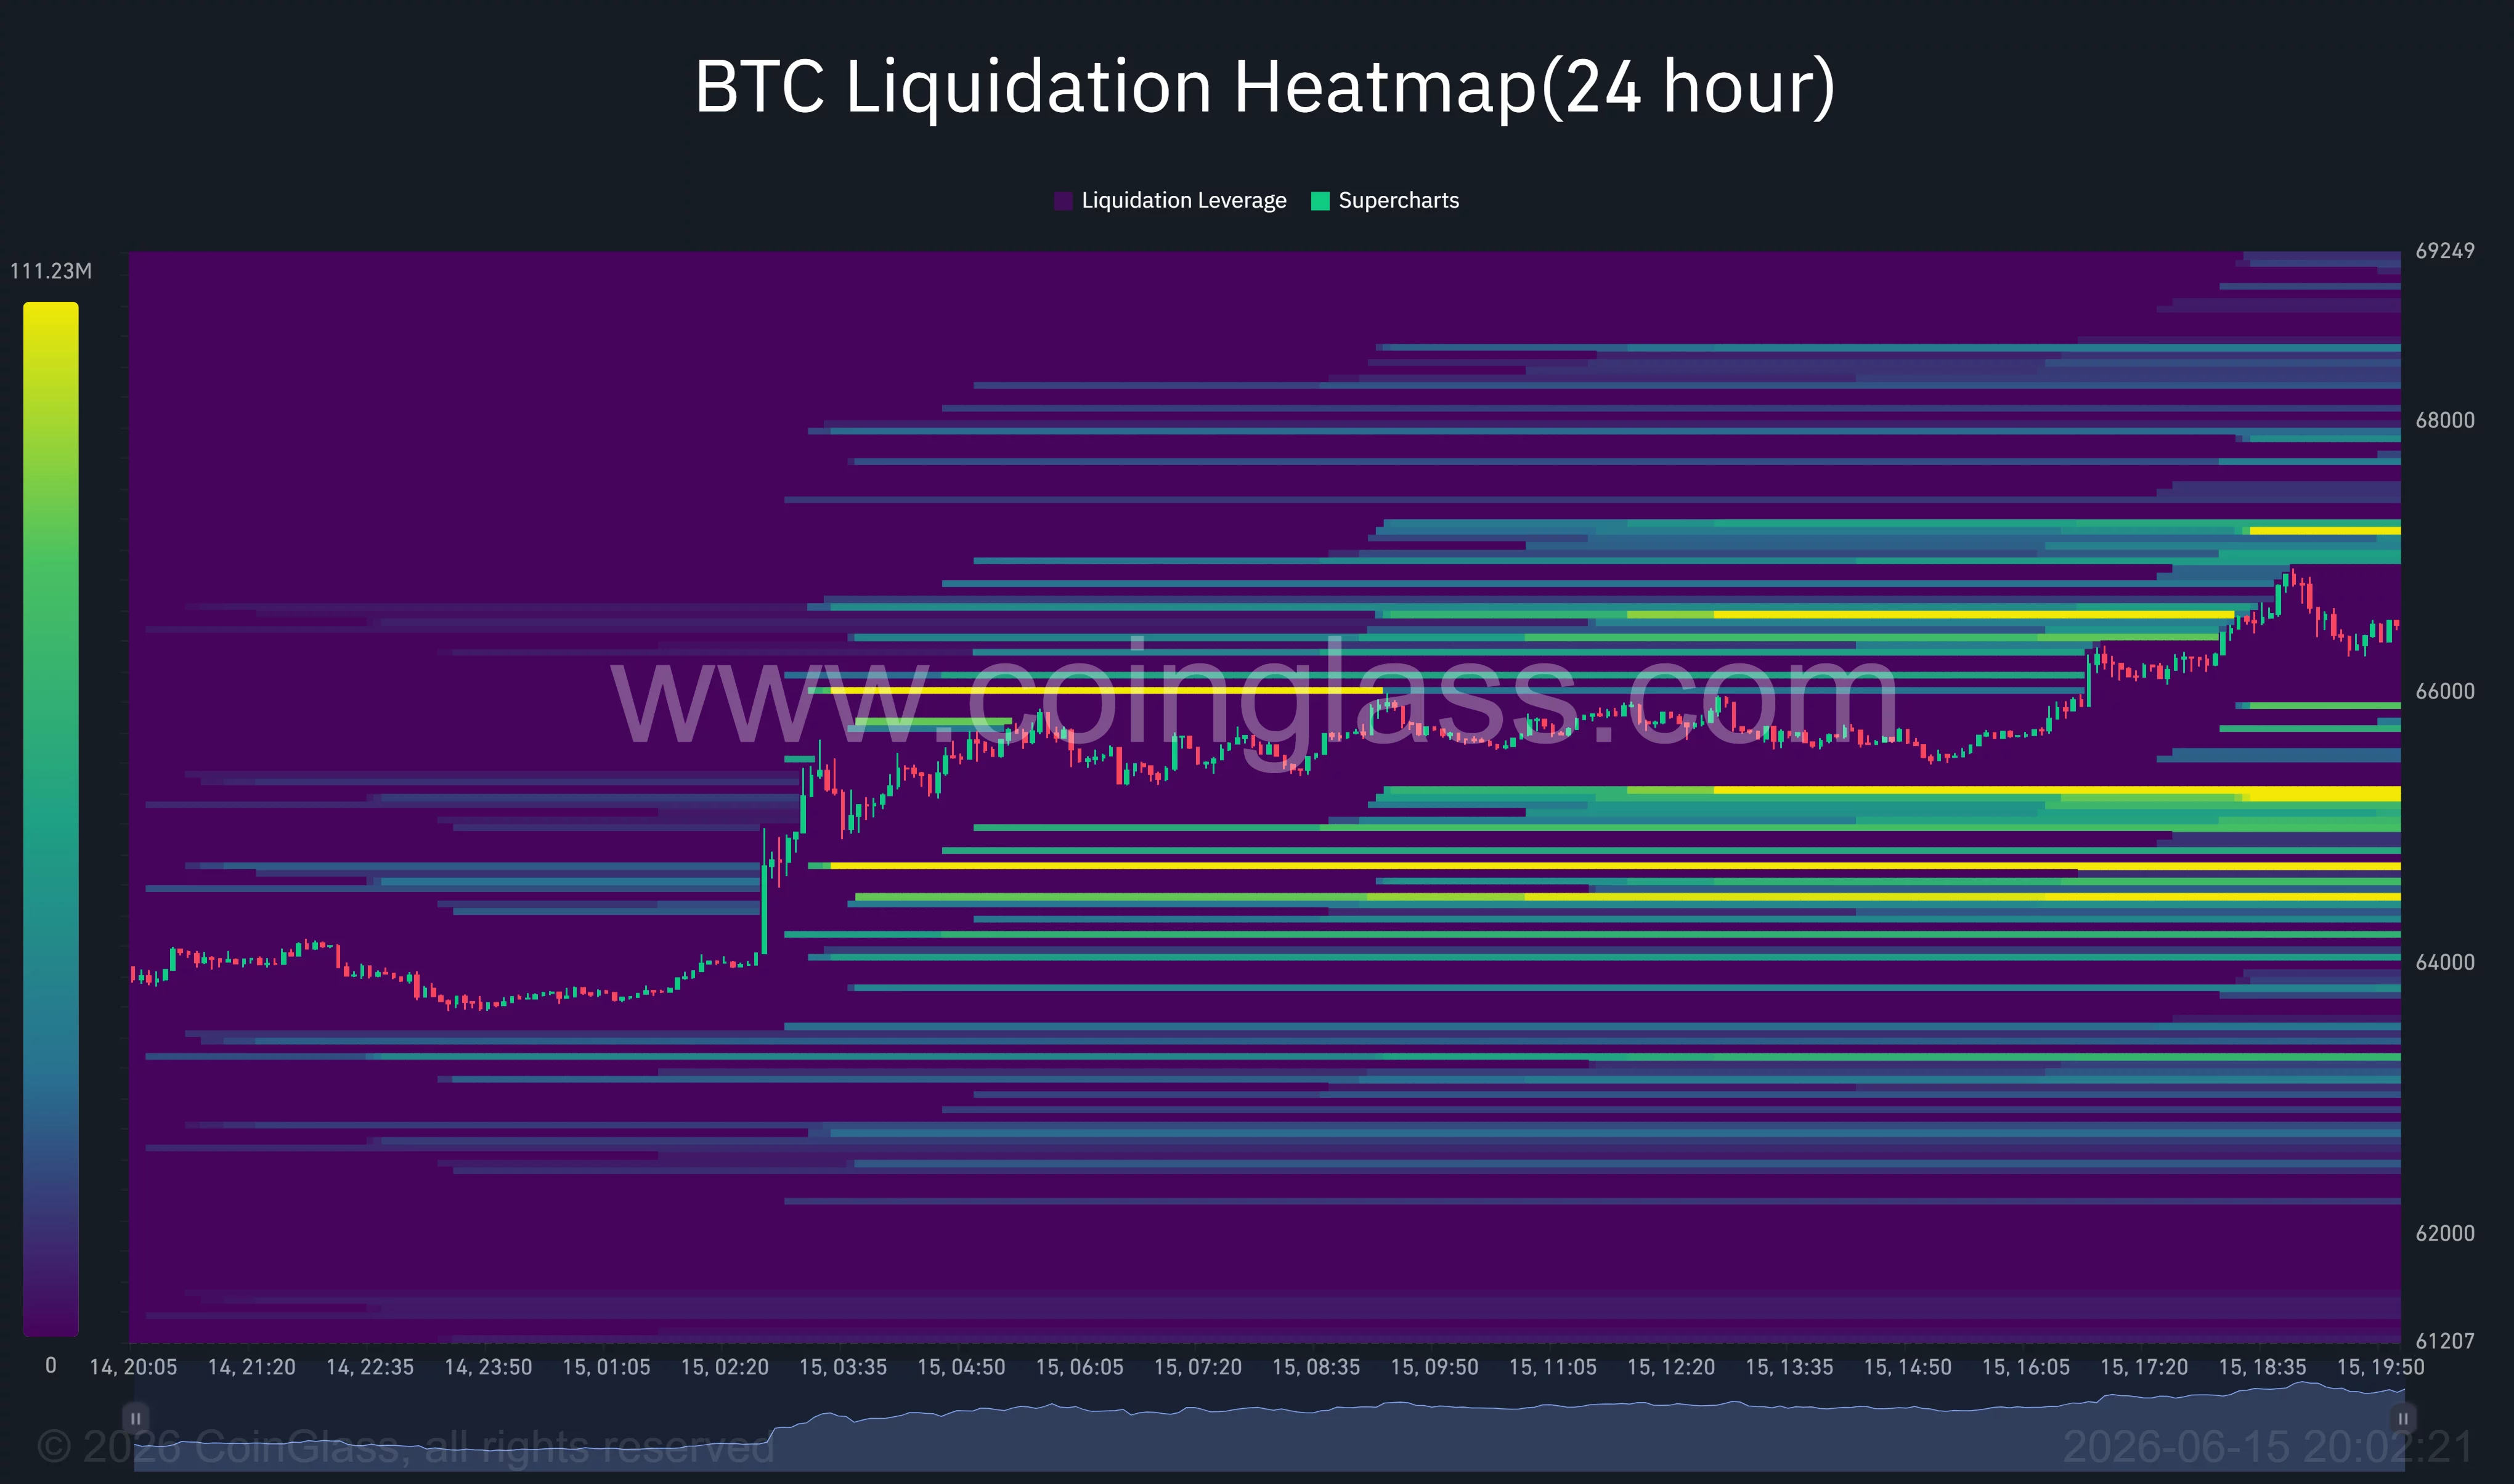
Bitcoin alone accounted for approximately $168.7 million in short liquidations compared with about $23 million from longs, highlighting the scale of the squeeze as traders rushed to cover bearish bets.
Liquidation heatmaps also show dense clusters of leverage concentrated between $67,000 and $68,000. Those zones could act as magnets for price if momentum continues, while substantial liquidity remains below the market around the $64,500-$65,000 area.
On-chain data suggests buyers have returned after Bitcoin’s correction to the $60,000 region. According to Glassnode, accumulation trend scores have increased across multiple wallet cohorts following the recent decline. The firm noted that supply is being absorbed after the move lower, a development that historically accompanies periods of renewed demand.
Options positioning presents another supportive factor. Glassnode observed that Bitcoin has moved back into a dense cluster of options exposure around the $65,000 strike, where dealer hedging flows may help stabilize price action after recent volatility.
Fed uncertainty and $65K support remain critical
Not all analysts view the move as a confirmed trend reversal. Commenting on the rally, crypto analyst Ted Pillows argued that recent price action looked more like a liquidity grab than a decisive breakout.
“If $BTC can maintain strength above $65,000, a move toward the $68,000-$70,000 range is possible.”
Despite the bullish price action, Pillows said the overall market trend remains bearish until further confirmation appears.
A different view came from crypto analyst Scott Melker, who pointed to Bitcoin’s repeated defense of its 200-week moving average and a bullish divergence on the weekly RSI. Melker noted that similar conditions have historically appeared near major market bottoms.
Attention now turns to next week’s Federal Reserve meeting on June 16-17. Any indication from policymakers that inflation remains a concern despite the recent decline in oil prices could weigh on risk assets and challenge Bitcoin’s recovery.
From a technical standpoint, a sustained move back below $65,000 would weaken the recent breakout and place the $63,200-$64,000 support region back into focus.
From a technical perspective, a move back below $65,000 would place the reclaimed support zone at risk and expose Bitcoin to another test of the $63,200-$64,000 area, where the recent breakout structure would begin to weaken.
Disclosure: This article does not represent investment advice. The content and materials featured on this page are for educational purposes only.


Last week, tens of thousands of crypto wallets pledged over half a billion dollars worth of digital assets for SpaceX shares, and received none. Unfortunately, the industry’s tokenized stock failure was a repeat performance.
For nearly a decade, thousands of crypto promoters have insisted that blockchain technology will deliver tremendous value through tokenized trading of equities.
However, despite wholehearted attempts and financial support from the industry’s largest companies, trading volumes of tokenized stock remain well below a fraction of one percent of traditional stock trading volumes.
Indeed, last week, 27,689 wallets pledged $557 million worth of digital assets to participate in a tokenized version of the SpaceX IPO via Binance alone.
Across listings on various crypto exchanges, including Bybit and Bitget Wallet, all of those orders failed to deliver SpaceX shares.
For years, crypto pitched its technology as an obvious efficiency improvement over slow and expensive clearinghouses, not to mention the benefit of widenening the pool of liquidity to a global audience that struggles to open traditional brokerage accounts.
It just never worked. Again and again, promoters’ sales pitches failed to live up to the promise.
On June 12, the day SpaceX debuted on Nasdaq, Binance, Bybit, and Bitget Wallet all canceled their pre-IPO tokenized SpaceX campaigns.
By then, customers had committed more than $1 billion but got none of the shares they wanted.
Backed Finance’s xStocks, the tokenized-equity issuer acquired by crypto exchange Kraken, seemed to be a root of the problem. When xStocks could not source its underlying shares, crypto contracts around the world failed. In a representative apology, Bybit admitted, “Due to xStocks’ inability to deliver the underlying assets, no SpaceX allocations were received.”
Binance blamed similar circumstances beyond its control.
Crypto’s pattern of tokenized stock failures
The excuse, as always, was that the blockchains worked fine, if only the traditional finance plumbing would have just cooperated.
As early as December 2020, Do Kwon’s Mirror Protocol launched tokenized stocks, allowing traders to buy “mirrored” versions of Apple and Tesla stock with no brokerage account.
Although the value of mAssets had already vaporized alongside Kwon’s Terra LUNA implosion in May 2022, the SEC later described those mirrored assets (mAssets) as unregistered “security-based swaps.”
By 2023, commissioners belatedly sued Terraform Labs and Do Kwon for violating US securities laws.
Read more: Binance draws heat in Europe for stock tokens, lists MicroStrategy anyway
In 2021, crypto pitched tokenized stocks again; and again they failed.
Binance launched tokenized Tesla, Coinbase, and MicroStrategy stocks through German broker CM-Equity. FTX, meanwhile, ran a near-identical offering through the same German broker.
Regulators objected within weeks, and both exchanges backpedaled quickly.
Binance pulled those tokenized offerings by July 16, with support ending that October. FTX’s stock tokens were also gone well before the Sam Bankman-Fried fraud collapsed in November 2022.
This year, Binance’s tokenized SpaceX campaign pulled in roughly $557 million in USDC from over 27,000 wallets, and delivered no shares.
It refunded users their pledges and promised an airdrop as a consolation prize. Bybit similarly refunded customers.
Despite years of marketing, crypto technologies still have not brought tokenized stocks to the masses.
Got a tip? Send us an email securely via Protos Leaks. For more informed news and investigations, follow us on X, Bluesky, and Google News, or subscribe to our YouTube channel.

The team behind Pi Network has remained consistent in its efforts to expand the ecosystem and strengthen the community through new initiatives and upgrades.
PI’s price has finally staged a decisive rebound, mirroring the bullish conditions of the broader crypto market following the peace deal between the USA and Iran.
What Happened Lately?
The Core Team has been quite active lately, completing major milestones on several fronts. At the start of the month, they disclosed the successful transition to protocol v24, an upgrade primarily focused on improving the underlying infrastructure supporting node operations and mainnet activity.
Most recently, Pi Network updated the participation and flow model for the Pi Launchpad, allowing Pioneers to test a second token called “SLICE” for two weeks. The platform is designed to help new projects grow and reach the community. It uses insights gathered from the first testnet token that began testing on PiDay 2026 (March 14).
The team revealed that more than 478,000 Pioneers participated in the initial Launchpad testing and “generated valuable feedback on the Launchpad mechanism.” It also detailed the steps for those who wish to join. They must open Pi Launchpad in Pi Browser, review the SLICE test token and project, choose a commitment amount in Test-Pi, confirm participation, and finally engage with the Slice of Pi app and provide feedback.
In addition to these efforts, Pi Network also made progress in the gaming sector. As CryptoPotato reported, CiDi Games (an entity part of the ecosystem) released four new games for Pioneers. Those include Coin Whack, Fruit Stack, Gemnova, and RainbowCubes. Earlier today (June 15), one X user revealed that CiDi Games had reached a milestone of over 6 million PI staked in its ecosystem and hinted at an announcement of a new game next week.
Waiting for These
Pi Network’s next big update appears to be the transition to protocol v25. The team initially set June 18 as the completion deadline but later clarified that it might need more time, indicating a likely delay.
Another highly anticipated event in the Pi Network community is Pi2Day, celebrated on June 28 (6/28) because it represents the mathematical constant 2π.
Speculation is mounting that the team may announce a major ecosystem update, launch new features, or even a listing on Binance. However, nothing is confirmed, and we’ll have to see whether the day will bring anything meaningful at all.
PI Price Outlook
Earlier this month, PI’s price crashed below $0.12, marking the lowest level in its history. Over the past few days, though, it has followed the broader crypto market’s resurgence and now trades at around $0.14, representing a 4% weekly increase.
The bulls are now hoping for a further rally, which will largely depend on whether Bitcoin (BTC) and the leading altcoins can sustain their positive momentum. Meanwhile, the reduced token unlocks and some other important factors also suggest that PI’s valuation may post additional gains in the near future.
The post Pi Network News and PI Price Update Today: June 15 appeared first on CryptoPotato.

Key Highlights
- Salesforce has entered into an agreement to purchase AI agent specialist Fin, previously known as Intercom, in a transaction valued at $3.6 billion
- The transaction is anticipated to finalize during Salesforce’s fiscal fourth quarter of 2027
- Shares of CRM increased 0.8% to reach $167.10 on Monday, potentially breaking a nine-day decline
- Fin operates its own AI technology platform, Apex, designed exclusively for customer service applications
- Salesforce’s Agentforce platform reported a 20% increase in annual recurring revenue, reaching $1.2 billion in the company’s fiscal first quarter of 2027
On Monday, Salesforce revealed its plans to purchase Fin, the artificial intelligence agent firm that was previously operating as Intercom, through a $3.6 billion acquisition agreement.
Shares of CRM traded higher by 0.8% to $167.10 during Monday’s session. This uptick would mark the end of a nine-day downward trend. However, the stock remains down 37% on a year-to-date basis.
This strategic acquisition arrives at a time when Salesforce is experiencing increased scrutiny from shareholders concerned that AI-powered coding solutions might enable clients to develop their own customized Agentforce alternatives, potentially diminishing demand for Salesforce’s offerings.
Fin’s flagship offering is an AI agent designed to manage customer inquiries from start to finish. The technology operates seamlessly across multiple communication channels including live chat, email, WhatsApp, text messaging, phone calls, and Slack.
The platform operates using Fin’s proprietary model known as Apex. According to Salesforce, Apex has been specifically engineered for customer support applications and delivers superior resolution rates compared to leading commercial models available today.
Marc Benioff, Chief Executive Officer, described the acquisition as an ideal match. “Fin delivers battle-tested agent technology, a strong dedication to customer satisfaction, and an exceptional AI team that will enhance Agentforce with robust service agent functionalities,” Benioff stated.
Eoghan McCabe, CEO and co-founder of Fin, emphasized that the partnership provides scale his organization couldn’t achieve independently. “Through this combination with Salesforce, we can implement it extensively at a pace we never could have reached working alone,” McCabe explained.
Understanding Agentforce’s Current Performance
Agentforce demonstrated a 20% growth in annual recurring revenue, achieving $1.2 billion during fiscal Q1 2027. The addition of Fin is projected to broaden this platform’s capabilities within customer service environments.
The transaction is scheduled to conclude during Salesforce’s fiscal fourth quarter of 2027, pending specific price adjustment provisions.
Analyst Community Expresses Mixed Views
Rishi Jaluria, an analyst at RBC Capital Markets, acknowledged the strategic merit of the acquisition, particularly for customer engagement purposes. However, he raised several reservations.
“We remain uncertain about certain aspects of the acquisition rationale and recognize that this introduces further integration and execution challenges considering that Informatica, Contentful, and various smaller acquisitions are being incorporated simultaneously,” Jaluria noted on Monday.
Barron’s withdrew its recommendation for Salesforce last week, reversing its original buy rating from December.
The software industry overall has faced headwinds this year from what market observers have dubbed the “SaaSpocalypse” — apprehension that AI agents might diminish reliance on conventional SaaS products.
Heading into this week, Salesforce shares have declined 37% year-to-date.

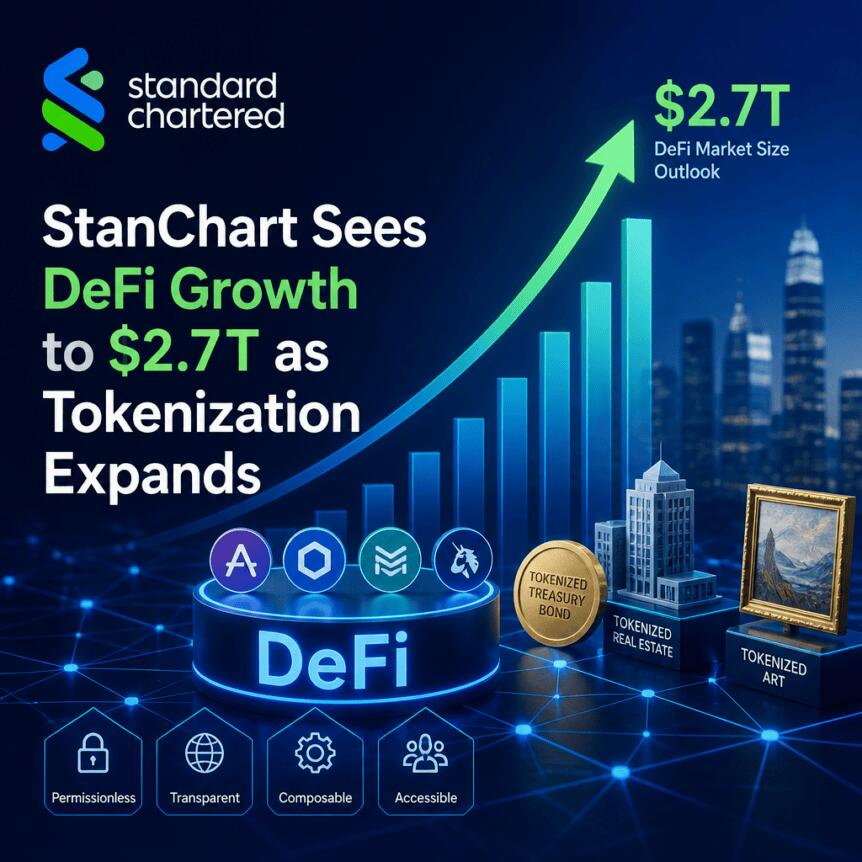
Standard Chartered is forecasting a major acceleration in how decentralized finance (DeFi) can absorb tokenized assets. In a research note released Monday, Geoff Kendrick—head of digital assets research at the bank—projected that assets actively used in DeFi could expand 37-fold to $2.7 trillion by the end of 2030.
The estimate hinges on a shift in where tokenized value goes once it is issued. Kendrick argued that DeFi protocols could become a key distribution channel not only for crypto-native assets, but also for tokenized real-world assets (RWAs) that are increasingly being developed by traditional finance participants.
Key takeaways
- Standard Chartered expects DeFi-active tokenized assets to reach $2.7 trillion by 2030, implying a 37x increase from current levels.
- The forecast depends on both tokenized RWAs and crypto-native assets finding their way into onchain lending, trading, and other DeFi use cases.
- According to Kendrick, only 3% of stablecoins and 10% of tokenized RWAs are currently used in DeFi.
- Standard Chartered projects tokenized asset usage in DeFi rising to about 30% by end-2030, from roughly 3.5% today.
- The bank points to Uniswap as a possible hub for tokenized markets, though other researchers warn tokenization alone doesn’t solve liquidity fragmentation.
Standard Chartered’s 2030 DeFi absorption forecast
Kendrick’s central claim is that DeFi could be the next major engine for “generational wealth” in digital assets. He estimated that the amount of tokenized assets active in DeFi will grow 37x by the end of the decade.
While tokenization is often discussed as a way to bring real-world finance onto public blockchains, the investment question is how that tokenized value translates into real onchain participation. Kendrick’s projections address that by focusing on usage rates—how much of the overall tokenized supply is actually deployed inside DeFi protocols.
Per the research note, only 3% of stablecoins and 10% of tokenized RWAs are currently used in DeFi. Standard Chartered expects those tokenized shares to rise sharply over the next several years, with the portion of tokenized value used in DeFi projected to reach 30% by end-2030, up from about 3.5% today.
The scale of the jump is important: growing the absolute figure to $2.7 trillion would require both (1) rapid growth in total onchain tokenized assets and (2) a near ninefold increase in the share of that tokenized value being put to work in DeFi.
Why tokenized value may not automatically become liquid
The bank’s outlook reinforces the broader institutional argument that tokenization could re-route capital flows toward onchain systems. However, the path from issuance to deep markets is not straightforward.
The research note acknowledges—and the wider debate around tokenization highlights—that tokenization does not inherently guarantee liquidity or a unified market structure. Other researchers have warned that tokenized assets can still trade in ways that remain fragmented across ecosystems.
Earlier coverage from Cointelegraph noted concerns raised by Axis CEO Chris Kim that issuing the same asset across multiple blockchains and formats can create “siloed liquidity,” leading to pricing gaps and higher costs. In practical terms for traders and liquidity providers, that fragmentation can make it harder for market participants to find consistent pricing and for liquidity to pool efficiently—even if total market value grows.
Similarly, Oya Celiktemur of Ondo Finance told Cointelegraph at Paris Blockchain Week in April that tokenizing an illiquid asset does not “magically” make it liquid. The implication is that deeper liquidity depends on market design, distribution, and the incentives that keep trading and settlement efficient once tokenized assets reach users.
From earlier RWA estimates to a DeFi-centered distribution thesis
Standard Chartered has previously linked tokenization growth to large market expansions. The new DeFi-focused forecast builds on an earlier projection that non-stablecoin tokenized RWAs could grow to $2 trillion by the end of 2028, according to Kendrick—where tokenized money-market funds and US equities are expected to represent much of the projected market.
What’s new here is the emphasis on where those tokenized instruments are used rather than just their total outstanding value. The shift matters because DeFi impact is not measured only by token counts or issuance volumes; it’s measured by how much liquidity and trading activity migrates into onchain protocols that support borrowing, trading, and settlement.
By framing DeFi as a destination for tokenized capital, Standard Chartered is effectively proposing that tokenization’s biggest long-term value creation could be tied to protocol-level adoption—rather than confined to isolated token issuances or simple exposure products.
Uniswap as a potential liquidity bridge for tokenized markets
Alongside the usage-rate assumptions, Kendrick singled out Uniswap as a venue that could play a growing role in trading tokenized assets as more of them move onchain. He pointed to the decentralized exchange’s scale, branding, and track record of operating through multiple crypto cycles.
In his view, these characteristics could be especially relevant for traditional financial institutions that are likely to prioritize security and reliability when integrating tokenized RWAs into DeFi. Kendrick also suggested that if Uniswap is able to “commercialise enough” and form meaningful TradFi partnerships that improve scale, it could strengthen its fee-generation relative to its market capitalization—potentially narrowing the gap with major centralized exchanges.
The bank’s bet on Uniswap aligns with the thesis that tokenized-market liquidity will depend on venues capable of onboarding new assets at meaningful volume. Still, it sits in tension with the liquidity-fragmentation warnings raised by other researchers: even if a venue is technically capable of supporting tokenized assets, liquidity can remain dispersed if the same instruments arrive in multiple formats, across multiple chains, or with mismatched trading infrastructure.
Looking ahead, investors and builders should watch whether DeFi protocols can convert rising tokenization volumes into sustained onchain usage—particularly by tracking how stablecoins and tokenized RWAs distribute across different DeFi activities. The key uncertainty is whether liquidity consolidates around major venues like Uniswap or continues to fragment as tokenized assets proliferate across ecosystems.
Bitcoin Tops $67,000 to Two-Week High After Trump Declares US-Iran Deal Complete and Hormuz Reopening

XYLondon Women’s Footwear Collection – Heels, Flats & Sandals

Disclosure Day Cast: Where You’ve Seen The Stars Before


-

 Business1 day ago
No Jackpot Winner as $257 Million Prize Rolls Over to $269 Million Monday Draw
-

 Crypto World4 days ago
Oppenheimer backs SpaceX as $70 billion retail frenzy builds
-
 Crypto World4 days ago
Markets Rally as SpaceX IPO Looms Amid Iran Tensions and Inflation Surge
-

 Fashion3 days ago
Weekend Open Thread: Tuckernuck – Corporette.com
-
 Crypto World16 hours ago
Zimbabwe Requires Crypto Businesses to Register Annually Under New FIU Regulations
-

 Entertainment6 days ago
The Ryan Gosling True Crime Thriller On Netflix That Gets Even Stranger, Stream It Now
-
 Sports6 days ago
Bangladesh beat Australia after 20 years in ODIs, register only their second win over six-time world champions | Cricket News
-

 Tech3 days ago
NanoClaw integrates JFrog registries to secure AI agent downloads
-

 Tech3 days ago
This Week In Security: Microsoft On Microsoft, Register Your Domains, Linux On ARM, And FreeBSD Joins The File Cache Club
-

 Crypto World2 days ago
Bitget enters Argentina’s regulated crypto market through PSAV registration
-

 Politics4 days ago
Politics Home | Healey Resignation Is “Colossal Failure Of Government”, Says Former Labour Defence Secretary
-
 Tech4 days ago
Dutton Ranch star claims they ‘didn’t see any disruption’ on set following Chad Feehan’s exit from Yellowstone spinoff fueled by Taylor Sheridan clash rumors
-
 Tech5 days ago
‘This is Seattle’s position on AI’: City Council votes unanimously to pause big new data centers
-

 NewsBeat4 days ago
El Nino has formed in the Pacific and could set records, forecasters say
-
 Entertainment4 days ago
Donnie Wahlberg & More Heat Up Las Vegas at Circa’s Barry’s Downtown Prime
-

 Sports4 days ago
First Time Since 1971: Australia Register Historic Low In ODI Cricket
-
 Tech4 days ago
Opendoor Ends India Operations, Fueling a Bigger Conversation About AI and Outsourcing
-

 Politics4 days ago
Belfast burns, while Met chief points finger at Iran and Russia
-

 Business5 days ago
Thailand Ranks Second Worldwide for AI Adoption Growth, Microsoft Reports
-

 NewsBeat3 days ago
FBI searches office of Ohio voter registration group
You must be logged in to post a comment Login