

Crypto World
Cardano price prediction as ADA accepted at 137 Spar stores in Switzerland

Cardano’s native token ADA is drawing renewed attention after the Cardano Foundation announced that the cryptocurrency can now be used for payments at Spar supermarkets across Switzerland, marking a real-world adoption milestone for the blockchain network.
Summary
- Cardano Foundation announced that Cardano can now be used at 137 stores of SPAR in Switzerland, expanding real-world crypto payment adoption.
- ADA is trading near $0.27 after weeks of consolidation following a broader downtrend from the $0.40 region earlier this year.
- Technical indicators show weak accumulation and slightly bearish momentum, with key support around $0.26 and resistance near $0.30.
According to the foundation, customers can now pay with the Cardano token (ADA) using a crypto payment integration powered by the OpenCryptoPay gateway, allowing seamless checkout transactions in participating stores.
The rollout makes the Swiss branch of the global retail chain one of the largest supermarket networks in Europe to accept ADA payments.
The initiative reflects Cardano’s broader push toward everyday payment use cases and could help strengthen the network’s reputation as a practical blockchain ecosystem beyond decentralized finance and token speculation.
Retail adoption has historically been a positive sentiment driver for cryptocurrencies, as it signals growing real-world utility. However, the impact on price tends to depend on broader market conditions and investor demand rather than adoption announcements alone.
At press time, ADA is trading near $0.27, showing modest stabilization after a prolonged downtrend that began in early January.
Cardano price prediction after ADA payment rollout across Spar stores
The daily chart shows that Cardano has been trading in a tight consolidation range between $0.26 and $0.30 over the past few weeks following a steep decline from the $0.40 region earlier in the year.
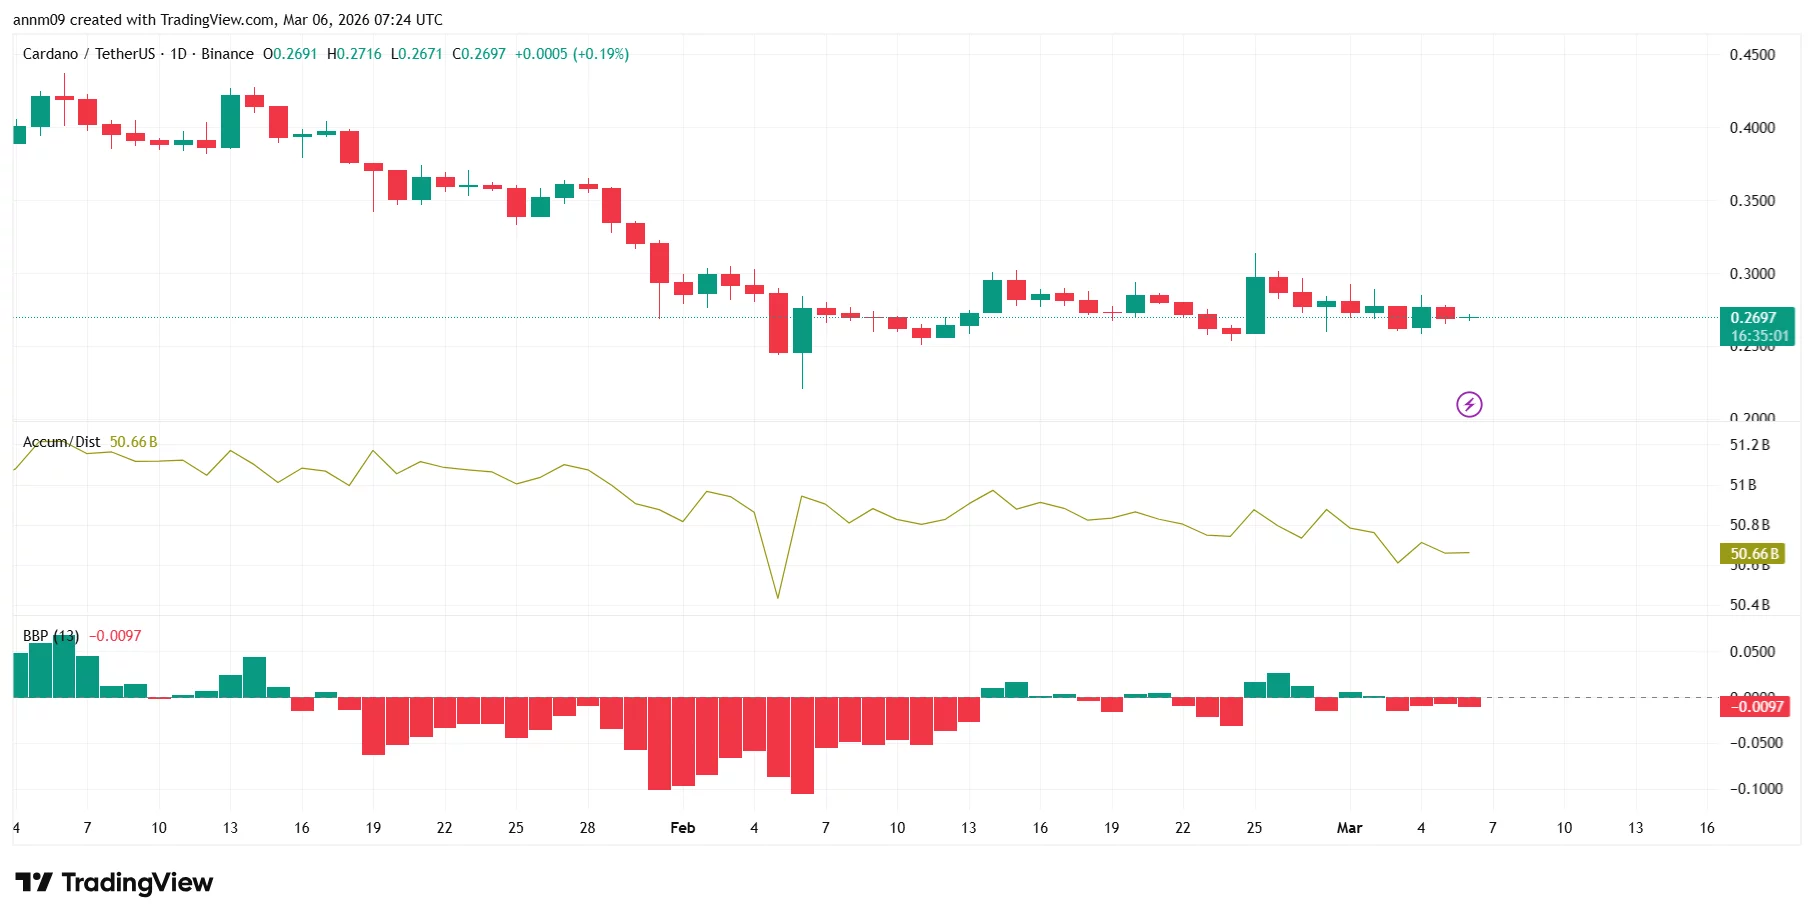
Price is currently hovering around $0.269, with the market forming smaller candles and reduced volatility — a pattern that often precedes a breakout move.
The Accumulation/Distribution indicator, sitting near 50.66B, has been trending slightly downward, suggesting that buying pressure remains limited and that large investors have not yet begun aggressive accumulation.
Meanwhile, the Balance of Power (BOP) indicator remains marginally negative at -0.0097, indicating that sellers still hold a slight advantage in the short term.
Key levels to watch include support near $0.26, which has held multiple times since mid-February. A breakdown below this level could expose ADA to further downside toward $0.24.
On the upside, resistance sits around $0.30, with a stronger barrier near $0.32. A sustained break above these levels could signal the start of a recovery rally if bullish momentum returns to the broader crypto market.
For now, ADA appears to be in a consolidation phase, with traders watching for a catalyst — such as increased adoption or broader market strength — to determine the token’s next major move.


Bitcoin (CRYPTO: BTC) has long carried a reputation for punishing late entrants, with double-digit drawdowns that test even patient investors. Yet a closer look at cycle-era history suggests that time, not timing, often determines whether red ink becomes green in the long run. Across multiple 2017, 2021, 2019, and 2022 cycles, buying near tops produced short-term pain, while patient holders who rode the cycles into longer horizons frequently emerged with meaningful gains. Notably, two-year snapshots can miss the tilt of the market, whereas three-year horizons tend to shift outcomes toward positive territory, particularly when purchases land near bear-market lows. This pattern has kept many analysts watching two key metrics: realized price bands and on-chain valuation, which historically have signaled stronger accumulation zones.
Key takeaways
- Two-year windows expose buyers to sizable drawdowns when entries occur near cycle highs; extending the holding period to three years often moves most positions into positive territory.
- Buyers who entered near bear-market lows historically captured outsized gains: the 2019 bottom yielded about 871% after two years and 1,028% after three years.
- In the 2021 cycle, entrants near the high faced a 43.5% loss after two years, but the same entry produced a positive 14.5% by year three.
- The 2022 cycle low followed a similar pattern, delivering roughly 465% returns after two years and about 429% after three years.
- On-chain valuation metrics, notably realized price bands, identify where long-term accumulation tends to occur, with current levels suggesting meaningful value zones for patient buyers.
- Institutional research reinforces the long-hold thesis: adding Bitcoin to a traditional 60/40 portfolio improved cumulative and risk-adjusted returns in every three-year window studied, with a roughly 5% BTC allocation yielding the strongest balance and a 93% win rate across two-year periods.
Tickers mentioned: $BTC
Market context: In a market driven by cyclical dynamics and on-chain signals, the evidence points to a bias in favor of longer horizons. As institutional interest grows and macro risk sentiment shifts, investors increasingly seek value-driven entries aligned with realized-price support rather than chasing short-term swings.
Why it matters
The historical pattern around Bitcoin’s cycles underscores a core investing lesson: duration matters. While two-year horizons can trap buyers in drawdowns when entry points occur near cycle highs, extending the clock to three years has a higher likelihood of delivering positive outcomes for most entry points. The strongest gains consistently trace back to bottom-entry zones, where price action meets value signals from on-chain data. For people looking to balance risk and reward, this pattern offers a framework for evaluating when to accumulate rather than when to speculate on immediate price swings.
On-chain metrics add another layer to the narrative. The concept of realized price—an average acquisition cost based on the last on-chain movement—helps identify the points at which market participants may have the most favorable long-term cost basis. The idea is to look for cycles where the price dips toward, or below, the realized price bands, signaling a potential trough and a readiness for multi-year rallies. Recent observations place Bitcoin’s realized price around $55,000, with the shifted realized price nearer to $42,000, hinting at plausible accumulation zones for patient buyers. These bands have repeatedly aligned with cycle lows since 2015, a pattern traders and researchers have used to frame longer-horizon strategies.
Research into portfolio construction reinforces the argument for longer horizons. Matt Hougan, chief information officer at Bitwise, highlighted a study showing that incorporating Bitcoin into a traditional 60/40 allocation improved both cumulative and risk-adjusted returns over all three-year windows examined. The takeaways point to a 93% win rate across two-year periods when BTC is allocated at roughly 5% of the portfolio, suggesting that even a modest exposure can meaningfully improve outcomes for investors willing to endure the cycle’s ups and downs. A separate Bitwise analysis covering July 2010 through February 2026 showed declining loss probabilities as holding periods lengthened: 0.7% chance of loss after three years, 0.2% after five, and zero over ten years. By contrast, shorter horizons, particularly day trading, bore higher risk, with a 47.1% chance of losses for two-year-like timeframes and a 24.3% probability of being underwater after one year.
The takeaway is not a guarantee but a pattern that aligns with a broader investment principle—time diversification tends to smooth out volatility and improves the odds of favorable outcomes when you tilt toward longer horizons and value-oriented entry points. For those who prefer chart-driven cues, a related analysis notes BTC price formation at bottoming levels, underscoring the practical value of combining on-chain signals with price action. See These 4 Bitcoin charts say BTC price is forming a bottom for context on bottom-case signals, and consult TradingView’s data as a reference point for price trajectories across cycles: TradingView.
These observations are not predictions but a framework that helps separate the noise of day-to-day price moves from longer-run fundamentals. They illuminate why some investors accumulate during downturns and wait for the market to revert to mean-like levels rather than chasing speculative rallies that may fade as quickly as they rise.
What to watch next
- Bitcoin price approaching realized price bands around $55,000 or testing the shifted band near $42,000 could signal potential accumulation zones worth monitoring over the next several quarters.
- Monitor whether new entries near bear-market lows translate into multi-year rallies, using three-year windows as a benchmark for evaluating performance.
- Follow updates to institutional research on long-hold strategies, especially any additional studies on 60/40-type portfolios that include BTC.
- Track on-chain metrics that refine bottom-entry signals, including shifts in realized price and related valuation bands across different market cycles.
- Pay attention to broader liquidity and risk sentiment changes that could influence the pace and duration of future cycles.
Sources & verification
- Bitcoin realized price bands and their role in identifying accumulation zones (current levels around $55k realized price; $42k shifted realized price).
- Historical performance: 2017 peak entry scenarios with a 48.6% two-year loss and a 108.7% three-year gain; 2021 peak with 43.5% two-year loss and 14.5% three-year gain; 2019 bear bottom delivering 871% and 1,028% over two and three years, respectively; 2022 cycle low with 465% and 429% returns over two and three years.
- Bitwise CIO Matt Hougan’s assessment of BTC in a traditional 60/40 portfolio and the cited 93% win rate for two-year horizons with ~5% BTC allocation.
- Bitwise review (2010–2026) showing loss probabilities drop to 0.7% at three years, 0.2% at five years, and zero at ten years.
- Shorter-horizon risk indicators: day traders’ near-50% loss probability; ~24% underwater for one-year horizons.
Bitcoin cycle dynamics: timing, realized price, and the long horizon
Bitcoin (CRYPTO: BTC) has long been cast as a volatile asset that punishes those who rush in near the highs. Yet a closer reading of market cycles demonstrates that the longer you stay exposed, the more often outcomes swing in favor of the patient. The historical record identifies a clear dichotomy: two-year horizons frequently register sizable drawdowns when purchases occur near cyclical peaks, but three-year horizons tend to flip those same entries into profitability. The most dramatic gains occur when accumulation happens near bear-market basins, reinforcing the case for disciplined, long-horizon participation in the market.
The data are not merely anecdotal. In 2017, investors who bought near the peak endured a near-50% drawdown within two years, yet those same investors who held for three years saw a substantial reversal, ending with gains exceeding 100%. The subsequent cycle showed a similar pattern: a roughly 43.5% loss over two years for buys near the 2021 top, followed by a positive return of about 14.5% in year three. By contrast, buying near bear-market lows produced outsized returns: 871% after two years and 1,028% after three years from the 2019 bottom. The 2022 cycle bottom followed suit, delivering roughly 465% over two years and about 429% over three years. Taken together, two-year windows expose investors to large drawdowns when entry points align with cycle highs, while three-year windows carry a higher probability of being in the green for most entries, with the bottom entries consistently offering the strongest price expansions in both timeframes.
The framework gains further credibility from on-chain valuation signals. Realized price bands, which reflect the average cost basis of coins based on the last on-chain movement, have guided accumulation for years. When prices dip toward these bands, the forward path often becomes more favorable for multi-year rallies, a pattern the data repeatedly validates since 2015. Today’s readings place Bitcoin’s realized price around a level that has historically coincided with the start of longer-term rallies, underscoring why patient accumulation near these zones has historically produced meaningful upside.
Market researchers also underscore the role of time in risk management. Bitwise’s analysis of long-hold periods shows that the long horizon not only improves returns but reduces downside risk. The combination of a measured allocation and a willingness to extend the investment horizon appears to deliver superior risk-adjusted outcomes relative to shorter-term approaches. This is not a guarantee, of course, but it is a framework that aligns with the observed data across multiple cycles, from 2017 through 2022 and into subsequent periods.
For readers seeking additional corroboration, a related analysis on BTC price dynamics highlights bottom-forming signals, and the charts cited there resonate with the idea of accumulation near defined valuation bands. As always, investors are advised to verify figures through the charting platforms and on-chain metrics that populate these narratives, including the TradingView data referenced above.
Crypto World
Ethereum Defies Bearish Short Report as $1.2B Daily Burn Continues to Outpace Network Inflation

TLDR:
- Ethereum daily ETH burn reached $1.2B in February 2026, still outpacing the 0.8% annual inflation rate.
- Validator APR held at 4–5% in March 2026, marginally above the 10-year U.S. Treasury yield of 4.2%.
- After removing L2 batch submissions, spam transactions account for only 4% of real network activity.
- Active Ethereum addresses surged 117% year-over-year, led by real users on Arbitrum, Base, and zk-EVMs.
Ethereum metrics challenge bearish claims as network burn continues to outpace supply in early 2026. A short report from Culper Research raised concerns about fee compression, spam activity, and validator sustainability.
However, on-chain data from February and March 2026 presents a contrasting picture. Daily ETH burn remained at $1.2 billion in February, exceeding the 0.8% annual inflation rate. The network continues to destroy more ETH than it produces, keeping supply dynamics intact.
Burn Rate and Fee Data Contradict the Bearish Narrative
Culper Research pointed to a 90% drop in median gas prices as a sign of network deterioration. Fees fell from roughly $2 to $0.20 following the Fusaka upgrade.
That decline, however, was built into the upgrade’s design from the start. The goal was to lower costs and redirect activity toward Layer 2 solutions. The drop was expected, not alarming.
Total daily ETH burn held at $1.2 billion through February 2026, despite lower per-gas prices. That figure still exceeds the network’s 0.8% annual inflation rate.
As a result, Ethereum remains deflationary in practice, with more ETH destroyed than created. The tokenomics argument against ETH loses ground when burn data is factored in.
Ethereum Daily, a crypto commentary account on X, addressed the report directly. The account wrote: “We need more clowns like Culper. Short $ETH if you want, but nobody cares.”
The post systematically challenged each claim in the Culper report. The response resonated broadly across crypto communities online.
The Fusaka upgrade’s fee reduction is also drawing more participants into the ecosystem. Lower transaction costs make Ethereum more accessible to everyday users.
That accessibility supports growing adoption across retail and institutional segments. Over time, broader usage tends to increase total burn volume even at lower per-unit rates.
Validator Yields and User Growth Support Network Stability
Validator economics also remain competitive heading into Q1 2026. Block rewards hold steady at approximately 2 ETH per block.
Total validator APR, including MEV rewards, ranged between 4% and 5% in March 2026. That return sits marginally above the 10-year U.S. Treasury yield of around 4.2%.
Staked ETH currently stands at roughly 19 million, representing about 66% of total supply. That level is well above the 30–40% threshold considered sufficient for network security.
The staking withdrawal queue has stayed flat near 3.2 million ETH for six consecutive months. Culper’s claim of a growing withdrawal backlog does not align with that data.
On the activity side, Culper flagged dust attacks as making up 22% of all transactions. After stripping out L2 batch submissions, spam transactions represent only about 4% of real network activity.
Non-spam wallet creation grew approximately 12% year-over-year in Q1 2026. Active addresses also rose 117% year-over-year, driven by users on Optimism, Arbitrum, Base, and zk-EVMs.
BitMine (BMNR) also drew scrutiny in the report for its ETH holdings. The firm holds roughly 4.47 million ETH, valued at around $9 billion.
Staking operations generate approximately $350 million annually in fees. With over $3 billion in cash equivalents on hand, the firm shows no signs of a financial strain.

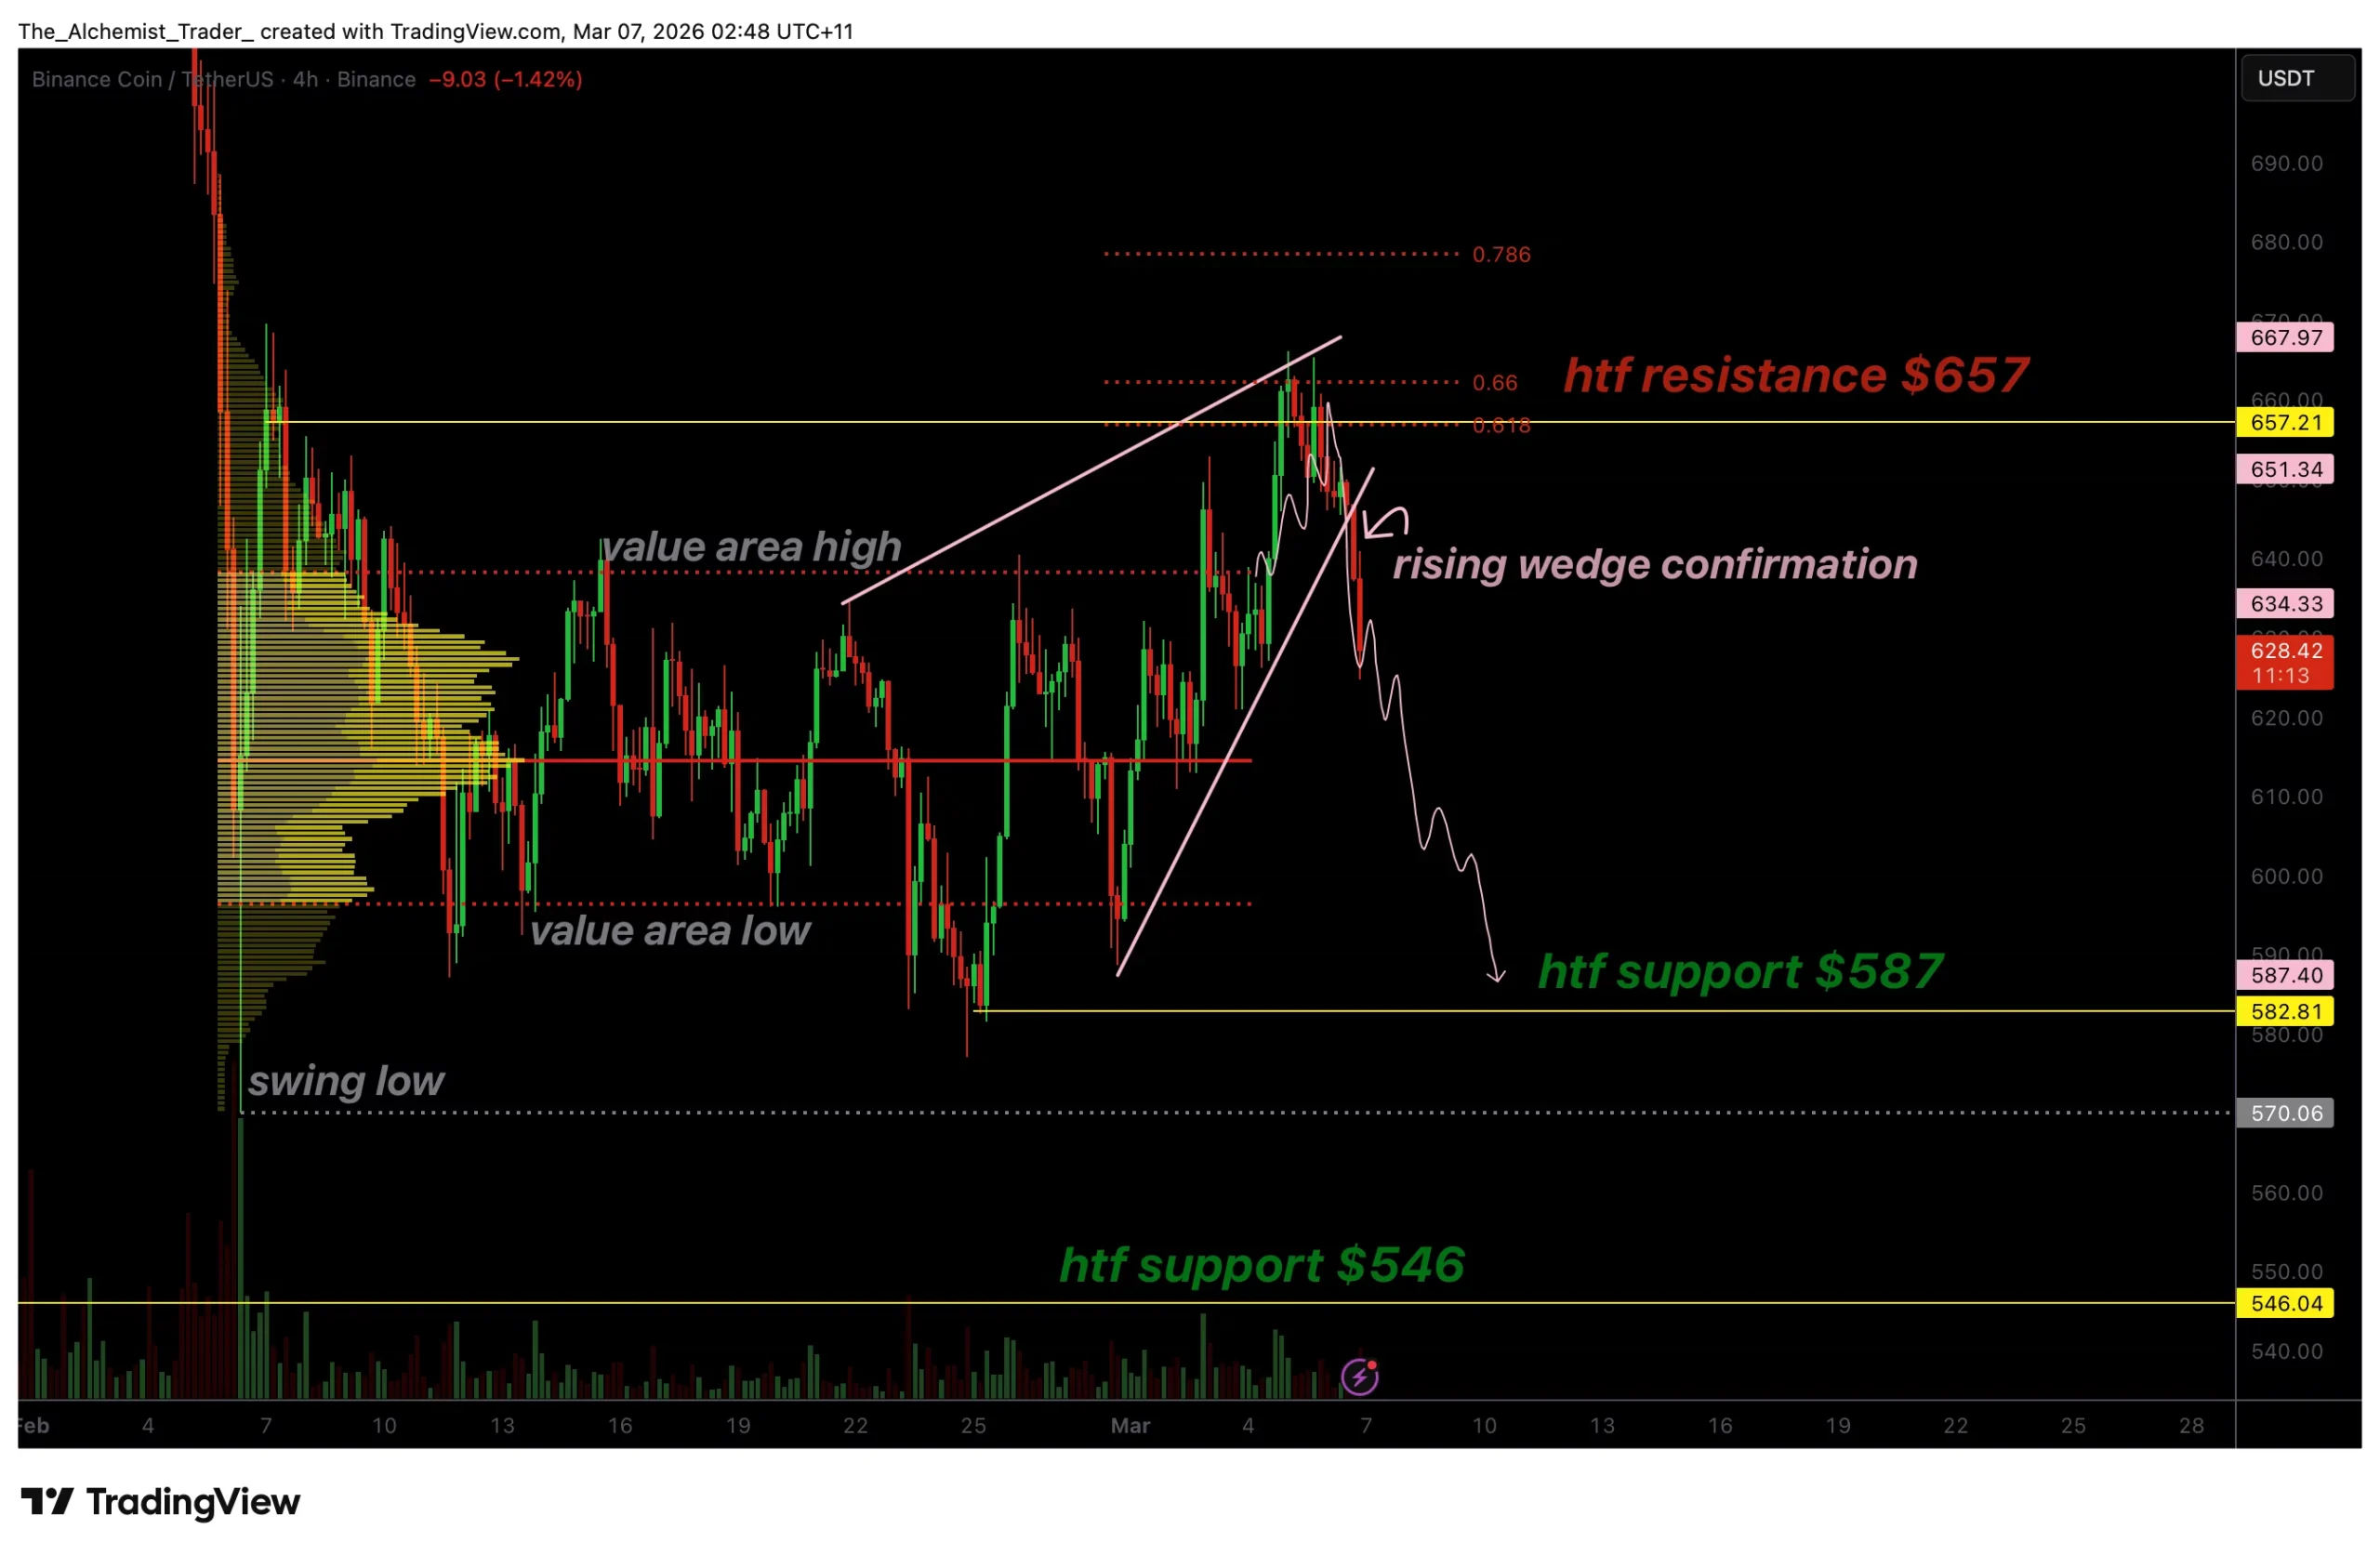
BNB price has confirmed a bearish rising wedge breakdown after rejecting the $657 resistance level. With the value area high now lost, the probability of a corrective move toward the $587 support is increasing.
Summary
- Rising wedge breakdown: Bearish pattern activated after rejection at $657 resistance.
- Value Area High lost: Signals weakening bullish momentum in the range.
- $587 support target: Next major high-timeframe support if bearish momentum continues.
BNB (BNB) price is showing signs of growing technical weakness after rejecting a key resistance zone and breaking below a rising wedge structure. Rising wedges are widely recognized as bearish continuation patterns, often signaling exhaustion in bullish momentum.
With the pattern now activated, traders are closely watching the $587 high-timeframe support level as the next potential downside target.
BNB price key technical points
- Rising wedge breakdown: Bearish pattern activated following rejection at $657 resistance.
- Value Area High lost: Indicates weakening bullish momentum within the range.
- Downside target: $587 stands as the next major high-timeframe support level.

BNB recently attempted to push higher but faced strong resistance near the $657 level, which has historically acted as a key supply zone. The rejection from this level triggered a breakdown from the rising wedge pattern that had been forming over several weeks. Rising wedges typically form during periods of slowing upward momentum and are often followed by sharp corrective moves once support breaks.
The wedge structure itself reflected a tightening price range where each push higher was met with increasing selling pressure. While buyers continued to attempt new highs, the inability to sustain momentum above key resistance levels suggested that bullish strength was gradually weakening. Once the lower boundary of the wedge began to give way, the bearish structure became increasingly clear.
A significant technical development following the wedge rejection is the loss of the value area high within the current trading range. The value area high often acts as a key pivot where buyers attempt to maintain control of price. When this level is lost, it typically signals that market participants are no longer willing to support higher prices in the short term. This loss strengthens the bearish outlook and increases the likelihood of a deeper corrective move.
Currently, BNB is trading near the point of control, which represents the price level with the highest traded volume within the current range. The point of control often acts as a temporary support level, as it reflects a zone where buyers and sellers previously found balance. However, if this level fails to hold, it could trigger a stronger downside move as price seeks liquidity at lower support levels.
The next major area of interest sits around the $587 level, which aligns with the technical target derived from the rising wedge breakdown. This level also coincides with a higher-timeframe support zone, making it a logical destination if bearish momentum continues to build.
Markets often move quickly toward these types of structural targets once key support levels begin to fail. Meanwhile, on the fundamental side, YZi Labs has committed $100 million to Hash Global’s BNB Holdings Fund, positioning BNB as institutional-grade yield infrastructure within the broader digital asset ecosystem.
In addition to the structural breakdown, broader market dynamics may also play a role in shaping BNB’s near-term direction. If sellers maintain control below the wedge structure, it further strengthens the probability of a move toward the next support level.
What to expect in the coming price action
From a technical perspective, BNB remains vulnerable to further downside after confirming the rising wedge breakdown. As long as price remains below the rejected $657 resistance and fails to reclaim the value area high, the probability favors a continuation toward the $587 support level.
A breakdown below the point of control would further confirm bearish momentum and increase the likelihood of a deeper corrective move.


High-profile whale reloads on 25x ETH leverage despite racking up over $29.7 million in realized losses as majors slide and funding turns negative.
Summary
- Machi sends another 210,000 USDC to HyperLiquid to scale an already aggressive ETH long.
- His cumulative loss on this campaign now exceeds $29.7 million amid a broad crypto pullback.
- The move comes as ETH trades around $1,978, BTC near $68,583 and funding flips mildly negative.
In the middle of a red day for majors, on-chain data shows Machi (machibigbrother) wiring an additional 210,000 USDC to the derivatives venue HyperLiquid, explicitly to expand a high-octane long position in ETH with maximum leverage up to 25x.
This is not a fresh thesis so much as an attempt to press a bruised conviction trade: as the market rolled over, Machi had already been forced to cut and close most of his earlier exposure, crystallizing more than $29.7 million in realized losses on this campaign alone. Yet rather than de-risk into weakness, he is stepping back into the same structure, in the same asset, with the same extreme gearing.
The timing is stark. At the moment of the report, BTC trades around $68,583, down roughly 4%, while ETH changes hands near $1,978, off almost 4.9% on the day. Across the board, majors are under pressure: SOL slides more than 5%, LINK nearly 4.8%, with alt liquidity thin and correlations elevated. Derivatives metrics confirm stress under the surface, with the 8‑hour average funding rate on ETH marginally negative at about -0.0047%, a sign that perpetual traders are skewed short or at least no longer willing to pay up for long exposure.
At the same time, structural flows are turning against the complex. U.S. spot Bitcoin ETFs saw net outflows equivalent to 1,697 BTC, while Ethereum ETFs bled around 3,185 ETH, draining some of the passive bid that had previously supported dips. Network-wide, the liquidation tally over the last 24 hours reached roughly $354 million, with the bulk coming from overleveraged longs that were forced out as prices slid. Against that backdrop, Machi’s decision to reload on 25x ETH longs looks less like quiet accumulation and more like a public stress test of risk tolerance—one that will either be rewarded by a sharp mean-reversion bounce or remembered as a textbook case of throwing good money after bad into a structurally weak tape.

A Seattle judge sentenced Nevin Shetty, the former chief financial officer of a local startup, to two years in prison after a jury found him guilty of wire fraud tied to a covert crypto venture. Prosecutors say Shetty secretly moved around $35 million of company funds to a cryptocurrency platform he controlled as a side business, channeling the money into high-yield DeFi lending protocols in 2022. The transfers went undetected by executives and the board until a market downturn exposed the scheme. Indicted in May 2023 and convicted on four counts in November 2025, Shetty was ordered to repay the stolen funds and will face three years of supervised release after serving his sentence. The case unfolds amid a wider crypto winter and the Terra ecosystem crash in 2022, which underscored the sector’s volatility and governance risks.
Key takeaways
- The CFO allegedly diverted approximately $35 million from a Seattle startup to a crypto platform he controlled as a side business in 2022, moving funds to HighTower Treasury before a market downturn.
- Initial returns appeared promising, with about $133,000 earned in the first month, but those gains were short-lived as the Terra-related downturn and broader market conditions reversed the position, leading to a near-total loss by May 13, 2022.
- The misappropriation remained hidden from the board and executives until the scheme’s exposure during market stress, after which Shetty was terminated from the company.
- Shetty was indicted in May 2023 and later found guilty on four counts following a nine-day jury trial in November 2025, marking a high-profile enforcement action in crypto-related corporate fraud.
- The sentence requires repayment of the stolen funds and imposes three years of supervised release in addition to the two-year prison term, highlighting consequences for fraud in crypto-enabled ventures.
- Contextual factors include the Terra ecosystem collapse in 2022 and the broader regulatory and enforcement environment surrounding crypto-related misconduct and corporate governance.
Market context: The case arrived amid heightened regulatory scrutiny of crypto-related fund movements and DeFi activity, with investors and policymakers watching closely how startups manage corporate assets in a volatile market. The Terra meltdown in 2022 contributed to a period of risk-off sentiment, while high-profile incidents such as the FTX collapse underscored the need for stronger governance, disclosure, and accountability when crypto instruments intersect with corporate funds.
Why it matters
The court outcome reinforces the fundamental principle that corporate funds, even when they move through crypto channels, remain subject to fiduciary duties and return obligations. For startups, the Shetty case underscores the imperative of robust internal controls, independent oversight, and clear separation between business operations and personal crypto ventures. When executives borrow or divert company capital into volatile DeFi strategies, the risk is not only financial losses but potential legal exposure for fraud and embezzlement. The decision serves as a cautionary milestone for small firms navigating the frontier between traditional corporate finance and rapidly evolving crypto instruments.
Beyond the specific individuals involved, the episode sheds light on governance gaps in early-stage tech firms that experimentally engaged crypto funding or DeFi strategies. While diversification and alternative funding channels can offer value, misalignment between management incentives and shareholder interests can lead to scenarios where value is eroded swiftly as markets turn. The Terra-related downturn of 2022, which contributed to the decline in crypto asset valuations, framed a period in which the line between investment strategy and personal venture became dangerously blurred for some executives.
From a policy perspective, the case accentuates the ongoing need for clear reporting requirements, enhanced internal audit capabilities, and accountability mechanisms when corporate leaders pursue crypto opportunities with corporate money. It also highlights the legal framework surrounding wire fraud prosecutions in cases where crypto assets and DeFi activities are used to enrich private interests at the expense of a company and its stakeholders.
For investors and prosecutors alike, the story underlines a broader truth about the crypto era: enthusiasm for new financial rails must be matched by stringent governance, transparent disclosures, and rigorous risk management to protect both enterprises and their communities. The legal resolution in this instance may influence how similar cases are pursued, particularly where cross-currents of corporate finance, DeFi yield farming, and market volatility intersect.
Video coverage and trial glimpses are available here: YouTube video.
Additional context around related cases and the evolving enforcement landscape can be found in prior reporting on the matter, including official statements and analyses tied to the indictment and subsequent verdict.
Note: The developments sit alongside broader industry events, such as the FTX collapse and ongoing appellate proceedings related to that case, which illustrate the persistent risk environment in crypto markets and the judiciary’s role in resolving disputes that straddle traditional finance and decentralized finance.
What to watch next
- Post-sentencing restitution: monitoring how the court enforces repayment of the $35 million or facilitates recovery from related assets.
- Appeals and potential changes in the case record: any appellate filings or rulings that could modify the outcome or sentence.
- Regulatory and governance reforms at startup and corporate venture levels to prevent similar misappropriations.
- Impact on HighTower Treasury and any related platforms as new compliance and risk controls are evaluated.
Sources & verification
- Department of Justice press release: Former CFO sentenced to two years in prison for $35 million theft from a Seattle tech firm. https://www.justice.gov/usao-wdwa/pr/former-cfo-sentenced-two-years-prison-35-million-theft-start-tech-firm
- DOJ press release: Indictment for wire fraud related to diverted funds to a cryptocurrency venture (May 2023). https://cointelegraph.com/news/former-cfo-indicted-for-diverting-35m-to-cryptocurrency-venture
- Official court and docket coverage referenced in contemporaneous reporting and subsequent verdict details. https://cointelegraph.com/news/ftx-sam-bankman-fried-returns-court-appeal
Gavel falls on former CFO who siphoned funds into DeFi bets
A Seattle startup’s former chief financial officer, Nevin Shetty, faced a judicial reckoning after prosecutors alleged a calculated scheme to divert company funds into a cryptocurrency venture that operated on the side. In 2022, according to the Department of Justice, Shetty covertly redirected roughly $35 million from the startup’s coffers to a crypto platform he controlled, channeling the money into DeFi lending protocols touted as high-yield investments. The funds were placed on HighTower Treasury, a platform described in court filings as a vehicle for his personal crypto ambitions rather than a legitimate corporate treasury tool. The maneuver proceeded without board or executive oversight, and the board only became aware of the transfer when market volatility exposed the hidden accounts.
Initial performance figures painted a misleading picture. The government noted that Shetty supposedly earned about $133,000 in the first month from these crypto wagers, a figure that many investors would consider a disproportionate return relative to risk. Yet the 2022 market environment—framed in part by a downturn in Terra-linked assets—quickly eroded the value of the crypto positions. By mid-May 2022, authorities said, the investments had collapsed toward zero, erasing the apparent early gains and triggering questions about the source and stewardship of the funds.
According to DOJ filings, Shetty did not disclose the transfers to the startup’s leadership or its board, effectively isolating the activity from proper governance channels. After the initial losses became evident, he disclosed the situation to two other executives and was subsequently fired from his role. The subsequent legal process unfolded over years, culminating in a nine-day jury trial that ended in November 2025 with a four-count conviction on wire fraud charges. The court ordered Shetty to repay the $35 million and imposed three years of supervised release beyond the two-year prison sentence.
The case sits within a broader arc of crypto-focused enforcement that has defined much of the industry’s recent history. It occurred in the wake of the Terra ecosystem’s dramatic downturn in 2022, a sequence of events that rattled investor confidence and intensified scrutiny of how crypto investments intersect with corporate capital. The trial and its outcome also align with ongoing enforcement actions that accompanied the FTX collapse, a watershed event that reshaped public and regulatory expectations for crypto exchanges, corporate risk disclosures, and the accountability of executives who oversee digital asset ventures.
For readers tracking the legal and regulatory environment around crypto, the Shetty case underscores a persistent risk: when corporate resources are funneled into personal crypto ventures, the consequences extend beyond financial losses, potentially triggering criminal charges, restitution requirements, and long-term reputational damage. It serves as a reminder that governance frameworks, internal controls, and transparent reporting remain essential as startups navigate an industry characterized by rapid innovation and heightened volatility.
Payments company Strike received a virtual currency license and a money transmitter license (MTL) from the New York State Department of Financial Services (NYDFS), allowing the company to offer its Bitcoin services to residents and businesses in New York.
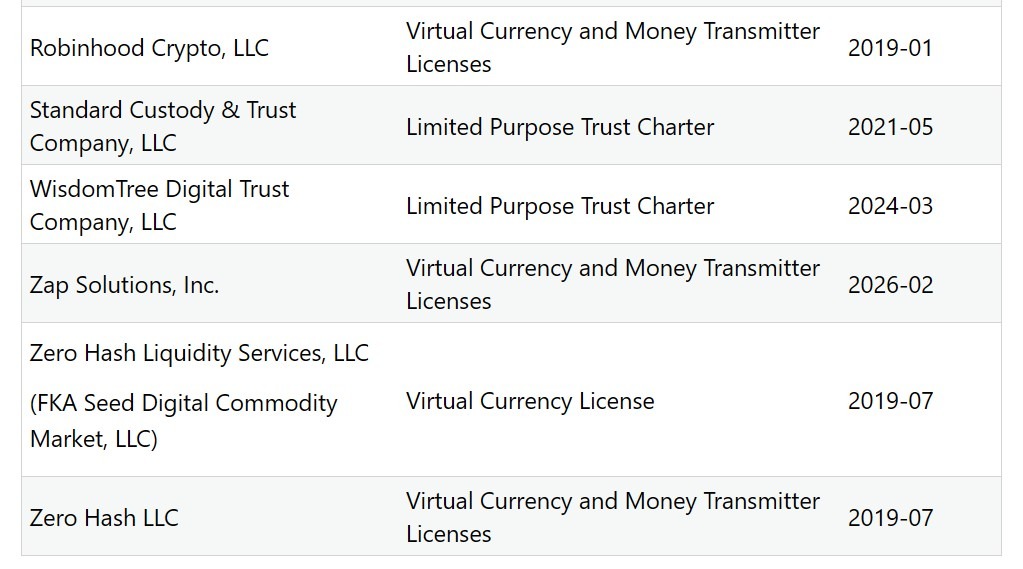
Granted in February, the approvals authorize Zap Solutions, Inc., which does business as Strike, to operate under New York’s digital asset regulatory framework, the company said in a Thursday release.
New York residents can now use Strike to buy and sell Bitcoin (BTC), set recurring or price-targeted purchases and convert direct-deposited paychecks into Bitcoin. The platform also allows users to pay bills from Bitcoin balances and withdraw funds to self-custody wallets.
“Receiving our BitLicense is a defining milestone for Strike,” founder and CEO Jack Mallers said in a statement, adding that the approval allows the company to expand its Bitcoin-based financial services in a major financial market.

A BitLicense allows companies to conduct digital currency business with New York residents, but does not by itself authorize nationwide operations.
Companies looking to operate across the US must typically obtain MTLs in other states as well.
Related: MoonPay to operate in all 50 US states after NY BitLicense approval
The framework requires companies to maintain capital reserves, implement Anti-Money Laundering (AML) controls and undergo regular regulatory examinations.
NY approvals remain a key step for US crypto companies
The approvals are another step in Strike’s US expansion, with New York’s stringent licensing framework often serving as a benchmark for crypto companies seeking regulated market access.
Others holding BitLicenses in New York include MoonPay, Coinbase, eToro, Robinhood and Circle, according to NYDFS records.
New York regulators have also taken enforcement action against license holders. In 2024, Genesis Global Trading agreed to surrender its BitLicense and pay an $8 million penalty to the regulator after investigators found failures in its AML and cybersecurity programs.
In 2025, Adrienne Harris, former superintendent of the New York State Department of Financial Services, said the state has an “outsized role to play” in the crypto ecosystem and that lawmakers frequently consult the regulator when drafting digital asset legislation.
Magazine: What’s a ‘Network State’ and are there real-life examples? Big Questions
TLDR:
- Binance processed over 71,000 law enforcement requests in 2025, helping seize $752 million in illicit assets worldwide.
- Exposure to illicit wallets on Binance dropped nearly 97% between January 2024 and July 2025, per blockchain analytics data.
- Hexa Whale and Blessed Trust were offboarded following proactive internal investigations, not media pressure or regulatory orders.
- Binance denied WSJ claims of 2,000 Iranian-linked accounts, linking the allegation to its ongoing VPN circumvention detection efforts.
Binance has formally responded to a February 24, 2026 letter from U.S. Senator Richard Blumenthal of the Permanent Subcommittee on Investigations.
The exchange giant directly challenged allegations drawn from recent media reports by the New York Times, Fortune, and the Wall Street Journal.
In its response, the company defended its compliance program, disputed claims about Iranian user accounts, and addressed the treatment of former employees. The letter was published publicly on March 6, 2026.
Compliance Record and Enforcement Cooperation
The company stated that it has invested hundreds of millions of dollars building its compliance infrastructure. Over 1,500 specialists currently work across sanctions, counter-terrorism financing, and financial crime investigations.
Binance also deploys more than 25 advanced monitoring tools for transaction screening and behavioral analytics.
In 2025, the exchange processed more than 71,000 law enforcement requests globally. Over the past three years, it also assisted in seizing more than $752 million in illicit assets, with nearly $579 million recovered for U.S. agencies. These figures reflect a broad commitment to supporting law enforcement operations worldwide.
Richard Teng, Binance’s CEO, addressed the matter publicly on social media. He wrote, “We’ve voluntarily responded to Senator Blumenthal’s inquiry which raises false and defamatory allegations reported by the WSJ.” He further noted that the company’s response was meant to protect its more than 300 million users.
Additionally, blockchain analytics data showed that Binance’s exposure to illicit wallets dropped from 0.284% to just 0.009% of total exchange volume between January 2024 and July 2025.
That represents a decrease of nearly 97% over the period. Exposure to major Iranian crypto exchanges also fell by 97.3% in two years, from $4.19 million to $110,000.
The response also referenced the T3 Financial Crime Unit, which froze over $300 million in its first year of operation alone. This network operates in real time and acts before tainted funds can move further in the system.
Hexa Whale, Blessed Trust, and Employee Matters
Regarding the two entities named in the Senator’s letter, Binance clarified that both investigations began following law enforcement inquiries.
In April 2025, law enforcement flagged wallet addresses with potential terrorist financing ties. Binance then launched a comprehensive internal review that went beyond the original request. Hexa Whale was subsequently offboarded on August 13, 2025.
Similarly, the Blessed Trust investigation began in summer 2025 after a separate law enforcement request. After a thorough source of funds analysis, Binance offboarded the entity in January 2026. The company stated that no Binance account had transacted directly with an Iran-based entity in either case.
On the Iranian account allegation, the company was direct. The WSJ claim that Binance identified 2,000 Iranian-linked accounts was described as false.
The company suspects the claim relates to its ongoing efforts to detect VPN circumvention rather than any confirmed Iranian user base. All users must complete mandatory identity verification to use the platform.
On employee matters, the company confirmed that some compliance staff had recently left. Most departures were voluntary resignations.
One employee was terminated for leaking internal user data, not for raising compliance concerns. The company stated clearly that no workers were dismissed for escalating issues internally.
Binance closed its response by affirming its continued commitment to compliance improvements, law enforcement cooperation, and user protection across the global crypto ecosystem.
Bitcoin (BTC) gets a bad name among some investors due to its steep double-digit drawdowns that punish late buyers, but data suggests the outcome can change with time.
Since 2017, investors who bought BTC near the market highs faced losses of about 40%–50% in the next two years, but data shows many of those positions turned profitable when held for longer than three years.
By contrast, entries near bear-market lows have historically produced triple-digit percentage returns over similar two to three-year periods. Onchain valuation metrics further help explain where these stronger accumulation zones tend to appear.
Bitcoin cycle data reveals how entry timing affects gains
Bitcoin’s (BTC) long-term performance appears volatile across the shorter two-year holding period. The cycle comparisons show a massive change when the positions extend to three years.
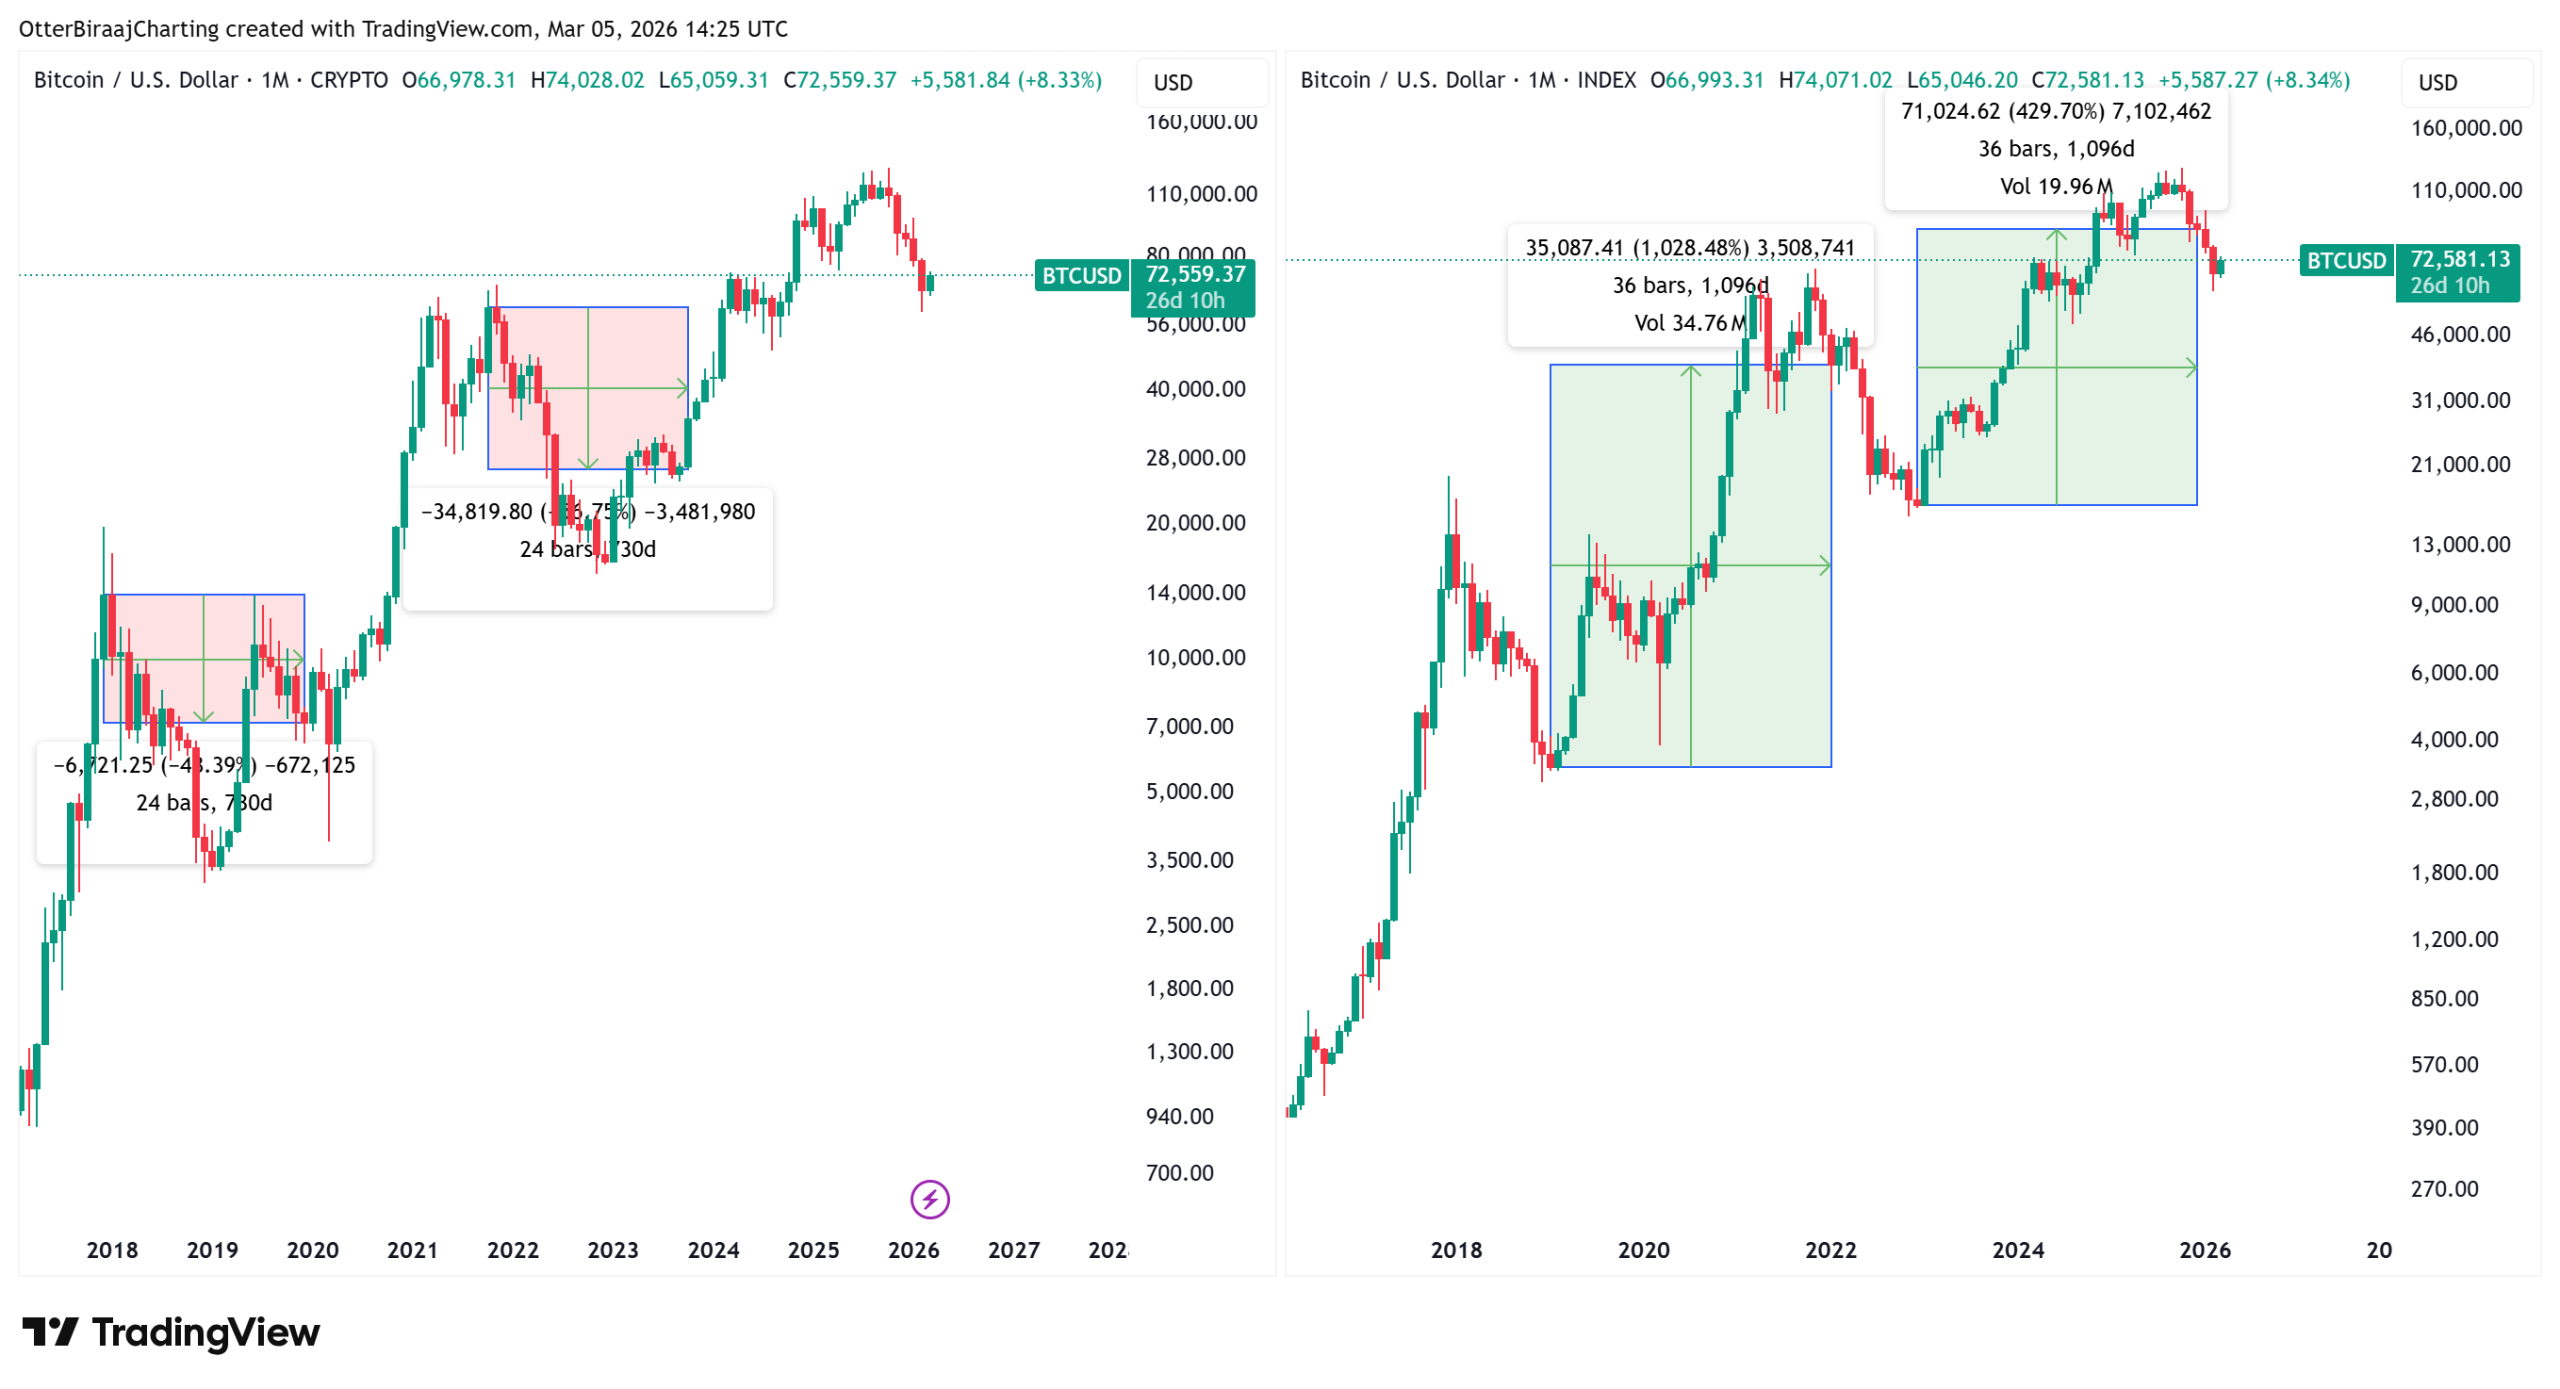
Investors who bought near the 2017 market peak faced a 48.6% loss after two years during the 2018 bear market. Extending the holding period to three years turned that position into a 108.7% gain.

A similar trajectory appeared in the next market cycle. Buyers entering near the 2021 high recorded losses of 43.5% after two years. By the third year, the same entry produced a 14.5% profit.
The entries near bear-market lows generated far larger gains. Buying close to the 2019 bottom produced returns of 871% after two years and 1,028% after three years.
The 2022 cycle low followed a comparable path. Buy positions initiated near that period generated roughly 465% returns after two years and about 429% after three years.

Together, the data highlighted a consistent pattern. Two-year windows expose investors to large drawdowns when entries occur near cycle highs. Three-year holding periods historically move most entries into positive territory, while bottom entries capture the strongest price expansion in both holding periods.
Related: These 4 Bitcoin charts say BTC price is forming a bottom
BTC realized price zones guide bottom entries
BTC’s onchain valuation metrics help identify where these bottom entries have historically occurred.
Bitcoin’s realized price measures the average acquisition price of coins based on their last onchain movement. Deeper drawdowns frequently extend toward the shifted realized price, which smooths the metric forward and highlights the stronger value zones.

These bands have identified long-term accumulation ranges since 2015. Bitcoin’s realized price currently sits near $55,000, while the shifted realized price is around $42,000.
Since 2015, Bitcoin’s realized price bands have repeatedly coincided with the cycle lows, with the price recoveries from these zones initiating multi-year rallies.
The behavior connects closely with the earlier return data. Investors who accumulated near bear-market lows typically entered while the price traded around or below these valuation bands.
Institutional research also highlighted the role of longer holding periods. Bitwise chief information officer Matt Hougan cited a study showing that adding Bitcoin to a traditional 60/40 portfolio increased cumulative and risk-adjusted returns in every three-year period studied. The win rate is 93% across two-year periods, with a roughly 5% allocation producing the strongest balance.
A separate Bitwise review of Bitcoin data from July 2010 through February 2026 showed the probability of loss falls to 0.7% when BTC is held for three years. The risk drops to 0.2% over five years and reaches zero across ten-year holding periods.
The shorter horizons carry more uncertainty. Day traders historically faced a 47.1% chance of losses, while the one-year holding periods still showed a 24.3% probability of being underwater.
Related: Bitcoin bears ‘annihilated’ as analysis sees $65K support test next
This article does not contain investment advice or recommendations. Every investment and trading move involves risk, and readers should conduct their own research when making a decision. While we strive to provide accurate and timely information, Cointelegraph does not guarantee the accuracy, completeness, or reliability of any information in this article. This article may contain forward-looking statements that are subject to risks and uncertainties. Cointelegraph will not be liable for any loss or damage arising from your reliance on this information.


A code dispute has surfaced between Curve Finance and PancakeSwap over the use of StableSwap technology.
Summary
- Curve Finance says PancakeSwap copied parts of its StableSwap code without permission, calling it a license violation.
- PancakeSwap responded that its team is reaching out to Curve to discuss the matter.
- Both sides signaled they prefer cooperation and possible licensing over a legal dispute.
Curve Finance (CRV) has publicly accused PancakeSwap (CAKE) of copying parts of its code without permission.
The allegation was posted on X on March 6. Curve claimed PancakeSwap used code from its StableSwap implementation without following the license terms.
Dispute over StableSwap code
In the post, Curve directly addressed PancakeSwap and said the exchange copied its code “without asking,” which it described as a violation of the software license.
Curve said the issue is both legal and technical. According to the team, similar situations in the past created problems for projects that reused the code without proper handling.
The post included a screenshot that appeared to highlight parts of the code in question. Curve suggested the file attribution listed PancakeSwap as the author even though the logic originated from Curve’s StableSwap system.
StableSwap is one of Curve’s main innovations. The automated market maker model is designed to allow low-slippage swaps between stablecoins and other tightly pegged assets. It uses a specialized mathematical formula that blends constant-product and constant-sum curves to keep prices stable during trades.
The system is widely used across decentralized finance. Curve’s smart contracts are open source, but the license requires proper attribution and compliance with the terms.
PancakeSwap response and possible resolution
PancakeSwap responded shortly after the post. The exchange said its team would contact Curve directly to discuss the matter. Curve welcomed the response and said it would prefer co-operation over conflict.
“Better to be friends and build together,” Curve wrote in a follow-up message.
The issue appears connected to PancakeSwap’s recent “Infinity StableSwap” upgrade announced earlier in March. The update brings better pricing for stablecoin swaps, with lower slippage and dynamic fees.
Curve cautioned that there may be technical risks if StableSwap code is copied directly or improperly modified. Forks of comparable systems in earlier DeFi projects occasionally encountered vulnerabilities or exploits due to improper code implementation.
As of right now, it appears that both teams are open to discussing a solution. Curve noted that PancakeSwap could still obtain a proper license and collaborate if it wants to use the technology without legal issues.

Global headlines may be dominated by reports of conflict, but crypto is holding steady. According to projections generated by Perplexity, holders of XRP, SOL, and SHIB could still see significant gains this year.
Many say that geopolitical risk may already have been priced into markets after Donald Trump’s previous warnings about possible U.S. military escalation involving Greenland and Iran earlier this year.
With uncertainty still lingering, we examine how realistic Perplexity’s projections are.
XRP ($XRP): Perplexity Projects a Potential 7x Surge by Year-End
In a recent update, Ripple reaffirmed that XRP ($XRP) plays a central role in the XRP Ledger’s (XRPL) growth into a global payments infrastructure designed for enterprise use.
XRP enables near-instant settlement and extremely low transaction fees, positioning the network to capture two rapidly expanding sectors in crypto: stablecoins and tokenized real-world assets.
With XRP currently trading close to $1.36, Perplexity AI predicts the asset could potentially climb to around $10 in 2026, representing a little over sevenfold return for current HODLers.
XRP’s relative strength index (RSI) currently sits near 42, while price movement has begun stabilized around its 30-day moving average, suggesting perhaps the extended consolidation period is nearing its end.
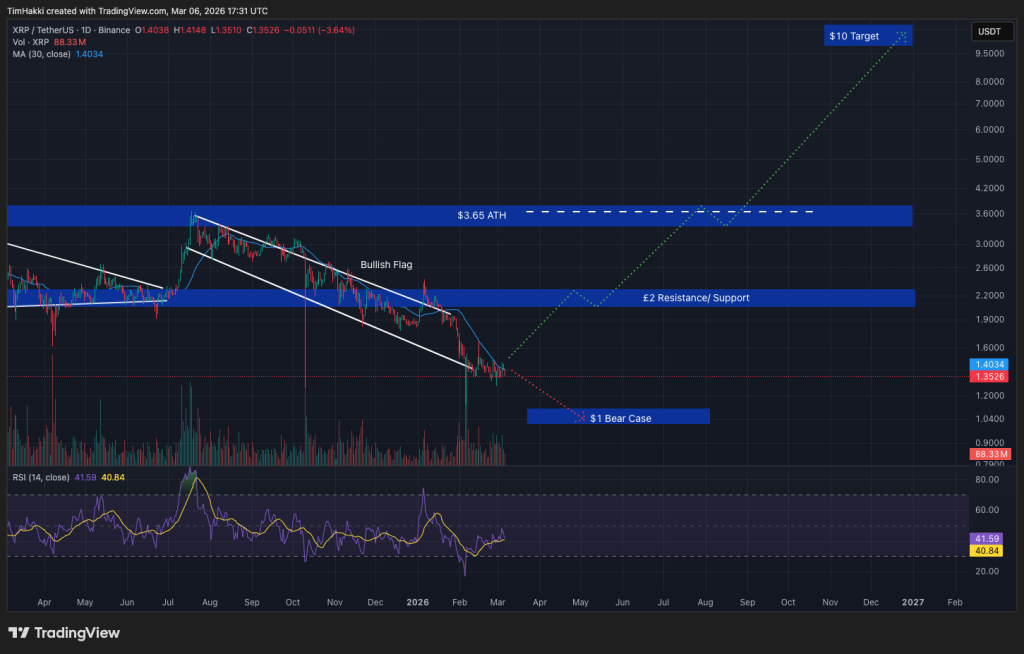
Several catalysts could further strengthen XRP’s outlook, including rising institutional demand following the launch of U.S.-listed XRP exchange-traded funds, Ripple’s expanding network of international partnerships, and comprehensive crypto legislation (the CLARITY Act) in the United States.
Solana (SOL): Could Solana Soon Hit $700?
Solana ($SOL) currently secures around $6.7 billion in total value locked and has a market capitalization of $48 billion.
Institutional interest increased after the introduction of Solana-based exchange-traded funds by prominent asset managers such as Bitwise and Grayscale.
However, SOL crashed toward the end of 2025 and spent much of February trading below the $100 mark.
Perplexity sees Solana rising from $84 today to approximately $700 by Christmas. That would give 8x returns and price Solana more than double it’s January 2025 ATH of $293 recorded.
Moreover, major asset managers like Franklin Templeton and BlackRock have begun issuing tokenized assets on Solana.
Shiba Inu (SHIB): Perplexity Forecasts a Potential 2,000% Rally
Originally launched in 2020 as a tongue-in-cheek Dogecoin challenger, Shiba Inu ($SHIB) has since developed into a broader ecosystem with a market capitalization of $3.2 billion.
Currently around $0.000005359, Perplexity’s analysis suggests that a decisive breakout above the $0.000025–$0.00003 resistance range could trigger strong upward momentum. Under that scenario, SHIB could potentially climb toward $0.00008 before the end of the year.
Such a move would represent gains of roughly 15x, or around 1,400%, bringing it a hair’s breadth beneath its October 2021 ATH of $0.00008616.
Beyond its meme coin reputation, the project has introduced practical utility through Shibarium, its Ethereum Layer-2 scaling solution. Shibarium delivers faster transactions, lower fees, enhanced privacy features, and improved developer tools for building decentralized applications.
Maxi Doge: Emerging Meme Coin Aims for Rapid Growth
Perplexity’s projection of a potential 14x surge for Shiba Inu reflects expectations that a new meme coin cycle could accompany the next crypto bull market. However, projects at earlier stages often present even greater growth potential.
One project gaining attention is Maxi Doge ($MAXI), which has already raised $4.7 million through its ongoing presale as early investors accumulate what some believe could become the next Shiba Inu.
Maxi Doge is the loud, louche and degenerate distant cousin to Dogecoin, embracing a comic marketing approach inspired by the chaotic enthusiasm of the 2021 meme coin boom.
MAXI is an ERC-20 asset on Ethereum’s proof-of-stake network, giving it a significantly smaller environmental footprint compared with Dogecoin’s proof-of-work system.
Early participants in the presale can currently stake MAXI for yields reaching up to 67% APY. These rewards gradually decrease as more tokens enter the staking pool.
The token is currently priced at $0.0002807 during the latest presale phase, with automatic price increases scheduled at each new funding milestone. Investors can purchase the token using supported wallets such as MetaMask and Best Wallet.
Stay updated through Maxi Doge’s official X and Telegram pages.
Visit the Official Maxi Doge Website Here
The post Perplexity AI Predicts the Price of XRP, Solana and Shiba Inu by The End of 2026 appeared first on Cryptonews.
Work begins on eye-wateringly expensive ultra modern Welsh school

Data Shows No Profit for 3+ Years

Trump holds college sports roundtable with Saban, Meyer in attendance


-

 Politics4 days ago
Alan Cumming Brands Baftas Ceremony A ‘Triggering S**tshow’
-

 Tech6 days ago
Unihertz’s Titan 2 Elite Arrives Just as Physical Keyboards Refuse to Fade Away
-

 NewsBeat6 days ago
Abusive parents will now be treated like sex offenders and placed on a ‘child cruelty register’ | News UK
-
Business10 hours ago
Form 8K Entergy Mississippi LLC For: 6 March
-
 NewsBeat6 days ago
Dubai flights cancelled as Brit told airspace closed ’10 minutes after boarding’
-
Sports7 days ago
The Vikings Need a Duck
-
 NewsBeat7 days ago
The empty pub on busy Cambridge road that has been boarded up for years
-

 NewsBeat5 days ago
‘Significant’ damage to boarded-up Horden house after fire
-

 Tech2 days ago
Bitwarden adds support for passkey login on Windows 11
-

 Entertainment5 days ago
Baby Gear Guide: Strollers, Car Seats
-
 Sports1 day ago
499 runs and 34 sixes later, India beat England to enter T20 World Cup final | Cricket News
-

 Fashion6 hours ago
Weekend Open Thread: Ann Taylor
-
Politics6 days ago
FIFA hypocrisy after Israel murder over 400 Palestinian footballers
-
 NewsBeat6 days ago
Emirates confirms when flights will resume amid Dubai airport chaos
-

 NewsBeat4 days ago
Is it acceptable to comment on the appearance of strangers in public? Readers discuss
-

 Tech6 days ago
Viral ad shows aged Musk, Altman, and Bezos using jobless humans to power AI
-

 Video5 days ago
How to Build Finance Dashboards With AI in Minutes
-

 Fashion5 days ago
On the Scene at the 57th Annual NAACP Image Awards: Teyana Taylor in Black Ashi Studio, Colman Domingo in Yellow Sergio Hudson, Chloe Bailey in Christian Siriano, and More!
-

 Business3 days ago
Guthrie Disappearance Enters Fifth Week as Family Visits Memorial
-
 NewsBeat5 days ago
Ukraine-Russia war latest: Belgium releases video showing forces boarding Russian shadow fleet oil tanker