

Crypto World
CLARITY Act Hit With 100+ Amendments Ahead of Senate Banking Markup


Senate Banking Committee members have reportedly filed more than 100 amendments to the CLARITY Act, with Senator Elizabeth Warren alone submitting over 40 proposals ahead of Thursday’s markup vote.
The flood of filings follows the committee’s release of a 309-page draft on Tuesday, expanded from January’s 278-page version.
Warren Files 40+ Amendments as Senate Preps Crypto Bill Markup
According to POLITICO, the list features dozens of amendments put forward by Democrats on the Banking Committee, along with a handful of revisions from the bill’s Republican sponsors.
Follow us on X to get the latest news as it happens
Crypto In America host Eleanor Terrett reported that one of Senator Warren’s amendments would block the Federal Reserve from granting master accounts to crypto companies.
Senator Jack Reed’s amendment “prohibits crypto from being used as legal tender, for example, to pay taxes.”
Committee members filed 137 amendments before the planned markup in January. The current tally signals continued resistance as the bill nears a committee vote.
Meanwhile, the American Bankers Association has sent more than 8,000 letters to Senate offices since last Friday, according to a source cited by Terrett. The campaign focuses on the stablecoin yield compromise brokered by Senators Thom Tillis and Angela Alsobrooks.
The Banking Committee will meet on Thursday morning in Washington to vote on the bill.
Subscribe to our YouTube channel to watch leaders and journalists provide expert insights
The post CLARITY Act Hit With 100+ Amendments Ahead of Senate Banking Markup appeared first on BeInCrypto.

Bitcoin (BTC) may reach $100,000 by June as Strategy’s renewed buying power and falling stablecoin dominance suggest liquidity is returning to crypto.
Key takeaways:
- Michael Saylor’s Strategy may purchase at least 3,127 BTC this week via the sales of STRC shares.
- Falling crypto market dominance of USDT and USDC stablecoins increases BTC’s odds of reaching $100,000.
Strategy resumes Bitcoin buying as STRC stock reclaims $100 par
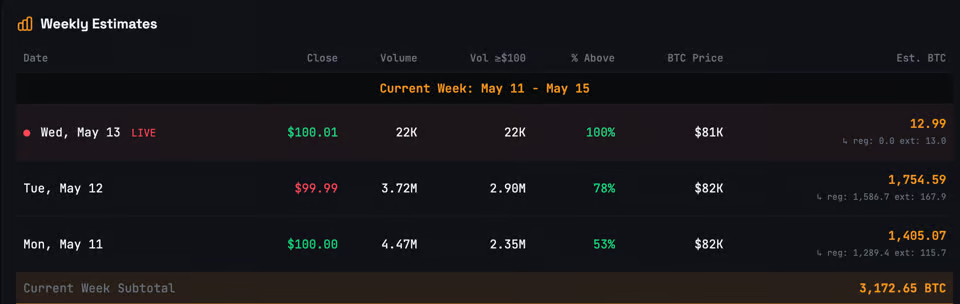
Strategy’s preferred stock, Stretch (STRC), has reclaimed its critical $100 par value, restoring one of the company’s funding mechanisms for Bitcoin purchases, data from STRC.LIVE shows.
As of Wednesday, STRC was trading around $100.01, with estimates suggesting the preferred-share program has already unlocked enough buying power for Strategy to acquire at least 3,172 BTC this week.

Strategy’s weekly BTC buying estimates via STRC stock sales. Source: STRC.LIVE
That is nearly 235% of Bitcoin’s newly mined supply over the same period.
Strategy’s Bitcoin accumulation model becomes significantly more efficient whenever STRC trades at or above par. In those conditions, the company can issue preferred shares more aggressively, raise fresh capital, and redirect proceeds into Bitcoin.
Since February, the company has added roughly 101,700 BTC, lifting its holdings to nearly 819,000 BTC as of May 11 from about 717,000 BTC in mid-February.

Source: X
Bitcoin rose more than 40% over the same stretch, underscoring how Strategy’s latest accumulation wave has coincided with BTC’s broader recovery.
“STRC raised $5.58 billion YTD since January,” market analyst Pio Vincenzo said in a Wednesday post, adding that MSTR may raise “another $20 billion by the end of the year.”
Related: Strategy CEO Phong Le says company will sell BTC only in specific cases
Falling stablecoin dominance is bullish for Bitcoin’s price
Another bullish signal is coming from the stablecoin market.
The combined dominance of Tether’s USDT and Circle’s USDC is showing signs of topping near the 10%–11% resistance zone, according to a fractal analysis shared by analyst MikybullCrypto.

Net USDT and USDC’s crypto market dominance monthly chart. Source: TradingView/MikybullCrypto
Stablecoin dominance measures how much of the crypto market is sitting in digital dollars. When it falls, it usually means capital is rotating back into Bitcoin and other crypto assets.
Past cycles show a similar pattern.
During 2022–2024, stablecoin dominance dropped nearly 70% while Bitcoin rose by around 600%. Similarly, in 2021, a 54% drop in stablecoin dominance aligned with BTC’s 525% price gains.

Net USDT and USDC’s crypto market dominance vs. BTC/USD monthly chart. Source: TradingView
On average, stablecoin dominance has fallen by 61.3%, while Bitcoin has rallied by around 560% in the same period.
“BTC therefore has a higher chance for a sustained bullish reversal on the weekly chart,” MikybullCrypto said, adding:
“Reaching $100k this quarter seems likely.”
On the flip side, Bitcoin upside continues to show signs of exhaustion near its 200-day exponential moving average (200-day EMA, the blue line) at around $82,000.

BTC/USD daily chart. Source: TradingView
Failing to break above this resistance increases the odds of sell-offs in the coming weeks, with a potential rising wedge pattern hinting at a drop under $70,000 by June.
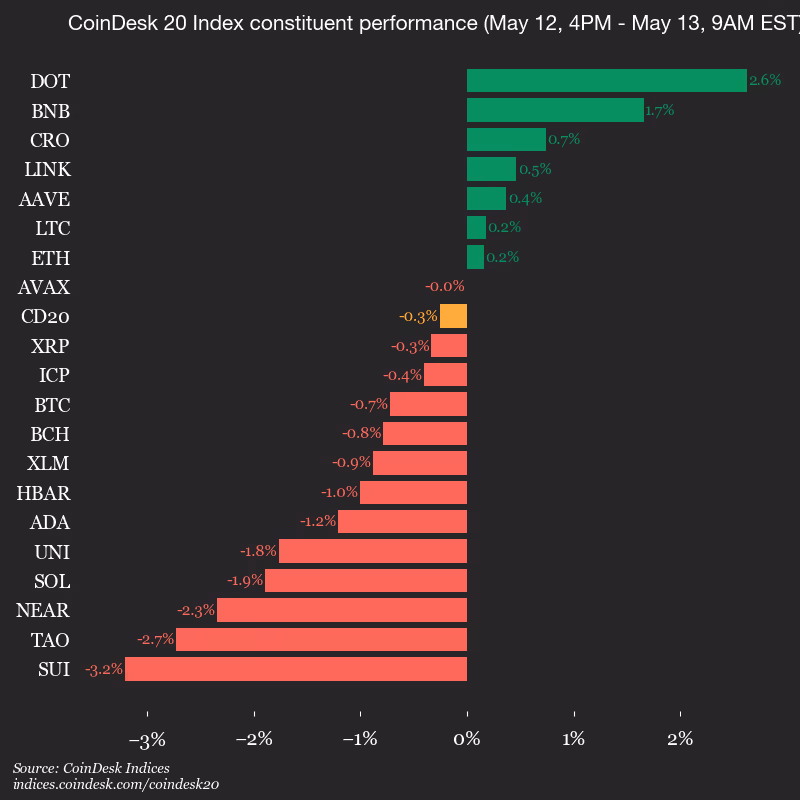
CoinDesk Indices presents its daily market update, highlighting the performance of leaders and laggards in the CoinDesk 20 Index.
The CoinDesk 20 is currently trading at 2185.22, down 0.3% (-5.55) since yesterday’s close.
Seven of 20 assets are trading higher.

Leaders: DOT (+2.6%) and BNB (+1.7%).
Laggards: SUI (-3.2%) and TAO (-2.7%).
The CoinDesk 20 is a broad-based index traded on multiple platforms in several regions globally.
Crypto World
Solana News: Coinbase Just Added Solana as Loan Collateral Alongside Bitcoin and Ethereum: Is SOL Finally Getting Its Moment?

Coinbase has added Solana as eligible collateral for its crypto-backed lending service, allowing U.S. users to borrow up to $100,000 in USDC against their SOL holdings. Bullish news for Solana.
The integration was on May 12, confirming SOL joins Bitcoin and Ethereum as accepted collateral on Coinbase’s non-custodial loan product built on the Morpho protocol over Base.
The maximum loan-to-value ratio for SOL is set at 70%. That number is the key variable; it determines how much borrowing power a holder unlocks, and it sets the distance to liquidation in a volatile asset.
Holding SOL? — Coinbase
SOL-backed loans are now available on Coinbase.
Instantly borrow up to $100K in USDC against your Solana without selling. pic.twitter.com/rfZBZ0KiH6
 (@coinbase) May 12, 2026
In practice: a holder with $10,000 in SOL can draw up to $7,000 in USDC. Collateral is locked in a smart contract on-chain.
No repayment deadline applies, but if the LTV hits the liquidation threshold, which carries a 4.38% penalty, the position is auto-liquidated, and the remaining collateral is returned.
Borrowed USDC cannot be used for trading on Coinbase directly.
Discover: The best pre-launch token sales
Solana Price Momentum Makes the integration News Timing Deliberate, Breakout to $100 Soon?
SOL is sitting at $95.69 on the 4h chart, and the price action since early May has been the most decisive upside move since the February collapse, with price breaking out of the $82 to $92 range that had been containing it for weeks and pushing toward the $98 to $100 zone that has been the ceiling since January.
The structure of higher lows from the $77 bottom in late February through March and April built a solid base, and the breakout that is now unfolding has real momentum behind it rather than looking like another fakeout.
The $94 level is now the immediate support to watch on any pullback, as it marks the breakout zone from the prior range. Holding that on a retest would confirm the move is genuine and not just a wick into resistance.
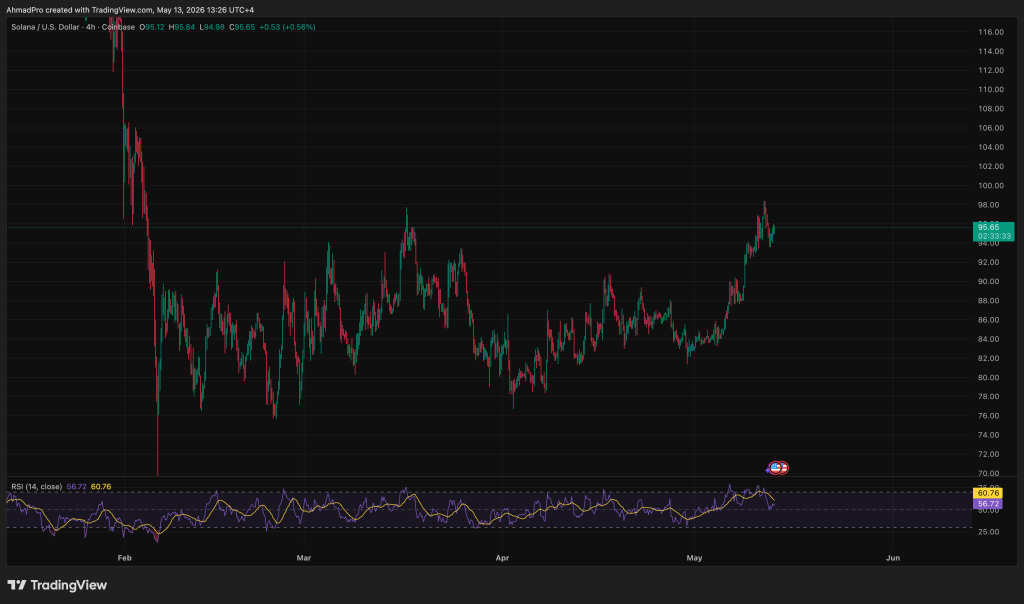
Above the current price, $98 to $100 is the next meaningful wall, and a clean break there opens the path toward $106 and $110, where heavier resistance sits from the January distribution.
What makes this move more interesting than a mere technical breakout is the Coinbase lending news behind it.
SOL being added as the third major collateral tier after Bitcoin and Ethereum, alongside $2.3 billion in cumulative crypto-backed loan originations, means holders with unrealized gains can now access liquidity without selling, which structurally reduces sell pressure while demand stays intact.
The long-term trend recovery is still incomplete with price below its 200-day moving average, but the short and medium-term setup is the most constructive it has been all year.
Discover: The best crypto to diversify your portfolio with
The post Solana News: Coinbase Just Added Solana as Loan Collateral Alongside Bitcoin and Ethereum: Is SOL Finally Getting Its Moment? appeared first on Cryptonews.


- DIU names Concordium official AI partner for 2026 IIHF event.
- Concordium launches blockchain fan ID pilot with Danish hockey.
- Partnership fee settled fully in Concordium CCD tokens.
Danmarks Ishockey Union (DIU), the governing body for ice hockey in Denmark, has named Concordium as the Official AI Partner of the Danish National Ice Hockey Team in a partnership centered on blockchain-based digital identity and artificial intelligence infrastructure.
The collaboration will officially launch during the 2026 IIHF Ice Hockey World Championship in Switzerland and will include multiple technology-focused initiatives aimed at enhancing fan engagement through AI-powered systems and on-chain identity verification.
Concordium, which describes itself as a regulatory-grade AI infrastructure platform powered by blockchain technology, said the partnership will serve as a real-world demonstration of how verified digital identities and AI agents can operate at scale in consumer-facing environments.
Verified fan program to debut at IIHF Championship
The partnership between DIU and Concordium will initially focus on two core initiatives built on Concordium’s infrastructure.
The first is a Verified Fan Programme designed to pilot a privacy-preserving fan experience using zero-knowledge proof technology.
The system is intended to allow users to verify identity-related credentials while limiting exposure of personal information.
The second initiative is an Agentic Commerce pilot, which aims to demonstrate how verified AI agents can operate autonomously while interacting with fans and digital commerce systems.
The project builds on Concordium’s previous work involving the x402 agentic payments protocol, which is focused on enabling secure and verifiable machine-driven transactions.
“Agents transacting at scale need a verified identity they can carry and settlement rails they can trust,” said Varun Kabra, Chief Growth Officer at Concordium.
“The infrastructure for that already exists. What it has lacked is legibility, a place where mainstream audiences can see it working. We are very excited to partner with the Danish Ice Hockey team to build together a solution where AI can deliver a much superior fan experience.”
DIU said the partnership was structured around long-term technology collaboration rather than traditional sponsorship branding alone.
“We approached this the way we approach every serious collaboration, starting with what we could build together, not what would go on the jersey,” said Michael Dupont, CEO of Danmarks Ishockey Union. “Concordium is a Swiss-built and regulatory-grade AI infrastructure. The programmes planned over the course of the partnership are the kind of work that fits how Danish hockey wants to be seen.”
Partnership settled entirely in CCD tokens
As part of the agreement, Concordium branding will appear on the Danish national team’s helmets and jerseys, alongside category exclusivity across digital assets during the term of the partnership.
The organizations also said the full partnership fee was settled entirely in CCD, Concordium’s native blockchain token.
According to the announcement, the agreement represents the first national-team partnership fully paid and locked in a native protocol token.
The transaction was settled on-chain at signing, while a 12-month lock-up period was enforced directly at the protocol level.
DIU will maintain full self-custody of the digital assets under the arrangement.
Global tournament exposure supports partnership visibility
The partnership launches ahead of the 2026 IIHF World Championship, where Denmark’s national team is expected to receive broad international television exposure.
Games involving the Danish team are broadcast across Sweden, Finland, Germany, Switzerland, Canada, and the United States through networks including Viaplay, ZDF, ARD, TSN, and ESPN.
According to the organizations, the 2025 IIHF World Championship generated a cumulative live television audience of 215 million viewers and 25.6 billion event impressions across 155 territories.
DIU noted that Denmark has become an established host nation for international hockey tournaments, hosting four IIHF World Championships within eight years, including the men’s tournaments in 2018 and 2025, and women’s tournaments in 2022 and 2026.
The price remains in a flat channel. When will it break away?
PI Network (PI) Price Predictions: Analysis
Key support levels: $0.16
Key resistance levels: $0.20, $0.28
PI Remains Stuck in a Channel
With momentum lacking, the PI price has been moving sideways above 17 cents in the past week. Buyers attempted to test the 20-cent resistance in late April but were rejected. Since then, the volume has been falling as well.
This consolidation could last quite a while longer, but it remains a positive development considering that the price has stopped making lower lows. This builds confidence that PI has bottomed already.
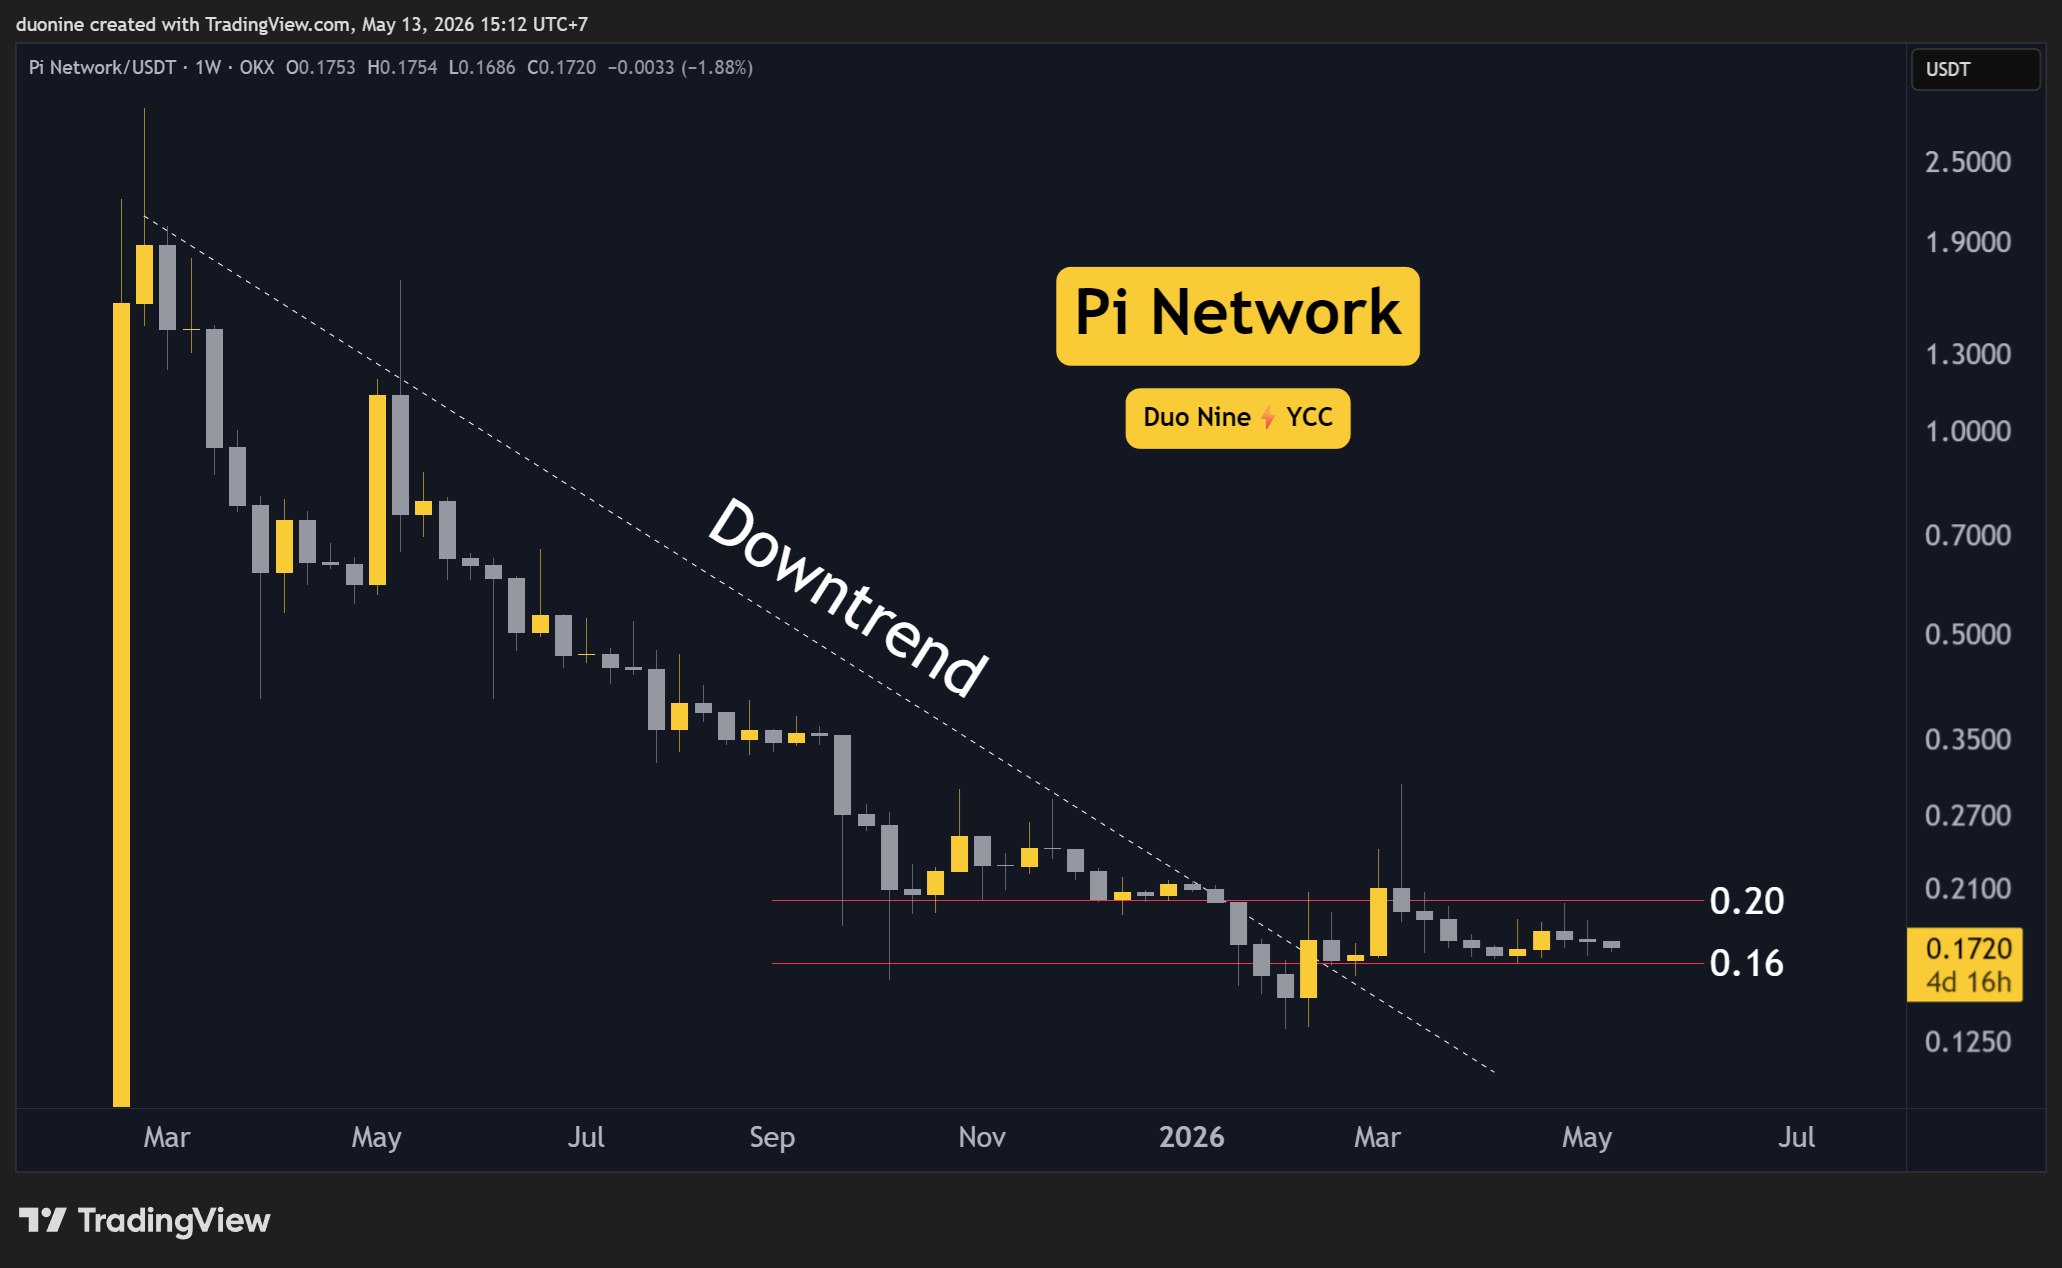
Low Momentum, but Higher Lows
At the time of this post, the price and momentum indicators don’t give any indication that they want to aim for a breakout. Nevertheless, the price has been making higher lows after the bottom at 13 cents.
This could be interpreted as bullish and would be confirmed as soon as the price moves above the 20-cent resistance. For that to happen, the buy volume will need to pick up since it has been falling in May so far.

Flat Volume Keeps the Price Stuck
Volume is the second most important indicator after the price itself. Since the start of April, the volume has remained low, even if there were small attempts at changing this. Because of that, the price was unable to move out of its current range between 16 and 20 cents.
A sign to watch for is higher highs on the volume profile. For now, this is missing, but PI is a momentum coin and could change that at any point. Until then, best to be patient here as the price grinds slowly.

The post Pi Network (PI) Price Predictions for This Week, May 13 appeared first on CryptoPotato.
Tokyo-listed Metaplanet reported first-quarter operating income Wednesday of 2.27 billion Japanese yen (roughly $14.38 million) on net sales of about $19.5 million, implying an operating margin of 73.6% as surging Bitcoin option income more than tripled revenue from a year earlier, according to the company’s Q1 fiscal year 2026 earnings release.
The strong operating performance contrasted with an ordinary loss of around $728 million, driven mainly by non-cash valuation losses as Bitcoin’s price declined during the period, and the company marked its expanding Bitcoin (BTC) holdings lower.
The price of Bitcoin fell around 24% during the quarter, from around $87,000 on Jan. 1 to roughly $66,000 on March 31, according to data from Coingecko.
Revenue for the quarter ending March 31 rose from about $5.5 million a year earlier to about $19.5 million, the filing shows, with the Bitcoin Income Generation business of option premiums and derivative valuation gains contributing the bulk of sales, while hotel operations remained a small, stable contributor.

BTC price fell 24% in Q1. Source: Coingecko
Metaplanet posted a basic loss of roughly $0.63 per share, widening from a loss of about $0.078 a year earlier, and kept its full-year 2026 outlook unchanged, still forecasting net sales of roughly $101 million and operating profit of about $72 million, while refraining from giving ordinary or net income guidance due to Bitcoin price sensitivity.
Strong operating income offset by Bitcoin valuation loss
Metaplanet ended the quarter holding 40,177 Bitcoin, up from 35,102 at the end of December 2025, after adding about 5,075 BTC in Q1 to become the third-largest publicly listed Bitcoin treasury, through a combination of new equity and Bitcoin-backed borrowing.

Consolidated Financial Results for Q1, FY2026. Source: Metaplanet
On a fully diluted basis, Bitcoin holdings per share increased from 0.0240486 BTC to 0.0247319 BTC, corresponding to a first-quarter BTC yield of 2.8%, which the company highlights as a key performance indicator for shareholder value creation, as it measures Bitcoin per-share growth after dilution.
Metaplanet’s capital structure continued to evolve over the quarter, with total net assets falling from $2.96 billion at Dec. 31 to approximately $2.60 billion, as Bitcoin-related valuation losses outweighed equity raised during the quarter.
Short-term borrowings also increased as the company drew further on its $500 million Bitcoin-collateralized credit facility, under which it had $302 million outstanding as of May 13, 2026, it said.
Metaplanet shares traded lower on Wednesday in Tokyo, at around 327 Japanese yen (roughly $2.07), down 3.82% at the time of writing from Tuesday’s close, according to data from Yahoo! Finance.
Magazine: Bitcoin will not hit $1M by 2030, says veteran trader Peter Brandt
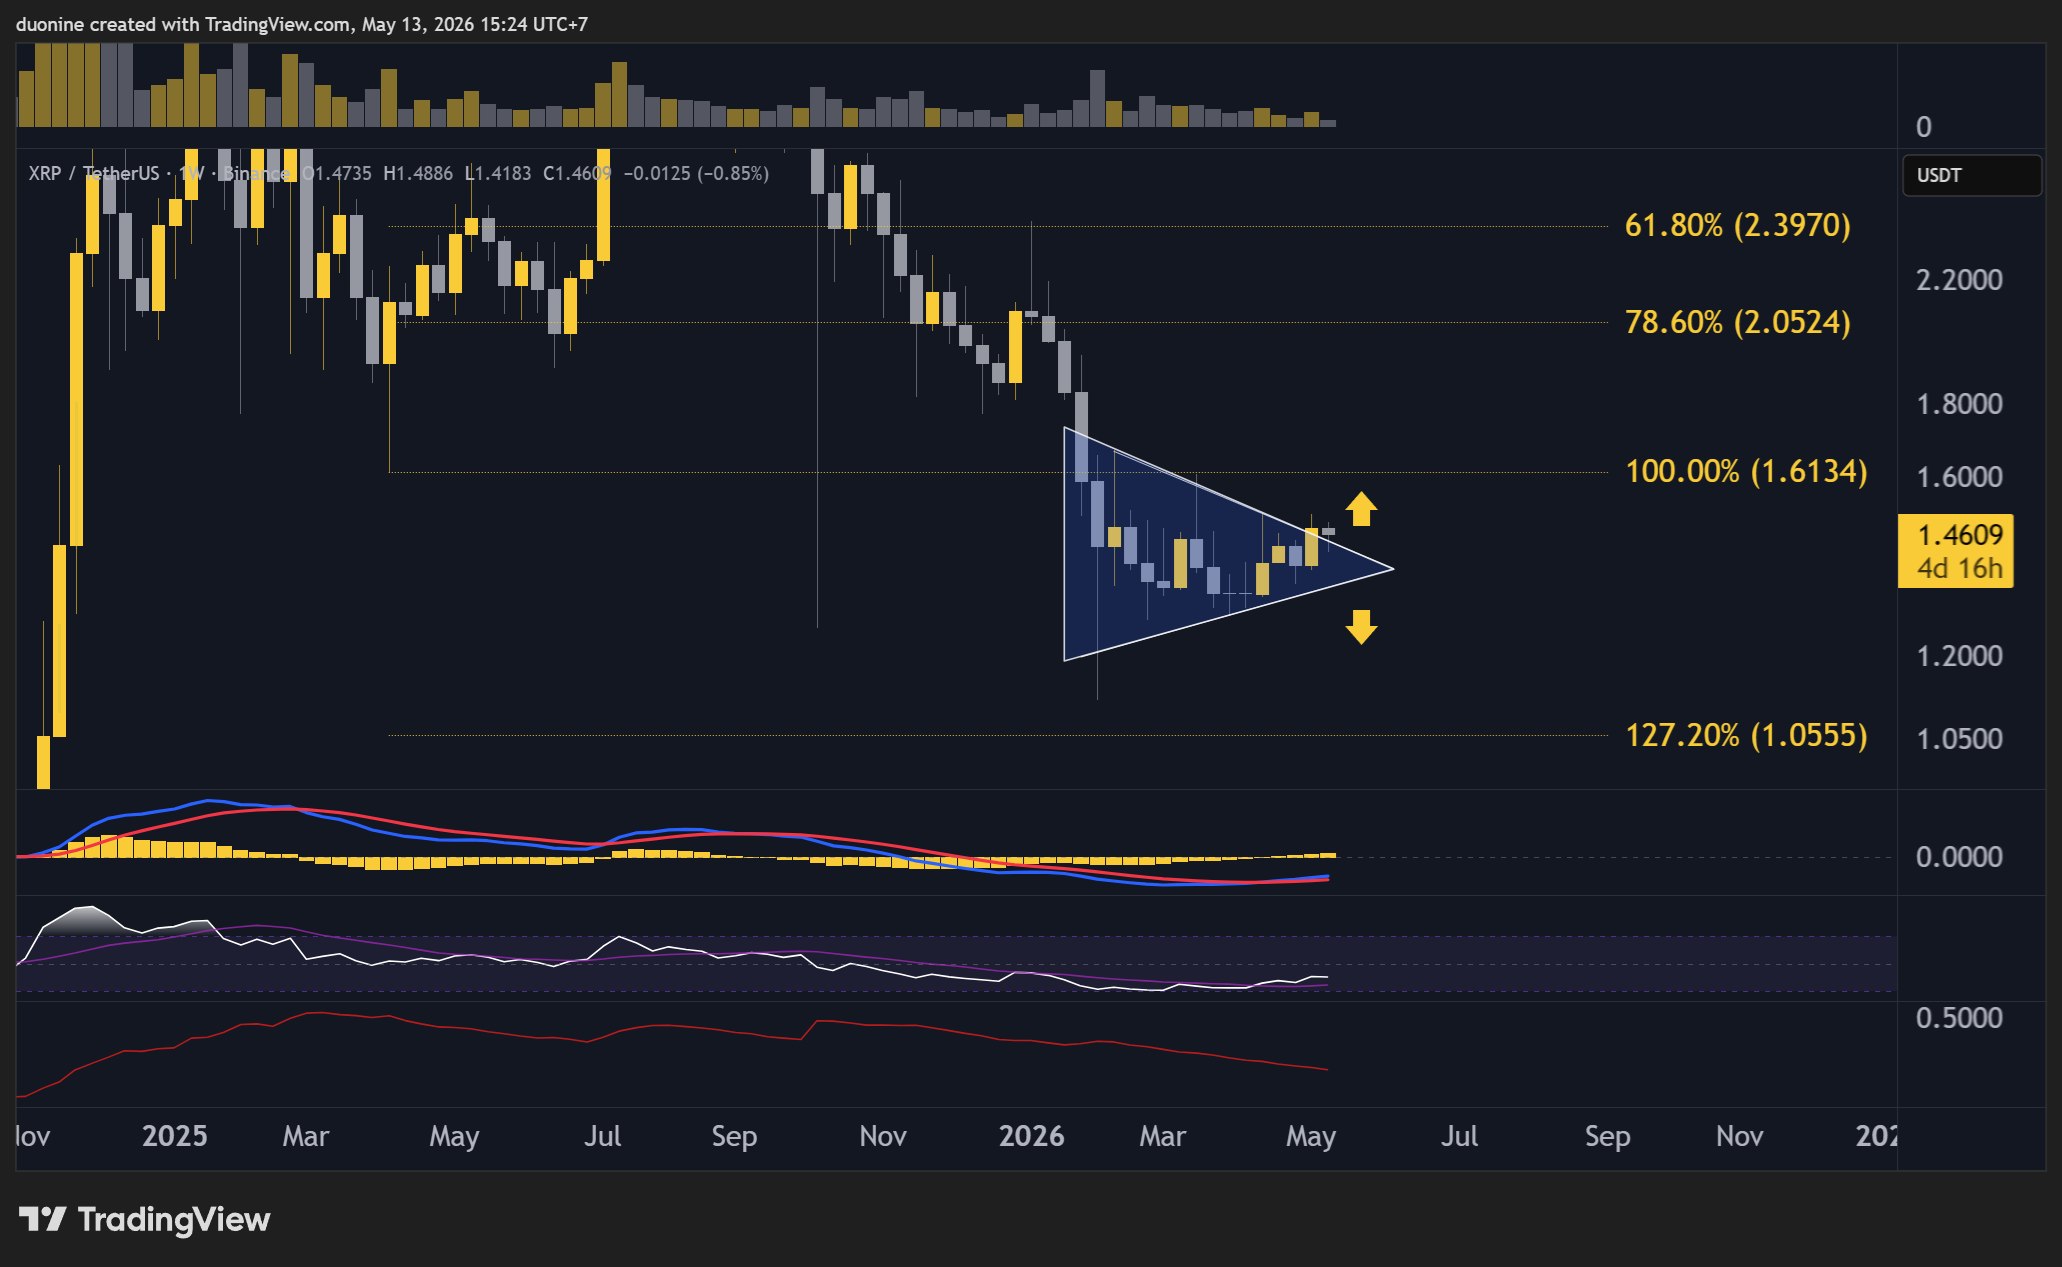
XRP is consolidating above the $1.4 support. Can it test $1.6 next?
Ripple (XRP) Price Predictions: Analysis
Key support levels: $1.4
Key resistance levels: $1.6, $2
Key Resistance About to be Tested?
After a successful defense of the $1.4 support, XRP appears ready to test the key $1.6 resistance. This comes after the price managed to break out of the blue pennant shown in the chart below.
This breakout is typically a buy signal, but bullish momentum remains shy without a significant rally so far. Nevertheless, this can change in the days and weeks to come, as buyers decide to test the key resistance.
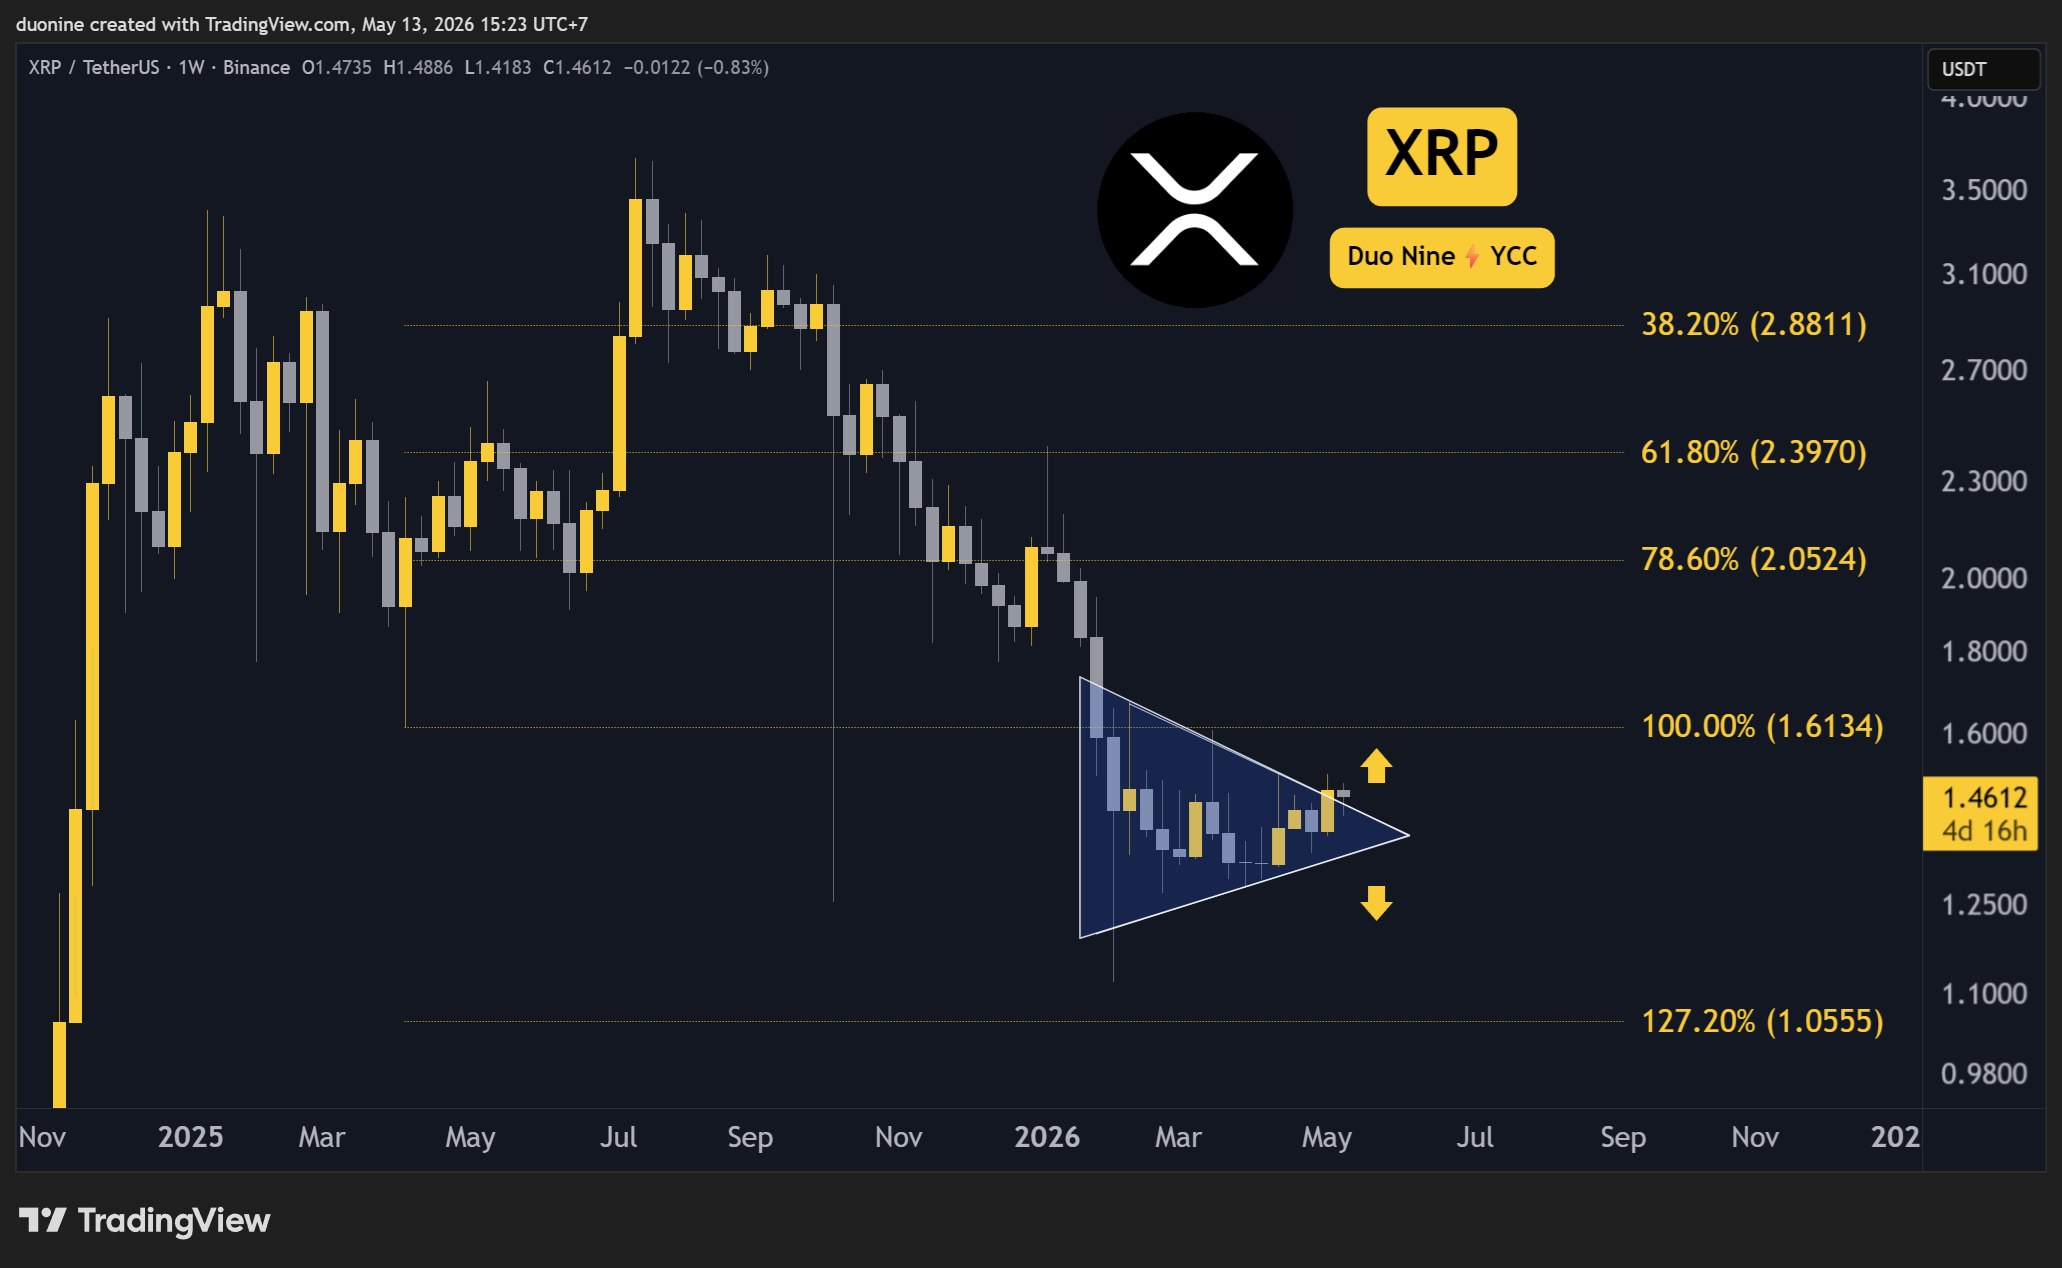
Is a Rally Imminent?
After breaking from the pennant, XRP may enter into a sustained rally. The first challenge is found at $1.6. If that resistance falls, then this cryptocurrency will have a clear path towards $2 next.
While bullish momentum remains low, it can start to build from here, and a breakout above $1.6 would reinforce and encourage buyers to rush to XRP. Right now, the momentum indicators give a bullish bias, but volume remains low. This shows conviction is still not here yet.
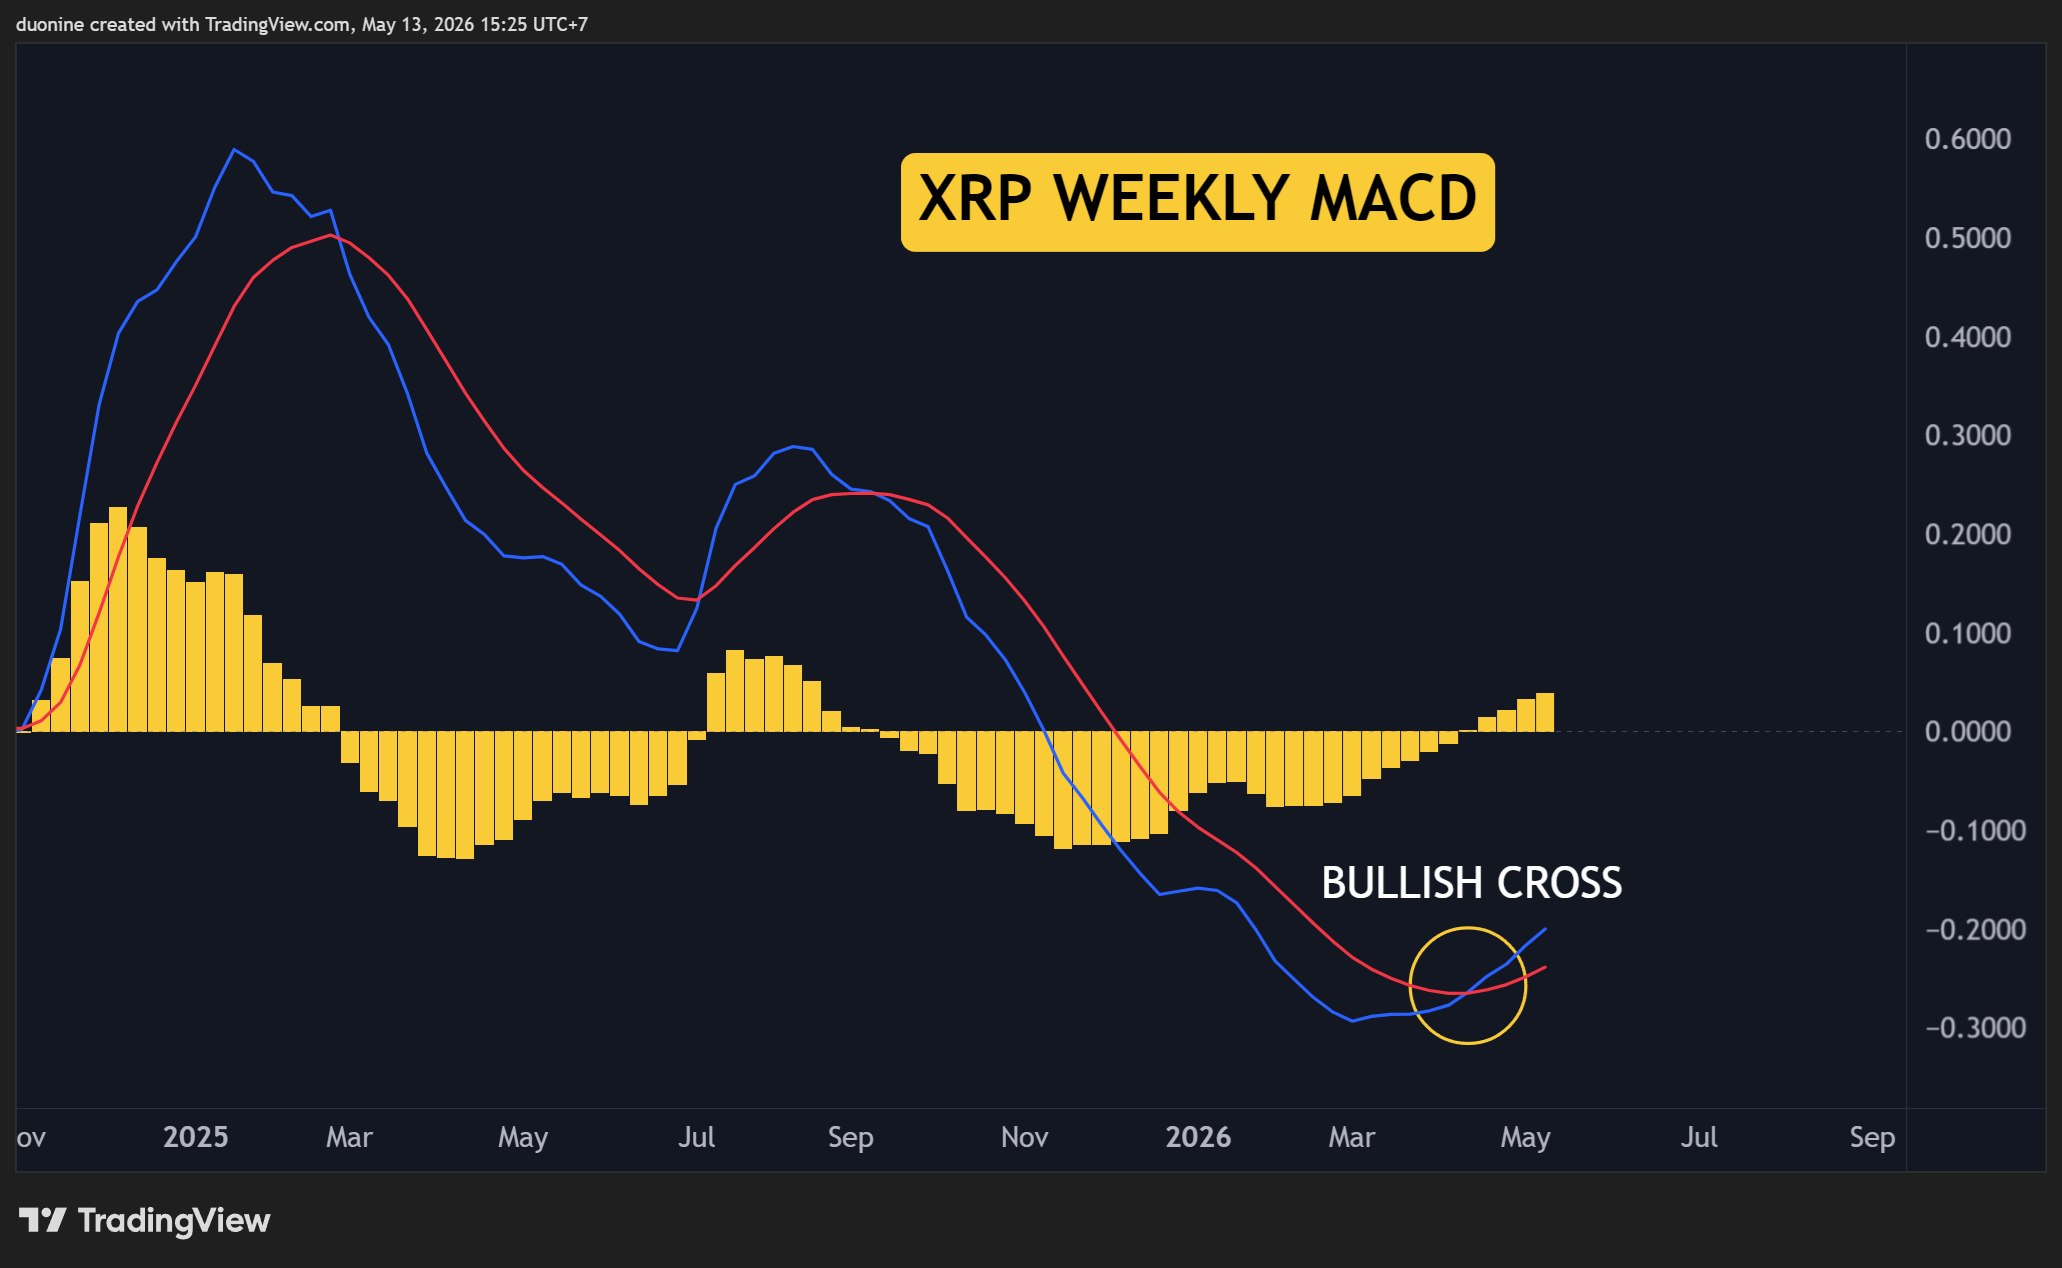
Weekly MACD Stays Bullish
With this latest breakout, the weekly MACD continued to make higher histogram highs. This is exactly what we want to see to maintain a bullish bias. As long as this continues, a higher price for XRP remains likely.
Even if buyers remain shy at this time, the price and indicators lean toward the bull side. Once the price starts to move higher, volume can catch up and allow a breakout at $1.6. That would be a necessary development for higher highs later this month.
The post Ripple (XRP) Price Predictions for This Week, May 13 appeared first on CryptoPotato.


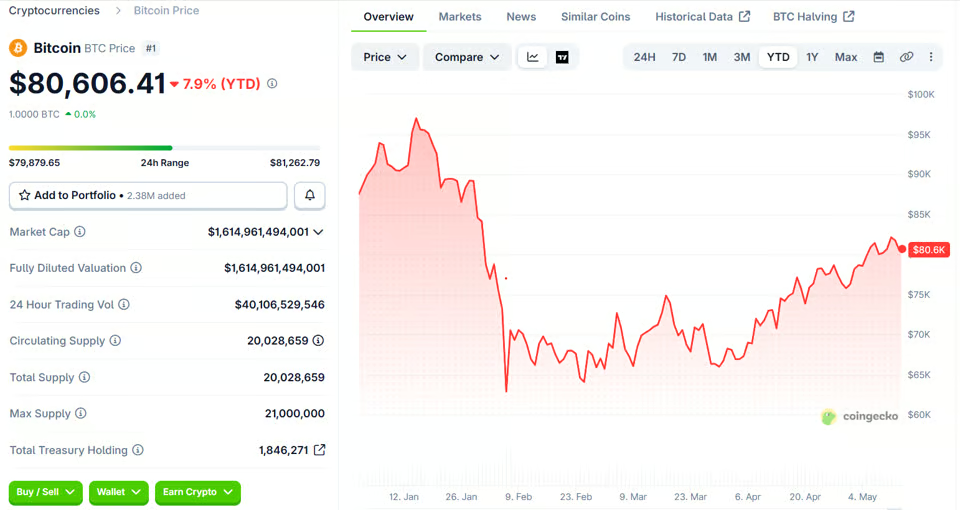
U.S. producer prices for April came in far hotter than expected on Wednesday, complicating the Federal Reserve’s path forward to ease monetary policy later this year.
The April Producer Price Index rose 1.4% month-over-month, nearly triple economists’ expectations for a 0.5% increase. Annual producer inflation accelerated to 6%, while core PPI excluding food and energy climbed 1% on the month and 5.2% year-over-year, both well above forecasts.
The report reinforced that inflation is reaccelerating after Tuesday’s consumer price index (CPI) rose 3.8% year-over-year, the hottest inflation reading in almost three years.
Bitcoin (BTC), which traded above $81,000 overnight, quickly dropped below the key $80,000 level in the minutes following the release before recovering slightly. The largest cryptocurrency was recently changing hands just above $80,000, down about 0.8% over the past 24 hours.
Equity futures held relatively steady ahead of the U.S. open, with Nasdaq 100 futures up 0.2% and S&P 500 futures little changed.
The inflation surprise adds another layer of uncertainty for the Fed as policymakers navigate rising energy prices tied to the ongoing Iran conflict and persistent concerns over supply disruptions around the Strait of Hormuz. Higher oil prices risk feeding further into inflation data in the months ahead.
The report could also revive discussion of whether the central bank may need to consider additional tightening rather than cuts, even as President Donald Trump continues to pressure the Fed to lower interest rates.
That backdrop is especially delicate as Kevin Warsh prepares to take over leadership of the central bank, with investors closely watching how the incoming chair will balance slowing growth risks against resurgent inflation pressures.
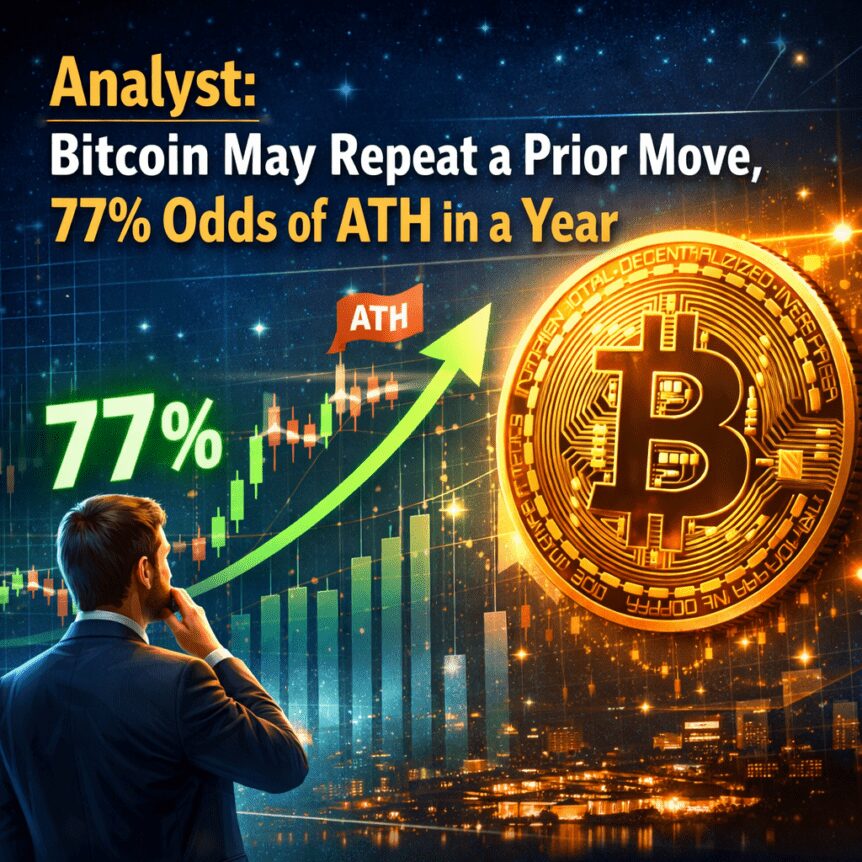
Bitcoin could be poised for another push to fresh all-time highs within a year if a familiar price pattern holds, according to research from network economist Timothy Peterson. With BTC hovering around $81,000 after rebounding from a February dip below $60,000, the setup echoes past bear-market recoveries, where BTC rebuilt strength from a -50% to -35% drawdown and then surged higher. The signal sits atop a broader valuation discussion: VanEck analyst Matthew Sigel argues that the Buffett indicator implies a path toward a $160,000 price level if market dynamics align, a scenario that would simply bring Bitcoin in line with equities’ overall asset pricing.
Key points:
- Bitcoin’s current configuration mirrors a historically favorable window: after falling from -50% to -35% from its all-time high, BTC has often advanced to new peaks within about a year, according to Timothy Peterson’s analysis.
- As of now, Bitcoin trades near $81,000, with the drawdown from its October 2025 high standing at roughly 35% after a dip below $60,000 in February.
- Past episodes show that similar recoveries culminated in new all-time highs, a pattern reinforced by on-chain analytics and historical price data.
- Valuation signals, including the Buffett indicator, have been cited by observers as suggesting a longer-term upward re-rating of Bitcoin could materialize, potentially targeting well into the six-figure range.
Pattern repeats as BTC rebounds from bear-market drawdowns
Timothy Peterson laid out a concise framework for interpreting Bitcoin’s price action when it rebounds from a large drawdown. In a post on X, he noted: “I looked at every time Bitcoin went from a -50% drawdown to a -35% drawdown (the situation we are in today).” The implication is that when BTC retraces from its deepest losses toward a shallower drawdown, historical precedent favors a resume of bullish momentum that can culminate in a new all-time high within roughly a year.
Bitcoin’s recent path has featured a sharp correction that began in earnest during the 2022 bear market, followed by a multi-quarter recovery. In February, BTC briefly dipped below the $60,000 level, deepening its drawdown against the all-time high around $126,200. Since then, the price has rebounded to around $81,000, narrowing the drawdown to about 35% versus that October 2025 peak, according to data from TradingView. The cycle aligns with Peterson’s narrative: a shift from the harsher drawdown toward a less severe trough often precedes renewed upside momentum.
Historical precedents and what they imply
To contextualize the current setup, market analytics platform Glassnode provides a longer lens on drawdowns in Bitcoin’s price history. Glassnode data illustrate that during the last major drawdown, the market didn’t stabilize at a 35% retreat from the prior all-time high until December 2023—roughly two years after the peak. That period of stabilization preceded Bitcoin’s next notable price peak in March 2024, underscoring a pattern in which extended bear-market correction can set the stage for a renewed ascent later in the cycle.
The narrative that a measured rebound often follows a deep drawdown aligns with several prior cycles. After the 2022 bear market saw an extreme drop, the subsequent period of consolidation and resilience culminated in a fresh breakout in the following year. While not a guaranteed outcome, the historical sequence—deep drawdown, slower recovery, then new highs—has appeared with sufficient frequency to merit attention from believers in a cyclical, macro-driven recovery.
Valuation signals and the Buffett indicator
Beyond pure price action, a separate line of reasoning centers on valuation. VanEck’s Matthew Sigel has argued that Bitcoin appears cheap relative to equities when viewed through the Buffett indicator—the ratio of the total US stock market to GDP. In a post on X, Sigel suggested that if Bitcoin were to regain the level implied by the 35x XBT/XAU cross embedded in that indicator, the price could potentially reach around $160,000. He framed the scenario as a re-pricing mechanism that would bring Bitcoin in line with where equities already stand on a valuation basis.
“Bitcoin looks cheap,” he told X followers. “If it regains the 35x XBT/XAU cross implied by current levels of the Buffett Indicator, we’re looking at $160k, and that’s just catching up to where equities already are.”
The Buffett indicator has long been cited as a broad gauge of whether risk assets are over- or under-priced relative to macro fundamentals. In the Bitcoin context, proponents see it as a cross-asset justification for higher prices if the market’s risk premium shifts in step with the equity complex. Critics, however, caution that the indicator is a back-tested, broad-strokes tool and should be interpreted within a wider set of catalysts, including adoption trends, on-chain activity, and regulatory developments.
What this means for investors and traders
The convergence of a pattern-based setup and valuation commentary creates a nuanced scene for market participants. On one hand, Peterson’s drawdown framework—paired with recent resilience—offers a probabilistic case for upside in the months ahead, especially if Bitcoin can sustain momentum through key liquidity and macro crossroads. On the other hand, the signal is not a guarantee. The broader macro environment remains uncertain, with geopolitical tensions, regulatory scrutiny, and shifting risk appetites continuing to shape crypto markets.
Traders may watch several factors closely. On-chain indicators that track capitalization cycles and exchange flows could reveal whether new supply is entering the market in a way that sustains a rally. Additionally, any shifts in macro policy or inflation expectations could influence the pace at which risk assets reprice, including Bitcoin. While the Buffett-indicator perspective adds an intriguing long-term valuation narrative, it should be weighed alongside price action, market sentiment, and the evolving regulatory backdrop that continues to influence institutional participation in crypto markets.
In this context, the next few months could prove pivotal. If the historical tendency of a post-drawdown rally holds, BTC might test fresh highs within the year. If, however, macro risks intensify or demand falters, the path could diverge from the prior cycles. What remains certain is that investors will be watching both the price drivers and the broader narrative around Bitcoin’s role in portfolios as a non-sovereign store of value and a networked medium of exchange in an increasingly digitized financial landscape.
As the market navigates these crosscurrents, observers will likely weigh both the momentum signals from previous cycles and the evolving macro framework that could either validate or challenge the notion of a swift transition to new all-time highs.
Keep an eye on evolving data points and market commentary in the coming weeks, including on-chain metrics, global macro guidance, and any shifts in institutional commentary on Bitcoin’s long-run role in diversified portfolios.
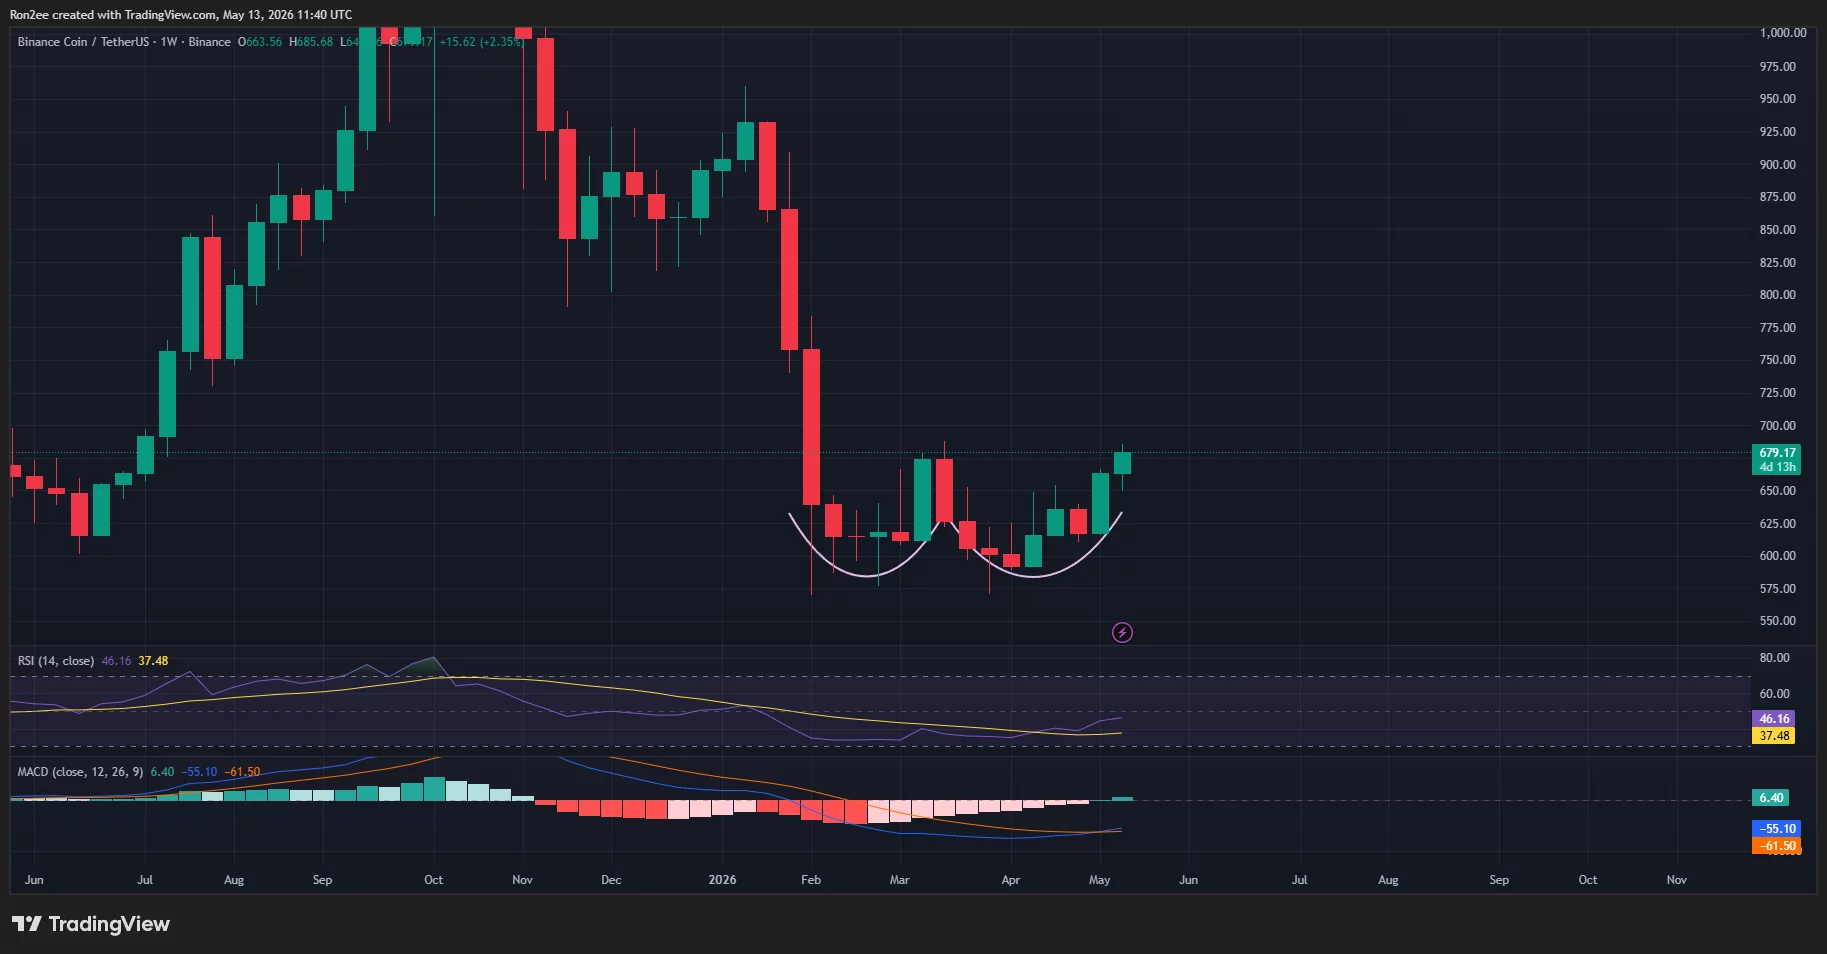
BNB price climbed higher this week as bulls attempted to confirm a breakout from a bullish double bottom pattern forming on the weekly chart.
Summary
- BNB price climbed toward the $680 neckline of a bullish double bottom pattern, with a breakout potentially opening the door for a rally toward $800.
- Market sentiment improved amid speculation surrounding spot BNB ETF applications from Grayscale and VanEck, alongside growing institutional access through Teucrium’s XBNB ETF.
- Expanding Real-World Asset integrations on BNB Chain, including BlackRock’s BUIDL and Franklin Templeton’s BENJI via Securitize, strengthened the network’s long-term utility narrative.
According to data from crypto.news, BNB (BNB) price rose over 2% over the past week to trade near $679 at press time, pushing its market capitalization above $96 billion. The token has now recovered sharply from its April lows near $580 as investor sentiment around the Binance ecosystem improved.
BNB’s latest rally appears to have been driven by a combination of institutional and ecosystem-related catalysts unique to the token. Market speculation surrounding pending spot BNB ETF applications from major asset managers such as Grayscale and VanEck has fueled optimism that the token could attract broader institutional participation if approved.
Investor sentiment also strengthened following the successful tracking performance of the recently launched Teucrium 2x Long Daily BNB ETF (XBNB), which expanded institutional wrapper access to BNB and increased exposure opportunities for traditional market participants.
At the same time, growing RWA adoption on the BNB Chain has further reinforced the network’s long-term utility narrative. Recent integrations involving BlackRock’s BUIDL and Franklin Templeton’s BENJI through Securitize have strengthened expectations that the chain could play a larger role in tokenized finance infrastructure.
On the weekly chart, BNB appears to have formed a bullish double bottom pattern over the past several months, with two major lows established around the $580 region. The neckline of the pattern sits near the $680 resistance zone, which the token is currently attempting to reclaim.

Typically, a confirmed breakout above the neckline of a double bottom pattern signals a potential trend reversal and often opens the door for a rally equal to the height of the formation. Based on the current structure, a successful breakout above $680 could position BNB for a move toward the $780–$800 region in the coming months.
A look at other technical indicators also supports the improving bullish outlook. The MACD histogram has started turning positive after weeks of fading bearish momentum, while the MACD line appears to be curling upward toward a bullish crossover. This suggests that buying momentum may gradually be returning.
Meanwhile, the RSI has also rebounded from oversold territory and currently sits near the neutral 46 level, indicating that BNB still has room for additional upside before entering overbought conditions.
The recent recovery is also notable because BNB had been under pressure in recent months amid renewed scrutiny surrounding Binance’s compliance operations in the U.S. That uncertainty contributed to weaker sentiment earlier this year, though price action now suggests sellers may be losing control near the $580 support zone.
For now, the key resistance level remains near $680, which serves as the neckline of the double bottom formation. A decisive weekly close above that area could strengthen the bullish case and increase the chances of a move past the key $700 psychological level.
On the downside, the $650 and $600 regions remain important support zones that bulls will likely need to defend to maintain the current recovery structure.
Disclosure: This article does not represent investment advice. The content and materials featured on this page are for educational purposes only.

Hegseth threatens US senator for revealing info he already shared himself

Why Young People Are Giving Up on Money
Police and firefighters remain at scene of huge derelict school fire
Manchester United reach agreement with Casemiro over contract clause amid transfer speculation

US brings back mandatory military draft registration

Steven Gerrard disagrees with Gary Neville over ‘shock’ Chelsea and Arsenal claim | Football


-
 Crypto World5 days ago
HarrisX Poll Found 52% of Registered Voters Support the CLARITY Act
-

 Fashion5 days ago
Weekend Open Thread: Marianne Dress
-

 Crypto World6 days ago
Upbit adds B3 Korean won pair as Base token gains Korea access
-
 NewsBeat6 days ago
NCP car park operator enters administration putting 340 UK sites at risk of closure
-

 Fashion2 days ago
Coffee Break: Travel Steam Iron
-

 Fashion2 days ago
What to Know Before Buying a Curling Wand or Curling Iron
-

 Tech3 days ago
Auto Enthusiast Carves Functional Two-Stroke Engine from Solid Metal
-

 Politics2 days ago
What to expect when you’re expecting a budget
-
 Business4 days ago
Ignore market noise, India’s long-term story intact, say D-Street bulls Ramesh Damani and Sunil Singhania
-

 Politics4 days ago
Politics Home Article | Starmer Enters The Danger Zone
-

 Crypto World7 days ago
BlackRock CEO Larry Fink Discusses a New Asset Class
-

 Tech2 days ago
GM Agrees To Pay $12.75 Million To Settle California Lawsuit Over Misuse Of Customers’ Driving Data
-

 Entertainment6 days ago
Sarah Paulson Called Out For Met Gala ‘Hypocrisy’
-

 Politics6 days ago
Simon Cowell Says He Was ‘Horrible’ To Susan Boyle During BGT Audition
-

 Entertainment6 days ago
General Hospital: Ric & Ava Bombshell – Ric’s Massive Secret Exposed!
-

 Crypto World6 days ago
Robinhood says Wall Street is building onchain
-

 Sports6 days ago
UEFA Champions League final schedule, teams, venue, live time and streaming | Football News
-

 Entertainment7 days ago
Bold and Beautiful Early Spoilers May 11-15: Steffy Revolted & Liam Overjoyed!
-

 Entertainment6 days ago
Why David Letterman Called CBS ‘Lying Weasels’
-

 Entertainment7 days ago
Sister Wives: Tony Flings Shade at Robyn in New Post
You must be logged in to post a comment Login