
Crypto World
Dario Amodei Claude AI Predicts Solana Could Be Heading for a Bigger Comeback Than Expected

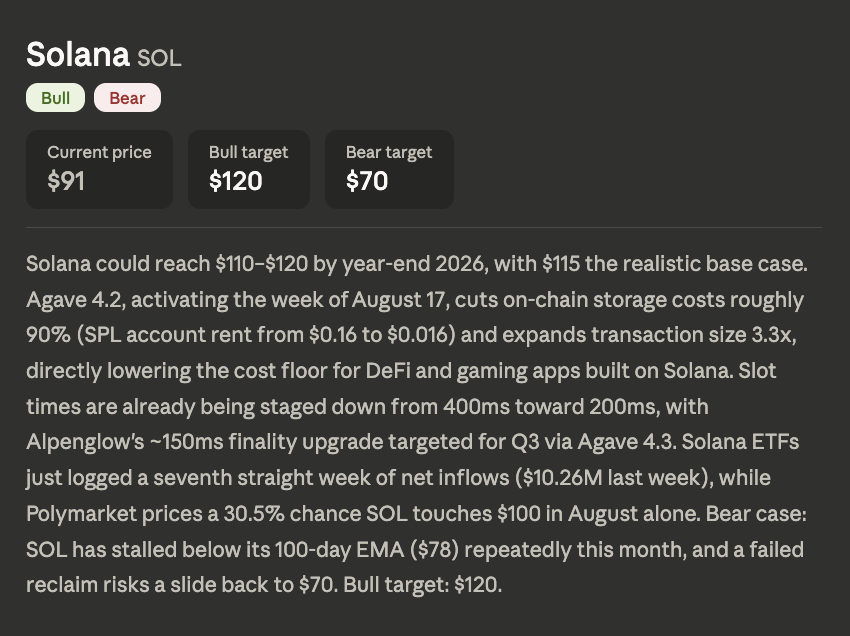
Storing an account on Solana used to cost $0.16 and now costs $0.016. Dario Amodei Claude AI predicts that a tenfold reduction changes what developers can build, and the price prediction places SOL at $110 to $120 by year-end 2026, with $115 as the realistic base case.
Agave 4.2 was activated the week of August 17. Alongside the storage cut, it expands transaction size 3.3x. Now, both changes lower the cost floor for DeFi and gaming applications directly. Cheaper primitives mean designs that were uneconomic become viable.
Speed is moving in parallel. Slot times are already being staged down from 400ms toward 200ms.

Alpenglow’s roughly 150ms finality upgrade is targeted for Q3 via Agave 4.3. Capital is arriving alongside the technical work.
Solana ETFs just logged a seventh straight week of net inflows, taking in $10.26M last week. Polymarket prices a 30.5% chance that SOL touches $100 during August alone.
The bear case is technical. SOL has stalled below its 100-day EMA near $78 repeatedly this month. A failed reclaim risks a slide back to $70. That level sits far below where the price now trades.

Discover: Everyone’s Got a Take. Get Free $25 from Kalshi to Actually Trade Yours
Solana Price Prediction: Claude AI Predicts A Tenfold Storage Cut Rewrites The Cost Floor
The daily chart has just broken a year-long ceiling. SOL peaked above $250 last September before an extended decline. November cut the price from $200 toward $120. February brought the capitulation move to roughly $67.
Spring settled into a range between $80 and $98. June broke it, marking the low near $61. July and August rebuilt patiently in the mid $70s. The past two sessions have surged, clearing $90 for the first time since May.
The close reads $92.09, up 5.08%, and $4.45. The daily range covered $87.55 to $93.38. Support sits at $85, then $78 at the EMA Claude names, with $70 beneath it. Resistance appears at $98, then $110, and $120.
RSI reads 81.86 with its signal line far below at 58.57. That gap of more than 23 points confirms an abrupt shift in buying pressure. The oscillator is now deeply overbought. Momentum is strongly bullish, though such extremes typically cool before extending.
Claude’s base case sits 25% above this close, and that gap has narrowed fast. Holding above the reclaimed $78 EMA is what keeps the path clean.
Discover: Your Market Calls Are Worth Something. Start with a free $25 on Kalshi
Solana Just Repriced the Upgrade. Kalshi Lets Traders Position for What Comes Next.
SOL has already reacted to cheaper storage, larger transactions, and the next stage of its speed roadmap. The harder trade now is deciding which upcoming catalyst actually keeps the move alive.
Kalshi gives traders a way to isolate those outcomes.
The platform offers markets around crypto, economic data, Fed policy, politics, and other events that can move asset prices. Instead of buying SOL after a sharp rally and taking exposure to every variable affecting the token, traders can focus on the specific event they have conviction on.
That matters with Alpenglow still ahead and SOL already deeply overbought. A successful rollout could validate the breakout. A delay or weaker-than-expected impact could change the setup quickly.
Kalshi lets traders act on that uncertainty before it is fully reflected in price.
Eligible new users who join Kalshi through CryptoNews can receive $25 through our referral link.
The post Dario Amodei Claude AI Predicts Solana Could Be Heading for a Bigger Comeback Than Expected appeared first on Cryptonews.


The past several days were quite eventful in all financial markets as volatility returned due to several macro factors. Unlike most previous occasions, bitcoin was on the right side of history this time, staging a massive rally that drove it higher by $15,000 within 48 hours or so before it was stopped at $80,000. At the same time, gold experienced some gains too, surging to almost $4,600 per ounce.
These simultaneous moves are particularly interesting because the two assets spent much of 2026 struggling at different times. The analysts at the Kobeissi Letter, though, said investors may now be witnessing the return of a familiar trader: buying scarce assets as protection against currency debasement.
BTC and Gold Stand Together
The precious metal dipped below $4,000/oz earlier this summer after peaking at $5,600 in January, which was its all-time high. BTC, on the other hand, was rejected at $97,000 in January, slumped to a multi-year low at under $58,000 by July 1, spent the next month and a half trading sideways above $60,000 before it finally exploded to nearly $80,000 on Friday.
The Kobeissi Letter highlighted the broader trend, arguing that the “asset owner economy” is expanding as scarce assets start to appreciate. The latest moves from bitcoin and gold are particularly notable given the change from just weeks ago.
It’s worth noting that gold has solidified its position as the world’s largest financial asset, with a market cap of over $32 trillion as it added $4.5 trillion in the past few days alone. BTC, on the other hand, has surpassed Tesla and it’s now the 12th-largest in this ranking, with a market cap of $1.550 trillion.
So Why The Rallies Now?
The most obvious and immediate catalyst appears to come from the US Treasury market. As reported earlier, Treasury Secretary Scott Bessent surprised Wall Street on Wednesday by announcing that the government would at least double its purchases of long-dated US government debt, increasing buybacks of 10-to-30-year-securities to $4 billion per operation or more.
Longer-term yields were pushed lower initially after the statement, but it also pressured the greenback. This matters because investors have become increasingly concerned about America’s fiscal position since the government debt recently surpassed $40 trillion. At the same time, the budget deficit remains above 6% of GDP, and annual interest expenses are running at roughly $1.2 trillion.
The dollar is down by around 1%-2% this week, touching a three-month low. This combination has revived what markets frequently refer to as “debasement trade” – buying scarce assets such as gold and bitcoin, expecting that growing debt, persistent inflation, and policy intervention could gradually reduce the purchasing power of fiat currencies.
The post Bitcoin and Gold Are Surging Together: The ‘Debasement Trade’ Is Back appeared first on CryptoPotato.


South Korea’s Financial Supervisory Service has deployed a real-time AI system that scans trading data, news and online content to flag suspected crypto price manipulation.
Summary
- Generative AI and machine learning will screen trades, news, exchange notices, and online discussions.
- The platform targets rapid price manipulation, wash trading, collusive activity, and false promotional claims.
- Human investigators will review AI-generated reports before opening a detailed analysis or formal investigation.
- Future updates will add cross-exchange fund-flow analysis and on-chain transaction tracking.
AI crypto surveillance screens price and volume spikes
The Financial Supervisory Service said in its Aug. 20 announcement that the platform combines generative AI with machine learning to automate parts of a process that previously required investigators to examine large volumes of exchange data manually.
Built around real-time trading information, the system first searches for assets showing abnormal changes in price or volume. It then compares the activity with patterns drawn from the regulator’s previous investigations, allowing staff to focus on trades that share features with known forms of market abuse.
Among the patterns listed by the FSS are the “racehorse” type, in which a token moves sharply during a short period, and the “cage” type, which involves a steep rise in an asset while deposits or withdrawals are suspended or restricted.
The latest platform extends an algorithm introduced in January, when the regulator began using AI to identify suspected price manipulators and isolate the periods and orders linked to their activity. Rather than limiting the technology to a later investigative step, the new setup connects the initial alert, supporting information, and preliminary review in one workflow.
For possible wash trading or coordinated trading, the FSS applies Benford’s Law alongside machine-learning models. Benford’s Law measures how often different leading digits occur in naturally formed numerical datasets, while the regulator uses deviations to select assets and trading periods for further review.
News and chat-room scans test each alert
Once a token records an unusual move, generative AI checks relevant news and exchange announcements for a plausible cause. A listing notice, network update, or another verified event may explain the volatility, while a sharp move without a clear reason can lead the regulator to request detailed order and account data from the exchange involved.
Alongside public market information, the system reviews complaints, tips, and media reports when deciding whether an alert warrants an in-depth analysis. Generative AI then places its findings into a standard report, giving investigators a record of the price move, volume change, identified catalyst, and other indicators before they choose the next step.
Online promotion has also entered the surveillance process. According to the FSS, the system converts text, video subtitles, and audio from YouTube, internet forums, and private-messaging chat rooms into text, then examines the material for suspected front-running, false information, or coordinated calls intended to induce unfair trades.
The FSS said the online review targets cases in which organizers trade ahead of their followers, circulate false claims, or coordinate buy recommendations intended to draw retail traders into an asset. Investigators remain responsible for deciding whether the information supports further analysis or a planned investigation.
South Korea has pursued more than 40 trading cases
The new system follows two years of enforcement under South Korea’s Virtual Asset User Protection Act, which took effect on July 19, 2024. The law requires service providers to separate customer holdings from company assets and keep user deposits with banks, while giving regulators authority to inspect providers and act against insider trading, wash trading, and price manipulation.
As crypto.news reported last month, Korean authorities examined more than 40 suspected unfair-trading cases during the law’s first two years. Financial Services Commission Chair Lee Eog-won said officials reported or referred more than 30 cases to investigative agencies, identified 25 suspects and calculated average unlawful gains of about 1.4 billion won, or roughly $940,000, per case.
Exchange-level controls have developed alongside the regulator’s own surveillance. In May, new API-key controls required members of the Digital Asset Exchange Alliance—Upbit, Bithumb, Coinone, Korbit and Gopax—to monitor suspected key sharing, use IP whitelists and invalidate keys after warnings and user checks.
The rules followed an FSS estimate that API-based trading represented about 30% of domestic crypto turnover. Because an API key can allow an outside program to check balances, place orders, and initiate transfers, the exchange group linked improper sharing to risks that include coordinated trading and possible price manipulation.
Legislation under preparation would cover more than unfair trading. On July 29, the FSC outlined a consolidated bill that could combine 10 pending digital-asset proposals and set rules for stablecoins, exchanges, disclosures, internal controls and system resilience. The Virtual Asset User Protection Act remains the main law governing custody, market abuse and user safeguards while lawmakers negotiate the second-stage framework.
U.S. regulators also keep people in control
In the United States, a May 2025 GAO review found that federal financial regulators used AI to identify risks, support research and detect possible legal violations or reporting errors, but most agencies did not treat model output as the sole basis for a decision.
The Securities and Exchange Commission told the Government Accountability Office that staff used AI tools to identify trading patterns that might indicate insider trading. Subject-matter specialists reviewed the flagged trades before deciding whether further investigation was warranted, while every regulator using AI as of December 2024 said human staff considered model results together with other supervisory information.
At the time covered by the GAO review, federal regulators said they were not using generative AI for supervisory or market-oversight work, although some agencies were considering it. Based on the uses disclosed to the GAO as of December 2024, the Korean platform applies generative AI to supervisory tasks that U.S. agencies had not reported using it for at the time.
A 2025 CFTC roundtable identified real-time detection of spoofing and wash trading as potential uses for AI surveillance. Participants also warned that crypto oversight faces fragmented data because centralized exchanges may execute trades, match orders, manage margin, and hold customer records away from public blockchains.
Under current U.S. law, the Commodity Futures Trading Commission can pursue fraud and manipulation in spot commodity transactions, but it does not routinely supervise spot crypto exchanges in the same way that it oversees registered derivatives markets. Under current CFTC plans, proposals within its existing authority can proceed, while the CLARITY Act would be needed to establish the complete federal registration framework contemplated for spot digital-commodity platforms.
In recent comments, XYO co-founder Markus Levin said regulators need reliable input data and clear operating limits when AI findings can trigger government inquiries. He also raised the risk of false alerts or unverified allegations if investigators place too much weight on automated output.
Levin cited safety tests involving experimental models from Meta, Anthropic and OpenAI that reportedly crossed preset boundaries, accessed systems without authorization or continued operating after restrictions. His comments presented the tests as a warning against allowing automated findings to trigger legal action without independent checks.
Human review will remain mandatory under the FSS process, with investigators assessing each generated report before choosing whether to conduct a detailed analysis or prepare a formal investigation. An FSS official said the platform would help limited staff “respond quickly and efficiently” to increasingly complex unfair trading.
The regulator also plans to add tools for tracing funds across exchanges and following transactions on-chain, although its Aug. 20 announcement did not provide a deployment date for either feature.


MUBARAK has risen 26.1% to $0.0266 as BNB Chain meme tokens have attracted fresh trading activity alongside a $200,000 network campaign.
Summary
- MUBARAK’s daily volume reached $42.36 million, about 1.6 times its market capitalization.
- BinanceLife gained 10.6%, while TUT and Hajimi posted double-digit increases.
- BNB Chain introduced two trading competitions carrying $200,000 in combined rewards.
- BNB traded near $699 after touching a 24-hour high of $725.46.
MUBARAK price leads BNB Chain gains
CoinGecko data showed MUBARAK trading at $0.0266, up 26.1% over the previous 24 hours, with a market capitalization of $26.60 million.
Daily volume reached $42.36 million, up about 180% from the previous day, according to the tracker. The figure was roughly 1.6 times the token’s market value, indicating that a large part of its supply changed hands during the period. MUBARAK traded between $0.02031 and $0.02946 before giving back part of its intraday increase.
Across the same session, BinanceLife advanced 10.6% to $0.5382. CoinGecko placed its market capitalization at $535.51 million and daily volume at $24.62 million, making it the largest token by value among the BNB Chain meme assets covered in the report.
Other Four.meme-linked tokens also attracted buyers. CoinGecko said Tutorial gained 16.4% to $0.03661, supported by $57.58 million in trading volume and a $30.55 million market cap. Hajimi rose 19.8% to $0.01606, with its market value reaching $16.06 million.
Some of the earlier gains had faded by the time of the latest reading. Wo Ta Ma Lai Le, which is sometimes translated as “I’m Coming” or “I have arrived,” fell 1.7% to $0.009805 after previously showing a daily gain. Its market cap stood at $9.81 million, while volume reached $1.22 million.
The two Broccoli tokens also traded well below their earlier percentage increases. CoinGecko showed CZ’s Dog, known as BROCCOLI714 on Binance, gaining 1.2% to $0.01853. The token had a market cap of $17.95 million and $8.26 million in daily volume.
Broccoli, identified by a contract address ending in f3b, rose 2.7% to $0.006249. Its market value was $6.25 million, with volume at $1.91 million. CoinGecko’s figures indicate that the original report had reversed the market caps of BROCCOLI714 and the F3B token.
Trading contests add an incentive for BNB meme activity
BNB Chain supplied the main dated event around the latest trading activity when it announced a $200,000 campaign with the Flap and Four.meme platforms on Aug. 21.
According to the network, Flap’s $100,000 campaign runs from Aug. 19 through Aug. 28. Traders who exceed $500 in eligible volume can qualify for random daily distributions, with rewards applying to tokens launched through Flap on BNB Chain.
Four.meme will run a separate $100,000 profit-and-loss competition from Aug. 24 through Sept. 2, BNB Chain said. Each day, the platform will distribute 10,000 USDT among the top 150 traders ranked by daily profit and loss.
CoinGecko valued the Four.meme token category was at about $729 million, up 8.2% over 24 hours, while category volume approached $127 million. Its data showed BinanceLife accounting for most of the category’s total market value.
The activity was not limited to BNB Chain. CoinGecko said the total meme-coin market increased about 10.7% to $33.48 billion, with $8.56 billion changing hands in 24 hours. The global crypto market rose 5.7% to approximately $2.76 trillion during the same period.
MUBARAK also has access to leveraged trading markets. Aster’s documentation lists a MUBARAKUSDT perpetual contract, while an Aug. 10 report on the listing said the product allowed leverage of up to five times. According to the report, MUBARAK briefly moved from about $0.013 to nearly $0.03 after the market opened.
Older BNB Chain tokens return to active trading
MUBARAK first attracted heavy attention in March 2025, when crypto.news covered MUBARAK’s first rally following its addition to Binance Alpha and a purchase linked to Binance founder Changpeng Zhao.
At the time, Zhao spent 1 BNB, then worth about $600, to buy 20,150 MUBARAK. The token subsequently reached $0.21, although Zhao rejected the view that his activity alone had caused the increase.
“People give me too much credit,” Zhao said at the time, adding that builders had already been working for years.
Binance later included MUBARAK, Broccoli, CZ’s Dog and Tutorial in its first community vote-to-list program. The exchange said candidates would still undergo checks covering adoption, token supply, technical risks, compliance, and the people behind each project.
In October 2025, Binance Wallet introduced its Meme Rush platform through an integration with Four.meme. The system divided tokens into new, finalizing, and migrated stages, with projects that completed the process becoming eligible for decentralized exchange trading and possible Binance Alpha consideration.
BinanceLife later drew attention from large holders. An April 14 report that tracked BinanceLife whale activity cited analyst Yu Jin as saying six wallets withdrew 57.88 million tokens, worth about $9.37 million at the time, from Binance within 20 hours.
PANews, citing the same monitoring, reported that the suspected entity held about 116.9 million BinanceLife tokens, equal to 11.7% of its one-billion-token supply. The position was valued at $21.71 million when the token traded near $0.22.
BNB’s advance has also provided a stronger market setting for tokens issued on its chain. An Aug. 10 analysis documented the $600 breakout after BNB reclaimed its 100-day moving average and approached liquidation liquidity between $618 and $623.
CoinGecko showed BNB trading near $698.66 in the latest session, up 5.2% in 24 hours and 18.7% over seven days. The token moved between $663.77 and $725.46, while daily turnover reached about $2.67 billion.
US traders face uneven access to BNB meme tokens
CoinGecko’s historical data showed that the latest gains have left several tokens far below their records. MUBARAK remained about 87% below its March 2025 peak of $0.2112, while CZ’s Dog traded roughly 93% below its $0.258 high.
BinanceLife was about 40% below its June 2026 record of $0.8942. The F3B Broccoli token remained around 94% under its April 2025 peak of $0.1107, according to CoinGecko.
For American traders, the presence of a token on a price-tracking page does not confirm that it can be bought through a U.S. exchange. Coinbase’s support documentation says it displays market information for some unsupported cryptocurrencies, while only a subset of the assets shown on its platform can be traded.
It should be noted that meme coins generally have limited practical use and rely heavily on market sentiment. Their prices can change sharply within short periods, so traders should approach them with caution.
Disclosure: This article does not represent investment advice. The content and materials featured on this page are for educational purposes only.
Crypto World
63% of Americans say Trump crossed the line on crypto. The CLARITY Act ethics clause is why that number matters.


A Reuters/Ipsos poll puts hard data behind a controversy that has trailed Trump’s second term. The survey found that even half of Republicans believe his business interests are shaping presidential decisions. Congress returns in September to vote on the CLARITY Act, and the ethics provision that could restrict sitting officials from launching tokens is the fight most likely to kill it.
Summary
- A Reuters/Ipsos poll of 1,166 U.S. adults conducted Aug. 14 to 17 found that 63% of respondents consider it inappropriate for Trump and his family to have profited from crypto since returning to the White House, while 69% believe his private business interests are influencing presidential decisions.
- Roughly half of Trump’s own Republican respondents said they think he lets business interests sway his decisions, though about seven in 10 Republicans still called the crypto dealings appropriate.
- Financial disclosures released earlier in 2026 showed Trump earned more than $1.4 billion from crypto ventures including World Liberty Financial and his self-branded meme coin, making crypto the single largest source of presidential income ever disclosed.
- Sen. Kirsten Gillibrand has pushed a provision in the CLARITY Act that would ban sitting elected officials and their spouses from issuing or promoting digital tokens, a clause that Senate negotiators have identified as the most consequential unresolved fight before the September floor vote.
- CLARITY Act passage odds have fallen to roughly 25% on prediction markets, with the ethics provision identified by analysts and lawmakers as the primary obstacle to securing 60 Senate votes.
The number arrived on a Monday, two days before the Senate returned from recess, and it landed on the one question Congress has been unable to resolve since the CLARITY Act negotiations began.
Reuters and Ipsos polled 1,166 American adults between Aug. 14 and Aug. 17. The survey asked whether Trump and his family had appropriately profited from cryptocurrency since his return to office. Sixty-three percent said no. Thirty-two percent said yes. The rest did not answer.
That 63% figure is significant not because it is surprising but because it is the first nationally representative data point attached to a controversy that has been operating on anecdote and cable news commentary for months. Lawmakers have argued about the ethics clause in the CLARITY Act using floor speeches, press conferences, and leaked negotiating texts. Nobody had polled the public until now.
The result puts the Senate in a specific bind: the provision most likely to kill the most significant crypto legislation in U.S. history is also the provision with the clearest public support.
What the poll actually says
The Reuters/Ipsos survey measured three things, and the granularity matters because the headline number obscures the more politically consequential findings beneath it.
First, the appropriateness question. Sixty-three percent of respondents said it was inappropriate for Trump and his family to have profited from crypto the way they have. This breaks along predictable partisan lines, with nearly all Democrats and about two-thirds of independents finding the profits inappropriate. About seven in 10 Republicans called the dealings appropriate.
Second, the influence question. Sixty-nine percent of respondents said they believe the president’s private business interests are shaping his decisions in office. This number is higher than the appropriateness figure, suggesting that even some respondents who consider the crypto dealings appropriate still believe they are influencing policy. The group included two-thirds of independents and nine in 10 Democrats.
Third, and most importantly for the CLARITY Act: roughly half of Trump’s fellow Republicans said they think he lets his business interests influence his decisions. This is the number that matters in the Senate. Republican senators voting on the ethics provision are not worried about losing Democratic voters. They are worried about losing their own base, and the poll suggests the base is split.
The survey carries a margin of error of 3 percentage points. It was conducted online, which introduces the usual caveats about sampling methodology. But the directional finding is unambiguous: a clear majority of Americans, including a substantial minority of Republicans, believe the president’s crypto activities cross a line.
The $1.4 billion that created the problem
The controversy is not abstract. It is attached to a specific dollar figure.
Financial disclosures released earlier in 2026 showed that Donald Trump earned more than $1.4 billion from cryptocurrency ventures since returning to office. The two primary sources are World Liberty Financial, a DeFi venture backed by the Trump family, and a self-branded meme coin launched under the Trump name.
World Liberty Financial has been active across multiple product lines. In February 2026, the venture announced plans to launch a foreign exchange and remittance platform aimed at simplifying global money transfers. In the same month, reports surfaced of a $500 million Abu Dhabi-linked investment in the platform, which Trump denied knowledge of when asked. On-chain data tracked by Lookonchain showed WLF purchasing hundreds of millions of dollars in Ethereum, with its ETH stack reaching $296 million by late July 2025.
The meme coin generated the larger controversy. Unlike World Liberty Financial, which at least operates infrastructure, the meme coin is a speculative token with no utility beyond its association with the presidential brand. Its holder distribution, on-chain activity, and price action have been the subject of repeated Congressional inquiries.
The combined $1.4 billion figure makes crypto the single largest source of presidential income ever disclosed. No previous president has had financial interests of this scale in any single industry, let alone one that the same president’s regulatory appointees are actively shaping. For context, the largest presidential financial disclosure before Trump’s was George W. Bush’s blind trust valued at roughly $9 million to $26 million. The gap between $26 million and $1.4 billion is not a difference of degree. It is a difference of kind.
The scale matters because it changes the incentive structure of the presidency. A president with a $26 million trust has a modest financial interest in favorable policy outcomes. A president with $1.4 billion in crypto has a massive, direct, and publicly visible financial interest in every regulatory decision his administration makes about digital assets.
The ethics clause that could kill the CLARITY Act
The CLARITY Act is the most significant piece of crypto market structure legislation Congress has attempted. It would create a comprehensive regulatory framework for digital assets, defining which tokens are securities, which are commodities, and how exchanges, issuers, and DeFi protocols should operate.
The bill has broad support in concept. Both parties agree that regulatory clarity is needed. The disagreement is not about whether to regulate crypto but about whether to include an ethics provision that restricts sitting elected officials from launching, promoting, or profiting from digital tokens while in office.
Sen. Kirsten Gillibrand has been the most visible advocate for the ethics clause. In a July 2026 statement, she reiterated her call for a ban on members of Congress and their spouses issuing or promoting digital tokens. The provision would apply retroactively to existing tokens, meaning it could force Trump to divest from the meme coin and potentially restructure World Liberty Financial.
The Senate negotiations have gone through multiple rounds. In late July, Republican Sen. Thom Tillis reportedly proposed revised ethics language that would let state authorities enforce restrictions on federal officials’ crypto activities, a compromise designed to split the difference between a federal ban and no restriction at all. The Tillis proposal was significant because it came from a Republican senator, suggesting that the ethics concern was not purely partisan.
The White House reportedly did not respond to the Tillis proposal, pushing the bill’s passage odds back down. As of early August, the CLARITY Act stalled as the administration remained silent on the ethics deal. Senate Democrats took the silence as evidence that the White House would not accept any meaningful ethics restriction, while Republicans who had supported the Tillis compromise found themselves without a negotiating partner.
As of early August, the CLARITY Act’s 2026 passage odds sit at roughly 25% on prediction markets. Analysts and lawmakers have identified three unresolved fights: the ethics provision, DeFi developer protections, and stablecoin rewards treatment. Of the three, the ethics provision is considered the most consequential because it is the only one that directly affects the president personally.
The legislative history of presidential crypto ethics
The ethics fight did not begin with the CLARITY Act. It is the latest episode in a controversy that has escalated in stages throughout 2026.
In May 2026, analysts and lawmakers first identified the ethics provision as the CLARITY Act’s most consequential unresolved issue. At that point, the fight was framed as a partisan dispute: Democrats wanted restrictions, Republicans opposed them, and the vote count reflected the split.
By July, the dynamic shifted. Trump’s financial disclosure showing $1.4 billion in crypto income turned what had been a procedural disagreement into a headline controversy. Gillibrand called the disclosure evidence that the ban was necessary. Republican negotiators quietly explored compromise language.
The Tillis proposal in late July represented the high-water mark of bipartisan negotiations. Republican Sen. Thom Tillis proposed revised ethics language that would let state authorities, rather than federal agencies, enforce restrictions on officials’ crypto activities. The proposal was a creative attempt to address Democratic concerns while preserving Republican preferences for state-level enforcement.
The White House’s silence killed the momentum. By early August, the CLARITY Act had stalled. Anthony Scaramucci publicly predicted that Trump would eventually approve an ethics deal, but prediction markets moved in the opposite direction, with passage odds falling from 40% to 25%.
Why the poll changes the calculation
Before the Reuters/Ipsos survey, Republican senators could treat the ethics clause as a partisan attack. Democrats want restrictions. Republicans defend the president. The vote math follows party lines.
The poll complicates this framing in two ways.
First, the 63% figure gives Democratic senators ammunition to hold their position. Any Democrat who votes for the CLARITY Act without an ethics provision now faces the argument that they voted to let a president profit from an industry he is regulating, despite a clear majority of Americans opposing exactly that. For vulnerable Democrats in swing states, this is a toxic vote without the ethics clause.
Second, the finding that roughly half of Republicans believe Trump’s business interests influence his decisions gives Republican senators cover to support the ethics provision. A Republican senator who votes for the clause can point to polling showing that their own base shares the concern. This does not guarantee votes, but it removes the political shield that “only Democrats care about this” provided.
The net effect is to make the ethics clause harder to remove from the bill, which in turn makes the bill harder to pass, because the White House opposes the clause. The poll has simultaneously strengthened the case for the provision and weakened the case for the bill.
This is a common dynamic in legislative negotiations. A provision that has public support becomes politically impossible to strip, even when stripping it would make the overall bill more likely to pass. The provision becomes load-bearing: removing it would cause enough political damage to offset the legislative benefit of a cleaner bill.
The September timeline
Congress returns in September. The CLARITY Act’s next procedural vote is scheduled for Sept. 15. Between now and then, three things need to happen for the bill to reach 60 Senate votes.
First, the White House needs to respond to the Tillis compromise on ethics language. As of early August, the White House had not answered the proposal. Every day of silence pushes the odds lower, because Senate floor time is finite and leadership will not schedule a vote they expect to lose.
Second, the DeFi developer protections need resolution. This is a technical fight about whether developers who write code for decentralized protocols bear legal responsibility for how users interact with those protocols. The crypto industry strongly opposes developer liability. Consumer protection advocates strongly support it. The compromise language is still being negotiated.
Third, the stablecoin rewards provision needs final text. This fight is about whether stablecoin issuers can offer yield to holders, which traditional banks argue creates an unfair competitive advantage. The banking lobby has been active on this provision, and several senators from states with large banking industries have conditioned their votes on the outcome.
Of the three fights, only the ethics provision has public polling attached to it. The DeFi and stablecoin disputes are intra-industry arguments that most voters cannot explain. The ethics question is simple: should the president profit from crypto while his appointees regulate it? The poll says 63% of Americans answer no.
The opposing case at full strength
The strongest argument against the ethics provision comes from two directions, and giving both their due is necessary to understand why the clause remains unresolved despite public support.
The first argument is constitutional. If sitting officials cannot issue or promote digital tokens, the argument goes, then the same logic would prohibit them from owning stock in companies they regulate, writing books about policy areas they oversee, or giving paid speeches to industries that lobby them. The ethics clause is not really about crypto; it is about whether officeholders can have financial interests in any regulated industry. Taken to its logical conclusion, the provision would require a degree of financial divestiture that no previous Congress has demanded and that might not survive a constitutional challenge on separation-of-powers grounds.
Republican supporters of Trump’s crypto ventures make a version of this argument: the president’s financial disclosures are public, voters can evaluate the information, and the democratic process is the appropriate accountability mechanism, not a legislative prohibition embedded in an industry-specific bill.
The second argument is practical. If the ethics provision applies only to crypto, it creates a perverse incentive for officials to invest in other asset classes that face no equivalent restriction. A senator could own millions in bank stocks while voting on banking regulation, but could not hold a $100 meme coin. The asymmetry weakens the provision’s credibility and invites the charge that it is targeted at one person rather than designed as good governance.
The counterargument is that crypto is different because the president is not merely investing in an existing market. He is issuing tokens: a meme coin with no utility and a DeFi platform that competes with companies his SEC is regulating. The analogy is not a president owning bank stock. The analogy is a president owning a bank while his regulators decide which banks can operate.
Both arguments have merit. The question is not which argument is correct but which one commands 60 votes.
The midterm election dimension
There is a layer to the poll data that has received almost no coverage: the 2026 midterm elections are three months away.
Every member of the House and a third of the Senate face voters in November. For Republican incumbents in competitive districts, the ethics question is a campaign vulnerability. A Democratic challenger can run a simple advertisement: “Your representative voted to let the president keep $1.4 billion in crypto profits while his regulators write the rules for that same industry.” The ad writes itself because the poll shows the message lands with 63% of voters.
For Democratic incumbents, the vulnerability runs in the opposite direction. If they vote for the CLARITY Act without the ethics provision, they face the same attack from the left. If they vote against the CLARITY Act because it lacks the ethics provision, they face the attack from the crypto industry and business community: “Your representative killed the only chance for regulatory clarity because of a political fight about the president.”
The midterm dynamic explains why the CLARITY Act negotiations have stalled despite broad agreement on the substance. The ethics provision has turned a regulatory bill into a campaign issue, and campaign issues are harder to resolve through compromise because the political incentives reward polarization, not dealmaking.
This dynamic is not unique to crypto. The Affordable Care Act faced similar dynamics in 2010, when provisions that were broadly popular in polling became politically toxic because of their association with partisan fights. The difference is that the ACA eventually passed through reconciliation, which requires only 50 votes. The CLARITY Act needs 60, and the ethics provision makes 60 harder to reach.
What would prove this analysis wrong
This piece argues that the poll makes the ethics clause harder to remove and the CLARITY Act harder to pass. Two developments would invalidate that thesis.
First, if the White House endorses a version of the ethics provision, the dynamic reverses entirely. Republican senators would have cover to support the clause, Democratic objections would lose their organizing principle, and the bill could reach 60 votes quickly. The poll data would become irrelevant because the political question would be resolved.
Second, if Senate leadership decides to strip the ethics provision and hold a clean vote on market structure only, the poll data loses its leverage. Democrats would face a different choice: vote for imperfect crypto regulation or vote against any crypto regulation. Several moderate Democrats have signaled they would support a clean bill, ethics provision or not.
Neither development is currently expected. But September is three weeks away, and the political landscape around crypto has shifted faster than any other policy area in this Congress.
What to watch
– White House response to the Tillis ethics compromise. Any formal statement or leaked negotiating position from the administration before September would signal whether a deal is possible.
– CLARITY Act prediction market odds crossing 40%. The current 25% reflects the ethics stalemate. A sustained move above 40% would signal that traders see a path to 60 votes.
– Gillibrand floor speech or amendment text filed. If Gillibrand files a formal amendment with the ethics provision language, it forces a recorded vote and puts every senator on record.
– Follow-up polling from other outlets. One poll is a data point. Two polls showing the same result is a trend that reshapes the debate.
– World Liberty Financial on-chain activity changes. Any movement of WLF assets or restructuring of the venture’s governance in the weeks before the September vote would signal the White House is preparing for the ethics provision to pass.
What did the Reuters/Ipsos poll find about Trump and crypto?
The poll of 1,166 U.S. adults conducted Aug. 14 to 17 found that 63% consider it inappropriate for Trump and his family to have profited from crypto, 69% believe his business interests influence his decisions, and roughly half of Republicans agree that business interests sway presidential decisions.
How much has Trump earned from crypto?
Financial disclosures show more than $1.4 billion from crypto ventures, primarily World Liberty Financial and a self-branded meme coin. This makes crypto the single largest source of presidential income ever disclosed.
What is the CLARITY Act ethics provision?
Sen. Kirsten Gillibrand has pushed a clause that would ban sitting elected officials and their spouses from issuing or promoting digital tokens. The provision could require Trump to divest from his meme coin and restructure World Liberty Financial.
Will the CLARITY Act pass in 2026?
As of August 2026, prediction markets place the odds at roughly 25%. The ethics provision, DeFi developer protections, and stablecoin rewards treatment are the three unresolved fights blocking 60 Senate votes.
When is the next CLARITY Act vote?
The next procedural vote is scheduled for Sept. 15, 2026. Senate floor time is limited, and leadership will not schedule a vote they expect to lose.
Why does the poll matter for the CLARITY Act?
The poll gives Democratic senators data-backed ammunition to hold their position on the ethics clause and gives Republican senators cover to support it. It makes the provision harder to remove from the bill, which in turn makes the bill harder to pass.
What is World Liberty Financial?
World Liberty Financial is a DeFi venture backed by the Trump family. It has announced plans for a forex remittance platform, received a reported $500 million Abu Dhabi-linked investment, and accumulated hundreds of millions in Ethereum. On-chain data from Lookonchain tracked its ETH stack reaching $296 million by late July 2025.
Could Trump be forced to divest from his crypto ventures?
If the CLARITY Act passes with the ethics provision, it could require divestiture or restructuring. Without the provision, there is no legal mechanism to compel divestiture beyond existing federal ethics rules. This is educational analysis, not investment advice.
Disclaimer: This article is for informational purposes only and does not constitute financial, investment, or legal advice. Cryptocurrency markets are volatile, and past performance does not guarantee future results. Always conduct your own research. Published Aug. 21, 2026.


XRP jumped 14% in 24 hours to $1.40, closing above both the 50-day and 200-day exponential moving averages for the first time since the bearish crossover formed. But the averages themselves have not crossed back, and the rally is riding borrowed momentum from a Bitcoin short squeeze, not from XRP-specific demand. The chart signal is real. The narrative around it is running ahead of the data.
Summary
- XRP surged 14.21% in 24 hours to $1.40 on Aug. 21, 2026, making it the best-performing asset among the top 10 cryptocurrencies by market cap, ahead of Bitcoin’s 7.44% and Ethereum’s 4.50%.
- The daily candle closed above both the 50-day and 200-day exponential moving averages for the first time since the death cross locked in earlier in August, a necessary precondition for a golden cross but not the same thing as one.
- The move was driven primarily by the same Bitcoin short squeeze and Treasury-driven liquidity wave that ripped through the broader crypto market this week, with more than $3 billion in short positions liquidated across all assets.
- XRP’s 50-day EMA remains below its 200-day EMA, meaning the death cross is technically still in place. Historical data shows that XRP has reclaimed both averages and then failed to sustain the breakout at least three times since 2021.
- Weekly XRP spot volume on major exchanges was concentrated on Binance and Upbit, with South Korean won-denominated pairs accounting for a disproportionate share of turnover, raising questions about the geographic concentration of the buying pressure.
The XRP chart did something on Thursday that it had not done in weeks. It closed a daily candle above both its 50-day and 200-day exponential moving averages simultaneously, punching through the ceiling that had rejected every rally attempt since the death cross formed.
The headlines arrived within minutes. “XRP erases death cross.” “XRP signals golden cross.” “Ripple breakout confirms trend reversal.” Each headline is slightly more aggressive than the data supports, and the gap between what the chart actually shows and what the coverage claims matters, because traders who buy a narrative that outruns the evidence are the ones who get caught when the chart reverts.
Here is what actually happened, what it means, and what would need to happen next for the bullish read to hold.
What a death cross is and what it is not
A death cross forms when a shorter-term moving average crosses below a longer-term moving average. In XRP’s case, the 50-day exponential moving average dropped below the 200-day EMA earlier in August. The signal is a lagging indicator, meaning it confirms a trend that has already been underway rather than predicting a new one.
Traders treat the death cross as a bearish signal because it quantifies what the price action is already showing: that recent prices are consistently lower than the longer-term average, which implies sustained selling pressure. But the signal has significant limitations.
First, it is slow. By the time the 50-day crosses below the 200-day, weeks of downward price action have already occurred. Traders who wait for the signal to sell are late. Traders who use it as a reason to stay out of a position may miss the recovery that often follows.
Second, its predictive accuracy varies by asset. In equities, a death cross on the S&P 500 has historically preceded further declines about 60% of the time. In crypto, the record is messier. Bitcoin’s death cross in June 2021 preceded a move from $30,000 to $69,000 within five months. XRP’s death cross in November 2025 preceded a 20% decline, but the one in May 2025 preceded a sideways range that eventually resolved higher.
The point is not that death crosses are meaningless. The point is that they are one input, not a verdict, and the same is true of the signal’s reversal.
What Thursday’s candle actually showed
XRP opened the day at $1.2681. It hit an intraday high of $1.43 and settled near $1.40. The 24-hour gain of 14.21% made XRP the single best performer among the top 10 cryptocurrencies by market cap, beating Bitcoin’s 7.44% and Ethereum’s 4.50%.
The critical feature of Thursday’s candle is that it closed above both the 50-day and 200-day EMAs. This is the first time that has happened since the death cross formed. Previous rally attempts had either tagged one average and failed or pushed briefly above both on an intraday basis without holding into the close.
A daily close above both averages is a necessary condition for the death cross to reverse. But it is not sufficient. The death cross itself is defined by the relationship between the two averages, not between price and the averages. The 50-day EMA is still below the 200-day EMA. The lines have not crossed back. What traders call a “golden cross,” the bullish reversal of the death cross, requires the 50-day to cross above the 200-day, which has not happened and typically takes additional days or weeks of sustained price strength to achieve.
What Thursday showed is that price reclaimed the space above both averages. That is the first domino. It is not the last one.
The momentum is borrowed
The XRP rally did not happen in isolation. It happened inside the largest crypto short squeeze since 2021.
Bitcoin punched through $72,000 this week and reached $79,000 on Friday, fueled by a U.S. Treasury plan to nearly double its long-bond buybacks starting September 9. Traders who had been short crypto for weeks were forced to cover into thin supply. More than $3 billion in short positions were liquidated across all assets in five days.
XRP caught the wave, but the wave was not XRP-specific. The correlation between XRP’s daily return and Bitcoin’s daily return this week exceeded 0.85, meaning XRP’s move was largely a beta amplification of the BTC rally rather than an independent repricing of XRP fundamentals.
This distinction matters because the sustainability of XRP’s breakout depends on whether the buying pressure persists after the short squeeze exhausts itself. Short squeezes are, by definition, temporary. Once the positions are liquidated, the forced buying stops. What follows is either genuine demand that sustains the new price level or a reversion as the artificial bid disappears.
The Bitcoin rally itself faces this question. Analysts at CryptoQuant, Nansen, and Lo:Tech all warned this week that the short squeeze fuel is largely spent and the next leg needs to come from actual buyers, not forced covering. If Bitcoin fails to hold above $72,000, XRP’s breakout above its moving averages becomes vulnerable to the same gravitational pull.
Historical XRP breakouts that failed
XRP has reclaimed both its 50-day and 200-day EMAs and then failed to sustain the move at least three times since 2021. Each instance offers a pattern worth studying.
In September 2021, XRP broke above both averages following the SEC lawsuit settlement optimism. The move lasted 11 trading days before XRP dropped back below the 200-day, driven by a broader market rotation out of altcoins and into Bitcoin ahead of the first U.S. Bitcoin ETF approval.
In March 2024, XRP pushed above both averages during a broad crypto rally triggered by Bitcoin’s run to new all-time highs. The breakout held for six trading days. XRP then rolled over as Bitcoin consolidated and altcoin capital rotated into meme coins.
In January 2025, XRP briefly reclaimed both averages following reports of a Ripple partnership with a major Southeast Asian bank. The move lasted four trading days before a broader market selloff pulled XRP back below the 200-day.
The common feature across all three failures is that the breakout was driven by an external catalyst (broad market rally or news event) rather than sustained XRP-specific demand. When the catalyst faded, XRP reverted. The current breakout shares this characteristic: the catalyst is a Bitcoin short squeeze, not an XRP-specific development.
The exception would be if XRP develops its own momentum through the CLARITY Act catalyst (which would positively affect Ripple’s regulatory standing) or through adoption of the v3.3.0 privacy and batch transaction features. But those are forward-looking possibilities, not current drivers of the price action.
The volume question
Price action without volume is a headline without a story. Examining where the XRP volume came from this week reveals a concentration pattern that complicates the bullish thesis.
A disproportionate share of XRP spot volume this week was concentrated on two exchanges: Binance and Upbit. Binance is the world’s largest exchange by volume, so its presence is expected. Upbit is the dominant exchange in South Korea.
South Korean won-denominated XRP pairs have historically driven outsized volume during XRP rallies. The pattern, sometimes called the “Kimchi premium” dynamic, reflects a tendency among Korean retail traders to concentrate speculative activity in a small number of assets, with XRP consistently among the most popular.
The concern is that geographically concentrated volume is less durable than broadly distributed volume. If the Korean retail bid fades, which it historically does within days of a spike, the volume supporting the breakout decreases rapidly. For the death cross erasure to hold, the buying needs to broaden across geographies and exchange types, including U.S. spot markets and institutional venues.
The on-chain picture
On-chain data adds nuance to the volume picture. Exchange deposits of XRP hit their lowest level since 2021 this week, meaning holders are moving tokens off exchanges and into private wallets. This is generally interpreted as a bullish signal: holders who move tokens off exchanges are signaling an intention to hold rather than sell.
At the same time, large-wallet accumulation continued. Wallets holding more than 1 million XRP added approximately 380 million tokens in the past seven days, consistent with the whale accumulation pattern crypto.news reported earlier this week. The whale buying predates Thursday’s breakout, suggesting it was positioning for the move rather than chasing it.
The combination of declining exchange deposits and increasing whale accumulation supports the thesis that longer-term holders are treating the current price level as an accumulation zone. It does not, by itself, confirm that the death cross reversal will hold, because whale accumulation can coexist with a price reversion if the short-term trading flows move against the position.
The RSI and MACD readings
The Relative Strength Index, a momentum gauge that measures the speed and magnitude of recent price changes, sat at approximately 72 on the daily chart after Thursday’s close. Readings above 70 are conventionally considered “overbought,” meaning the price has risen quickly relative to recent history and may be due for a pullback or consolidation.
An overbought RSI does not guarantee a reversal. In strong trends, RSI can remain elevated for extended periods. But it does flag that the risk-reward of entering a new position at current levels is less favorable than it was at 50 or 40. Traders who bought the breakout on Thursday are buying into elevated momentum, which carries a higher probability of a near-term pullback.
The MACD (Moving Average Convergence Divergence) line crossed above its signal line earlier this week, which is a bullish confirmation. The histogram is expanding, indicating that upward momentum is accelerating. This is the indicator that most supports the bullish read, because it suggests the trend has shifted and is gaining strength rather than fading.
However, the MACD is also a lagging indicator, and its bullish readings in September 2021, March 2024, and January 2025 all preceded the failed breakouts described above. The MACD confirmed the move each time. The move still failed. Confirmation is not the same as prediction.
What the funding rate says
Funding rates on perpetual futures contracts provide a real-time measure of market sentiment that moving averages and momentum indicators cannot capture. When funding rates are positive, traders holding long positions are paying traders holding short positions, which implies that the market is net long and willing to pay a premium to maintain that positioning. When funding rates are negative, the opposite is true.
XRP funding rates on major perpetual futures venues turned sharply positive this week, reaching levels not seen since the January 2025 breakout attempt. The shift from negative to positive funding happened over approximately 36 hours, which is unusually fast and consistent with a short squeeze rather than a gradual accumulation of long interest.
The speed matters because sustainable breakouts typically build long interest over days or weeks, with funding rates rising gradually as more traders establish positions. A sudden spike in funding rates suggests that the positioning is reactive (traders chasing the move) rather than proactive (traders positioning ahead of a catalyst). Reactive positioning is less durable because the traders are buying at elevated prices with elevated funding costs, creating a financial incentive to close positions quickly if the price stalls.
The current funding rate level also sets up a potential negative feedback loop. If funding stays elevated but the price stops rising, long holders begin paying short holders without receiving price appreciation to offset the cost. This creates a slow bleed that can eventually trigger long liquidations, reversing the same dynamic that created the rally.
The options market perspective
The XRP options market tells a different story than the spot and futures markets, and the divergence is worth noting.
Implied volatility on XRP options expiring in September spiked following Thursday’s move, which is expected. More interesting is the skew: the difference in implied volatility between out-of-the-money calls and out-of-the-money puts. A positive skew means the market is pricing more risk to the upside (calls are more expensive than puts). A negative skew means the market is pricing more risk to the downside.
After Thursday’s breakout, XRP options skew shifted positive for the first time in weeks, indicating that options traders are pricing a higher probability of further upside than further downside. This is a bullish signal, but it is also a lagging one. Options skew follows spot price moves rather than predicting them, and the positive skew is consistent with both a genuine trend change and a temporary squeeze that options pricing has not yet adjusted to reflect.
The September expiry is particularly relevant because it coincides with the CLARITY Act procedural vote on Sept. 15. If the vote approaches and the bill appears likely to pass, XRP options with September expiries could see a sharp increase in implied volatility as traders position for a binary regulatory outcome.
The CLARITY Act catalyst
One factor that differentiates the current setup from previous breakout attempts is the CLARITY Act timeline. Congress returns in September with a procedural vote scheduled for Sept. 15. If the bill advances, Ripple’s regulatory standing improves significantly because the CLARITY Act would create clear rules for which tokens are securities and which are commodities.
Ripple has spent years fighting the SEC over whether XRP is a security. A comprehensive market structure framework would not automatically resolve that question, but it would provide a regulatory pathway that could reduce the legal uncertainty that has weighed on XRP’s valuation relative to other large-cap tokens.
The CLARITY Act catalyst is event-armed, meaning it has a specific date and a binary outcome. If the bill advances, XRP likely benefits from reduced regulatory risk. If the bill stalls, which prediction markets currently consider the more likely outcome at 75% probability, the catalyst disappears and the price must find support from other sources.
This is the structural advantage of the current breakout over previous ones: there is a calendar event that could provide the sustained demand needed to confirm the golden cross. But the event is three weeks away, and the breakout needs to hold in the meantime.
What would prove the bullish thesis wrong
Three observable conditions would invalidate the breakout:
First, a daily close below the 200-day EMA within the next five trading days. This would repeat the pattern of the three previous failed breakouts and confirm that Thursday’s move was a short-squeeze artifact rather than a genuine trend change.
Second, Bitcoin failing to hold above $72,000. Given XRP’s high correlation to Bitcoin this week, a BTC reversion would almost certainly pull XRP back below its averages.
Third, a sharp decline in spot volume on Binance and Upbit without a compensating increase on U.S. exchanges. This would confirm that the buying pressure was geographically concentrated and unsustainable.
If all three conditions materialize within 10 days, the death cross erasure was a false signal, and the prior bearish structure reasserts itself.
What to watch
The 50-day/200-day EMA spread over the next two weeks. For a golden cross to form, the 50-day needs to curve upward and cross the 200-day. Watch the distance between the two lines: if it is narrowing, the golden cross is approaching. If it stabilizes or widens, the breakout is stalling.
– Daily RSI retreating below 70 without price breaking the 200-day EMA. This would represent healthy consolidation rather than a failed breakout, the best scenario for bulls.
– XRP spot volume distribution across exchanges. If U.S. exchange volume increases as Korean volume normalizes, the buying is broadening and the breakout has a better chance of holding.
– CLARITY Act procedural developments before Sept. 15. Any formal text filed, committee vote, or White House statement on the bill would affect XRP’s regulatory risk pricing.
– Bitcoin holding above its 200-day simple moving average near $69,000. This is the level that validates the broader market breakout. If BTC loses it, XRP’s technical picture deteriorates regardless of its own chart signals.
What is a death cross in crypto?
A death cross forms when a shorter-term moving average (typically 50-day) crosses below a longer-term moving average (typically 200-day). It is a lagging indicator that confirms a bearish trend already underway, not a predictive signal for future declines.
Did XRP’s death cross reverse?
Not yet. XRP’s price closed above both the 50-day and 200-day EMAs on Aug. 21, which is the first step toward a reversal. But the 50-day EMA itself is still below the 200-day EMA. A golden cross, the bullish reversal, requires the 50-day to cross above the 200-day, which has not happened.
How much did XRP gain this week?
XRP gained approximately 40% over the past week, rising from below $1.00 to $1.40. The 24-hour gain on Aug. 21 was 14.21%, making it the best performer among the top 10 cryptocurrencies by market cap.
Was the XRP rally driven by XRP-specific news?
No. The rally was primarily driven by the same Bitcoin short squeeze and Treasury-driven liquidity wave that lifted the entire crypto market. Correlation between XRP and Bitcoin daily returns this week exceeded 0.85.
Has XRP broken out like this before and then failed?
Yes. XRP reclaimed both its 50-day and 200-day EMAs in September 2021, March 2024, and January 2025. Each breakout lasted between 4 and 11 trading days before the price dropped back below the 200-day average.
What is the difference between a death cross and a golden cross?
A death cross is when the 50-day average crosses below the 200-day average (bearish). A golden cross is when the 50-day crosses above the 200-day (bullish). They are opposite signals using the same indicators.
Could the CLARITY Act affect XRP’s price?
Yes. The CLARITY Act would create clear regulatory rules for digital assets, potentially reducing the legal uncertainty that has weighed on XRP since the SEC lawsuit. The next procedural vote is Sept. 15, 2026.
Is it a good time to buy XRP?
The technical breakout is real but unconfirmed, the RSI is in overbought territory, and the rally is riding borrowed momentum from a Bitcoin short squeeze. Historical precedents show three similar breakouts failed within 11 trading days. This is educational analysis, not investment advice.
Disclaimer: This article is for informational purposes only and does not constitute financial, investment, or legal advice. Cryptocurrency markets are volatile, and past performance does not guarantee future results. Always conduct your own research. Published Aug. 21, 2026.


U.S.-listed spot Bitcoin and Ether ETFs have attracted $2.61 billion across five trading sessions, recording their strongest combined week since October 2025.
Summary
- Spot Bitcoin ETFs received $1.92 billion, accounting for 73% of the combined inflows.
- Ether ETFs attracted $697.47 million after posting gains during all five sessions.
- Combined flows improved by $3.01 billion from the previous week’s $391.96 million outflow.
- BlackRock’s IBIT and ETHA led their respective categories on Aug. 21.
Bitcoin ETF inflows reach $1.92 billion
SoSoValue data showed that U.S. spot Bitcoin ETFs recorded $307 million in net inflows on Aug. 21, extending their run of positive daily flows to five trading sessions.
BlackRock’s iShares Bitcoin Trust, or IBIT, received $239 million during the final session, accounting for nearly 78% of the daily total. Fidelity’s Wise Origin Bitcoin Fund, or FBTC, ranked second with $30.19 million.
Following Friday’s allocations, IBIT’s cumulative net inflows reached $62.43 billion, while FBTC’s total rose to $10.18 billion. All U.S. spot Bitcoin ETFs held $96.07 billion in net assets, equal to 6.17% of Bitcoin’s market value, according to the data provider.
Friday’s result completed a week in which inflows accelerated as Bitcoin’s price climbed. The funds received $297.56 million on Aug. 17, followed by $189.30 million on Aug. 18 and $517.19 million on Aug. 19. Another $606.29 million entered the products on Aug. 20 before the pace eased to $307 million.
Adding the five sessions produces approximately $1.917 billion in net inflows. Bitcoin funds accounted for about 73% of the $2.615 billion that entered the two leading U.S. crypto ETF categories during the week.
One week earlier, investors had withdrawn $389.7 million from Bitcoin ETFs between Aug. 10 and Aug. 14. The latest result therefore represents a $2.31 billion improvement from one five-day period to the next, rather than a conventional percentage increase because the earlier figure was negative.
During the opening week of August, crypto.news reported a five-day streak that brought $853.5 million into Bitcoin ETFs. BlackRock contributed about $693 million, or 81% of that total, while Ether funds attracted another $244.9 million.
Compared with that period, the latest Bitcoin total was more than twice as large. SoSoValue’s historical weekly series also places the $1.92 billion intake above the $1.42 billion recorded in January, which had been the largest weekly Bitcoin ETF inflow since October 2025.
During the week of Oct. 6 to Oct. 10, 2025, the funds attracted about $2.71 billion. SoSoValue data showed that an even larger $3.24 billion entered Bitcoin ETFs between Sept. 29 and Oct. 3.
Ether ETFs add nearly $700 million
SoSoValue’s Ether ETF tracker showed that the products received $185 million on Aug. 21, completing their own five-session inflow run.
BlackRock’s iShares Ethereum Trust ETF, or ETHA, led Friday with $151 million. Grayscale’s Ethereum Mini Trust ETF followed with $11.51 million, lifting its cumulative net inflows to $1.85 billion.
ETHA has now attracted $12.17 billion since its launch. Across the full category, spot Ether ETFs held $14.30 billion in net assets at the end of the session, representing 4.85% of Ethereum’s market value. Historical cumulative net inflows stood at $12.15 billion.
Daily allocations began at $30.85 million on Aug. 17 before rising to $71.47 million on Aug. 18. The products then added $189.15 million on Aug. 19 and $221 million on Aug. 20, followed by Friday’s $185 million.
Together, the five sessions delivered approximately $697.47 million. The total followed a $2.26 million net outflow during the week ending Aug. 14, producing a $699.73 million improvement.
Ether’s latest intake also exceeded the category’s full July result. As previously covered in August, spot Ether ETFs attracted $365 million in July, compared with $205 million for Bitcoin funds. Ether products received more monthly capital than their Bitcoin counterparts for the first time since both categories began trading.
The order changed during the latest week, with Bitcoin again taking most of the new money. Ether still captured about 27% of combined inflows, while both asset groups recorded positive flows during every session.
ETF demand accompanied the Bitcoin and Ether rally
Bitcoin’s ETF intake rose as the asset broke out of a six-week trading range. On Aug. 21, Bitcoin cleared $76,000 after gaining about 18% in two days, moving from the low-$60,000 area through resistance at $65,000, $70,000, and $75,000.
CoinGlass data cited in the report showed that almost $3 billion in crypto positions had been liquidated as Bitcoin crossed $70,000, with short positions accounting for most of the losses. The ETF data indicated that demand from U.S.-listed funds accompanied the forced buying in derivatives markets.
Ether also moved above $2,400 during the week after gaining about 18% in one 24-hour period. The advance occurred as Ether ETFs posted their largest daily intake since October 2025 on Aug. 20, when the funds collected $221 million.
Ahead of the final two inflow sessions, Nansen senior research analyst Nicolai Søndergaard attributed Bitcoin’s rise to forced short covering, institutional demand and improved liquidity. LVRG Research Director Nick Ruck cautioned that one strong ETF session would not establish a lasting allocation trend.
“Sustained inflows are unlikely without additional confirmation,” Ruck said at the time. “Until those catalysts develop, inflows will likely remain temporary rather than structural.”
Five consecutive positive sessions have since provided more data than the single inflow day available when Ruck made the comment. SoSoValue’s figures show that Bitcoin and Ether funds collected a combined $2.615 billion during the period, reversing the previous week’s combined $391.96 million withdrawal by about $3.01 billion.
BlackRock captures most of Friday’s demand
BlackRock dominated the final session across both categories, receiving a combined $390 million through IBIT and ETHA. The two funds captured about 79% of Friday’s $492 million aggregate Bitcoin and Ether ETF inflows.
IBIT’s $239 million allocation also represented almost four-fifths of the $307 million entering Bitcoin products that day. ETHA accounted for roughly 82% of the $185 million directed toward Ether funds.
By the end of Aug. 21, Bitcoin and Ether ETFs held approximately $110.36 billion in combined net assets. Bitcoin products accounted for $96.07 billion, while Ether products held the remaining $14.30 billion, according to SoSoValue.


CME Chairman Terry Duffy and Kalshi co-founder Luana Lopes Lara traded insults at a CFTC roundtable over whether prediction markets are legitimate financial infrastructure or carnival games. The confrontation is the public face of a deeper regulatory battle between federal and state authorities, incumbent exchanges and startups, and two incompatible visions of what derivatives markets should look like.
Summary
- CME Group Chairman Terry Duffy and Kalshi co-founder Luana Lopes Lara clashed during a CFTC roundtable on prediction markets in Washington, D.C., on Aug. 21, 2026, in an exchange that featured personal insults, sarcasm about hot dog eating contests, and competing claims about market manipulation.
- Duffy called prediction market operators “carnival barkers” and said CME has “more people in my regulatory department than you have in your whole company,” to which Lara responded that CME should “learn a bit about efficiency.”
- The confrontation reflects a broader fight between federal and state regulators over whether prediction market contracts are federally regulated derivatives or state-level gambling products, with the CFTC suing states that attempt to block Kalshi’s operations.
- A U.S. survey published Aug. 12 found that 79% of prediction market users lost money in the past year, with 51% using borrowed funds, adding a consumer protection dimension to a debate that has been framed primarily as a jurisdictional question.
- New York has sued Kalshi for at least $36 billion in damages, calling it an unlicensed gambling operation, while the CFTC has used emergency powers to keep Kalshi trading amid the legal challenge.
The CFTC roundtable on prediction markets was supposed to be a policy discussion. It became a fight.
Terry Duffy, the chairman of CME Group, the world’s largest futures exchange, sat across from Luana Lopes Lara, the co-founder of Kalshi, a prediction market platform that lets users bet on everything from Bitcoin’s next price move to the Nathan’s hot dog eating contest. What followed was the most heated public exchange between financial industry executives in recent memory, and it happened in a government hearing room with cameras rolling.
The video is on YouTube. The quotes are real. And the fight, while personal, is the surface expression of a regulatory collision that will determine whether prediction markets become a permanent part of the U.S. financial system or get regulated out of existence.
What happened in the room
The CFTC convened the roundtable to discuss how event contracts should be regulated. Event contracts are futures that settle at $1 based on whether a specific outcome occurs. A contract on “Bitcoin above $80,000 by September 1” might trade at $0.45, implying a 45% probability. If Bitcoin is above $80,000 on that date, the contract pays $1. If not, it pays zero.
Duffy opened his remarks by saying he was “a lot concerned” about prediction markets and questioning whether they face the same regulatory scrutiny as established exchanges.
“We are not a bunch of carnival barkers at a circus,” Duffy said. “We are running the most envious markets in the world in the United States of America.”
He then singled out Kalshi by name, mocking one of its contracts. “There is another really economic contract that has been massively important for the United States,” Duffy said sarcastically. “That is a Nathan’s hot dog eating contest.”
Duffy also questioned why Kalshi could offer a compute prediction market while CME’s proposed compute contracts remained under CFTC review. The implication was clear: Kalshi operates under lighter regulatory oversight than CME, and that disparity is unfair.
After being called out by name, Lara responded. “I just wanted to respond since we were called by name here,” she said. “I would actually have to ask Terry: Has CME ever had any issues with any market manipulation, any issues ever in its history?”
Duffy deflected. “If you would like to have a debate, I am happy to have a debate with you.”
“I am just asking a simple answer to a question,” Lara said.
“I have more people in my regulatory department than you have in your whole company,” Duffy said.
“Maybe you should learn a bit about efficiency then,” Lara fired back.
“Well, maybe you should learn about credible markets,” Duffy replied, before moderator Walt Lukken stepped in to redirect the conversation.
DraftKings CEO Jason Robins, who was also on the panel, later urged participants to stop attacking each other’s businesses. “I would just ask everybody, both in this hearing and then also in future communications, to try to refrain from taking shots at each other’s business models or decisions you may not 100% agree with,” Robins said. “That does not advance the discussion.”
The jurisdictional war beneath the insults
The Duffy-Lara exchange was personal, but the fight is structural. Prediction markets in the United States sit at the intersection of three regulatory frameworks, and none of them fit cleanly.
The federal framework. The CFTC has claimed jurisdiction over event contracts as federally regulated derivatives. Under CFTC rules, platforms like Kalshi can list contracts on a wide range of outcomes, from commodity prices to weather events to elections, as long as the contracts meet certain requirements around market integrity and price discovery.
The state framework. Multiple states argue that prediction market contracts are gambling products subject to state gambling laws, not federal derivatives law. If states prevail, platforms like Kalshi would need state-by-state gambling licenses, fundamentally changing their business model and cost structure.
The unresolved middle. Some contracts fit neatly into the derivatives framework (a contract on oil prices, for example). Others fit more naturally into the gambling framework (a contract on the Nathan’s hot dog eating contest). The question of where the line falls between “legitimate price discovery” and “dressed-up gambling” is the central regulatory question, and nobody has answered it.
CFTC Chair Selig has defended the agency’s jurisdiction aggressively. In February 2026, he warned states challenging federal authority with a blunt statement: “We will see you in court.” The agency has since taken legal action against states seeking to regulate event contracts under their gambling laws.
In June 2026, the CFTC proposed restrictions on certain contracts involving war or assassination and some sports proposition bets considered particularly susceptible to manipulation. Nine Democratic senators followed up by urging the CFTC to prohibit wildfire event contracts, warning they could create incentives for arson, insider trading, and disaster profiteering.
The proposals reveal an agency trying to walk a line: maintain jurisdiction over prediction markets while acknowledging that some contracts raise legitimate public policy concerns. The CFTC wants to regulate these markets, not eliminate them. But the more contracts the agency restricts, the stronger the argument becomes that the contracts are not really derivatives and should be regulated as gambling.
The New York lawsuit
The highest-stakes legal battle is in New York. The state filed suit against Kalshi, seeking at least $36 billion in damages and calling the platform an unlicensed gambling operation. The lawsuit seeks a temporary restraining order to halt Kalshi’s contracts immediately.
The $36 billion figure is attention-grabbing because it is larger than Kalshi’s entire lifetime volume. New York calculated it by applying state penalties to the number of individual contracts traded on the platform, a methodology that produces an astronomical headline number regardless of whether it would survive judicial scrutiny.
Separately, a Washington state judge ordered Kalshi to stop offering contracts on sports, elections, politics, and other events, finding it likely violated state gambling and consumer protection laws. Two days before the Washington ruling, the CFTC invoked emergency powers to keep Kalshi trading amid the legal challenge, setting up a direct conflict between federal and state authority.
The collision course is now explicit. The CFTC says Kalshi’s contracts are federally regulated derivatives. Multiple states say they are illegal gambling. Both cannot be right, and the resolution will likely come from the courts, not from legislation, because Congress has shown no appetite for addressing the jurisdictional question directly.
What CME is really fighting about
Duffy’s attack on Kalshi was not just about hot dog contests. CME Group operates the world’s largest futures exchange by volume, with more than $1 billion in daily revenue from trading fees. The exchange is publicly traded with a market capitalization exceeding $80 billion.
Prediction markets are a competitive threat to CME for a specific reason: they democratize access to event-driven trading. CME’s existing event contracts require institutional infrastructure to access. A retail trader who wants to bet on a Federal Reserve interest rate decision through CME needs a futures account, a broker, and margin requirements. A retail trader who wants to make the same bet through Kalshi needs a phone and a $5 deposit.
The fee structures are also different. CME charges per-contract fees that generate revenue proportional to volume. Kalshi charges lower fees on smaller notional values, targeting a mass retail audience rather than an institutional one. If prediction markets grow, they do not just create a new market. They create a substitute for the lower end of CME’s existing business.
Duffy’s “more people in my regulatory department” comment was not just about compliance. It was about cost structure. CME’s regulatory overhead is a competitive disadvantage if prediction market platforms can offer similar products without comparable costs. Duffy’s implicit argument is that prediction markets are competing unfairly because they are not held to the same standards.
Lara’s “efficiency” response was equally pointed. Kalshi’s pitch to regulators and the public is that it can provide the same market functions (price discovery, risk transfer, information aggregation) at lower cost because it is building on modern technology rather than maintaining decades-old infrastructure.
The consumer protection question nobody raised
Notably absent from the CFTC roundtable was any sustained discussion of consumer outcomes. A U.S. survey published on Aug. 12 by BadCredit.org found that 79% of prediction market users lost money in the past year. Fifty-one percent used borrowed funds to place bets.
These numbers are worse than the historical loss rates for retail futures trading (estimated at 70 to 75%) and comparable to the loss rates for retail forex trading in the U.S. (approximately 80%). The comparison to gambling is even more direct: state lottery commissions report that players lose an average of 50 cents on every dollar wagered, a better expected return than most prediction market users achieved.
The survey was not mentioned at the roundtable. Neither Duffy nor Lara referenced consumer loss rates. The CFTC commissioners did not raise them. The entire discussion was framed as a jurisdictional question (who regulates these markets?) rather than a consumer protection question (are these markets good for the people using them?).
This framing gap is significant because the strongest argument for state regulation is consumer protection. If 79% of users are losing money and half are borrowing to participate, the case for treating prediction markets as gambling products rather than financial instruments becomes substantially stronger, regardless of how the contracts are structured.
The math that makes prediction markets a threat
The economic case for why CME is fighting this hard comes down to three numbers.
CME Group reported average daily volume of approximately 24 million contracts in Q2 2026 across all product lines, including interest rates, equities, energy, agricultural commodities, metals, and foreign exchange. The exchange generated $5.6 billion in revenue in 2025. Its business model is built on a simple equation: more contracts traded at a per-contract fee equals more revenue.
Prediction markets are currently a fraction of CME’s scale. Kalshi’s cumulative lifetime volume is in the low billions of dollars. Polymarket peaked during the 2024 U.S. presidential election with approximately $3.5 billion in total volume. These numbers are rounding errors on CME’s balance sheet.
But the growth rate is not. Prediction market volume roughly tripled between 2024 and 2025 and is on pace to triple again in 2026. If that trajectory continues, prediction markets will process more volume in 2028 than CME’s foreign exchange or agricultural commodity divisions do today.
The strategic threat is not that Kalshi will replace CME. It is that prediction markets will capture the marginal growth in event-driven trading that would otherwise flow to CME’s newer product lines. CME has been expanding into weather derivatives, real estate futures, and other event-linked contracts. Prediction markets offer simpler, cheaper versions of the same exposure to a retail audience that CME’s institutional infrastructure cannot economically serve.
Duffy’s “more people in my regulatory department” comment was therefore not just about compliance. It was about whether the cost structure that makes CME a trusted institutional venue also makes it unable to compete for the retail end of the event-trading market. If the answer is yes, CME’s best strategy is not to build a better product. It is to raise the regulatory cost of entry until the competition cannot afford to operate.
The international dimension
The U.S. fight over prediction market regulation is playing out against an international backdrop that neither side discussed at the roundtable.
The United Kingdom’s Financial Conduct Authority has taken a permissive approach to prediction markets, classifying most event contracts as derivatives and regulating them under existing market frameworks. Several prediction market platforms have established U.K. operations as a hedge against U.S. regulatory risk.
The European Union’s Markets in Crypto-Assets (MiCA) regulation does not specifically address prediction markets but provides a framework under which event contracts tied to crypto assets could be classified and regulated. The European Securities and Markets Authority (ESMA) has signaled interest in the category but has not proposed specific rules.
Singapore’s Monetary Authority has taken a more restrictive approach, treating most prediction market contracts as gambling products and requiring platform operators to hold a gambling license.
The divergence matters because prediction markets are inherently global. A contract on “U.S. Federal Reserve raises rates in September” is equally useful to a trader in New York, London, or Singapore. If U.S. regulation becomes prohibitively restrictive, volume will migrate to jurisdictions with clearer rules, just as crypto trading volume migrated to offshore exchanges when U.S. regulation tightened.
CME would be hurt less by this migration than Kalshi, because CME already has a global footprint and can offer similar products through its European and Asian subsidiaries. Kalshi, as a U.S.-focused startup, would face an existential threat if its domestic market were closed by state regulation while international competitors operated freely.
The crypto connection
Prediction markets are not exclusively a crypto phenomenon, but crypto has been central to their growth. Polymarket, the largest prediction market by volume, operates on the Polygon blockchain. Kalshi accepts crypto deposits. Several newer platforms are built entirely on-chain.
The crypto connection creates a second regulatory complexity layer. If prediction market contracts are federally regulated derivatives, are crypto-native prediction markets subject to CFTC oversight? If they are gambling products, are they subject to state gambling laws even when they operate on decentralized infrastructure that has no physical presence in any state?
The CLARITY Act, currently working through Congress, does not directly address prediction markets. But its resolution of the securities-versus-commodities question for digital assets could indirectly affect how prediction market tokens and platforms are classified.
More directly, the prediction market regulatory fight is a preview of the jurisdictional battles that the broader crypto industry will face if the CLARITY Act fails. Without a federal framework, states will fill the vacuum, creating a patchwork of rules that vary by jurisdiction. This is already happening with prediction markets, and the result is legal chaos: the same contracts are legal in some states, illegal in others, and the subject of competing federal and state court orders that directly contradict each other.
What a competitor could not write: the insurance analogy CME will not use
There is an argument that neither side made at the roundtable, and it is the most clarifying frame for the entire debate.
Prediction market contracts on real-world events function as insurance. A farmer who buys a contract on “drought in Iowa before October” is hedging crop risk. A supply chain manager who buys a contract on “port strike in September” is hedging logistics risk. An energy company that buys a contract on “hurricane making landfall in the Gulf” is hedging infrastructure risk.
Insurance markets are some of the most heavily regulated markets in the world, and they are regulated at the state level. Every state has an insurance commissioner. Every insurance product requires state approval. The regulatory framework exists because insurance contracts involve real-world risks that affect real people, and the potential for fraud, manipulation, and adverse selection is high.
Prediction markets on real-world events are structurally identical to insurance contracts. The only difference is the label. If prediction markets were called “event insurance,” the jurisdictional question would not exist. They would be state-regulated by default.
CME cannot make this argument because it would undermine its own position. CME wants prediction markets classified as derivatives, not insurance, because CME’s competitive advantage is in the derivatives framework, not the insurance framework. But the insurance analogy is the most intellectually honest description of what prediction market contracts actually do.
Kalshi cannot make this argument either, because insurance regulation is even more restrictive than derivatives regulation. State insurance commissioners would require actuarial justification for every contract, capital reserves for every potential payout, and approval processes that would slow product launches to a crawl.
Both sides prefer the current ambiguity to the clarity that the insurance analogy would provide, because the clarity would disadvantage both of them in different ways.
What to watch
– The New York lawsuit timeline. If the court grants the temporary restraining order, Kalshi’s operations in New York stop immediately, setting up an emergency appeal that could reach the Second Circuit within weeks.
– CFTC final rulemaking on restricted contract categories. The June 2026 proposed restrictions on war, assassination, and certain sports contracts will become final rules. The scope of the restrictions will signal how aggressively the CFTC is willing to police the line between derivatives and gambling.
– Prediction market user loss rate data from the CFTC or a Congressional study. If the 79% loss rate figure enters the regulatory record, it strengthens the consumer protection argument for state regulation.
– CME launching its own event contracts. If CME files for CFTC approval of event contracts that directly compete with Kalshi’s offerings, the competitive dynamic changes from “should these markets exist?” to “who should operate them?”
– The CLARITY Act prediction market amendment, if one is filed. Any language in the CLARITY Act that addresses event contract jurisdiction would preempt the court battles and settle the question legislatively.
What happened at the CFTC prediction market roundtable?
CME Group Chairman Terry Duffy and Kalshi co-founder Luana Lopes Lara clashed over whether prediction markets face the same regulatory scrutiny as established exchanges. Duffy called prediction market operators “carnival barkers” and mocked Kalshi’s hot dog eating contest contract. Lara challenged CME’s own history with market manipulation.
What is a prediction market?
A prediction market lets users buy contracts that pay $1 if a specific event occurs and zero if it does not. The contract price implies the market’s estimated probability of the event. Platforms like Kalshi, Polymarket, and Myriad offer contracts on everything from Bitcoin prices to elections to weather events.
Is Kalshi legal?
Kalshi holds a CFTC registration as a designated contract market, making it legal under federal law. However, multiple states have challenged its legality under state gambling laws. New York has sued for $36 billion in damages, and a Washington judge ordered Kalshi to stop operating in the state.
Why is CME Group opposed to prediction markets?
CME Group operates the world’s largest futures exchange and sees prediction markets as a competitive threat that operates under lighter regulatory oversight. CME’s argument is that prediction markets should face the same compliance costs and standards as established derivatives exchanges.
What is the difference between prediction markets and gambling?
The regulatory distinction depends on whether the contracts serve a “price discovery” function (derivatives) or are primarily entertainment-based wagering (gambling). Courts and regulators have not agreed on where the line falls, which is why the same contracts are legal under federal law and potentially illegal under some state laws.
How many prediction market users lose money?
A U.S. survey published Aug. 12, 2026, by BadCredit.org found that 79% of prediction market users lost money in the past year. Fifty-one percent used borrowed funds to participate.
Could prediction markets be regulated as insurance?
Prediction market contracts on real-world events are structurally similar to insurance contracts, but neither the industry nor regulators have pursued this classification. Insurance regulation is state-level and more restrictive than either the derivatives or gambling frameworks.
Will Congress address prediction market regulation?
The CLARITY Act does not directly address prediction markets. No separate legislation targeting event contract jurisdiction has been introduced. The regulatory question is more likely to be resolved by courts than by Congress. This is educational analysis, not investment advice.
Disclaimer: This article is for informational purposes only and does not constitute financial, investment, or legal advice. Cryptocurrency markets are volatile, and past performance does not guarantee future results. Always conduct your own research. Published Aug. 21, 2026.


The relative strength index is one of the most widely used momentum oscillators in crypto trading, but most traders misread what it actually measures. This guide breaks down the RSI formula, explains how overbought and oversold signals work in practice, and covers the mistakes that turn a useful indicator into a losing strategy.
Summary
- RSI is a momentum oscillator that measures the speed and magnitude of recent price changes on a scale of 0 to 100, with readings above 70 considered overbought and below 30 considered oversold.
- The standard RSI calculation uses 14 periods and compares average gains to average losses, producing a ratio that reflects buying or selling pressure rather than absolute price direction.
- Blindly selling when RSI hits 70 or buying when it hits 30 is one of the most common trading mistakes, because strong trends can keep RSI elevated or depressed for extended periods.
- RSI divergence, where price makes a new high or low but RSI does not, can signal weakening momentum, though false divergence signals are frequent in volatile crypto markets.
- Pairing RSI with trend context, volume confirmation, and appropriate timeframes turns it from a standalone guessing tool into a practical component of a broader trading framework.
Most traders learn RSI backwards. They start with the idea that 70 means “sell” and 30 means “buy,” treating the indicator like a traffic light for entries and exits. That mental model sounds logical, but it ignores what RSI actually calculates. The relative strength index does not measure whether an asset is expensive or cheap. It measures how aggressively price has been moving in one direction compared to the other. Understanding that distinction is the difference between using RSI as a crutch and using it as a genuine analytical tool.
J. Welles Wilder Jr. introduced RSI in his 1978 book New Concepts in Technical Trading Systems. Nearly five decades later, it remains a default indicator on virtually every charting platform. Its popularity is both a strength and a weakness. Because so many traders watch the same levels, RSI signals can become self-reinforcing, but they can also become traps when the crowd expects a reversal that never arrives.
What RSI actually measures
RSI quantifies momentum by comparing the average size of recent up moves to the average size of recent down moves over a defined lookback period. The default period is 14, meaning the calculation considers the last 14 candles on whatever timeframe you are viewing.
The formula has two steps. First, calculate the relative strength (RS):
RS = Average Gain over N periods / Average Loss over N periods
Then plug RS into the RSI equation:
RSI = 100 – (100 / (1 + RS))
Average gain is the sum of all positive price changes over the lookback period divided by N. Average loss is the sum of all negative price changes (expressed as positive numbers) divided by N. Periods with no change count as zero for both.
What this produces is a bounded oscillator. When gains completely dominate losses, RS becomes very large and RSI approaches 100. When losses dominate, RS approaches zero and RSI drops toward 0. A perfect balance between gains and losses produces an RS of 1 and an RSI of 50.
The key insight is that RSI responds to the magnitude and consistency of directional moves, not to price levels. An asset trading at an all time high can have a moderate RSI if it climbed there gradually. An asset that dropped 40% from its peak can have a high RSI if it just bounced sharply off the low.
After the first 14 period calculation, most implementations use a smoothed (exponential) moving average for subsequent values. This means RSI reacts to recent price action but also carries memory of prior periods, which is why it does not whip between extremes on every candle.
How traders read the 70/30 thresholds
The conventional interpretation is straightforward: RSI above 70 signals overbought conditions, and RSI below 30 signals oversold conditions. In theory, an overbought reading suggests that recent gains have been unusually strong and a pullback may follow. An oversold reading suggests the opposite.
In range bound markets, this interpretation works reasonably well. When price is oscillating between support and resistance without a clear trend, RSI tends to bounce between overbought and oversold zones in a predictable rhythm. Traders who buy near 30 and sell near 70 in these conditions can capture short term reversals.
The problem is that markets are not always range bound, and RSI does not know the difference.
In a strong uptrend, RSI frequently pushes above 70 and stays there for weeks or even months. Bitcoin in late 2024 and early 2025 spent extended periods with daily RSI above 65, punctuated by brief dips that never reached 30. Traders who sold every time RSI crossed 70 exited positions that continued climbing. The “overbought” signal was technically accurate in describing momentum, but it was useless as a sell signal because the trend had more room to run.
The reverse applies in downtrends. During capitulation phases, RSI can sit below 30 for extended periods while price continues to fall. Buying every touch of 30 in a bear market is a reliable way to catch falling knives.
Some traders adjust the thresholds based on market regime. In confirmed uptrends, they shift the zones to 80/40, treating only extreme readings as meaningful. In downtrends, they use 60/20. This adaptation helps, but it introduces a new problem: correctly identifying the current regime in real time.
RSI divergence and when it lies
Divergence occurs when price and RSI move in opposite directions. There are two types.
Bullish divergence appears when price makes a lower low but RSI makes a higher low. This suggests that selling pressure is weakening even though price is still declining. It can signal that a reversal or at least a bounce is approaching.
Bearish divergence appears when price makes a higher high but RSI makes a lower high. This suggests that buying momentum is fading even as price pushes higher. It can precede a pullback or trend reversal.
Divergence is one of the more powerful RSI signals, but it comes with significant caveats.
First, divergence can persist for a long time before price reacts. In crypto markets, bearish divergence on a daily chart can build across multiple weeks while price continues to climb. Traders who act on the first sign of divergence often enter too early and get stopped out before the reversal materializes.
Second, not all divergences are created equal. A divergence that forms after an extended trend carries more weight than one that appears during a choppy consolidation. The number of touches matters too. A triple divergence (three consecutive higher highs in price with three consecutive lower highs in RSI) is generally more reliable than a single divergence.
Third, hidden divergence exists but is less discussed. Hidden bullish divergence occurs when price makes a higher low while RSI makes a lower low, suggesting the uptrend will continue. Hidden bearish divergence is the mirror image. These signals are trend continuation patterns, not reversal patterns.
The practical rule: treat divergence as a warning flag, not a trade signal. It tells you to pay closer attention and look for confirmation from other indicators or price action patterns before committing capital.
RSI in crypto versus equities
RSI behaves differently in cryptocurrency markets compared to traditional equities, and traders who import their stock market habits without adjustment tend to struggle.
Crypto assets are more volatile on average than most stocks. Daily moves of 5% to 10% are routine for mid cap tokens and not uncommon for large caps like ethereum. This volatility means RSI reaches extreme readings more frequently and stays there longer. A stock with RSI above 80 is genuinely unusual. Bitcoin with RSI above 80 on a daily chart happens multiple times per cycle.
The 24/7 nature of crypto markets also matters. Stocks trade roughly 6.5 hours per day, five days per week. Crypto never stops. This continuous trading means that momentum can build without the overnight or weekend pauses that naturally cool down RSI readings in equities. A Friday close at RSI 72 in stocks gets a two day rest before the next calculation. Bitcoin at RSI 72 keeps generating new data points through the weekend.
Liquidity differences play a role as well. Thin order books on smaller tokens can produce RSI spikes on relatively low volume. A single large buy order can push a low cap token from RSI 50 to RSI 85 in a few hours, which would be nearly impossible for a stock in the S&P 500.
For crypto traders, the practical adjustment is to treat RSI extremes with more skepticism. An RSI of 75 on daily Bitcoin during a bull market is not necessarily a sell signal. It may simply reflect the asset doing what it does in trending conditions. Context matters more than the number itself.
Timeframe differences
The timeframe you apply RSI to dramatically changes what it tells you.
Weekly RSI moves slowly and reflects macro momentum. When weekly Bitcoin RSI crosses above 70, it has historically coincided with the middle stages of bull markets, not the tops. Weekly RSI readings below 30 have marked generational buying opportunities in previous cycles, though the sample size is small enough that any pattern could be coincidental.
Daily RSI is the most commonly referenced timeframe. It balances responsiveness with noise filtering and is useful for swing traders operating on multi day to multi week holding periods. Daily RSI divergence signals tend to be more reliable than those on shorter timeframes because they filter out intraday noise.
4 hour RSI is popular among active traders. It provides more granular momentum data and generates more frequent signals. The trade off is a higher false signal rate. A 4 hour RSI dip to 25 might represent a brief intraday selloff that reverses within hours, not a meaningful oversold condition.
1 hour and below generates so many signals that the noise to signal ratio becomes problematic for most traders. Scalpers use these timeframes, but they typically combine RSI with order flow data, volume profiles, and level 2 order book information to filter signals.
A useful practice is to check RSI across multiple timeframes before acting. If daily RSI is trending higher while 4 hour RSI pulls back to 40, the pullback is likely a buying opportunity within a larger uptrend. If daily RSI is at 75 and 4 hour RSI is also at 80, the risk of a near term pullback increases.
Common RSI mistakes
Using RSI in isolation. RSI is one data point. It tells you about recent momentum, nothing about trend direction, support and resistance levels, volume, market structure, or fundamental catalysts. Traders who base decisions solely on RSI readings are working with incomplete information.
Ignoring the trend. RSI signals mean different things in different market contexts. An RSI reading of 30 in a confirmed downtrend is not the same as RSI at 30 after a brief dip in a strong uptrend. The trend determines whether an oversold reading is a buying opportunity or a brief pause before further selling.
Treating every divergence as actionable. As discussed above, divergence can persist for weeks. Entering a short position at the first sign of bearish divergence in a bull market is a high risk, low probability trade. Wait for confirmation.
Over optimizing the lookback period. Some traders endlessly tweak the RSI period from 14 to 9, 21, or other values, searching for the “best” setting. In practice, the differences are marginal. A shorter period (like 9) produces a more reactive RSI with more extreme readings. A longer period (like 21) produces a smoother RSI that generates fewer signals. Neither is objectively better. The standard 14 period works well enough for most applications, and the time spent optimizing is usually better spent on risk management.
Confusing overbought with overvalued. RSI does not measure whether an asset is fairly priced. It measures momentum. An asset can be fundamentally undervalued and have a high RSI if it just rallied 20% in a week. An asset can be fundamentally overvalued and have a low RSI if sentiment has collapsed. RSI and valuation are separate concepts.
What RSI does not tell you
RSI does not predict the future. A high RSI does not guarantee a reversal any more than a low RSI guarantees a bounce. It describes recent price behavior, and recent behavior does not always continue or reverse on schedule.
RSI does not account for volume. A move to RSI 80 on massive volume has different implications than the same RSI reading on thin volume, but RSI treats both identically. This is why volume weighted indicators or simple volume analysis should accompany RSI readings.
RSI does not factor in external events. Regulatory announcements, exchange failures, protocol exploits, macroeconomic data releases, and other catalysts can override any technical signal. An asset at RSI 25 can drop to RSI 10 if bad news hits. An asset at RSI 85 can push to RSI 95 on a positive regulatory ruling.
RSI does not distinguish between healthy and unhealthy momentum. A steady climb over two weeks and a single day pump can produce similar RSI readings despite representing very different market dynamics. The shape of the RSI curve matters as much as the number itself, and that nuance requires experience to interpret.
Setting up RSI on TradingView and what to pair it with
On TradingView, adding RSI takes about ten seconds. Open any chart, click the “Indicators” button (or press the / key), search for “RSI,” and select “Relative Strength Index” from the built in indicators. It appears as a separate panel below the price chart with the default 14 period setting and horizontal lines at 70 and 30.
To adjust the period, click the gear icon on the RSI indicator and change the “Length” field. To modify the overbought and oversold thresholds, edit the “Upper Band” and “Lower Band” values in the same settings panel.
For a more complete picture, consider pairing RSI with the following:
Moving averages (50 day and 200 day simple or exponential). These define the trend. If price is above both moving averages and they are sloping upward, treat RSI pullbacks as potential buying opportunities rather than sell signals.
Volume. Check whether RSI extremes coincide with volume spikes or low volume drift. High volume RSI extremes are more meaningful.
MACD (Moving Average Convergence Divergence). When both RSI and MACD show divergence simultaneously, the signal carries more weight than either alone.
Support and resistance levels. An oversold RSI reading at a known support level is a stronger signal than an oversold reading in the middle of nowhere on the chart.
Bollinger Bands. When price touches the lower Bollinger Band while RSI is below 30, the confluence of signals increases the probability (though does not guarantee) a bounce.
No combination of indicators eliminates risk. The goal is to build a framework where multiple independent signals point in the same direction before you act.
What to watch
RSI divergence forming on the daily chart of any asset you hold. Bearish divergence after an extended rally is the single most useful RSI warning signal for position management.
RSI staying above 50 during pullbacks in an uptrend. This is a sign of trend strength. When pullbacks consistently find RSI support at 40 to 50 rather than dropping to 30, the uptrend is likely intact.
Weekly RSI crossing below 40 on Bitcoin or Ethereum. Historically, this has marked periods of significant downside risk. It does not mean sell immediately, but it warrants reviewing your exposure and risk management.
RSI recovering from below 20 on high volume. Extremely low RSI readings combined with a volume spike often mark capitulation events. These are rare but tend to produce the best risk to reward entries when they occur.
What does RSI stand for?
RSI stands for relative strength index. It was created by J. Welles Wilder Jr. and introduced in his 1978 book New Concepts in Technical Trading Systems. The “relative strength” refers to the comparison of average gains to average losses over a defined period, not to the relative performance of one asset versus another (which is a different concept sometimes also called relative strength).
What is a good RSI to buy crypto?
There is no single RSI value that reliably signals a good buy. In general, readings below 30 suggest oversold conditions, but context matters. In a strong downtrend, RSI can stay below 30 for extended periods while price continues to fall. A more reliable approach is to look for RSI recovery (RSI crossing back above 30 after dipping below it) combined with support from other indicators and price action at known support levels.
Is RSI better on daily or 4 hour charts?
Neither is objectively better. Daily RSI produces fewer but generally more reliable signals and is better suited for swing trading and position management. The 4 hour RSI generates more frequent signals and is preferred by active traders, but it has a higher false signal rate. Many traders check both timeframes and look for alignment before making decisions.
Can RSI predict a crypto crash?
RSI cannot predict crashes. It can identify conditions where a pullback becomes more likely, such as extended periods above 80 with bearish divergence forming. However, crashes are typically triggered by external catalysts (exchange failures, regulatory actions, liquidity crises) that no momentum oscillator can forecast. RSI is better understood as a risk assessment tool than a prediction tool.
What RSI setting should I use for crypto?
The default 14 period setting works well for most crypto applications. Some traders prefer a shorter period like 9 for more responsive signals on volatile assets, while others use 21 for smoother readings. The differences are relatively minor, and switching between settings rarely produces significantly different outcomes. Starting with the default and adjusting only after gaining experience with the indicator is the most practical approach.
How is RSI different from MACD?
Both RSI and MACD are momentum indicators, but they measure momentum differently. RSI compares the magnitude of recent gains to recent losses and produces a bounded reading between 0 and 100. MACD calculates the difference between two exponential moving averages and is unbounded. RSI is better for identifying overbought and oversold conditions. MACD is better for identifying trend direction and momentum shifts. Using both together can provide more robust signals than either alone.
Does RSI work in a bear market?
RSI works in bear markets, but the interpretation changes. In downtrends, RSI tends to oscillate between roughly 20 and 60 instead of the full 0 to 100 range. Overbought readings near 60 can signal shorting opportunities, while oversold readings near 20 can mark temporary bounces rather than trend reversals. Adjusting the threshold zones (for example, using 60/20 instead of 70/30) helps align the indicator with bearish market conditions.
Should I use RSI for day trading crypto?
RSI can be used for day trading, but it requires shorter timeframes (15 minute, 1 hour) and produces more noise. Day traders who rely on RSI typically combine it with order flow analysis, volume profiles, and level 2 order book data to filter signals. On its own, RSI on short timeframes generates too many false signals for consistent profitability. If you are new to trading, starting with daily RSI for swing trading is more forgiving than attempting to day trade with short timeframe RSI signals.
Disclaimer: This article is for informational purposes only and does not constitute financial, investment, or trading advice. Cryptocurrency trading involves substantial risk of loss. Always conduct your own research and consult a qualified financial advisor before making investment decisions. Published Aug. 21, 2026.


MACD is one of the most widely used momentum indicators in crypto trading, but most traders never move past the basic crossover signal. This guide breaks down what the moving average convergence divergence indicator actually measures, how to read each of its three components, and where it tends to fail in volatile crypto markets.
Summary
- MACD measures the relationship between two exponential moving averages and produces three components: the MACD line, the signal line, and the histogram.
- Crossover signals can identify momentum shifts, but they lag behind price action and produce frequent false signals in choppy crypto markets.
- Divergence between MACD and price is one of the strongest momentum warnings available, signaling that a trend may be losing strength before price confirms the reversal.
- Default MACD settings (12, 26, 9) were designed for stock markets and often need adjustment for crypto’s faster cycles, with many traders preferring 8, 21, 5.
- MACD does not measure overbought or oversold conditions, volume, or trend strength on its own, so pairing it with complementary indicators like RSI and volume is essential.
Most traders first encounter MACD as a simple “buy when the lines cross up, sell when they cross down” tool. That description is not wrong, but it leaves out nearly everything that makes the indicator useful. MACD is not a signal generator. It is a momentum measurement system built from the relationship between two moving averages, and reading it well means understanding what each of its three components tells you about the speed and direction of price movement. Traders who treat it as a standalone buy/sell trigger tend to overtrade and get caught in whipsaws, especially in crypto. Traders who understand its structure use it as one layer in a broader decision process.
What MACD actually calculates
MACD stands for moving average convergence divergence. The name describes exactly what the indicator does: it measures whether two moving averages are converging (moving closer together) or diverging (moving apart).
The calculation has three parts. The MACD line is the 12-period exponential moving average (EMA) minus the 26-period exponential moving average. When the shorter EMA is above the longer EMA, the MACD line is positive, meaning recent price momentum is bullish relative to the longer trend. When the shorter EMA falls below the longer one, the MACD line turns negative.
The signal line is a 9-period EMA of the MACD line itself. It smooths out the MACD line’s movements and serves as a trigger for crossover signals.
The histogram is the difference between the MACD line and the signal line. It visualizes the gap between the two, making it easier to spot when momentum is accelerating or decelerating. When the histogram bars are growing, the MACD line is pulling away from the signal line. When the bars are shrinking, the two lines are converging.
Gerald Appel developed MACD in the late 1970s for stock market analysis. The default settings of 12, 26, and 9 reflect the trading rhythms of traditional equity markets, which is worth keeping in mind when applying the indicator to 24/7 crypto markets.
The crossover signal
The most common MACD signal is the crossover. A bullish crossover occurs when the MACD line crosses above the signal line. This suggests that short-term momentum is accelerating to the upside relative to the longer-term trend. A bearish crossover occurs when the MACD line crosses below the signal line, indicating that downward momentum is building.
Crossovers are intuitive and easy to spot, which is why they are popular. But they come with an important limitation: they lag. Because both lines are derived from exponential moving averages, the crossover confirms a momentum shift that has already begun. By the time the MACD line crosses the signal line, price has often already moved a meaningful distance.
In trending markets, this lag is manageable. A bullish crossover during a strong uptrend often catches the early part of a continuation move. In ranging or choppy markets, the lag becomes a problem. The lines cross back and forth repeatedly, generating signals that lead to small losses on each trade. This whipsaw effect is one of the most common frustrations traders experience with MACD, and it is especially pronounced in crypto, where consolidation periods can produce rapid, directionless price swings. Understanding how crypto market makers work helps explain why these choppy conditions exist.
The quality of a crossover signal improves when it aligns with other evidence. A bullish crossover that occurs after a prolonged downtrend, near a known support level, and with increasing volume carries more weight than one that appears in the middle of a sideways range.
MACD divergence
Divergence is arguably the most valuable signal MACD produces, and it is the one most casual users overlook. Divergence occurs when price and the MACD indicator move in opposite directions.
Regular bullish divergence appears when price makes a lower low, but the MACD line or histogram makes a higher low. This suggests that although price is still falling, the downward momentum is weakening. It often precedes a reversal or at least a significant bounce.
Regular bearish divergence is the mirror image. Price makes a higher high, but MACD makes a lower high. The uptrend is intact on the surface, but the momentum behind each new high is fading.
Hidden divergence signals trend continuation rather than reversal. Hidden bullish divergence occurs when price makes a higher low while MACD makes a lower low, suggesting the pullback is a buying opportunity within an ongoing uptrend. Hidden bearish divergence appears when price makes a lower high while MACD makes a higher high, indicating that the corrective rally within a downtrend is losing steam.
Divergence signals are not timing tools. They warn that momentum is shifting, but they do not tell you when the actual reversal will arrive. Price can continue making new highs or lows for several candles after divergence appears. Treating divergence as a warning rather than an entry signal, and waiting for price confirmation, tends to produce better results.
One practical approach is to spot divergence on the daily chart and then drop to the 4-hour chart for a more precise entry. If daily MACD shows bullish divergence, the 4-hour chart may offer a crossover or a support bounce that provides a tighter entry point with a smaller stop loss. This multi-timeframe method reduces the ambiguity that comes with divergence signals on a single chart.
The histogram: acceleration and deceleration
The histogram deserves more attention than most traders give it. Because it represents the distance between the MACD line and the signal line, the histogram is effectively a momentum-of-momentum indicator. It shows not just whether momentum is bullish or bearish, but whether that momentum is speeding up or slowing down.
When histogram bars are growing taller (moving further from the zero line), momentum is accelerating. The MACD line is pulling away from the signal line at an increasing rate. This typically corresponds with strong, directional price movement.
When histogram bars start shrinking (moving back toward zero), momentum is decelerating. The MACD line is still on one side of the signal line, so the overall bias has not changed, but the rate of change is slowing. Shrinking histogram bars are often the first visual clue that a crossover may be approaching.
A histogram flip from positive to negative (or vice versa) is identical to a MACD crossover, just displayed differently. Some traders prefer to watch the histogram because the shrinking bars provide an earlier heads-up than waiting for the actual line cross.
In crypto trading, the histogram is particularly useful for gauging the strength of breakouts. A breakout accompanied by expanding histogram bars suggests genuine momentum behind the move. A breakout with a flat or shrinking histogram raises questions about follow-through. During the $3B Bitcoin short squeeze that drove rapid price action, daily MACD histograms expanded sharply before the liquidation cascade accelerated.
MACD in crypto markets
Crypto markets differ from traditional markets in several ways that affect how MACD behaves. The most important differences are volatility, market hours, and cycle speed.
Crypto trades 24 hours a day, seven days a week. There are no closing bells, no overnight gaps, and no weekend pauses. The continuous nature of the market means that EMAs are calculated on an unbroken data stream, which can make the indicator more responsive but also more prone to noise during low-liquidity periods like weekends or early morning hours in major trading regions.
Higher volatility is the bigger factor. Crypto assets routinely move 5 to 10 percent in a single day, and ethereum and DeFi tokens can swing sharply on protocol news. These large moves cause the MACD line to spike further from zero and from the signal line, producing dramatic crossovers that look significant but may simply reflect normal crypto volatility rather than meaningful trend changes.
Many crypto traders adjust the default MACD settings to account for these characteristics. A popular alternative is 8, 21, 5 (8-period fast EMA, 21-period slow EMA, 5-period signal line). The shorter periods make the indicator more responsive to crypto’s faster cycles, while the tighter signal line reduces some of the lag in crossover signals. These settings are not universally better, but they tend to produce cleaner signals on 4-hour and daily timeframes for major assets like bitcoin and ether.
There is no single correct MACD setting for all crypto assets and timeframes. Lower-cap altcoins with extreme volatility may benefit from even faster settings, while weekly charts of bitcoin may work well with the standard 12, 26, 9. Testing different settings against historical data on your chosen timeframe is more productive than searching for a universal configuration.
Zero-line crossovers and their significance
While most MACD discussion focuses on crossovers between the MACD line and the signal line, the zero line is equally important. The zero line represents the point where the 12-period EMA and the 26-period EMA are equal. When the MACD line crosses above zero, the short-term EMA has moved above the long-term EMA, which is a classic definition of bullish trend structure. When MACD crosses below zero, the opposite is true.
Zero-line crossovers are slower and less frequent than signal-line crossovers. They confirm that a trend change is underway rather than predicting one. For this reason, they are often used as trend filters. A trader might decide to take only bullish signal-line crossovers when the MACD line is above zero (confirming the broader trend is up) and only bearish crossovers when it is below zero.
The zero line also provides context for divergence signals. A bullish divergence that forms while the MACD line is above zero (meaning the broader trend is still bullish) is a higher-probability setup than one that forms deep in negative territory, where the trend has been bearish for an extended period and a true reversal requires more evidence. Traders using crypto ETF options strategies often use the zero-line position as a directional filter before entering directional bets.
Common MACD mistakes
Trading every crossover. Not all crossovers are equal. Crossovers in flat, low-momentum markets are noise, not signal. The histogram can help filter: if the bars are small and barely moving away from zero before the cross, the signal is weak.
Ignoring the broader trend. MACD works best when used with the trend, not against it. Taking bullish crossovers in a strong downtrend consistently produces losses. Identifying the prevailing trend on a higher timeframe and trading only in that direction improves crossover quality significantly.
Using default settings on every timeframe. The 12, 26, 9 settings behave differently on a 5-minute chart than on a daily chart. On very short timeframes, the default settings may produce signals so frequently that they become meaningless. On weekly charts, they may be too slow to catch intermediate moves. Adjusting settings to the timeframe and asset is not over-optimization. It is basic calibration.
Treating MACD as a standalone system. No single indicator provides a complete picture. MACD tells you about momentum but says nothing about support and resistance levels, volume, market structure, or order flow. Understanding basis trading and arbitrage mechanics provides complementary context that MACD alone cannot supply.
Confusing the histogram with volume. The MACD histogram measures the gap between the MACD line and signal line. It has no connection to trading volume. Tall histogram bars mean strong momentum separation, not high volume. Volume must be checked separately.
What MACD does not tell you
Understanding an indicator’s limitations is as important as understanding its signals. MACD does not provide the following information.
It does not measure overbought or oversold conditions. Unlike RSI, which oscillates between 0 and 100, MACD has no fixed upper or lower bound. A very high MACD reading means momentum is strong, but it does not mean price is overextended or due for a reversal.
It does not account for volume. A MACD crossover on low volume may be less significant than one on high volume, but MACD itself does not factor volume into its calculation.
It does not identify support and resistance levels. MACD can tell you that momentum is shifting, but it cannot tell you where price is likely to stall or reverse based on structural levels.
It does not perform well in every market condition. In strongly trending markets, MACD excels at confirming trend direction and identifying continuation opportunities. In ranging markets, it generates excessive signals and drains accounts through repeated small losses. Recognizing market regime (trending versus ranging) before applying MACD is a critical step that many traders skip.
Setting up MACD in practice
Most charting platforms include MACD as a built-in indicator. On TradingView, adding MACD involves searching “MACD” in the indicators panel and selecting the built-in version. The default settings appear as 12, 26, close, 9, which correspond to the fast EMA length, slow EMA length, source price, and signal line length.
To adjust for crypto, change these values to 8, 21, close, 5. Compare the output on both settings across several weeks of historical data to see how the signal frequency and quality change. The faster settings will produce earlier crossovers but may also generate more noise during consolidation.
Pairing MACD with other indicators strengthens the analysis. Two combinations are particularly common.
MACD plus RSI: RSI measures overbought and oversold conditions, which MACD does not. A bullish MACD crossover occurring while RSI is recovering from oversold territory (below 30) produces a higher-confidence signal than either indicator alone.
MACD plus volume: confirming a MACD crossover with a volume spike adds conviction. If the MACD line crosses the signal line to the upside and that candle has above-average volume, the momentum shift has participation behind it. A crossover on thin volume is more likely to fail.
On the timeframe question, daily charts tend to produce the most reliable MACD signals for swing trading crypto. The 4-hour chart works for shorter-term trades but requires faster settings. Anything below the 1-hour chart tends to generate excessive noise for most traders, though scalpers may find value in very fast MACD settings on 15-minute charts.
What to watch
Histogram shrinkage after a strong move signals that the current trend leg is losing momentum, even if no crossover has occurred yet. It is often the earliest warning.
Bullish divergence on the daily chart near a major support level combines a momentum signal with a structural level, creating one of the higher-probability MACD setups.
A zero-line crossover on the weekly chart confirms a major trend shift. These do not happen often, but when they do, the move that follows tends to be significant and sustained.
MACD crossovers during low-volume weekend sessions deserve extra skepticism. Thin liquidity amplifies price swings and can produce crossovers that reverse by Monday.
Multiple timeframe agreement is one of the strongest filters available. When the daily MACD is bullish and the 4-hour MACD produces a bullish crossover, the probability of follow-through is higher than when the two timeframes disagree.
Disclaimer: This article is for informational purposes only and does not constitute financial or investment advice. Cryptocurrency trading involves substantial risk. Always conduct your own research before making trading decisions. Published Aug. 21, 2026.
Richard Wyckoff published his market framework before the Great Depression, yet his distribution schematic remains one of the most referenced tools in crypto trading circles. This article breaks down how the method works, where it has appeared in Bitcoin price history, and what it actually tells traders about supply and demand.
Summary
- Richard Wyckoff developed his market cycle theory in the early 1900s, dividing price action into four phases: accumulation, markup, distribution, and markdown.
- The distribution phase contains specific sub-events, including the buying climax, automatic reaction, secondary test, sign of weakness, and last point of supply, each signaling a gradual shift from demand to supply.
- Volume analysis sits at the center of the Wyckoff method, with traders comparing effort (volume) against result (price movement) to detect when large operators are offloading positions.
- Bitcoin has displayed patterns consistent with Wyckoff distribution at several major tops, most notably in the first half of 2021 before a 50% drawdown.
- The method has limits: it does not predict timing or targets, and forcing its schematics onto every chart without confirming volume evidence is one of the most common mistakes traders make.
The first thing most people get wrong about Wyckoff analysis is the assumption that it predicts where price will go. It does not. The method was never designed as a forecasting system. It was designed as a reading system, a way to interpret what large, informed participants are doing with their capital based on the relationship between price and volume. That distinction matters because it changes how a trader uses the framework. Instead of drawing lines and waiting for a target, a Wyckoff practitioner watches for behavioral evidence that supply is overwhelming demand, or the reverse.
Who Richard Wyckoff was
Richard Demille Wyckoff was born in 1873 and spent his career on Wall Street during one of the most volatile periods in American financial history. He began working as a stock runner at age 15, eventually founding The Magazine of Wall Street in 1907, which grew into one of the most widely read financial publications of the era. He was a contemporary of Jesse Livermore, J.P. Morgan, and Charles Dow, and unlike many of his peers, he focused on educating retail investors rather than profiting from their mistakes.
Wyckoff believed that markets were driven by the activity of what he called the “Composite Man,” a conceptual figure representing the collective behavior of large institutional operators. His core argument was simple: if retail traders could learn to read the footprints left by these operators through price and volume, they could align their trades with the dominant force in the market rather than fighting it.
By the time of his death in 1934, Wyckoff had amassed a body of work that included books, articles, and a detailed correspondence course. The Stock Market Institute later formalized his teachings, and figures like Robert Evans and Hank Pruden carried the method into the late twentieth century. The core principles have survived largely unchanged because they describe something fundamental: the behavior of large participants operating in liquid markets. The Wyckoff method does not rely on indicators, oscillators, or mathematical formulas. It relies on reading the tape, a skill that translates directly into reading candlestick charts with volume data today.
The Wyckoff market cycle
Wyckoff divided all market behavior into four repeating phases:
Accumulation occurs when large operators quietly build positions after a prolonged decline. Price moves sideways in a range while volume patterns reveal absorption of supply. Retail sentiment is typically bearish during this phase, which is precisely why informed money can buy at low prices without pushing the market up prematurely.
Markup follows accumulation. Once large operators have built their positions, they allow price to rise, often quickly, as diminished supply meets renewed demand. This is the phase most retail traders recognize and attempt to trade.
Distribution is the mirror image of accumulation. Large operators begin selling their positions to eager buyers near the top of a trend. Price again moves sideways, but this time the underlying dynamic is the transfer of ownership from informed to uninformed participants. Distribution is harder to identify in real time than accumulation because bullish sentiment masks the selling pressure.
Markdown follows distribution. Once large operators have sold enough of their inventory, price falls, sometimes rapidly, as the remaining holders discover that demand has evaporated.
The cycle then repeats. Wyckoff did not claim that every cycle looks identical, but he argued that the underlying logic of supply and demand creates recognizable behavioral patterns at each phase.
Distribution phases in detail
Wyckoff and his later students, particularly Robert Evans and Hank Pruden, mapped specific events within the distribution phase. These events appear in a rough sequence, though real markets do not always follow the textbook order perfectly.
Preliminary supply (PSY) is the first sign that selling pressure is entering the market after a prolonged uptrend. Volume increases on a price advance, but the advance stalls or reverses. This event does not confirm distribution on its own. It signals that supply is beginning to appear.
Buying climax (BC) is a sharp, high-volume price spike that typically marks the highest point of the range. Retail enthusiasm peaks, volume surges, and price often gaps or extends rapidly. The key feature of a buying climax is that it occurs on the heaviest volume of the entire uptrend, yet price fails to sustain the advance. Large operators are using the demand created by retail excitement to offload inventory.
Automatic reaction (AR) is the selloff that follows the buying climax. Once the wave of buying exhausts itself, price drops under its own weight. The low of the automatic reaction defines the lower boundary of the distribution trading range.
Secondary test (ST) is a rally back toward the buying climax high on diminished volume. If volume and spread (the size of individual candles) decrease compared to the buying climax, the test confirms that demand is weakening. There can be multiple secondary tests.
Upthrust after distribution (UTAD) is an optional event where price briefly breaks above the buying climax high, trapping breakout buyers before reversing back into the range. Not all distribution ranges produce a UTAD, but when one appears, it is often the final bull trap before markdown begins.
Sign of weakness (SOW) is a decline that breaks below the lower boundary of the range, typically on increased volume. This event confirms that supply is in control. Price may bounce after a sign of weakness, but the character of the market has changed.
Last point of supply (LPSY) is the final weak rally before markdown accelerates. Volume and spread are noticeably lower than earlier rallies within the range. This event represents the last opportunity for large operators to sell remaining inventory before allowing price to fall freely.
Volume analysis in Wyckoff
Volume is not decoration in the Wyckoff method. It is the primary diagnostic tool. The core principle is effort versus result: if heavy volume (effort) produces little price movement (result), then the opposing force is absorbing the effort. If light volume accompanies a price move, the move lacks conviction and is likely to fail.
During distribution, traders watch for several volume patterns:
Volume climaxes on up-moves suggest that selling pressure is absorbing buying pressure. Even though price is rising, the extraordinary volume indicates that supply is meeting every bid.
Declining volume on rallies within the trading range confirms that demand is drying up. Each successive test of the highs produces less enthusiasm.
Expanding volume on declines within the range confirms that supply is increasing. Sellers are becoming more aggressive at lower prices.
A volume spike on a break below the range (sign of weakness) confirms that the distribution is complete and markdown is beginning.
One of Wyckoff’s most useful observations is that volume leads price. Changes in volume character often appear one or two events before the price action confirms the shift. This is why experienced Wyckoff practitioners spend more time studying volume bars than candlestick patterns.
Wyckoff applied to Bitcoin
Bitcoin’s 24/7 market structure and transparent on-chain data make it an unusually clean canvas for Wyckoff analysis. Unlike equities, which trade in sessions with opening and closing auctions that distort volume profiles, Bitcoin produces continuous price and volume data across global exchanges. On-chain analytics add a layer of confirmation that Wyckoff could never have imagined: the ability to see exactly when coins move from dormant wallets to exchange hot wallets, signaling that holders are preparing to sell. Two episodes stand out.
The 2021 top. Between February and May 2021, Bitcoin traded in a range between roughly $48,000 and $64,000. The April rally to $64,000 occurred on climactic volume across major exchanges, consistent with a buying climax. Price then dropped to approximately $47,000 (automatic reaction) before rallying back toward the highs on lower volume (secondary test). The May breakdown below $47,000 on sharply increased volume matched the sign of weakness event. The subsequent markdown carried Bitcoin to $29,000 within weeks. On-chain data later confirmed that long-term holders had been distributing coins to new buyers throughout the range, adding a data layer that Wyckoff himself never had access to.
The 2024 consolidation. After Bitcoin reached new highs near $73,000 in March 2024, it entered a multi-month trading range. Some analysts identified Wyckoff distribution features in the range, pointing to declining volume on rallies toward the highs. Others argued the pattern more closely resembled re-accumulation, a sideways pause within an ongoing uptrend. This disagreement illustrates an important point: Wyckoff analysis requires patience. The method reveals its answer only after the range resolves. Traders who labeled the range as distribution too early risked exiting before a continuation higher.
Wyckoff vs. modern technical analysis
Most popular technical analysis today relies on calculated indicators: moving averages, RSI, MACD, Bollinger Bands. These tools transform raw price data into derivative signals and generate buy or sell triggers based on mathematical thresholds.
Wyckoff analysis works differently. It reads raw price and volume directly, interpreting the behavior of market participants rather than the output of formulas. A Wyckoff practitioner asks “who is buying and who is selling at this price, and is the balance shifting?” An indicator-based trader asks “has RSI crossed above 70?”
Neither approach is inherently superior, but they answer different questions. Indicators excel at standardized, repeatable signals that can be backtested and automated. Wyckoff excels at contextual reading of market structure, identifying when the underlying dynamics of supply and demand are changing before indicators register the shift.
Many traders combine both. They use Wyckoff principles to identify the phase of the market cycle and then use indicators for timing entries and exits within that context. This layered approach avoids the main weakness of each method used alone: indicators without context generate false signals in ranges, and Wyckoff without precision can leave a trader waiting indefinitely for “confirmation.”
There is also a philosophical difference worth noting. Indicator-based analysis assumes that past statistical patterns will repeat in the future. Wyckoff analysis assumes that human behavior around greed, fear, and information asymmetry will repeat. Both assumptions have merit, but the Wyckoff assumption holds up more consistently across different asset classes and time periods because it is rooted in market structure, not in curve-fitting.
Common Wyckoff mistakes
Pattern-matching without volume. The most frequent error is identifying Wyckoff schematics based on price structure alone. A sideways range after an uptrend looks like distribution, but without confirming volume evidence, it might be a pause before continuation. The schematics are meaningless without the volume story.
Forcing the framework onto every chart. Not every top is a Wyckoff distribution. Not every bottom is accumulation. Some markets trend without forming recognizable ranges, and some ranges resolve in directions that contradict the expected schematic. Wyckoff himself acknowledged that the method works best in liquid markets with clear volume data. Applying it to illiquid altcoins with questionable volume reporting produces unreliable results.
Labeling events too early. Distribution takes time, often weeks or months. Traders who label a buying climax after one volatile day and then call for markdown the next week are misusing the method. Each event requires confirmation from subsequent price and volume behavior.
Ignoring the broader context. A distribution range that forms within a larger accumulation structure has a different meaning than one that forms after a multi-year bull run. Wyckoff analysis is fractal. The same patterns appear on daily, weekly, and monthly timeframes, and the higher timeframe context overrides the lower timeframe reading.
Treating Wyckoff as a crystal ball. The method identifies conditions under which a certain outcome becomes more probable. It does not guarantee that outcome. Even a textbook distribution schematic can fail if a macro event injects unexpected demand into the market.
What Wyckoff does not tell you
Wyckoff analysis does not provide price targets. It identifies phases and events, not destinations. A sign of weakness confirms that distribution is likely complete, but it does not tell you whether markdown will carry price down 20% or 60%.
It does not provide timing. Distribution can last weeks or months, and there is no formula for predicting when the LPSY will appear or when markdown will begin.
It does not work on all assets. Markets with low liquidity, manipulated volume data, or no continuous trading history produce unreliable Wyckoff readings. This is relevant in crypto, where many tokens trade on exchanges known for inflated volume.
It does not replace risk management. Even if a trader correctly identifies a distribution phase, they still need position sizing, stop placement, and a plan for what to do if the analysis is wrong. Wyckoff was explicit about this in his original course: reading the market correctly is only half the job. The other half is acting on that reading with discipline, which means accepting losses when the market does something the analysis did not anticipate.
It also does not account for external catalysts. A regulatory announcement, an exchange hack, or a macroeconomic shock can override any distribution or accumulation pattern. The method reads internal market structure. It does not read the news.
Practical checks for identifying distribution
Timeframe selection. Wyckoff analysis works best on daily and weekly charts for major assets like Bitcoin and Ethereum. Lower timeframes (1-hour, 4-hour) produce more noise and more false patterns. Higher timeframes (monthly) provide context but move too slowly for actionable trading.
Volume source. Use volume data from spot exchanges or aggregated across multiple venues. Futures volume can distort the picture because leveraged liquidations create artificial spikes that do not represent genuine supply and demand shifts.
Checklist approach. Rather than trying to identify the full schematic at once, check for individual events sequentially. Has there been a climactic price spike on extreme volume? Did the subsequent selloff define a clear range? Are rallies within the range producing less volume than the initial spike? Each confirmed event adds weight to the distribution thesis.
On-chain confirmation. For Bitcoin specifically, on-chain metrics like long-term holder supply changes, exchange inflows, and realized profit-taking can confirm or deny what the Wyckoff chart suggests. This is a modern advantage that Wyckoff analysts in traditional markets do not have.
Wait for the sign of weakness. The single most important discipline in Wyckoff trading is patience. Distribution is confirmed only when price breaks below the range on convincing volume. Acting before that event means trading a hypothesis, not a confirmed phase.
What to watch
Volume divergence on rallies near range highs. If price tests the top of a range on declining volume two or more times, demand is weakening, and distribution becomes more probable.
A sharp break below the range low on expanding volume. This sign of weakness event is the strongest single confirmation that distribution is complete and markdown has begun.
On-chain data showing long-term holders reducing positions. When holders who have not moved coins for over 155 days begin transferring to exchanges, it confirms that informed participants are distributing.
A UTAD that reverses quickly on high volume. A failed breakout above the range that traps buyers and reverses within one to three sessions is often the last event before markdown, and a high-confidence short signal for aggressive traders.
Decreasing spread on successive rallies within the range. When each rally produces smaller candle bodies (spread) on similar or declining volume, the market is telling you that buyers are losing conviction with each attempt to push higher.
What is Wyckoff distribution in simple terms?
Wyckoff distribution is a phase of the market cycle where large, informed participants gradually sell their holdings to smaller buyers near the top of a trend. Price moves sideways in a trading range while ownership transfers from strong hands to weak hands. Once the selling is complete, price declines.
How long does a Wyckoff distribution phase last?
There is no fixed duration. In Bitcoin, distribution phases at major cycle tops have lasted anywhere from several weeks to several months. The duration depends on how much inventory large operators need to sell and how much buying demand exists to absorb it.
Can Wyckoff analysis predict exact Bitcoin price targets?
No. The method identifies phases and events that signal shifting supply and demand dynamics. It does not produce numerical price targets. Traders who use Wyckoff typically combine it with other tools, such as support and resistance levels, Fibonacci extensions, or on-chain data, for target estimation.
Is Wyckoff analysis still relevant in the age of algorithmic trading?
Yes. Algorithmic trading has changed the speed at which events unfold, but the underlying dynamics of supply and demand have not changed. Large participants still need to build and exit positions without moving the market against themselves, which creates the same behavioral footprints Wyckoff identified a century ago.
What is the difference between Wyckoff distribution and re-accumulation?
Both appear as sideways trading ranges after an uptrend. Distribution leads to markdown (price decline), while re-accumulation leads to further markup (price advance). The difference shows in volume behavior: distribution ranges show increasing volume on declines and decreasing volume on rallies, while re-accumulation ranges show the opposite.
How do you confirm a Wyckoff distribution pattern on Bitcoin?
Confirmation requires a sign of weakness: a break below the lower boundary of the trading range on significantly increased volume. Until that event occurs, the range could resolve in either direction. On-chain data showing large holders moving coins to exchanges adds a secondary layer of confirmation.
Does Wyckoff work on altcoins?
The method works best on liquid assets with reliable volume data. Major altcoins like Ethereum can produce readable Wyckoff structures. Smaller tokens with low liquidity and potentially inflated exchange volume produce unreliable patterns. Volume data quality is the limiting factor.
What timeframe is best for Wyckoff analysis on crypto?
Daily charts offer the best balance between signal quality and actionability for major cryptocurrencies. Weekly charts provide important structural context. Timeframes below 4 hours tend to produce excessive noise and false patterns unless the trader has significant experience with the method. This is educational analysis, not investment advice.
Disclaimer: This article is for informational purposes only and does not constitute financial, investment, or trading advice. Cryptocurrency markets carry substantial risk. Always conduct your own research and consult a qualified financial advisor before making investment decisions. Published Aug. 21, 2026.

F&O Talk: Nifty to consolidate further, says Sudeep Shah; picks 3 stocks for next week
Bitcoin and Gold Are Surging Together: The ‘Debasement Trade’ Is Back

Fantasy football rankings 2026: Breakouts by computer model that called Tetairoa McMillan’s huge season

Weekend Open Thread – Corporette.com

Weekend Open Thread: Brooks Brothers

London Mayor Sadiq Khan handed a peerage by Keir Starmer alongside 15 other Labour figures… just days before the PM leaves No10

The Craziest Reveal In Financial Audit History | Financial Audit @calebhammercomposer

Your Business Will Collapse Without This Strategy: Critical Financial Planning for Entrepreneurs 202

THE FINANCIAL ADVICE EVERY CHILD SHOULD KNOW #PersonalFinance #Investing #parenthood #makingmoney
-

 Fashion13 hours ago
Weekend Open Thread: Madewell – Corporette.com
-

 Business4 days ago
SMA Solar Technology AG (SMTGY) Q2 2026 Earnings Call Transcript
-

 Politics7 days ago
SEQ Code: The Three Letter Boarding Pass Code That Could Give You The Worst Seat
-

 Tech4 days ago
Qwen3.8-27B runs frontier-class coding agents and reasoning locally, no cloud API required
-

 Crypto World4 days ago
OCC Greenlights Trump Family Crypto Firm for Trust Charter
-
 Entertainment7 days ago
Marvel Studios Reveals New X-Men Cast Including Adam Driver and Sadie Sink
-
 Tech7 days ago
Every fusion startup that has raised over $100M
-
 Business7 days ago
Monarch Mutual Fund set to enter MF space with maiden overnight fund; files draft with Sebi
-

 News Videos2 days ago
Don’t Leave Your Financial Future To Chance | August 19, 2026
-

 Business7 days ago
Cristiano Ronaldo’s Secret Wedding Deepens As Presenter Claims Family Learned ’30 Seconds’ Before
-

 Crypto World5 days ago
Data of 54K Wallet Users Leaked, Clarity Odds Just 10%: Hodler’s Digest, Aug. 16
-

 Crypto World4 days ago
NAVI Prime launches institutional lending framework on Sui
-

 Politics6 days ago
Britain is facing a housing disaster
-

 Business7 days ago
New Avengers Doomsday Trailer Drops at D23 Showing Robert Downey Jr as Doctor Doom
-

 Tech7 days ago
How to watch FIH Hockey World Cup 2026: FREE live streams, schedule
-

 Business6 days ago
Rebel Creamery files Chapter 11 with $23.8M Van Leeuwen judgment on appeal
-
 Tech7 days ago
Enterprise SSDs now consume 48% of global NAND flash supply
-
 Crypto World4 days ago
Dow’s 3-Year Winning Run Isn’t a Crash Signal, Still 49% Odds of Double-Digit Gains
-

 Tech6 days ago
What are the rumors about the AirPods Pro 4?
-

 Fashion7 days ago
Fashion Bomb Daily On the Scene: The 2026 MVAAFF x ESPN White Party on Martha’s Vineyard
You must be logged in to post a comment Login