

Crypto World
Data: Meme Coins Have Lost Nearly 82% of Their Value Since 2024
Meme coins have been on a bad run since they peaked in 2024, with data from CryptoRank showing they’ve collectively lost more than $110 billion from then to now.
According to the data, this year alone, the sector has dipped 31%, taking its combined value to around $24.5 billion, with repeated attempts at recovery barely holding.
Meme Coin Market Struggles to Recover From 2024 Peak
At its height in 2024, the joke token market stood at $135 billion, but what came after that was a lengthy unwind that no single bounce has been able to really make any dent on, resulting in meme coin traders giving back the vast majority of gains they had accumulated since then. This was confirmed by CryptoRank analysts, who wrote in a post on X:
“Despite several rebounds throughout 2025, the meme coin market has been unable to regain the momentum of the previous cycle.”
Dogecoin (DOGE) is still the biggest player in the space, with a market cap of around $13.7 billion that also puts it just outside the top ten in the broader crypto market. However, per information from CryptoRank, it has fallen 20.5% in the last 30 days alone, with the second largest, Shiba Inu (SHIB), down almost 14% to take its overall value to about $3 billion. The other big name here is PEPE, worth approximately $1.25 billion all told, after slumping by over 21% in one month and 74% in 12.
Further down the list, coins like Bonk, Fartcoin, and dogwifhat (WIF) have lost between 15% and 30% across four weeks, while Official Trump (TRUMP) is in the red by 12.2% and was trading below $2 at the time of writing. Among them, the one that has lost the least in one year is Bonk at 69%, and the worst hit is Fartcoin at just over 89%, although it has had one of the better 24 hours, gaining nearly 5% since yesterday.
However, the story isn’t the same everywhere, as some meme tokens, like Kintara (KINS) and the so-called Original Doge (OGDOGE), have skyrocketed by 2,664% and 1,765%, respectively, over 30 days, although they are both way smaller than the sector’s leading names, with their combined market caps barely scratching $20 million.
Dogecoin Is the Meme Coin Bellweather
Of the $24.5 billion that CryptoRank says the meme coin sector is currently valued at, DOGE’s $13.7 billion accounts for over half of that. And even though it’s lost over 50% of its price from one year ago, per CoinGecko data, that has not stopped some analysts from making a case for it.
According to Alphractal, the king meme coin has been trading near a level that has historically been followed by big price gains, with the crypto market intelligence provider saying the current market mood is unusually pessimistic:
“The market is reading DOGE as a dead meme. The chart is reading it as a coiled spring.”
The post Data: Meme Coins Have Lost Nearly 82% of Their Value Since 2024 appeared first on CryptoPotato.

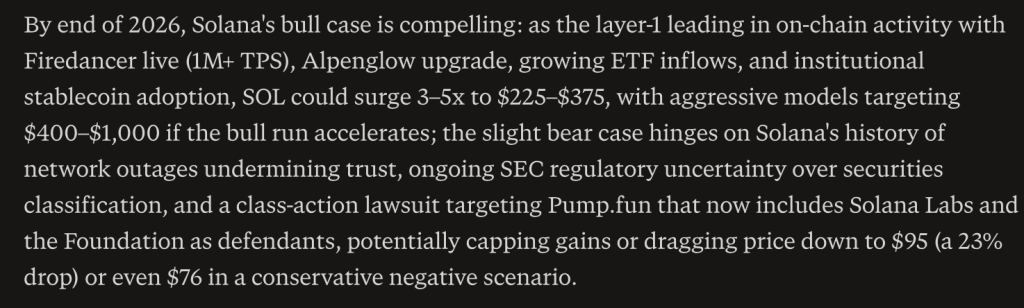
Perplexity AI is back with another Solana predicts, and this time it went further. The base case is $225 to $375 by end of 2026, a 3x to 5x from the current $74.93, with aggressive models stretching all the way to $400 to $1,000 if the bull run really accelerates.
That upper range is not a typo. Perplexity is genuinely entertaining the idea of a 13x Solana by year end, which puts it in a category of prediction that demands the underlying argument be airtight.
The foundation is Firedancer, going live at 1 million plus TPS alongside the Alpenglow upgrade, a combination that does not just make Solana faster but puts it in a performance tier no other Layer-1 can currently compete with.

Add growing ETF inflows and institutional stablecoin adoption building on top of a network already leading all chains in on-chain activity, and the bull case starts to feel less like optimism and more like a technology gap compounding.
When a chain is measurably ahead on throughput and real usage, and institutions start flowing capital in through regulated vehicles, the price tends to follow eventually.
What makes this prediction more interesting than a simple number is the specificity of the bear case.
Perplexity is not just saying macro could be bad. It names the Pump.fun class-action lawsuit that now includes Solana Labs and the Foundation as defendants as a genuine risk, alongside the network’s historical outage problem and ongoing SEC classification uncertainty.
A bear scenario landing at $76 to $95 is actually the most grounded part of this entire outlook, and notably, the current price of $74.93 sits right at the edge of that range, which tells you exactly how much risk the market has already priced in.
Solana Price Prediction: When The Tech Finally Catches The Price
SOL price is at $74.93 today after a textbook V-shaped recovery off the $60 low printed earlier this month, and the daily chart is doing something it has not done convincingly since March.
It is making a higher low. The June bottom at $60 sits above the February flash low near $65 on an intraday basis, and the recovery since then has been sharper and more sustained than any of the failed bounces between March and May.
That structural shift from lower lows to potential higher lows is the first technical ingredient any meaningful trend reversal needs.
The $80 level is now the critical short-term decision point, the same shelf that broke down in late May and where the overhead supply from that breakdown now sits.
Getting through $80 on a daily close and holding it would be the first genuine sign that this recovery has legs rather than just momentum.
Above it the $90 to $100 region becomes the next meaningful test, and clearing that opens the path toward the $120 to $140 zone where Perplexity’s base case starts to become visible on the chart.
The RSI is the most striking element of the current picture. At 51.62 with the signal line at 31.23, the gap between them is over 20 points, the widest divergence in this entire series of predictions today.
Momentum was absolutely buried during the June flush and has now rocketed all the way back to the midline, crossing neutral territory faster than at any point in the past several months. An RSI that recovers this aggressively from deeply oversold levels and crosses 50 without pausing tends to signal the beginning of a new directional phase rather than just a bounce.
Perplexity’s $225 to $375 target requires Solana to sustain that momentum for months. The RSI is suggesting the fuel is there. The chart just needs $80 to confirm it.
You Might Like What Perplexity AI Predicts About This New Layer 3 Called LiquidChain
Large caps are not in trouble. They are just out of the room. Bitcoin, Ethereum, and XRP have been testing the same ceilings for weeks with nothing breaking through.
Every macro catalyst has a new arrival date. Every institutional wave has a new quarter attached to it. Holding assets where the next leg depends entirely on someone else’s decision is not a trade. It is a waiting room.
The money that wins cycles never announces where it is going.
The capital that actually moves in cycles relocates before the destination has a name.
Small market cap infrastructure plays operate on physics that large caps simply cannot replicate. A rotation that would not register as a rounding error at Bitcoin’s scale can reprice an undiscovered project by multiples.
The opportunity lies in the distance between what something is genuinely worth and what the market has assigned it so far. That distance shrinks to zero the moment discovery happens. Before that moment, it is fully capturable.
Multi-chain fragmentation is one of the most consistently expensive problems in DeFi, and it has never been solved. Bitcoin, Ethereum, and Solana exist as completely isolated systems. No shared architecture. No native interoperability. Every time value moves between them, the disconnection extracts its cost in fees, slippage, and failed transactions. That cost hits every single crossing every single time.
LiquidChain makes the crossing free, as Perplexity AI predicts. All 3 networks inside one execution environment. Single deployment. Complete ecosystem access. No tax on any interaction.
The presale is at $0.01454 with just over $840,000 raised. Early and undiscovered.
Execution is unproven. Adoption is unknown. Established assets offer predictability toward a ceiling that the market already sees. LiquidChain is an entry point that does not exist once the market finds it.
Explore the LiquidChain Presale
The post Perplexity AI Predicts Explosive Solana Price Prediction by End of 2026 appeared first on Cryptonews.


US Senator Cynthia Lummis says the CLARITY Act would direct $150 million to law enforcement to track scammers and other bad actors across digital asset markets.
The money would bolster the Financial Crimes Enforcement Network (FinCEN), the Treasury bureau that tracks suspicious money flows, as the market structure bill advances through the Senate.
What the Funding Targets
Crypto fraud has reached record levels. Americans reported losing $9.3 billion to crypto-related internet crime in 2024, FBI data show.
Victims over 60 reported the heaviest toll, nearly $5 billion, across all online fraud.
Supporters, including Lummis and the Crypto Council for Innovation, say the bill provides an additional $150 million to FinCEN. That figure appears in advocacy materials rather than the committee’s official fact sheets.
Follow us on X to get the latest news as it happens
The money would back expanded anti-money laundering programs, suspicious activity reports from newly covered exchanges, and blockchain analytics tools.
It would also support a pilot that lets firms share threat data with federal investigators.
The bill further tightens rules on digital asset kiosks, a fast-growing fraud channel.
Losses at Bitcoin ATMs topped $65 million in the first half of 2024, and people 60 and older bore about 71% of that total, the FTC reported.
Providers would also gain a safe harbor to pause suspicious transactions at law enforcement’s request.
Readers can review the CLARITY Act explainer for the full framework.
Where the CLARITY Act Stands Now
The House passed the CLARITY Act in July 2025 by a vote of 294 to 134. The Senate Banking Committee then advanced it on May 14 in a 15-9 bipartisan vote.
It now moves to the full Senate, where supporters want action as soon as June. The bill had already survived earlier Senate scheduling delays, and lawmakers have floated a bipartisan follow-up bill.
Critics, including Senator Elizabeth Warren, warn that the framework could still leave gaps for illicit finance.
The $150 million surviving final negotiations may test how hard the bill can be sold as a crypto market structure rulebook when senators take it up.
The post US Wants to Spend $150 Million Hunting Crypto Scammers Under New CLARITY Act appeared first on BeInCrypto.
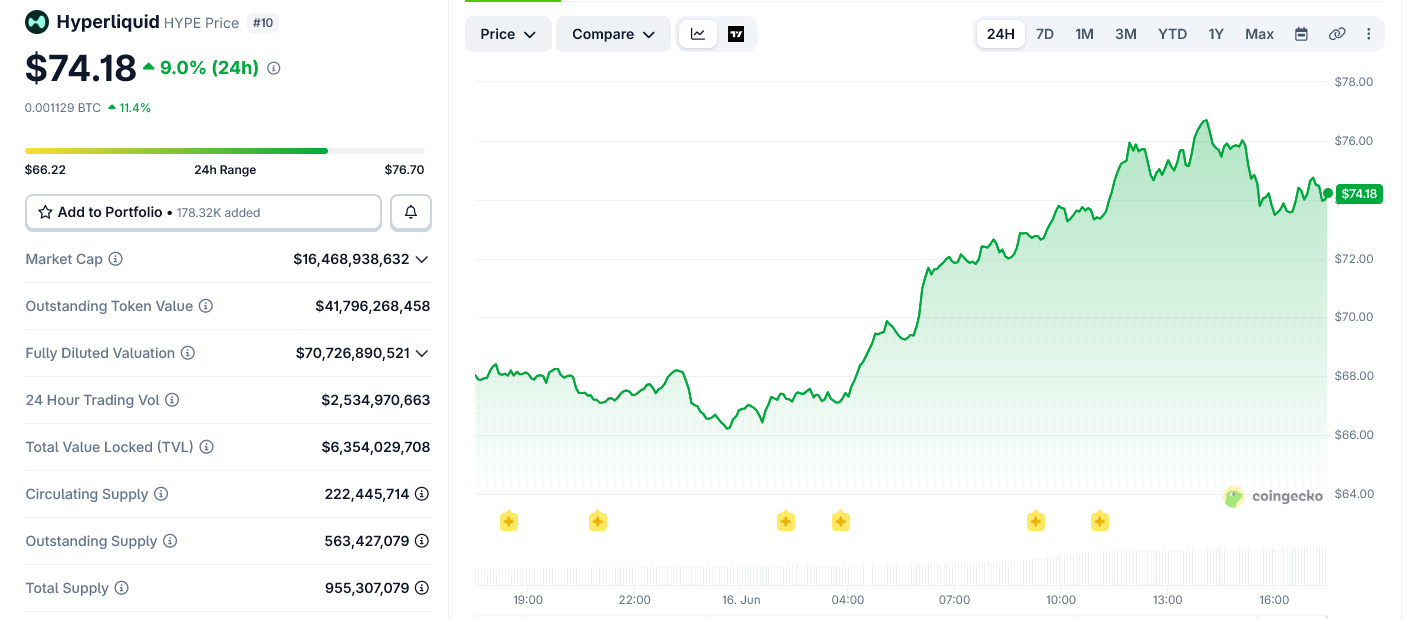
Hyperliquid (HYPE) printed a record high near $77 on June 16. HYPE hits an ATH, with the price climbing nearly 10% in a single day as spot exchange-traded fund (ETF) inflows accelerated.
The token now trades around $74.61, up roughly 67% over the past year. Its market capitalization sits near $16.57 billion, making it the tenth-largest cryptocurrency.

Institutional Money Rotates Into HYPE
The move arrives as institutional capital tilts toward HYPE. On June 15, spot Bitcoin funds bled while Hyperliquid products gained, part of a broader rotation across crypto ETFs.
Spot HYPE ETFs have drawn about $153 million in net inflows and nearly $900 million in volume since launch. Three products hold the token directly, namely 21Shares’ THYP, Bitwise’s BHYP, and Grayscale’s HYPG.
Efe “Crypto Kid” Kelemci, a member of the BeInCrypto Market Intelligence Experts Council, shared his exclusive comment. He ties that demand to the protocol’s economics.
“Hyperliquid’s revenue-generating business model stands out as especially attractive to institutions because its roughly $850 million in 2025 revenue saw 99% directed to buying and burning $HYPE tokens … pointing to even higher institutional inflows ahead.”
That utility helps explain the pull. Hyperliquid’s perpetual futures markets enable traders to access assets such as equities and pre-IPO names. That includes the SpaceX contract, which drew heavy volume before its public debut.
The flow timing reinforces the story. After a brief net outflow around June 5, ETF demand snapped back hard. One of the largest single-day inflows landed on June 15 as the price recovered.

Leverage Cuts Both Ways as Liquidations Spike
Strong inflows tell only half the story. Leverage on Hyperliquid has run hot since mid-May, and the data flags two-sided risk.
Long liquidations spiked in early June when prices pulled back from local highs. More recently, short liquidations have climbed as the token grinds higher, suggesting a squeeze is helping power the breakout.
The leverage backdrop also shaped a notable exit. Arthur Hayes sold his entire HYPE position above $72 in early June, then denied a reported buyback days later.
His departure offered a bearish counterweight to the bullish flows. Yet HYPE pushed to a record without him, a point traders have seized on.

What’s the Next Price Target for HYPE?
The daily chart frames the upside. HYPE reclaimed the 1.272 Fibonacci extension at $70.04 and now eyes the 1.618 extension near $83.55 as a first target.
A second target sits at the 2.0 extension around $98.47. The relative strength index is about 63, rising but not yet overbought, leaving room before momentum stretches.
One caution stands out. Volume has declined as price advanced, a divergence worth monitoring. The previous record at $59.41 now acts as support, with deeper backup near $51.05 along an ascending trendline.

Kelemci’s weekly chart shows HYPE trading in the upper half of an ascending channel since late 2024. That structure projects toward roughly $128 if the trend extends.
Kelemci also notes HYPE has gained 164% since the start of 2025. Over a similar span, Bitcoin fell 42%, and Ethereum dropped 57% from their peaks. He frames a far larger ceiling.
“If it scales to Tier-1 exchange volumes and launches spot trading, reaching a market capitalization similar to Robinhood’s roughly $70 billion would imply a token price well above $300, with the burn mechanism potentially allowing it to soar much higher.”

For now, the setup is binary. Hold the prior breakout above $59.41, and the path toward $83 and $98 stays open. Lose it, and the record run cools fast.
The post Hyperliquid’s HYPE Just Hit a New All-Time High: Experts Now Weigh $300 Target appeared first on BeInCrypto.
President Donald Trump dismissed reports that the United States will pay Iran billions as fake news, yet crypto keeps surfacing in the debate over a proposed $300 billion reconstruction fund tied to the new US-Iran framework.
The confusion stems from a preliminary memorandum of understanding that Washington and Tehran expect to sign on June 19. Online, traders quickly asked whether any payout could move through Bitcoin (BTC) or stablecoins.
What the $300 Billion Fund Actually Involves
Vice President JD Vance addressed the figure on CBS on Monday. He said Iran could reach the money only by honoring its commitments, and that Gulf states, not American taxpayers, would supply it.
“That’s the sort of thing they could have access to, funded by the Gulf coast coalition, so long as they honor their end of the obligation,” the Hill reported, citing Vance.
Follow us on X to get the latest news as it happens
Trump pushed back harder on Truth Social. He rejected the payout claim while touting Iran’s pledge to drop nuclear weapons.
The two sides have pitched different deal terms throughout the talks.
“…the story that the U.S. is paying Iran 300 million Dollars is Fake News, put out by the Dumocrats!!!” Trump wrote.
No public version of the draft mentions a fixed payout.
The deal instead ties any Gulf investment to nuclear limits, weapons inspections, and the reopening of the Strait of Hormuz.
Why Crypto Entered the Iran Conversation
No public text in the framework mentions digital assets. Still, Iran’s record made the leap easy for speculators to make.
Tehran has leaned on crypto to dodge sanctions for years. On June 2, the US Treasury blacklisted four Iranian platforms, including Nobitex, Iran’s largest exchange.
Treasury said Nobitex alone processed more than half of Iran’s crypto inflows in 2025, much of it IRGC-linked.
Tehran has also floated Bitcoin tolls for ships crossing the Strait of Hormuz. That history keeps digital assets close to the story, even without a formal role.
The framework still moved markets. Bitcoin reached a two-week high on ceasefire optimism, a swing that wiped out roughly $246 million in short positions.

The signing on June 19 should clarify the actual terms. Until then, the gap between Trump’s denial and Tehran’s messaging will likely keep crypto speculation alive.
The post Trump Says No $300 Billion for Iran, So Why Is Crypto Part of the Conversation? appeared first on BeInCrypto.
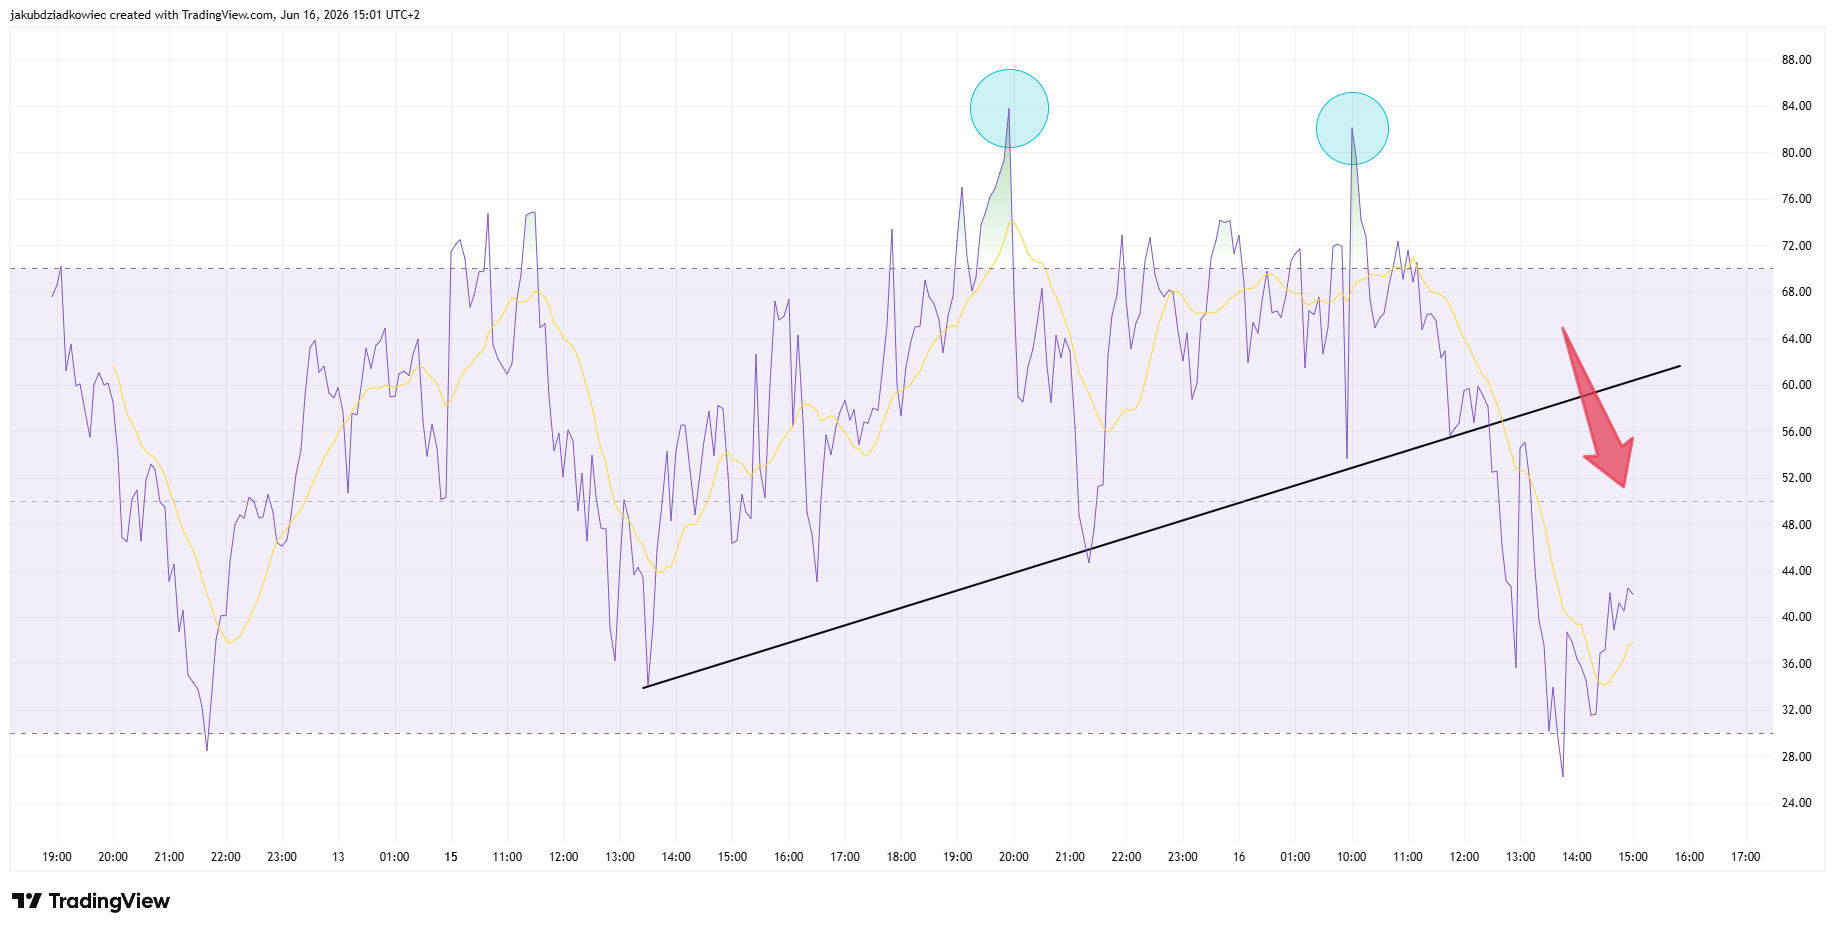
SpaceX (SPCX) climbed into the world’s most valuable companies this week, then stalled. The SpaceX stock spiked near $212 on Tuesday before sliding back toward $202, leaving its first clear sign of fatigue on the chart.
The pullback arrived three sessions after the IPO at $135, with the rocket maker briefly worth about $2.8 trillion at its premarket high. That figure pushed it close to Amazon before the gains faded.
Momentum Fades as RSI Rolls Out of Overbought
The relative strength index tells the clearest part of the story. During the run toward $214, RSI pushed into overbought territory near the 80 mark on the five-minute chart (blue circles).
It has since rolled over and slid toward the low 40s. In plain terms, the buyers who powered the debut are losing short-term control (red arrow).

The signal stays soft until RSI reclaims the 60s while price pushes back above the $214 high. Until then, momentum favors sellers on the intraday timeframe.
Ranking and ETF Demand Tell a Stronger Story
The momentum picture looks weak, yet the structural demand behind SPCX stock does not. The latest ranking shows SpaceX sitting sixth among the world’s largest companies, with a market capitalization of about $2.52 trillion.
That places it ahead of Taiwan Semiconductor (TSMC) at $2.29 trillion and just behind Amazon at $2.65 trillion. The premarket spike briefly lifted SpaceX above Amazon for the fifth time before it settled back.

Demand has also been broad across markets. Issuers rushed leveraged SpaceX ETFs to market, while traders cleared $1.4 billion in SPCX perpetuals on a single decentralized venue when several exchanges ran short of shares.
SpaceX Stock Hinges on the $201 Fibonacci Support
A Fibonacci retracement drawn from the $214.77 high down to the $157.41 first-session low maps the levels that matter now. Price near $202 is pinned to the 0.236 level at $201.23.
Holding that line keeps almost the entire run intact and signals a shallow, healthy pause. A clean break opens the 0.382 level at $192.86, which also marks Monday’s regular-session close.
Below that sits the 0.5 midpoint at $186.09 and the 0.618 golden pocket at $179.32. The golden pocket lines up with the early post-debut spike high, so it forms the strongest support on the chart.

The risk is that the leverage stacked through new ETFs amplifies any slide. Skeptics have already flagged the valuation as stretched. Ipek Ozkardeskaya, senior analyst at Swissquote Bank, said:
“We can say with certainty that this valuation makes absolutely no sense today. People are buying SpaceX in the expectation that others will buy too and push the price higher – that’s speculation.”
Defending $201 keeps the uptrend alive and points back toward the $214 ceiling. Losing it shifts attention to $193, then the $179 golden pocket that could decide whether this is a pause or a deeper unwind.
The post SpaceX Hits $2.8 Trillion and Sixth Place, but the Chart Flashes Its First Warning appeared first on BeInCrypto.
Crypto World
Strategy’s investors are may be rotating out of its preferred stock for another crypto rival
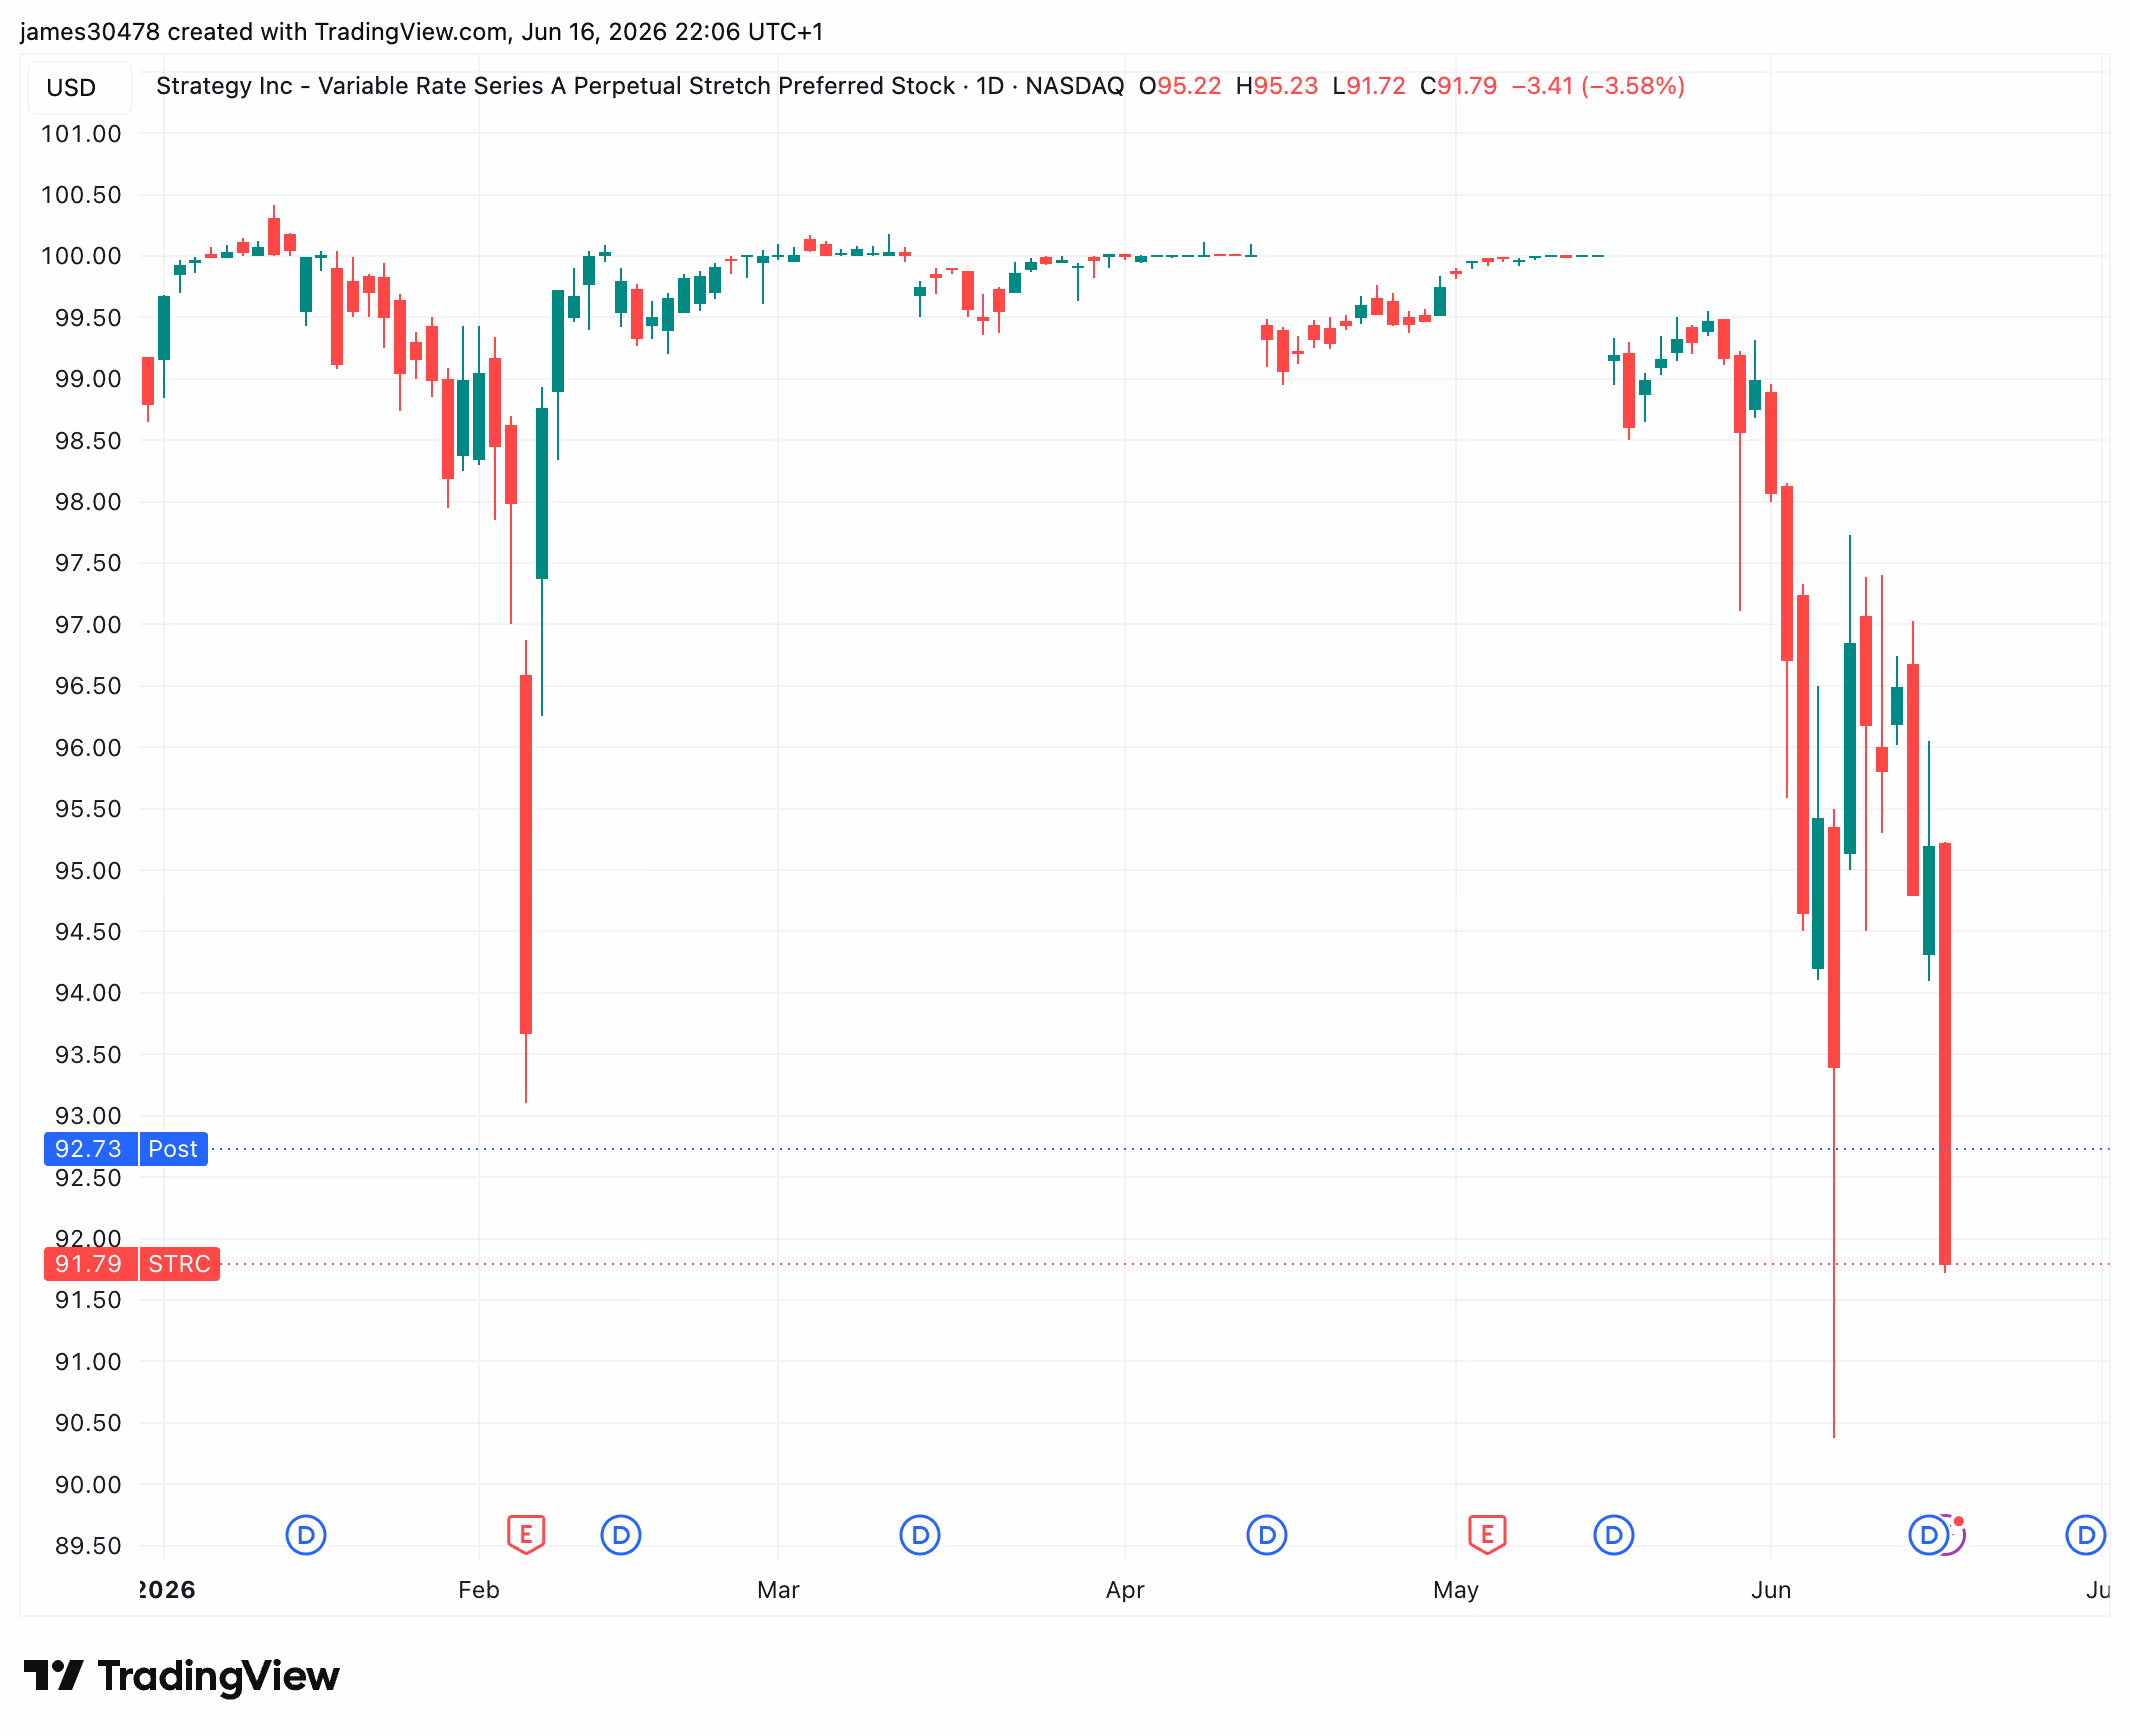
Strategy’s (MSTR) dividend-paying preferred stock, STRC, closed at $91.79 on Tuesday, its third-lowest since trading began in July 2025, amid lower bitcoin prices and debt concerns.
The only lower closes occurred during two sessions later that month, when STRC fell to as low as $88.60. The security was initially priced at approximately $90 in its debut.

STRC was designed to trade as close as possible to its $100 par value. However, it has remained below that level for an extended period and has not traded at $100 since May 15, last month’s ex-dividend date.
Historically, STRC would trade near its $100 par value ahead of the ex-dividend date, the cutoff after which new buyers are no longer entitled to the upcoming dividend. Once the stock went ex-dividend, it often declined by roughly the value of the dividend before gradually recovering toward par, but on June 15, STRC never reached par.
Several factors appear to be contributing to STRC’s persistent weakness.
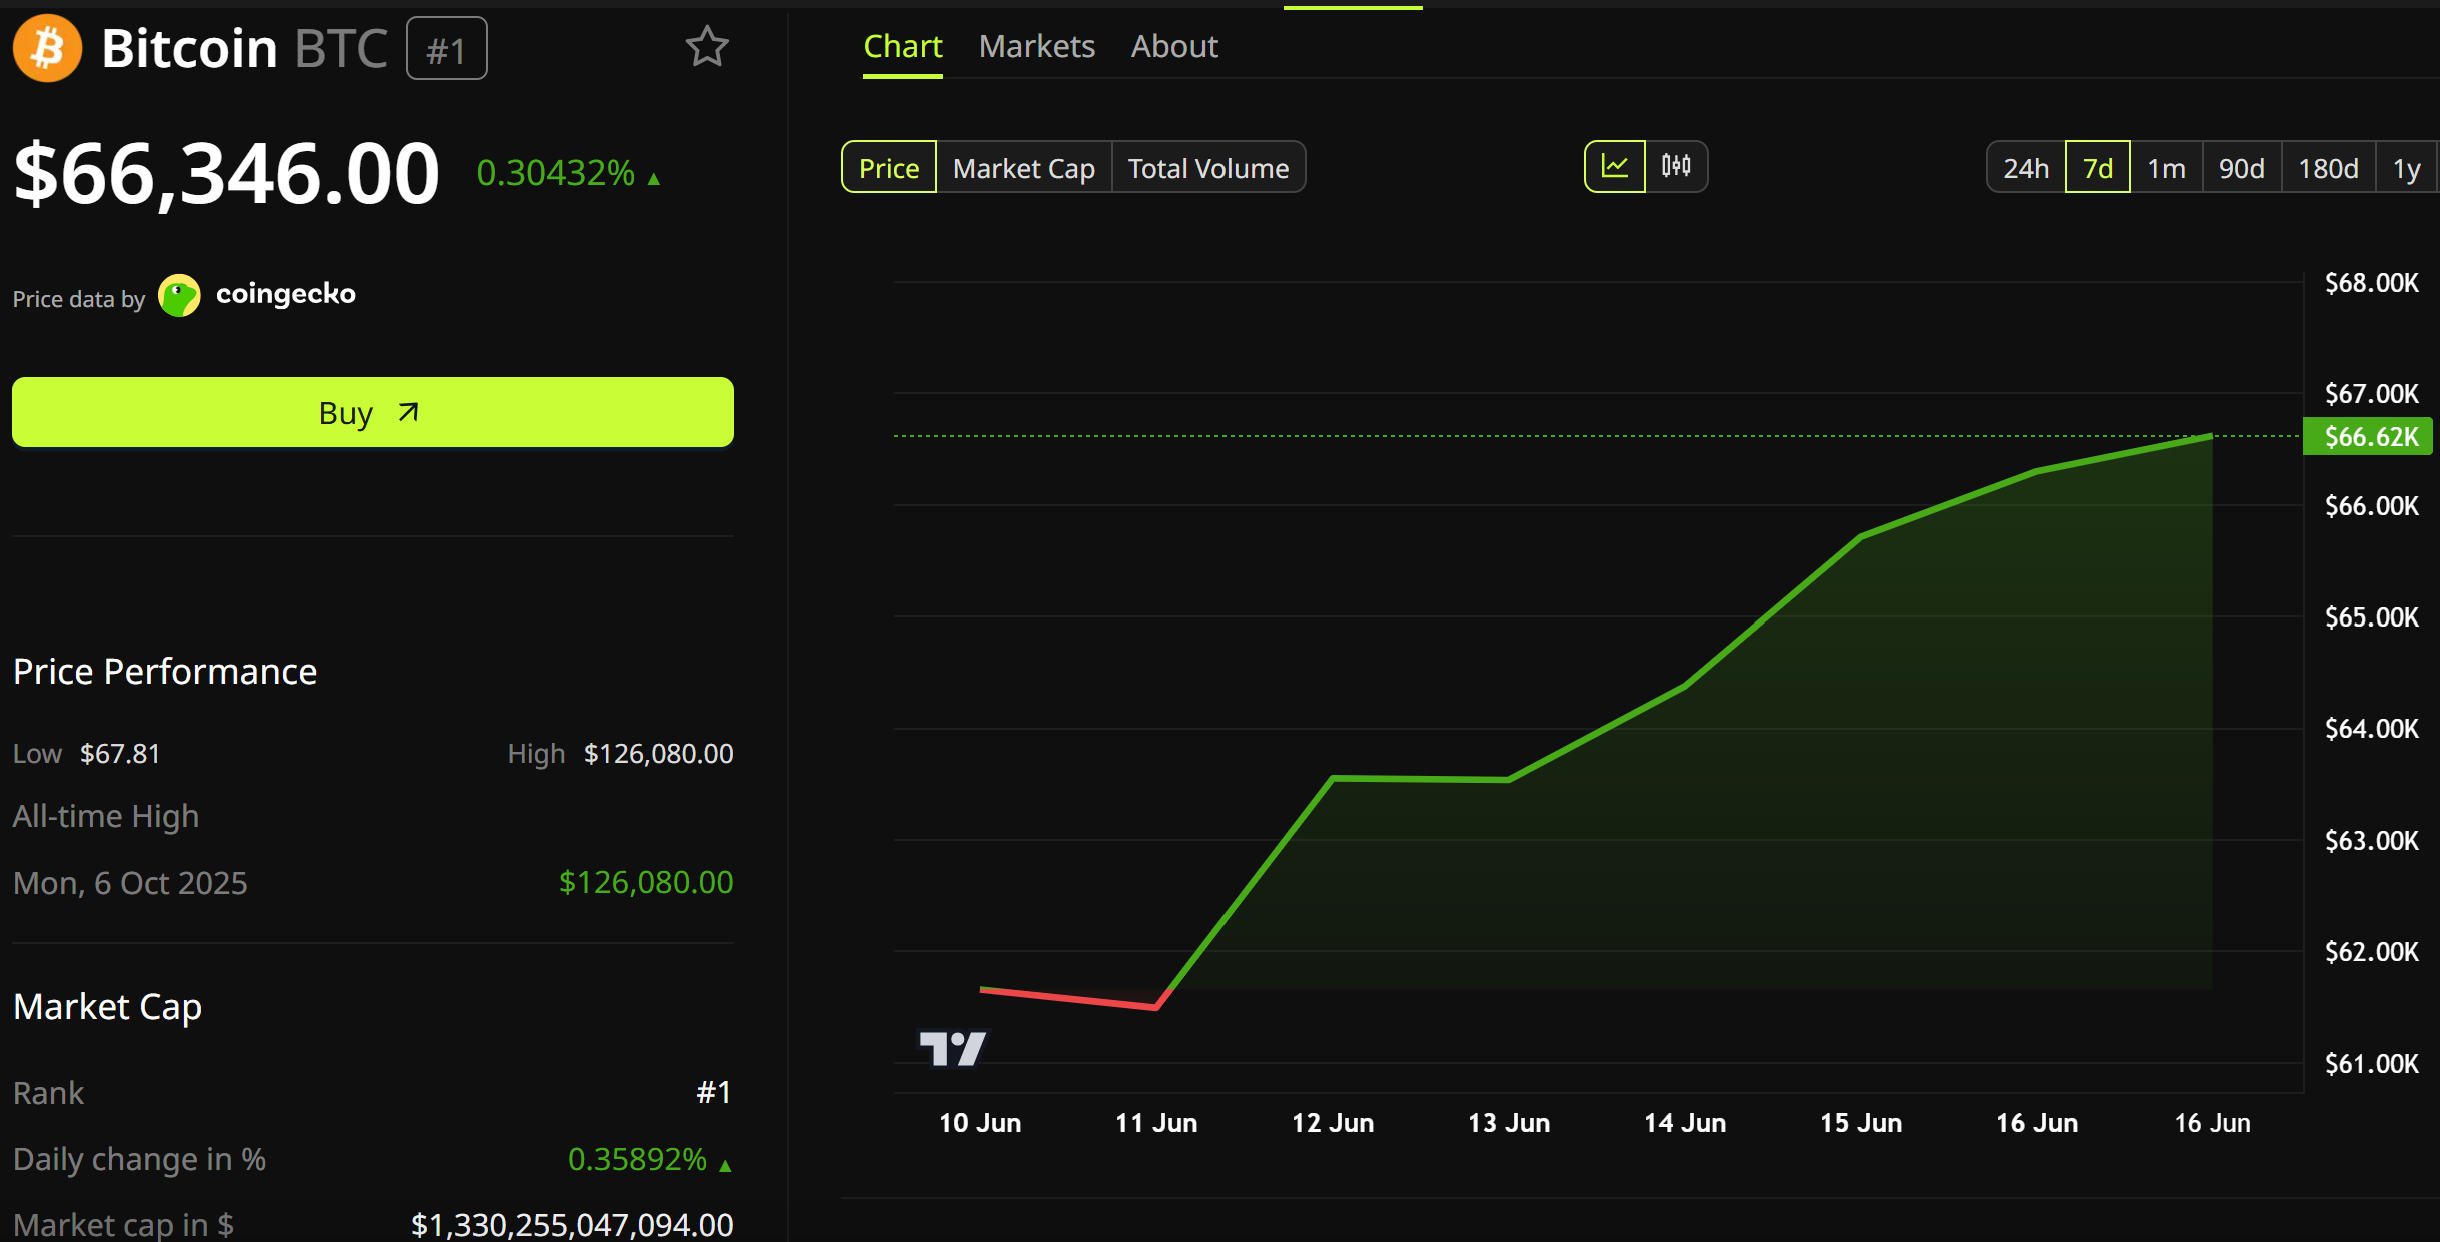
First, the security has historically traded in tandem with bitcoin, and bitcoin remains under pressure, hovering around $65,000 and roughly 50% below its October all-time high.
Crypto World
Collector Crypt Fees Jump 129% in a Week as Solflare Brings Card-Pack Trading Into the Wallet


Collector Crypt, the Solana-native platform that tokenizes graded physical trading cards for on-chain trading, posted a 129% week-over-week jump in fee revenue after Solflare embedded its card-pack mechanic directly into the wallet interface. The platform generated $3.86 million in fees over the… Read the full story at The Defiant
Avalanche (AVAX) became one of the most discussed cryptocurrencies on Monday despite the broader market rally, as growing skepticism around the network fueled social media debates.
According to Santiment, many users are questioning whether Avalanche can still compete with faster-growing blockchains such as Solana and Sui.
Lagging Devs and Users
Much of the criticism has focused on concerns that developer activity, user adoption, and overall ecosystem growth are moving away from Avalanche toward rival networks. Santiment’s sentiment data revealed that market mood around AVAX has dropped sharply, pivoting from one of its most bullish phases earlier this year to one of its most bearish periods.
However, the analytics platform stated that extreme negative sentiment can sometimes create opportunities for reversals in the market. Despite the rising criticism, Avalanche continues to maintain institutional partnerships, government-linked initiatives, and its subnet technology, which remains a major feature of the network.
Meanwhile, stats from the Developer Report by Electric Capital revealed Solana leads with 795 full-time developers (each contributing 10+ days monthly), whereas Sui has 202 such developers, and Avalanche is behind with only 168. Furthermore, the total developer counts show Solana leading at 2,555, Sui at 656, and Avalanche at 484. The metric considers only original code authors, while excluding developers involved in merged pull requests, forked commits, and automated bot activity.
AVAX Market Performance
AVAX briefly moved above $7 this week as the broader crypto market recovered. The token gained nearly 4% in the past 24 hours. The rally also comes amid growing attention around FIFA’s partnership with Avalanche during the ongoing 2026 World Cup. FIFA is using a custom Avalanche blockchain to support ticketing, loyalty programs, and digital collectibles for fans across the world.
The Layer 1 network, announced in May 2025, powers FIFA Collect, the organization’s official collectibles platform developed with Modex. Fans can use Right-to-Ticket collectibles to access official World Cup tickets through a special portal before matches. The partnership has also reportedly helped Avalanche attract new users.
Zooming out, however, AVAX is still over 26% down over the past month. Additionally, the price has fallen by over 76% from its September 2026 high of $30.
The post Is Avalanche Falling Behind? Social Media Debates Heat Up Over AVAX Growth Slowdown appeared first on CryptoPotato.

Coinbase has unveiled an SEC-registered AI investment advisor alongside new trading products as the company has continued expanding beyond crypto in its push to become an “Everything Exchange.”
Summary
- Coinbase unveiled an SEC-registered AI advisor that can help users manage portfolios through natural language commands.
- The exchange plans to launch stock options, crypto options, prediction markets, and 24/7 stock index perps.
- Coinbase will expand its pre-IPO perpetuals program with upcoming offerings tied to OpenAI and Anthropic.
According to announcements made during Coinbase’s System Update event, the exchange is introducing an AI-powered advisory service, expanding access to derivatives and prediction markets, and preparing new pre-IPO trading products tied to some of the world’s largest private technology companies.
The latest product rollout comes as Coinbase continues adding traditional financial products to its platform after recently revealing plans to launch tokenized stocks backed one-for-one by underlying shares.
AI tools move closer to managing user portfolios
At the center of the announcements was Coinbase Advisor, which Chief Executive Officer Brian Armstrong described as one of the first SEC-registered AI-powered investment advisors in the world.
Armstrong said the tool will have access to a user’s portfolio information and account history, allowing customers to interact with the advisor using natural language commands.
“Speak to it in plain English to take action on your account. It will even prompt you with ideas you hadn’t thought of,” Armstrong said during the presentation.
Alongside the advisor, Coinbase revealed that artificial intelligence agents can now connect directly to its platform. Using systems such as ChatGPT or Claude, customers can establish trading rules and permit AI agents to execute trades on their behalf.
The announcement follows a growing industry focus on agentic finance. Earlier this week, crypto and stock trading platform Robinhood introduced AI-powered account management tools that allow clients to deploy automated agents to oversee trading activity.
New markets extend beyond crypto trading
Elsewhere during the event, Coinbase announced plans to launch stock options trading this summer, while crypto options are scheduled to arrive later this year.
The exchange also disclosed plans to offer perpetual-style stock index products that can be traded around the clock, including by users in the United States. The move would extend the 24/7 trading model commonly associated with crypto markets into equity-linked products.
Additional trading features unveiled at the event include time-based prediction markets that allow users to speculate on future price movements across digital assets such as Bitcoin, Ethereum, Solana, XRP, and Hyperliquid. According to Coinbase, contracts will cover periods ranging from 15 minutes to one year.
Private market exposure is also becoming a larger part of the company’s strategy. Coinbase announced plans to expand its pre-IPO perpetual contracts program following the launch of SpaceX pre-IPO perps ahead of the aerospace company’s record-setting public listing.
According to Coinbase, upcoming offerings will provide exposure to private companies, including OpenAI and Anthropic, before their shares become publicly available.
The new launches build on Coinbase’s previously announced tokenized stock initiative. The exchange has said those products will represent ownership interests backed 1:1 by underlying shares rather than synthetic instruments, derivatives, or IOUs.
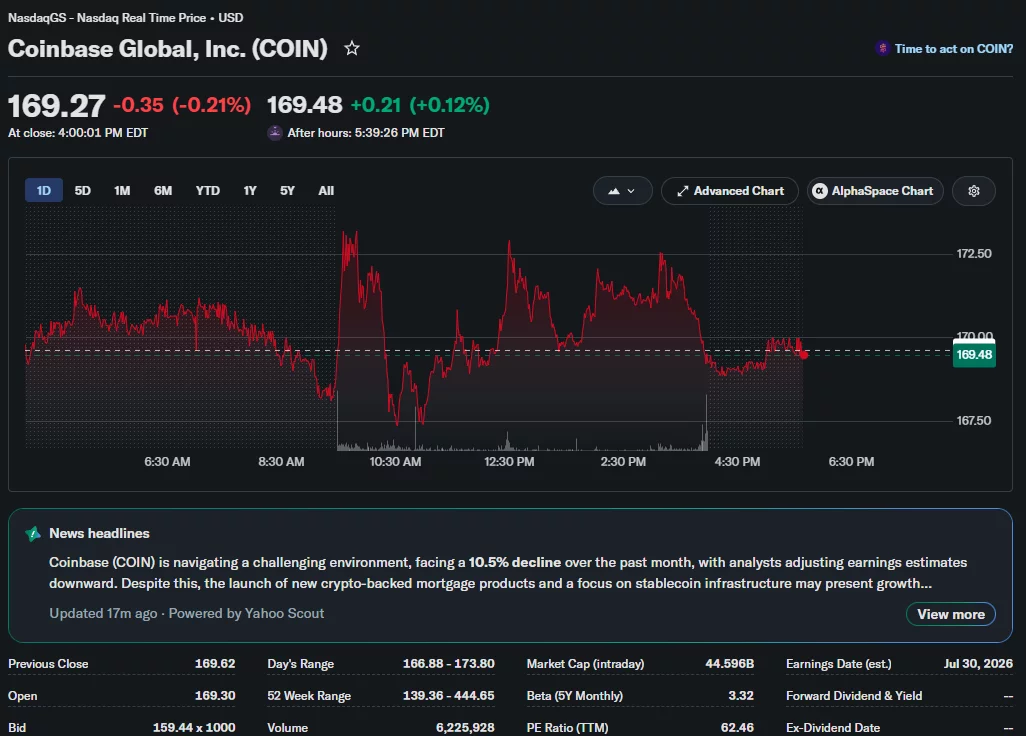
Investors responded positively to the announcements. Data from Yahoo Finance showed Coinbase shares climbing to roughly $170 during the trading session before easing slightly in after-hours trading. The stock exchanged hands near $169.2 at the time of writing.
Oil prices tumbled to two-month lows after the US and Iran reached a peace deal to reopen the Strait of Hormuz. Yet beneath the relief, traders are quietly positioning for a rebound.
The reason is a catch buried in the deal. Iran plans to charge a toll after a 60-day grace period, a cost the market may already be pricing into the months ahead.
An Iran Deal That Adds a Toll to a Fifth of Global Oil
The deal reopens the Strait of Hormuz, the waterway that carried roughly one-fifth of global oil before the war shut it. Before the conflict, ships paid nothing to pass.
Want more insights like this? Sign up for Editor Harsh Notariya’s Daily Newsletter here.
Iran now says it will collect “service fees” once a 60-day toll-free window ends. President Trump calls the reopening permanently toll-free, while Vice President JD Vance and Iran point to fees after the 60 days.
Markets took the truce as relief. Brent crude oil price fell about 5% to near $83, and WTI crude oil price slid to under $80, both at multi-month lows.
That drop reflects near-term supply relief. The futures curve tells a more cautious story.
The Curve Cooled, but Positioning Turned Bullish
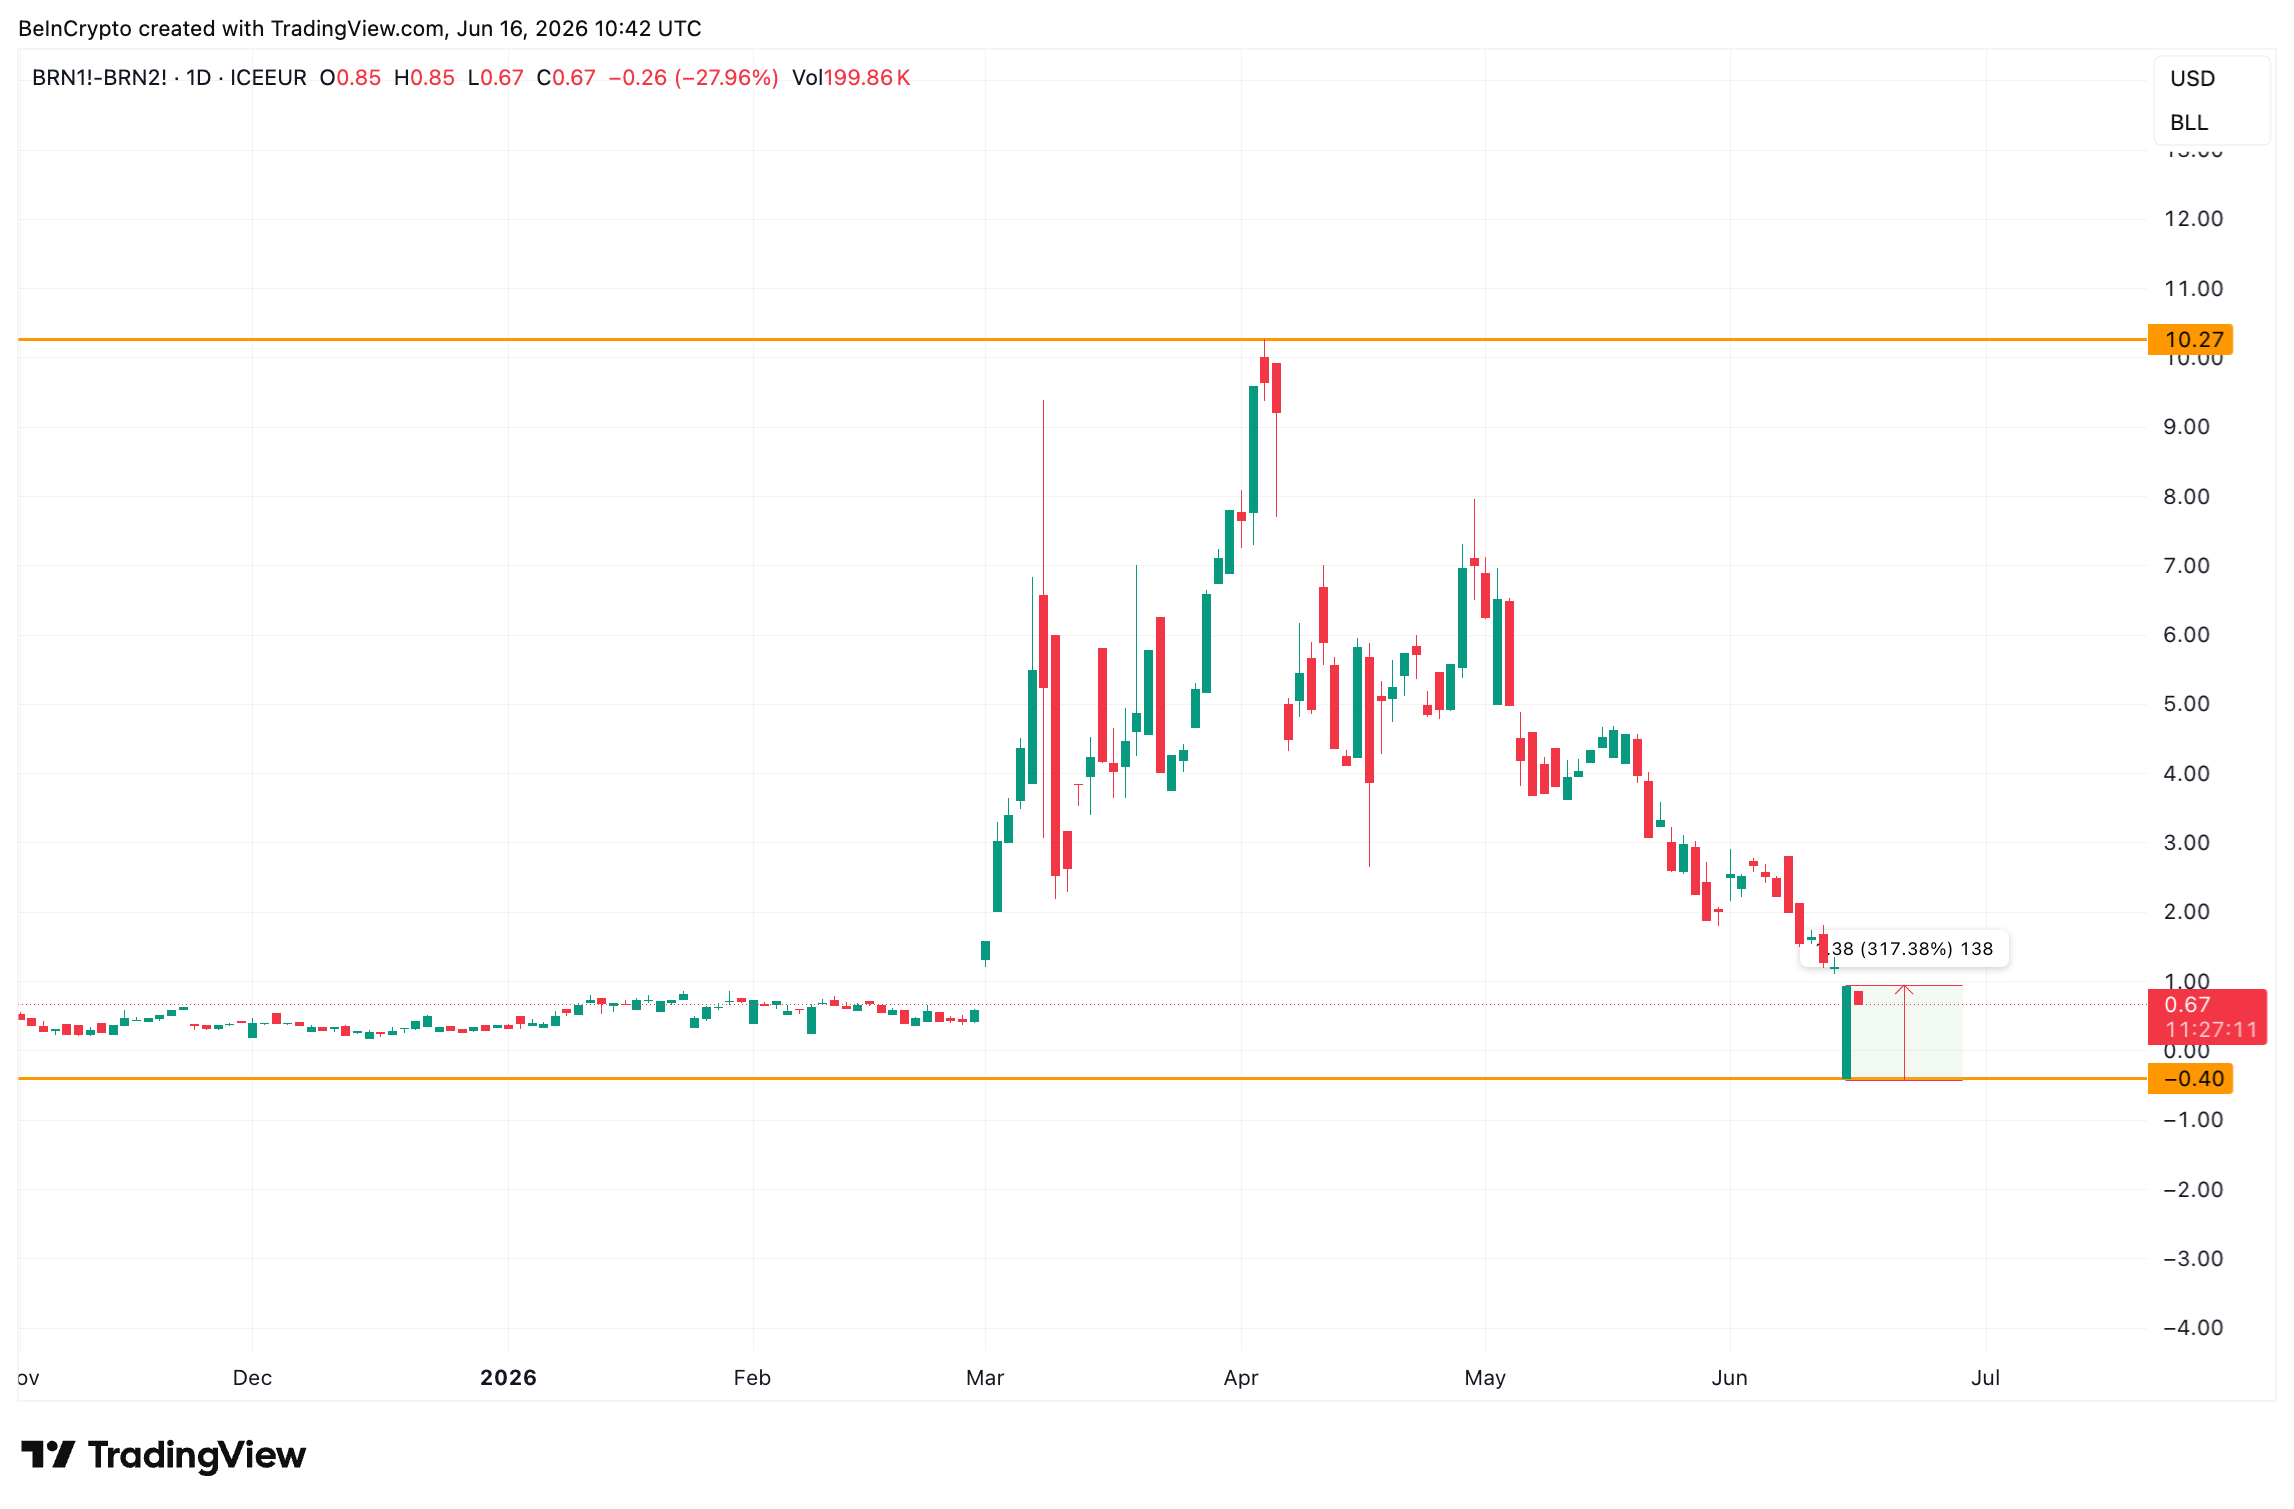
During the war, the backwardation in Brent went extreme. Backwardation means the front-month contract trades above the later-month contracts, a sign of near-term scarcity.
The spread between the first and second Brent contracts hit about $10.27 in April. It has since collapsed to roughly $0.67, so the market sees the immediate shortage easing. Still, the spread stays positive.
Brent shows mild backwardation rather than flipping into contango, where later months trade above the front. The near-term squeeze has cooled, but the market is not yet pricing a glut.

Positioning leans the other way. In the latest Commitments of Traders report, a weekly CFTC snapshot of who holds futures, speculators cut short bets by about 9,300 contracts by June 9.

Options say the same. On the United States Brent Oil Fund (BNO), the put-call ratio sat near 0.08, meaning calls vastly outnumbered puts. Call buying continued to grow, with the ratio dropping to 0.06 as the toll news broke.

So the curve has priced the reopening, while traders bet on what comes after. The size of that bet depends on the toll.

BRN2 is only about a month further out, and the front contract still trades above it, so the curve has calmed without turning bearish. That leaves room for the toll to retighten it, which aligns with the bullish positioning.
What a Hormuz Toll Could Do to Oil Prices
Here is the math. Before the war, Brent traded near $70 with zero transit cost. The Strait moves about 7.6 billion barrels of oil a year.
A toll of $0.50, $1, or $2 per barrel would hand Iran roughly $3.8 billion, $7.6 billion, or $15.2 billion a year. The $1 level is not hypothetical. During the conflict, an informal $1-per-barrel fee was being levied. Tolls of up to $2 million per voyage were reported.
The direct cost is small and mostly absorbed by producers at first. The bigger lever is the risk premium, the extra price markets pay for supply uncertainty.
That premium bites harder now because the cushion is thin. The US Strategic Petroleum Reserve, the national emergency stockpile, just hit a 43-year low.

From a normalized reopening near $80, analysts estimate a smooth toll could add $2 to $6, while a messy one could add $10 or more. That points to Brent in the high $80s to mid $90s, with a path back above $100 if the reopening turns disorderly.
To be clear, the $1 toll, or even $2, does not push Brent to $100. That tail runs through disruption, not the fee. A contested rollout that chokes traffic again would revive the war-era risk premium. That fear, not the charge, sent Brent above $100 during the conflict.
Expert and market signals line up with that risk.
Oil Prices, Forecasts, and the Bets Point the Same Way
Industry leaders have flagged the upside. Executives at Chevron and ExxonMobil warned the physical Brent oil price could spike toward $150 to $160 if inventories keep draining.
The US Energy Information Administration (EIA) expects Brent to average about $105 in June and July before easing later. Goldman Sachs trimmed forecasts on the deal but warned of renewed volatility if Hormuz does not reopen cleanly.
Prediction markets agree at the margin. On Polymarket, bettors put the odds of crude hitting a record at roughly 16% by December 31, still the most-backed window even after the deal cooled the odds.

For now, oil prices sit near two-month lows: Brent around $83 and WTI near $80. The next CFTC positioning report, the first to capture the toll news, will show whether the bullish lean held.
A clean, toll-free reopening would let oil prices keep easing toward the EIA’s high $70s path. A contested service-fee regime after 60 days would re-tighten the market and push it back toward the high $80s and beyond.
The post How Would a Hormuz Toll Affect Oil Prices? appeared first on BeInCrypto.
Cambs man sexually assaulted woman who helped him after he collapsed

Verizon drops activation and upgrade fees with new simplified plans

Perplexity AI Predicts Explosive Solana Price Prediction by End of 2026


-

 Business2 days ago
No Jackpot Winner as $257 Million Prize Rolls Over to $269 Million Monday Draw
-

 Crypto World5 days ago
Oppenheimer backs SpaceX as $70 billion retail frenzy builds
-

 Fashion4 days ago
Weekend Open Thread: Tuckernuck – Corporette.com
-

 Crypto World5 days ago
Markets Rally as SpaceX IPO Looms Amid Iran Tensions and Inflation Surge
-
 Crypto World2 days ago
Zimbabwe Requires Crypto Businesses to Register Annually Under New FIU Regulations
-

 Tech4 days ago
NanoClaw integrates JFrog registries to secure AI agent downloads
-

 Business7 days ago
Thailand Ranks Second Worldwide for AI Adoption Growth, Microsoft Reports
-

 Tech4 days ago
This Week In Security: Microsoft On Microsoft, Register Your Domains, Linux On ARM, And FreeBSD Joins The File Cache Club
-

 Crypto World4 days ago
Bitget enters Argentina’s regulated crypto market through PSAV registration
-
 Tech5 days ago
Dutton Ranch star claims they ‘didn’t see any disruption’ on set following Chad Feehan’s exit from Yellowstone spinoff fueled by Taylor Sheridan clash rumors
-

 NewsBeat5 days ago
El Nino has formed in the Pacific and could set records, forecasters say
-

 Politics5 days ago
Politics Home | Healey Resignation Is “Colossal Failure Of Government”, Says Former Labour Defence Secretary
-
 Tech7 days ago
‘This is Seattle’s position on AI’: City Council votes unanimously to pause big new data centers
-
 Entertainment5 days ago
Donnie Wahlberg & More Heat Up Las Vegas at Circa’s Barry’s Downtown Prime
-
 Tech5 days ago
Opendoor Ends India Operations, Fueling a Bigger Conversation About AI and Outsourcing
-

 Sports5 days ago
First Time Since 1971: Australia Register Historic Low In ODI Cricket
-

 Politics5 days ago
Belfast burns, while Met chief points finger at Iran and Russia
-

 NewsBeat4 days ago
FBI searches office of Ohio voter registration group
-

 Business5 days ago
AT&T: Verizon's 27% Outperformance Sets Up A Solid Entry Point
-

 Politics5 days ago
Modi thanks Trump for wishes as US attacks Indian seafarers
You must be logged in to post a comment Login