

Crypto World
DxSale Legacy Locker Exploit Drains $7.3M From BNB Chain Pools


TLDR
- DxSale’s legacy liquidity locker on BNB Chain suffered a $7.3 million exploit.
- Attackers reportedly targeted more than 1,400 old liquidity pools linked to DxSale contracts.
- Investigators traced 2,958 BNB from the attacker address to two main wallets.
- Tahax reported that DxSale locker ownership moved through around 89 wallets before the attack.
- Eyeonchain reported older backdoor claims tied to unlocking old DxSale LP positions.
DxSale’s legacy liquidity locker on BNB Chain suffered a $7.3 million exploit across old liquidity positions. On-chain investigators reported that attackers targeted more than 1,400 liquidity pools linked to outdated locker contracts. The incident has raised fresh questions around contract ownership changes, old DeFi infrastructure, and possible insider-level access.
Attackers Drain Old DxSale Liquidity Pools
Blockchain security firm PeckShield and on-chain analyst Tahax reported the exploit on DxSale’s legacy locker contracts. The attackers drained assets from old liquidity provider positions that remained locked on BNB Chain. DxSale gained wide use during the early BNB Chain token boom. Many memecoin projects used the platform to lock LP tokens and assure token holders.
Several of those contracts dated back to the 2021 market cycle. Many positions stayed untouched for years, which left substantial liquidity inside older contract structures. Investigators traced the primary attacker address to several post-exploit transactions. The address moved 2,958 BNB, worth about $1.87 million, to two main wallets.
The funds then moved through routes linked to multiple Binance deposit addresses. Separate tracking also showed swaps and mixer-related activity, including AnySwap routes. Researchers reported that the attackers used custom contracts to drain liquidity in batches. They also manipulated unlock timestamps and reduced fees close to zero.
Ownership Transfers Raise Questions
Tahax reported that DxSale’s deployer moved ownership of the legacy locker contract in August 2025. That transfer happened about 269 days before the attack. The migration did not come with a public statement from DxSale, according to the investigation. Ownership then moved through around 89 fresh wallets before reaching a new address.
That final address received funding through Bybit and bridge activity shortly before the main drain. Researchers linked this funding pattern to the later attack flow. Tahax described the wallet movement as an attempt to hide the trail. “Each hop adds plausible deniability,” the investigator wrote in a post on X.
The exploit centered on an unverified locked contract with a permission issue. The attackers used that weakness to create new locks on already locked positions. Community researchers also pointed to older claims of internal access. In August 2025, a user reportedly shared screenshots of a Telegram service offering to unlock old DxSale LPs.
Backdoor Claims Add Pressure on DxSale
On-chain investigator Eyeonchain reported that the Telegram operator claimed links to the DxSale team. The person allegedly offered to unlock LPs from projects launched before late 2021. The operator reportedly asked for a 20% cut from recovered funds. The only stated condition involved access to the original wallet used during the DxSale launch.
Eyeonchain wrote that the latest exploit made the old claims appear more relevant. He also raised the possibility of insider-level knowledge behind the attack. DxSale had not issued an official public response across its social channels in the reports reviewed. The silence added attention to the ownership trail and contract design.
The incident follows other recent DeFi exploits across wallets, bridges, and staking platforms. StablR, SquidRouterModule, Kelp DAO, and Drift Protocol also faced large reported losses. Security researchers linked the DxSale incident to risks in older DeFi systems. They pointed to missing timelocks, weak ownership controls, and outdated monitoring around legacy contracts. Experts advised users with old DxSale LP positions to review their contracts on BscScan. They also urged projects to withdraw accessible funds and move remaining assets to audited locking tools.


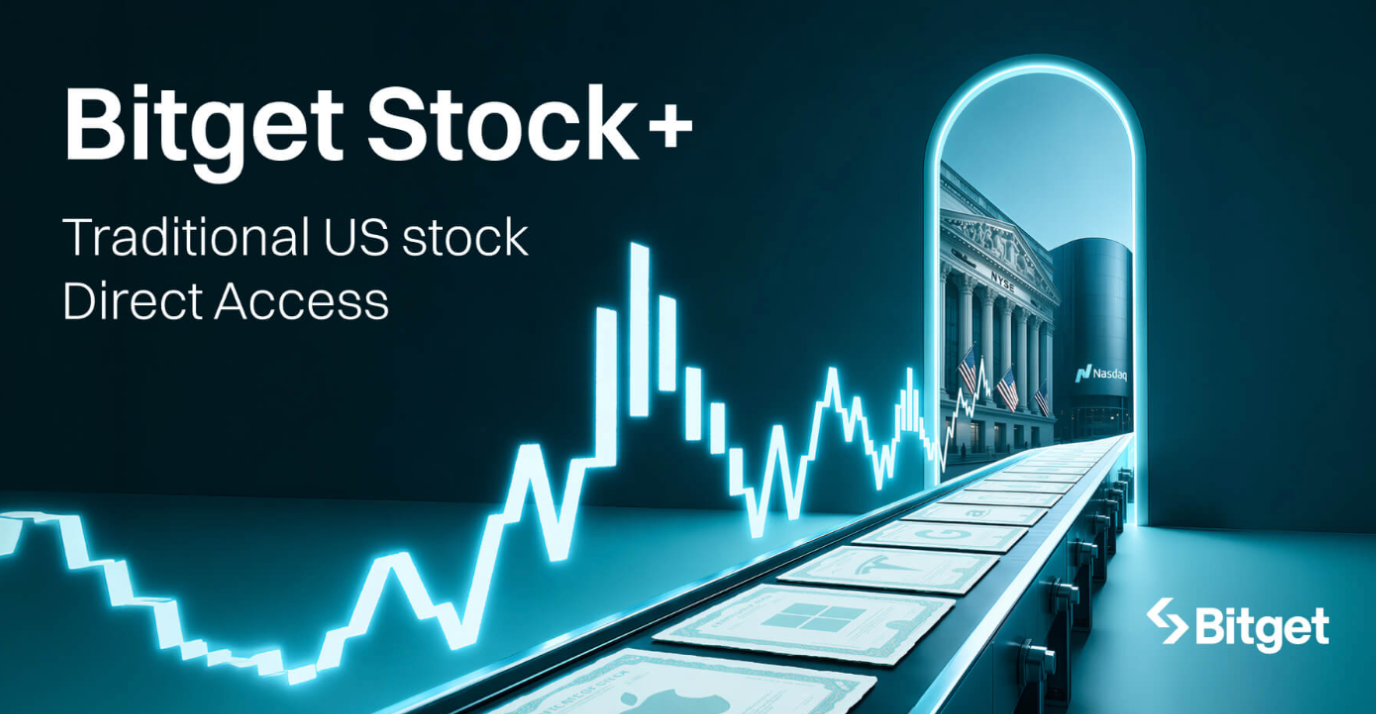

Bitget, the world’s largest Universal Exchange (UEX), has launched Stock+, a new feature under its Stocks 2.0 ecosystem that enables users to purchase real US stocks directly using USDC and other digital assets. The launch marks another step toward a future where crypto and traditional financial markets operate within the same account, allowing users to move between digital assets and equities without the fragmentation that has historically separated the two worlds.
For decades, access to US equities has depended on local brokers, bank transfers, account approvals, and jurisdiction-specific infrastructure. Stock+ introduces a different model. Users can fund their accounts with digital assets, convert them into USDC, and gain exposure to publicly listed companies through a streamlined, crypto-native experience. The result is a trading environment where global markets become increasingly accessible from a single platform.
Unlike synthetic products or derivatives, Stock+ provides ownership of underlying shares executed through regulated brokers. Users are eligible for cash dividends and stock split adjustments associated with their holdings, while trading hours remain synchronized with US pre-market, regular market, and after-hours sessions.
“Bitget was among the first exchanges to bring together crypto, tokenized assets, commodities, and equities under the Universal Exchange vision. Stock+ is the next evolution of that strategy,” said Gracy Chen, CEO of Bitget. “Access is important, but ownership matters too. Giving users access to real ownership of US-listed companies is how we actually bridge financial markets. The platforms that succeed will be the ones that combine access, ownership, and flexibility in a single experience.”
Stock+ also supports inbound stock transfers from participating brokers through standard transfer processes, allowing users to consolidate existing US equity holdings within a unified portfolio environment. Combined with crypto-funded purchasing, the feature expands the ways investors can access and manage traditional financial assets through Bitget.
With Stock+, Bitget adds direct ownership of US-listed equities to its growing suite of stock market products, further advancing its vision of a Universal Exchange where crypto and traditional financial markets coexist within a single platform.
In early June 2026, Bitget announced a major 2.0 upgrade to its stock-related services, kicking off with the launch of Reality, a regulated RWA protocol, and its issued tokenized stocks (rToken). To date, Bitget has listed over 500 leading US stocks and ETFs, including SpaceX, Tesla, and NVIDIA, with the Assets Under Management (AUM) of rToken exceeding $50 million. The introduction of Stock+ marks another pivotal step in the Bitget Stocks 2.0 evolution, offering users accustomed to traditional brokerage experiences a more seamless and intuitive interface for transfers and trading.
To celebrate the launch, Stock+ trading fees start from 0.1%, with a 50% promotional discount available through August 31, 2026.
To find out more, visit here.
About Bitget
Bitget is the world’s largest Universal Exchange (UEX), serving over 125 million users and offering access to over 2M crypto tokens, 100+ tokenized stocks, ETFs, commodities, FX, and precious metals such as gold. The ecosystem is committed to helping users trade smarter with its AI agent, which co-pilots trade execution. Bitget is driving crypto adoption through strategic partnerships with LALIGA and MotoGP™. Aligned with its global impact strategy, Bitget has joined hands with UNICEF to support blockchain education for 1.1 million people by 2027. Bitget currently leads in the tokenized TradFi market, providing the industry’s lowest fees and highest liquidity across 150 regions worldwide.
For more information, visit: Website | Twitter | Telegram | LinkedIn | Discord
Risk Warning: Digital asset prices are subject to fluctuation and may experience significant volatility. Investors are advised to only allocate funds they can afford to lose. The value of any investment may be impacted, and there is a possibility that financial objectives may not be met, nor the principal investment recovered. Independent financial advice should always be sought, and personal financial experience and standing carefully considered. Past performance is not a reliable indicator of future results. Bitget accepts no liability for any potential losses incurred. Nothing contained herein should be construed as financial advice. For further information, please refer to our Terms of Use.
The post Bitget Launches Stock+, Bringing Real US Stocks to Crypto-Native Investors appeared first on BeInCrypto.
Crypto World
Bitcoin (BTC) price is forming a bear flag that may signal crash to $55,000, analyst says
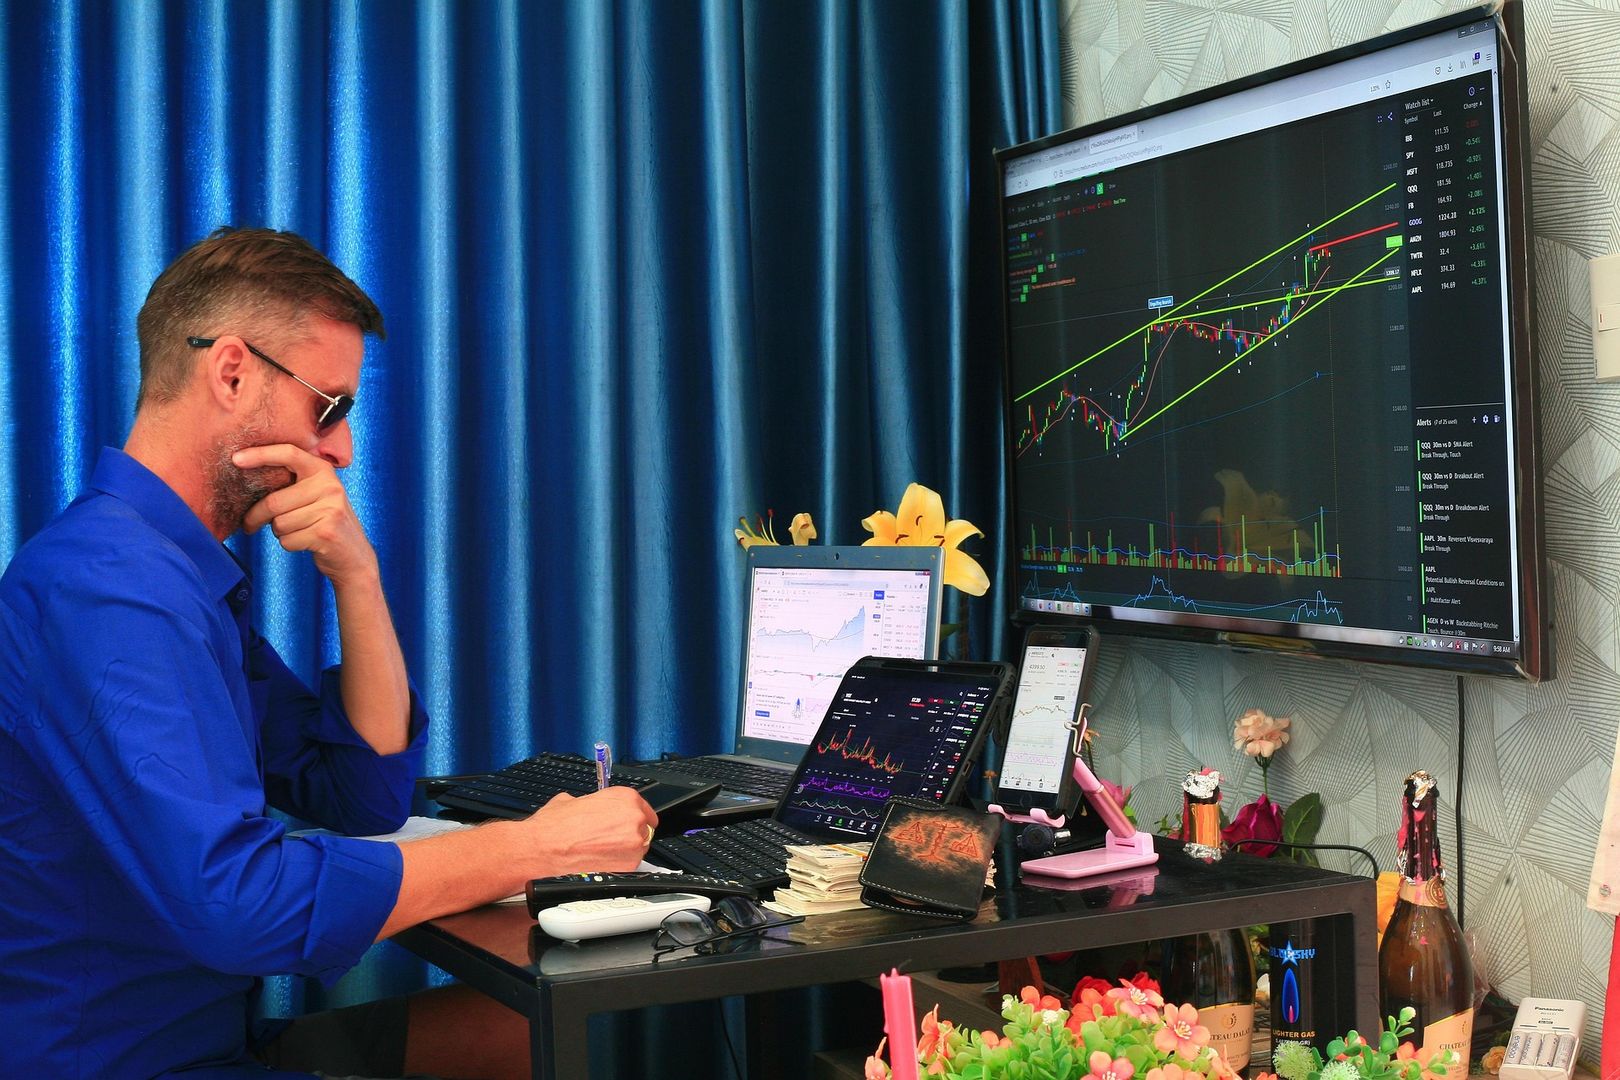
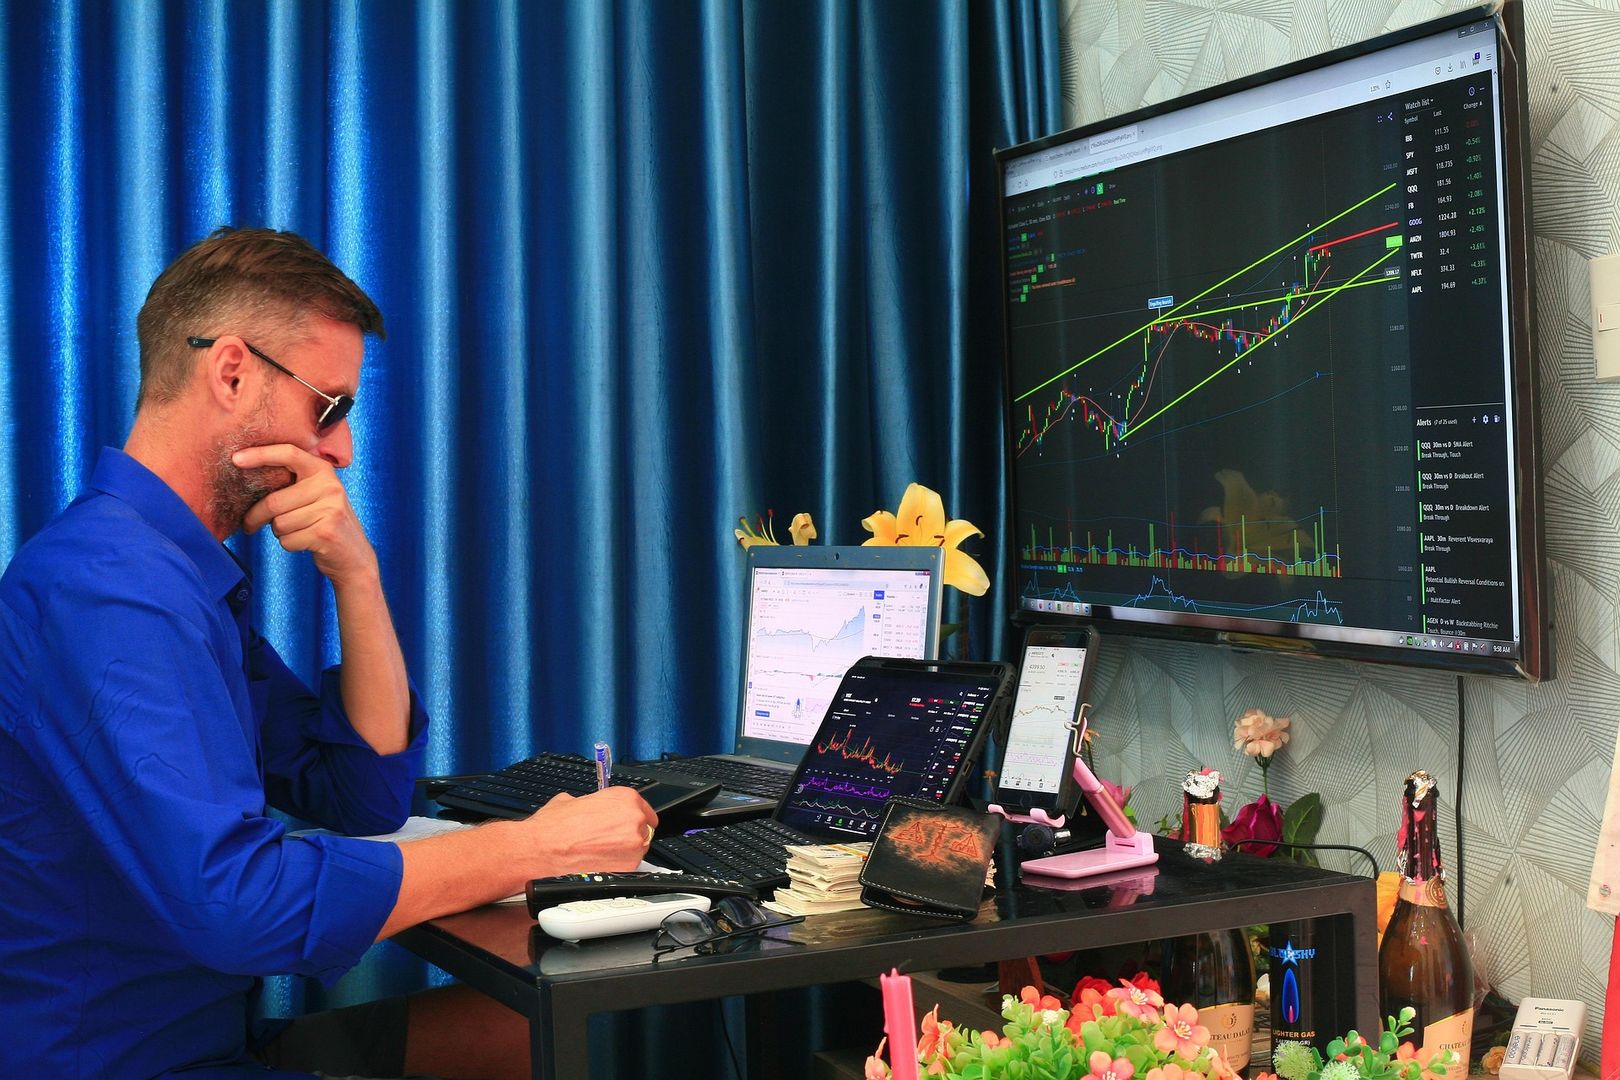
A hawkish Fed. Rising bond yields. Concerns about Strategy (MSTR). Bitcoin already has plenty working against it. Now an ominous chart pattern is adding to the uncertainty.
The pattern is called a bear flag, and a breakdown could send the price of the largest cryptocurrency to as low as $54,000 initially, according to pseudonymous trader Doctor Profit, who called BTC’s bull-market peak at $126,000 and the subsequent selloff.
“Bitcoin is now forming a massive bearish flag on the daily timeframe,” the trader wrote on X. “My target is a dump to 54-56k region first before we move sideways once again and afterwards another leg down and the bottom is close in the region between 40-50k in my opinion.”
Drawn on a chart, the pattern looks like a flag on a pole that’s been flipped upside down. Here’s how it works: An asset drops sharply and then sees a relief bounce. The slide represents the pole and the bounce becomes the flag. When the price drops below the lower end of the flag, it deepens the selloff, with the downward move roughly the same size as the initial decline.

Key Takeaways
- Beijing designated 10 American enterprises for export restrictions, notably MP Materials and USA Rare Earth
- Restrictions prevent dual-use item exports from China to the designated companies
- China’s Finance Ministry simultaneously prohibited Chinese entities from purchasing from 46 U.S. corporations
- Measures represent Beijing’s retaliation after Pentagon designated Alibaba, Baidu, BYD, and other Chinese firms on its 1260H military roster
- Market experts characterize the restrictions as predominantly symbolic given minimal Chinese business ties for most affected firms
Beijing imposed export restrictions on 10 U.S. enterprises Monday, focusing on organizations connected to military operations, unmanned aerial systems, and critical mineral processing.
MP Materials and USA Rare Earth featured prominently among those designated. These organizations play crucial roles in the rare earth element extraction and magnet production pipeline, with MP Materials managing America’s sole operational rare earth mining facility.
The restrictions prohibit all dual-use merchandise exports from China to the designated enterprises. These items encompass products suitable for both commercial and defense purposes.
Additional companies facing restrictions include unmanned aircraft manufacturers Teal Drones and Jaia Robotics, electronic systems producer Aveox, Ball Aerospace and Technologies, plus Oshkosh Defense.
China’s Answer to U.S. Military Entity Designation
China’s Commerce Ministry justified the restrictions as necessary for protecting sovereign security interests and meeting global commitments. Officials characterized the decision as a response to Washington’s “antagonistic conduct.”
The Pentagon’s recent 1260H list update identified Chinese corporations allegedly supporting Beijing’s military apparatus. Notable recent inclusions featured Alibaba, Baidu, BYD, and NIO.
Beijing’s action represents a calculated response to that designation.
Simultaneously, China’s Finance Ministry announced procurement prohibitions preventing Chinese purchasers from acquiring goods from 46 American corporations, predominantly defense industry participants. Foreign-invested enterprises operating domestically in China with connections to those organizations remain unaffected.
Financial Markets Show Minimal Response
Equity markets demonstrated little reaction to the announcement. MP Materials and USA Rare Earth stock prices remained essentially stable after the disclosure.
Industry observers suggest the concrete ramifications of these restrictions remain constrained. The majority of designated American enterprises maintain negligible or nonexistent commercial operations in China.
George Chen, a partner with the Asia Group, characterized Beijing’s action as “measured” and “predominantly ceremonial.” He observed that most designated organizations focus on defense applications and maintained minimal Chinese trade relationships previously.
Han Shen Lin, another Asia Group partner, supported this assessment, noting the affected enterprises possess “minimal or zero substantial Chinese business footprint.”
The restrictions don’t generate immediate financial losses for most designated organizations.
Nevertheless, policy trajectory remains significant for market participants. Beijing demonstrates capacity to counter American blacklists with reciprocal limitations, particularly regarding defense technology, unmanned systems, and strategic minerals.
Organizations involved with rare earth elements and military procurement networks might gain advantages from sustained American initiatives to diminish dependence on China for essential materials.
Yet the commercial landscape grows increasingly intricate as both nations continue expanding their national security mechanisms.
This development continues an established sequence of reciprocal trade measures between Washington and Beijing that has intensified during 2026.


That key is meant to stay sealed inside secure hardware so the proofs can be trusted. With it exposed, the attacker could enroll their own provers as legitimate and sign fraudulent proofs that Taiko’s verifier accepted, then fake a bridge withdrawal that released real assets on Ethereum.
.@taikoxyz was reportedly attacked, with losses exceeding $1.7M. Our initial investigation suggests the likely root cause was an exposed Raiko SGX enclave signing key on GitHub. Raiko is Taiko’s multi-prover stack for Taiko and Ethereum blocks, so an exposed Raiko SGX enclave key… https://t.co/8BIiEeNtYJ pic.twitter.com/eAq9Xjngz8
— BlockSec Phalcon (@Phalcon_xyz) June 22, 2026
Taiko urged all users to withdraw from every bridge on the network, asked centralized exchanges to suspend deposits of its TAIKO token, and had its block producers stop making new blocks during the investigation.
By about 2 a.m. ET it said the exploit was contained and withdrawals through the main bridge and token vault were fully stopped. The exploiter had already moved about 2 million TAIKO, worth roughly $170,000, to an account on the MEXC exchange.
The dollar loss is small, but the flaw came from the same DeFi mechanism that have caused hundreds of millions worth of losses this year.
Forged cross-chain messages drained $292 million from Kelp DAO’s bridge in April and $11.4 million from the Verus-Ethereum bridge in May, the same failure where one chain is tricked into trusting a fake instruction from another. Bridges have produced more than $340 million in losses across at least 14 exploits in 2026, making it the costliest target in crypto. Taiko’s damage stayed contained mainly because the team caught and froze it within hours.
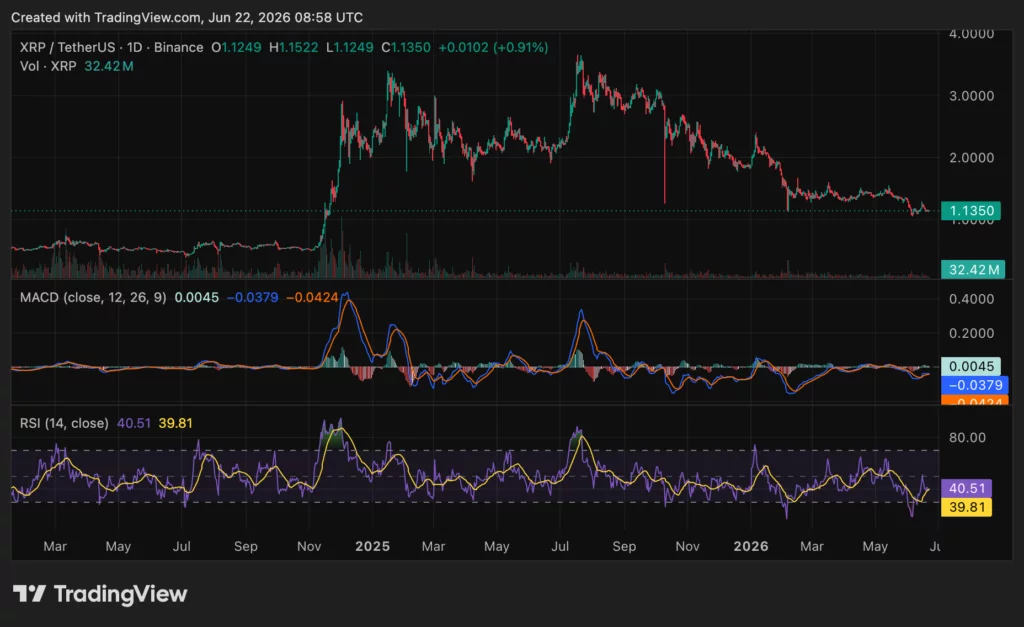
XRP price traded near $1.13 on June 22 after briefly slipping to about $1.12 during Sunday’s session.
Summary
- XRP rebounded from $1.12 support, but remains trapped between $1.10 and $1.30 this month.
- MACD and RSI show improving momentum, though neither confirms a strong bullish reversal yet clearly.
- ETF inflows and derivatives activity improved, but sustained spot demand still needs confirmation from buyers.
Buyers stepped in near that level and pushed the token back toward $1.15 within hours, keeping attention on the lower end of the range.
The move kept XRP inside the broad $1.10-$1.30 band that has guided price action for most of June. The token was down over 4% for the week and more than 13% over the past month, showing that the short-term rebound has not erased the wider weakness.
crypto.news data showed 24-hour volume near $1.28 billion, with XRP ranked sixth by market value. Its market capitalization stood near $70.28 billion, while fully diluted value remained above $113 billion. Circulating supply was about 62.05 billion XRP from a maximum supply of 100 billion tokens.
The support test matters because XRP has already struggled to hold higher levels this month. A prior move below $1.15 turned that area into the first resistance zone. Bulls now need to regain $1.15, then $1.20, before a stronger recovery setup can form.
XRP indicators show early recovery signs
The MACD shows a mild bullish turn. The histogram is slightly positive near 0.0045, while the MACD line sits around -0.0379 and above the signal line near -0.0424. That setup points to weaker bearish momentum and a short-term recovery attempt.
The signal remains early because both MACD lines are still below the zero line. That means momentum has not moved fully back into bullish territory. XRP needs stronger follow-through before traders can treat the setup as a confirmed reversal.
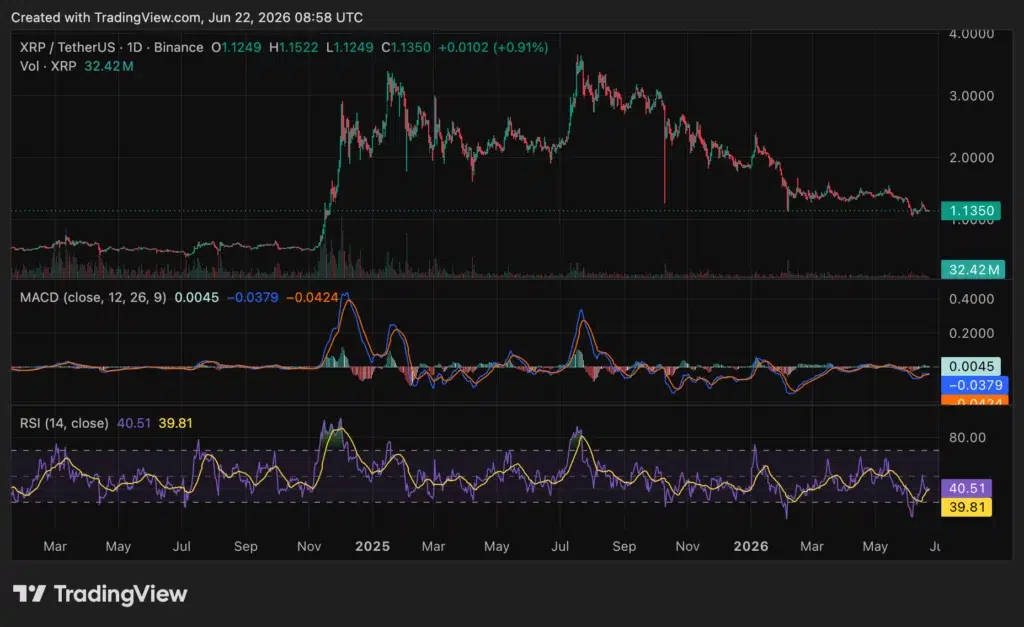
The RSI stands near 40.51, slightly above its moving average of 39.81. This shows some improvement from weaker levels, but the reading remains below the neutral 50 mark. Buying strength is present, but still limited.
A move above 50 on the RSI would give bulls a cleaner technical signal. Until then, the chart still favors caution. The token is no longer showing heavy downside pressure, but it has not yet shown enough strength to confirm a new uptrend.
Flows and derivatives activity improve
Fund flows offer one of the more supportive signals for XRP. As previously reported, XRP-linked products recorded about $10.66 million in weekly net inflows for the week ending June 18. That was close to the prior week’s $10.68 million.
Cumulative net inflows rose to about $1.45 billion, while total net assets moved closer to $1 billion. These figures show that institutional-style demand has not disappeared, even as the spot price trades well below last year’s highs.
Derivatives activity also picked up. Coinglass data showed XRP volume rising 50.17% to $2.08 billion, while open interest increased 1.23% to $2.66 billion. Options volume rose 19.06% to about $609,170, and options open interest increased 0.75% to $65.47 million.
Higher volume and open interest can support sharper price moves, but they do not show direction by themselves. If long positions build while spot demand stays weak, volatility can rise on both sides. Traders will watch whether open interest grows with price recovery or with another failed bounce.
Analysts watch $1.36 and $1.08
Analysts remain split on whether XRP is building a base or forming another pause inside a downtrend. Javon Marks said XRP’s breakout remains valid and kept a long-term measured move target near $17. He wrote that traders are watching for “another >12X” move if the setup continues.
That target remains a projection, not a confirmed path. XRP would first need to clear several nearer resistance levels, including $1.15, $1.20 and $1.30. The larger bullish case becomes harder to defend if the token loses the lower range.
Another analyst using the name Batman pointed to a short-term compression phase. He said XRP still has an ascending demand trendline while descending resistance squeezes price action. He set the “breakout threshold” at $1.36 and the “invalidation” level at $1.08.
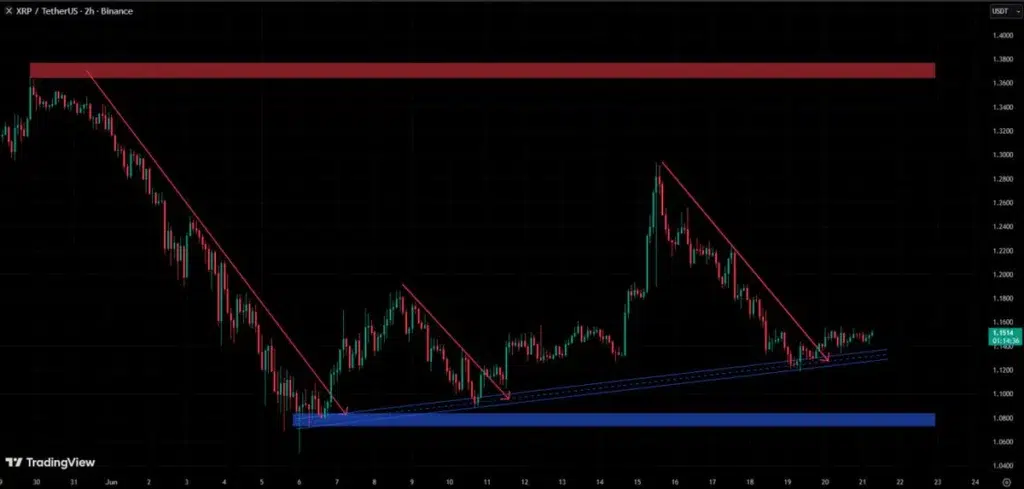
Those levels give traders a clear map. A move above $1.36 would suggest that buyers have taken control of the range. A loss of $1.08 would weaken the structure and could open the door to a deeper support test.
For now, XRP’s position remains mixed. The token has defended $1.12, flows have improved, and MACD is turning slightly higher. At the same time, RSI remains weak, price stays below neutral momentum levels, and the wider trend has not recovered.
The next move depends on whether buyers can turn the rebound into a sustained close above $1.15 and $1.20. If they fail, XRP may keep moving sideways near support. If selling returns below $1.10, the $1.08 invalidation level could become the next test.
Disclosure: This article does not represent investment advice. The content and materials featured on this page are for educational purposes only.
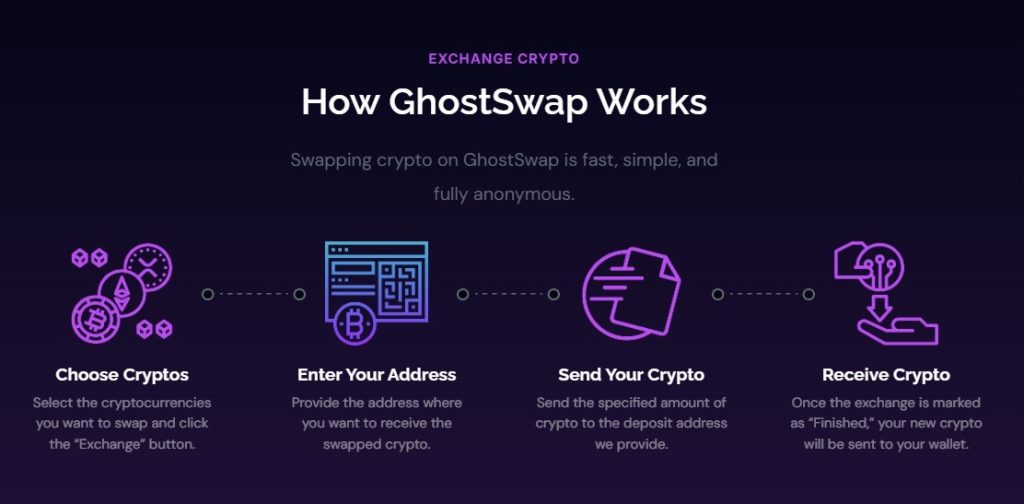
GhostSwap has launched a new public swap-rate API, which gives developers instant access to live crypto exchange rates without requiring an API key. The new endpoint exposes GhostSwap’s best available swap rates across more than 1,600 cryptocurrency pairs, along with minimum and maximum swap limits, through a simple, CORS-enabled interface optimized for fast integration.
For years, access to live crypto swap pricing has largely been reserved for partners, approved integrations, or developers willing to navigate API keys and onboarding processes before writing a single line of code. GhostSwap aims to change this.
No matter if you are building a wallet, a trading bot, a portfolio dashboard, or a crypto comparison website, accessing real-time swap data now takes minutes instead of days.
More importantly, this launch leads to open and permissionless infrastructure. GhostSwap is making its pricing layer publicly available, which allows builders of all sizes to experiment, prototype, and deploy crypto-powered applications without asking for access first.
The Technical Breakdown: What Developers Actually Get
The public endpoint is a direct evolution of GhostSwap’s existing aggregated liquidity engine. It is available immediately via a straightforward POST request to the /v1/quotes endpoint, accepting three primary parameters: from (the token you are selling), to (the token you are buying), and amountFrom (the amount to swap).
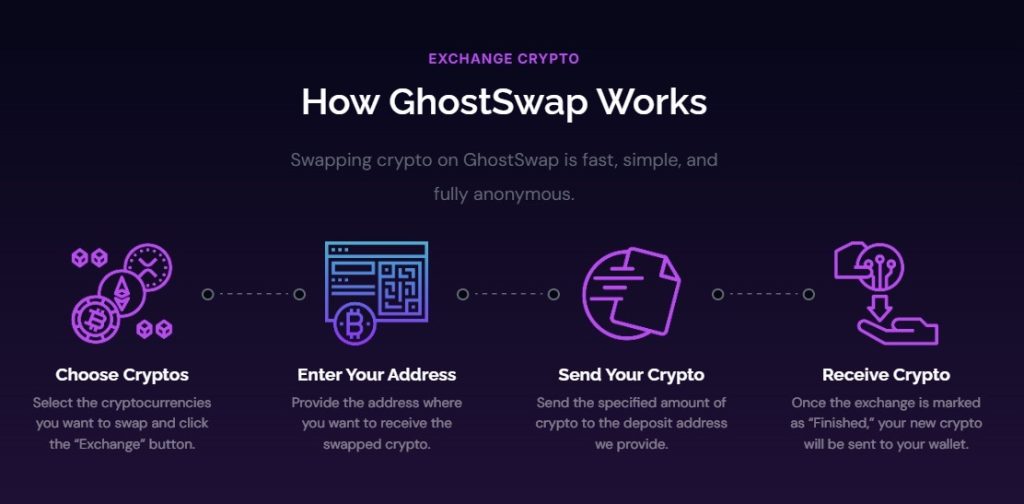
In response, the API returns the live best available rate alongside the minimum and maximum swappable amounts for that specific pair. This “min/max” data is crucial; it prevents developers from querying a rate that looks attractive but isn’t practically executable due to liquidity depth constraints. GhostSwap saves developers an extra validation step and makes sure the rate displayed is actionable.
The coverage is extensive. The endpoint supports more than 1,600 cryptocurrency pairs, spanning major assets like BTC, ETH, and SOL, across a wide variety of EVM-compatible chains and popular layer-2 networks. This makes it a one-stop shop for pricing data across the multi-chain ecosystem.
Perhaps most critical for modern web development is the CORS (Cross-Origin Resource Sharing) support. GhostSwap removes the need for developers to spin up a backend proxy just to fetch a price By enabling browser-based requests directly.
Why Eliminating the API Key Changes Everything
API keys are the standard gatekeepers of the web3 data economy, but they impose a hidden tax on development. Before a developer can even test a response, they must navigate account creation, email verification, credential generation, and secure storage.
For client-side applications, keys introduce the dangerous overhead of secret management. This forces teams to build server-side routes just to keep credentials out of the browser.
GhostSwap’s no-key method collapses this friction completely. The onboarding flow goes from a multi-day administrative chore to a thirty-second integration sprint.
This unlocks immediate value in three specific areas:
1. Browser-Based Builders and Frontends
Frontend developers can now embed live swap rates directly into their UI without managing a backend. No matter if it’s a portfolio tracker showing exit liquidity, a DeFi dashboard comparing rates, or a gaming app displaying token values, the data flows straight from GhostSwap to the user’s screen with minimal latency and zero infrastructure overhead.
2. Trading Bots and Automated Strategies
For arbitrage bots and algorithmic traders, speed and uptime are everything. By removing API key rotation, expiration handling, and authentication error states, GhostSwap provides a more resilient data stream. Bots can poll the public endpoint continuously, which basically means they react to market movements without the risk of a stalled authentication layer.
3. Price-Display and Comparison Sites
Aggregators and comparison platforms can now pull rates side-by-side with other exchanges to offer users transparent pricing. Because the endpoint requires no commercial agreement, these sites can deploy updates instantly, adding new pairs as GhostSwap supports them without waiting for contract renewals or partner approvals.
The “Open, Permissionless Rates” Philosophy
This launch is a philosophical statement about the nature of pricing data. In traditional finance and even in large swathes of crypto, exchange rates are treated as proprietary assets to be licensed, monetized, and controlled.
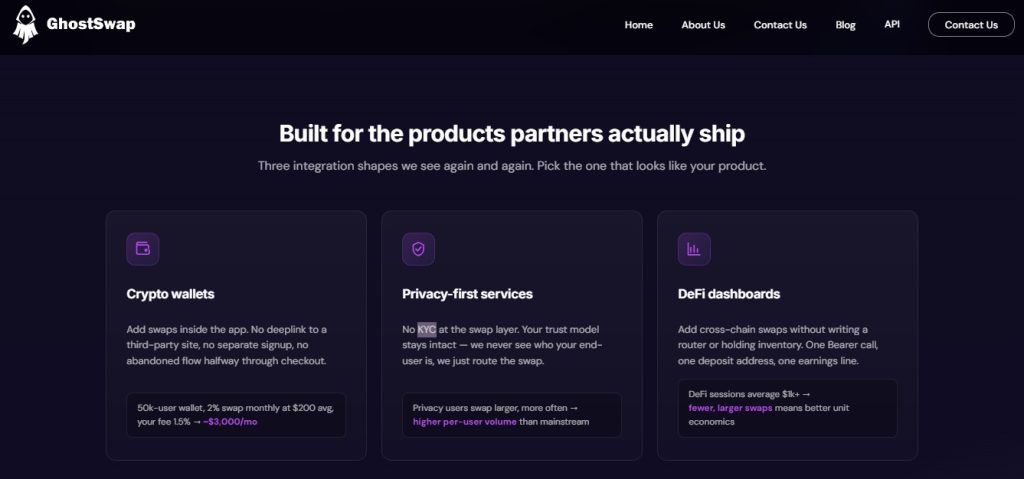
GhostSwap is rejecting that model. By releasing rates as a public utility, the company aligns its data layer with the ethos of its core product. This mirrors GhostSwap’s primary interface (a no-KYC crypto swap API and trading experience) which extends that permissionless ethos from the transaction layer to the information layer.
The implications for the broader ecosystem are significant. When pricing data is open, the barrier to entry for innovation drops dramatically. A solo developer at a hackathon has the same access to GhostSwap’s aggregated liquidity as a well-funded institutional partner.
AI agents and autonomous scripts can fetch rates without being pre-authorized, enabling a new class of dynamic, agentic applications that react to the market in real time. Analytics platforms can ingest the data for research without navigating lengthy data-licensing legal reviews.
Permissionless access promotes competition, transparency, and resilience. If a rate is public, it can be audited, compared, and challenged by the community. This open approach holds the provider accountable and gives users the confidence that the displayed price is fair.
Integrating in Minutes
For developers eager to get started, the process is refreshingly minimal. There’s no partner application to fill out, no “contact sales” button to click, and no secret key to paste into a .env file. Head over to the GhostSwap API documentation, structure your POST payload with the desired pair, and start parsing the JSON response.
The rate limits are designed to accommodate serious production traffic while preventing network abuse, making the endpoint suitable for both high-frequency polling and occasional user-triggered price checks.
A New Baseline for Crypto Data Access
All in all, GhostSwap is effectively setting a new standard for how swap-rate data should be distributed. They have turned their pricing engine into a foundational layer that anyone can build upon.
For the developer building a wallet on a weekend, the bot scanning for cross-chain arbitrage, or the site aiming to offer the most transparent price comparisons, the public swap-rate API removes the first and most frustrating hurdle.
The infrastructure is open and the rates are live. The only thing missing at this point might be your integration.
The post GhostSwap Opens a Public, No-Key Crypto Swap-Rate API appeared first on Cryptonews.

Financial regulators in South Korea are pushing for broader reporting requirements on crypto transfers to further align with global Anti-Money Laundering standards for digital assets.
South Korea’s Financial Intelligence Unit (FIU) raised proposals to expand the Financial Action Task Force’s (FATF) Travel Rule requirements to smaller crypto transfers during a plenary meeting in Paris last week, according to an announcement on Monday.
The crypto Travel Rule is a global AML standard that requires crypto exchanges to share sender and recipient information for transfers above certain thresholds. It is designed to improve the traceability of funds moving between platforms.
South Korea already applies Travel Rule requirements to crypto transfers above 1 million won ($650), and the latest proposal calls for extending those obligations to smaller transactions.
Ongoing gaps in global oversight and DeFi risks
The FIU said Travel Rule obligations should apply to both originating and receiving crypto asset service providers (CASPs) to close gaps in cross-border transfers.
The FIU also called for stronger action against offshore and unregistered crypto platforms, citing increased misuse in illicit finance cases and risks of regulatory arbitrage.

FIU Commissioner Lee Hyung Ju at the FATF plenary session in Paris. Source: FIU
Beyond the Travel Rule discussion, FATF also approved a new report examining risks associated with decentralized finance (DeFi), according to the FIU.
Related: South Korea police raid Bithumb over lawmaker hiring favoritism probe: report
FIU Commissioner Lee Hyung Ju welcomed the adoption of a DeFi-related report during FATF discussions. However, he said regulatory arbitrage across jurisdictions mainly stems from differences in licensing, supervision and offshore oversight.
Seven years after FATF extended Travel Rule scope to crypto
The proposal was part of broader discussions on the implementation of FATF Recommendation 15, the international standard updated in 2019 to apply AML measures to crypto assets and CASPs.
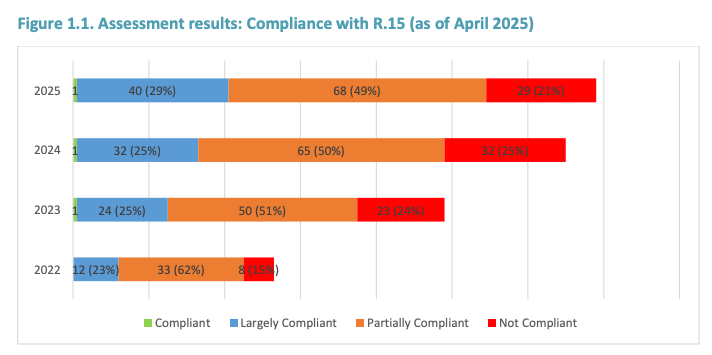
Seven years after FATF extended its AML framework to cover crypto assets, global implementation of Recommendation 15 remains uneven, according to a targeted update by FATF in 2025.
Source: FATF
The FATF assessment found that 49% of jurisdictions were only partially compliant with requirements for CASPs, while 21% remained non-compliant as of April 2025, leaving only about 29% of jurisdictions rated largely compliant or compliant.
Magazine: China’s 107 Bitcoin memory thief, Bithumb CEO booked: Asia Express


Bitcoin traded near $64,000 on Monday after a volatile weekend tied to U.S.-Iran headlines.
Summary
- Bitcoin held near $64,000 as traders watched ETF outflows, Iran headlines and PCE inflation data.
- PCE, GDP, new home sales and sentiment data could guide Fed rate bets this week.
- Ether stayed near $1,750, while Solana neared $75 and large-cap altcoins remained stable overall Monday.
According to crypto.news market data, Bitcoin traded near $64,217, while Ethereum traded near $1,747. Bitcoin dipped toward $63,300 after fresh uncertainty around peace talks, then recovered toward the middle of its short-term range.
Meanwhile, traders are still watching $62,000 as the main support area and $67,000 as the level bulls need to reclaim. The broader market stayed near $2.29 trillion, showing stability but not strong demand.
PCE and GDP data set macro tone
The main U.S. economic event this week is the May Personal Consumption Expenditures report, due Thursday. PCE is the Federal Reserve’s preferred inflation gauge, so a hot reading could reduce hopes for rate cuts and weigh on risk assets.
The calendar also includes June S&P Global flash PMI data on Tuesday, May new home sales on Wednesday, and first-quarter GDP data on Thursday. The University of Michigan sentiment update and inflation expectations data are due Friday. Together, those reports will give traders a fresh view of growth, consumer demand and price pressure.
Iran headlines and ETF flows add pressure
Middle East risk remains another market driver. Hopes for a U.S.-Iran deal helped calm oil markets last week, but the tone shifted again after new warnings from President Donald Trump.
President Trump wrote that “Iran must immediately stop” its proxies in Lebanon from causing trouble, warning that the U.S. could hit Iran “very hard again” if the attacks continue. Any renewed threat to shipping or oil supply could raise inflation worries and keep crypto traders cautious.
Bitcoin also faces pressure from spot ETF outflows. As previously reported by crypto.news, Galaxy Research said U.S. spot Bitcoin ETFs recorded $6.35 billion in net outflows over the latest 30-day window, the largest such outflow in its tracked data.
Weak ETF demand does not always push BTC lower right away, but it removes a key support that helped earlier rallies. If outflows continue while macro risks rise, traders may wait for a stronger close above resistance before adding exposure.
Altcoins stay mixed ahead of catalysts
Large-cap altcoins were mostly steady. Ether held near $1,750, while Solana moved close to $75. BNB stayed near $600, XRP remained below $1.15, and the total crypto market value hovered around $2.29 trillion.
For now, the week’s setup depends on four catalysts: PCE inflation, GDP data, Iran headlines and ETF flows. A softer inflation reading, calmer oil markets and slower ETF outflows could help Bitcoin test $67,000 again.
A hotter PCE report or renewed Middle East stress could bring $62,000 back into focus. If that level fails, the $60,000 area may become the next test. Until then, crypto markets look stable but fragile, with Bitcoin still setting the tone for altcoins. Traders may need confirmation from both macro data and fund flows before the next clear move.
Disclosure: This article does not represent investment advice. The content and materials featured on this page are for educational purposes only.
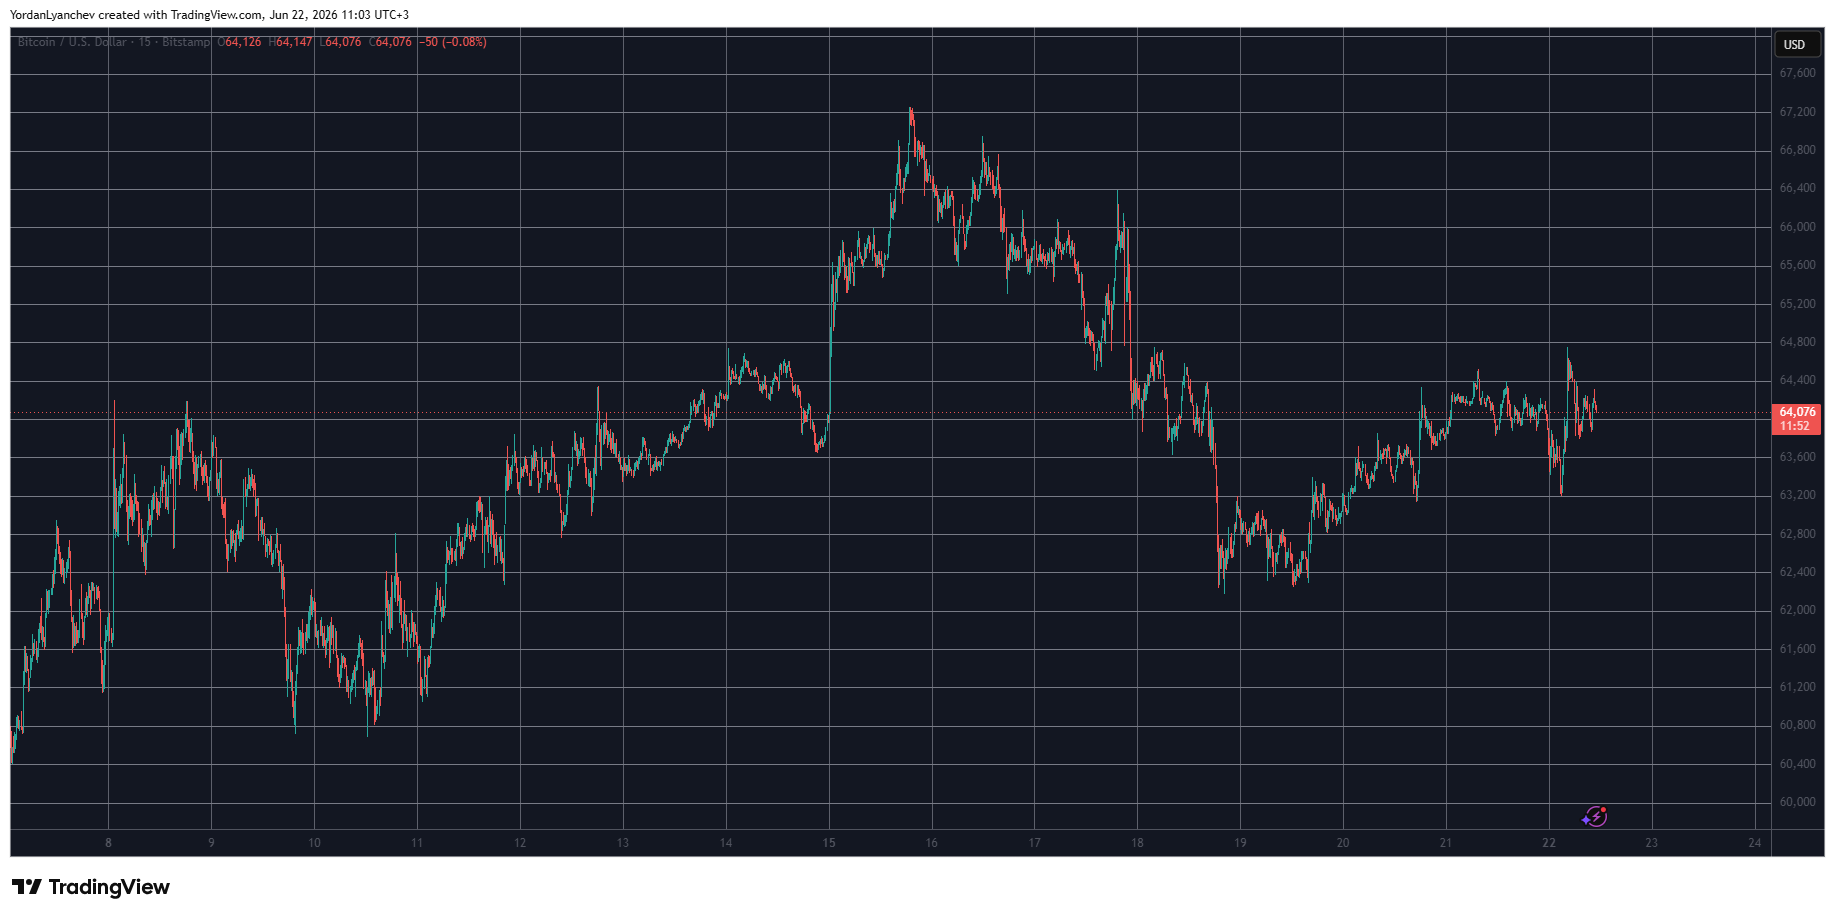
Bitcoin experienced some volatility on Sunday evening after the unsuccessful conclusion of the peace talks in Switzerland, but it rebounded from $63,300 and was stopped at $64,800.
Most larger-cap altcoins have remained stable as well, with ETH closing at $1,750 and SOL aiming at $75.
BTC Back at $64K
It was a week ago when US President Donald Trump said his country and Iran had reached a deal that was supposed to be signed by June 19. Bitcoin rocketed on the news, going from under $64,000 to over $67,000 within a day. However, it couldn’t maintain its run and dipped to its starting point ahead of the latest FOMC meeting.
Before and after the Fed’s expected announcement of keeping the rates unchanged, the cryptocurrency went to $66,400 before it plunged by four grand, especially since the new Chairman of the central bank remained hawkish.
The bulls finally intervened at this point and helped BTC recover some ground. The asset climbed to $63,000-$64,000 over the weekend and remained there for the most part aside from a brief deviation to $63,200 and $64,800. That came after the new threats from Trump against Iran and the conclusion of the meeting between the two sides in Switzerland.
Nevertheless, BTC has returned to $64,000 as of press time. Its market cap is at $1.285 trillion, while its dominance over the alts is still at 56.2% on CG.
Alts Stable Too
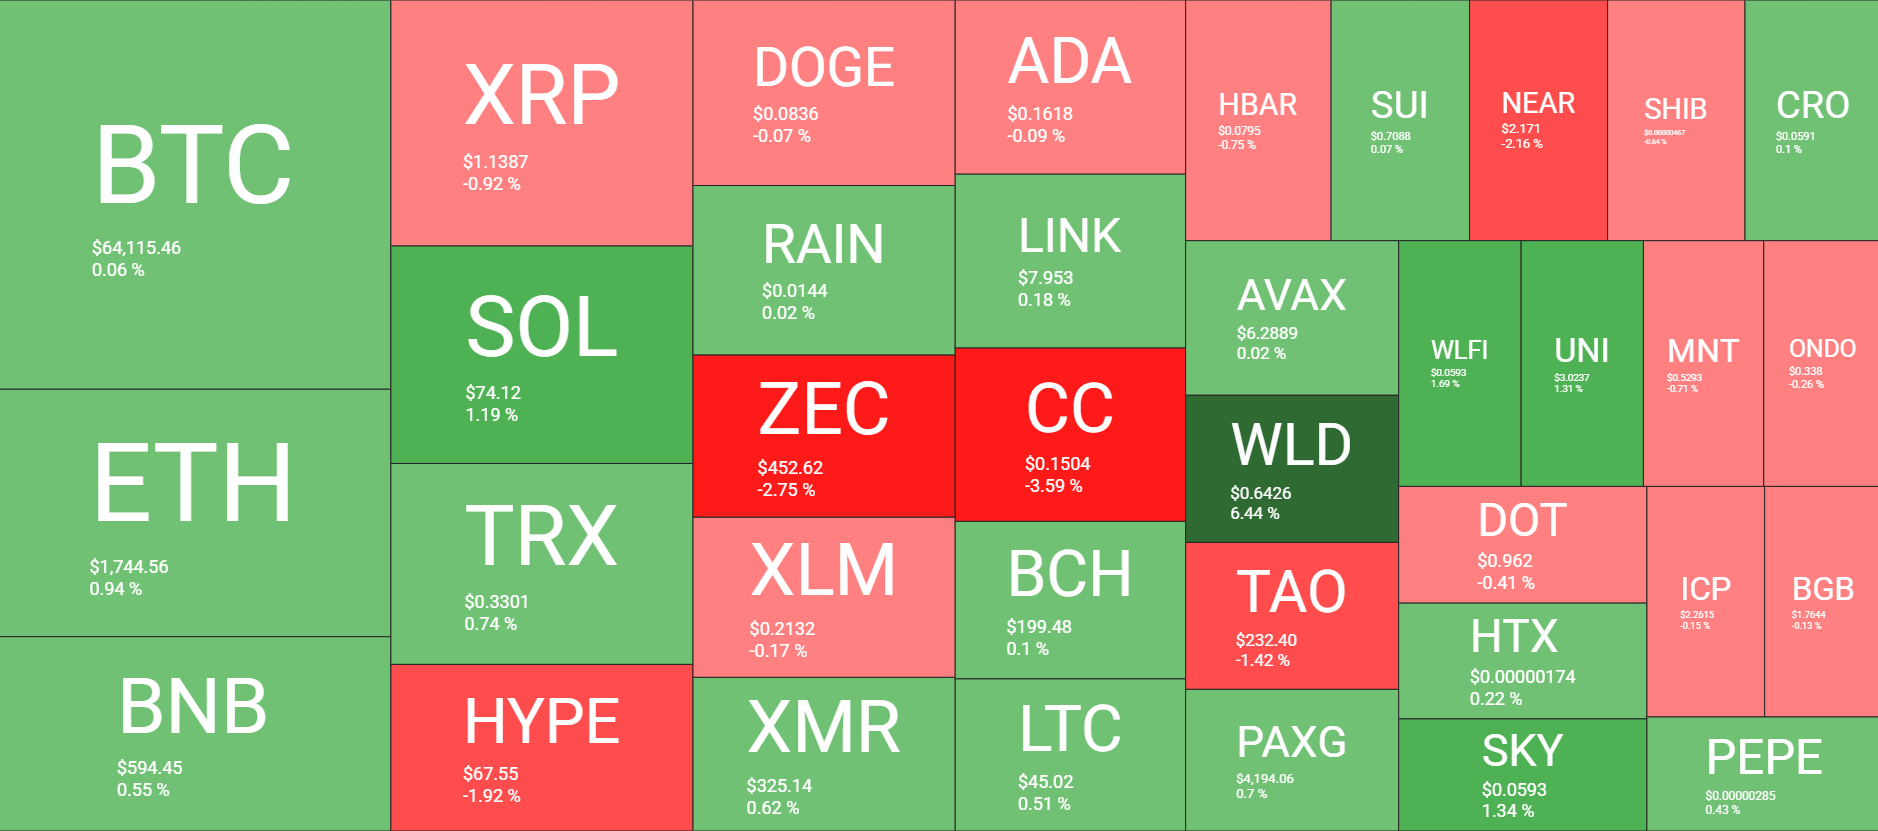
Most larger-cap alts have produced little to no volatility in the past 24 hours. Ethereum is slightly in the green and sits close to $1,750. Binance Coin remains close to $600 after a minor increase. XRP is still below $1.15, while SOL has neared $75 after a 1.2% increase.
HYPE is down by 2% daily, while ZEC and CC have lost around 3% of value. In contrast, WLD has gained 6.5% in the past 24 hours and sits close to $0.65. Other notable gainers over the past day include VVV (8%), ADI (3.2%), and M (3%).
The cumulative market cap of all crypto assets has remained at essentially the same level as yesterday at $2.290 trillion.
The post Altcoins Keep Steady as Bitcoin (BTC) Defends $64K Level: Market Watch appeared first on CryptoPotato.


The Bank of Korea and participating banks have discussed operating deposit tokens on a continuous basis with the goal of establishing conditions for a formal rollout, according to briefing materials submitted by the Korea Federation of Banks to the office of People Power Party lawmaker Lee Heon-seung.
Summary
- South Korea’s deposit token project is set to expand with person to person transfers, more merchants, and bank specific services in the next testing phase.
- Participating banks have urged the Bank of Korea to adopt a long term commercialization roadmap as the project requires new compliance systems and technology investments.
The materials noted that a follow-up test would seek to build a foundation for the official introduction and wider adoption of deposit tokens. Participating institutions also reviewed a plan to maintain operations without service interruptions while preparing for eventual commercialization.
Deposit tokens are digital bank deposits issued by commercial banks on top of a wholesale central bank digital currency infrastructure provided by the Bank of Korea. During the first pilot conducted last year, consumers used electronic wallets to complete real-world payments with deposit tokens.
Next phase expands services
The second round of testing would add several new functions. The Bank of Korea and banks plan to increase the number of users and merchants, introduce person-to-person transfers, and allow individual banks to launch their own services tied to deposit tokens.
The project would also include a business-to-business treasury payment program. Under that plan, government subsidies linked to South Korea’s electric vehicle charging infrastructure initiative would be distributed to companies in the form of deposit tokens.
Documents reviewed by the Korea Federation of Banks showed that commercial lenders previously argued the new phase would require substantially more resources than a simple extension of the first pilot. Banks told the central bank that the expanded scope resembled a new project because it included person-to-person transfers and a larger merchant network.
Banks said the additional functions would require anti-money laundering systems, suspicious transaction reporting capabilities, fraud detection infrastructure, further technology development, and dedicated budget allocations. They also called for a long-term roadmap that would cover commercialization plans after testing and urged authorities to adopt a more realistic implementation schedule.
The Bank of Korea later adjusted the project timeline after discussions with participating institutions and provided support for preparations, including consulting work related to commercialization plans, the documents showed.
A financial industry official told local media that the first pilot focused mainly on validating payment functionality, while the next stage would extend to transfers and other financial services. The official said banks face significant technology investment and operational costs as the project expands.
Both projects form part of a wider effort by South Korean financial institutions to evaluate digital payment infrastructure, although the Bank of Korea’s deposit token initiative operates through a CBDC-based banking framework while the Toss Bank project focuses on public blockchain networks and stablecoin applications.
The initiative comes as South Korean financial institutions increase their involvement with tokenized money and blockchain-based payment systems. On June 22, Toss Bank announced a memorandum of understanding with the Solana Foundation to test blockchain infrastructure for cross-border remittances and settlements.
Under that agreement, Toss Bank and the Solana Foundation will study stablecoin-based transfers, payment models, tokenized assets, and other digital asset services. The bank said the work will begin with a proof-of-concept project focused on international remittances and settlement processes.

(VIDEO) Olivia Rodrigo Scores Third No. 1 Album, Posts Year’s Biggest Week for a Soloist

NSE signs MoU with Bharat Metal Exchange to boost non-ferrous metal derivatives market

Bitget Launches Stock+, Bringing Real US Stocks to Crypto-Native Investors


-
 Tech6 days ago
The Adder At The Heart Of Intel’s 8087 FPU
-

 Fashion3 days ago
Weekend Open Thread: Miami – Corporette.com
-

 Entertainment1 day ago
Renter of Home in Anne Heche Crash Denies Settlement With Son
-
 Business2 days ago
Wall Street Week Ahead: Investors see Micron earnings as pulse check of AI rally momentum
-

 Crypto World2 days ago
HIVE shares jump as $220M AI deal speeds Bitcoin mining pivot
-

 Business2 days ago
Soccer-U.S. defends Iran World Cup travel restrictions, says discussions ongoing
-

 Sports3 days ago
FIFA World Cup 2026: Canada beat 9-men Qatar 6-0 to register first ever win | FIFA World Cup 2026
-

 Crypto World2 days ago
Jake Chervinsky accuses CME of protecting derivatives monopoly
-

 Business1 day ago
MHP SE 2026 Q1 – Results – Earnings Call Presentation (OTCMKTS:MHPSY) 2026-06-20
-

 Business3 days ago
Brexit cost 6% of UK economy, Bank of England company data suggests
-

 Crypto World4 days ago
Anthropic’s Dario Amodei Urged AI Unity at G7, Even as US Banned His Models
-
 Crypto World2 days ago
Can Charles Hoskinson Really Rescue Cardano?
-

 Crypto World6 days ago
Robinhood opens AI-powered trading to all users, sending HOOD stock past $100
-

 Tech5 days ago
Weeks Of In-The-Field Testing And A Verdict
-

 Politics2 days ago
Andy Burnham and the meaning of Makerfield
-
 Politics4 days ago
BBC Reporter Discusses Cross Party Criticism Of Trumps Iran Deal
-
 Tech4 days ago
Adobe adds its AI assistant to Premiere, Illustrator and InDesign
-
 Crypto World4 days ago
Iren (IREN) Stock Surges on Jefferies Buy Rating: AI Infrastructure Play Gains Momentum
-

 Tech3 days ago
Instagram Now Lets You Add A Unique Caption To Each Carousel Slide
-

 News Videos3 days ago
Nightcore – MONEY ON THE DASH (Soft Rock Version) (Lyrics)
You must be logged in to post a comment Login