
Crypto World
ETH Still Not Out of the Woods Despite Surge Past $2.3K
Ethereum is finally showing more upside potential. After spending weeks building a base above the February lows, ETH has now pushed into a key resistance zone, which makes this one of the more important tests since the selloff began. The rebound is real, but it is now approaching an area where sellers previously stepped in.
Ethereum Price Analysis: The Daily Chart
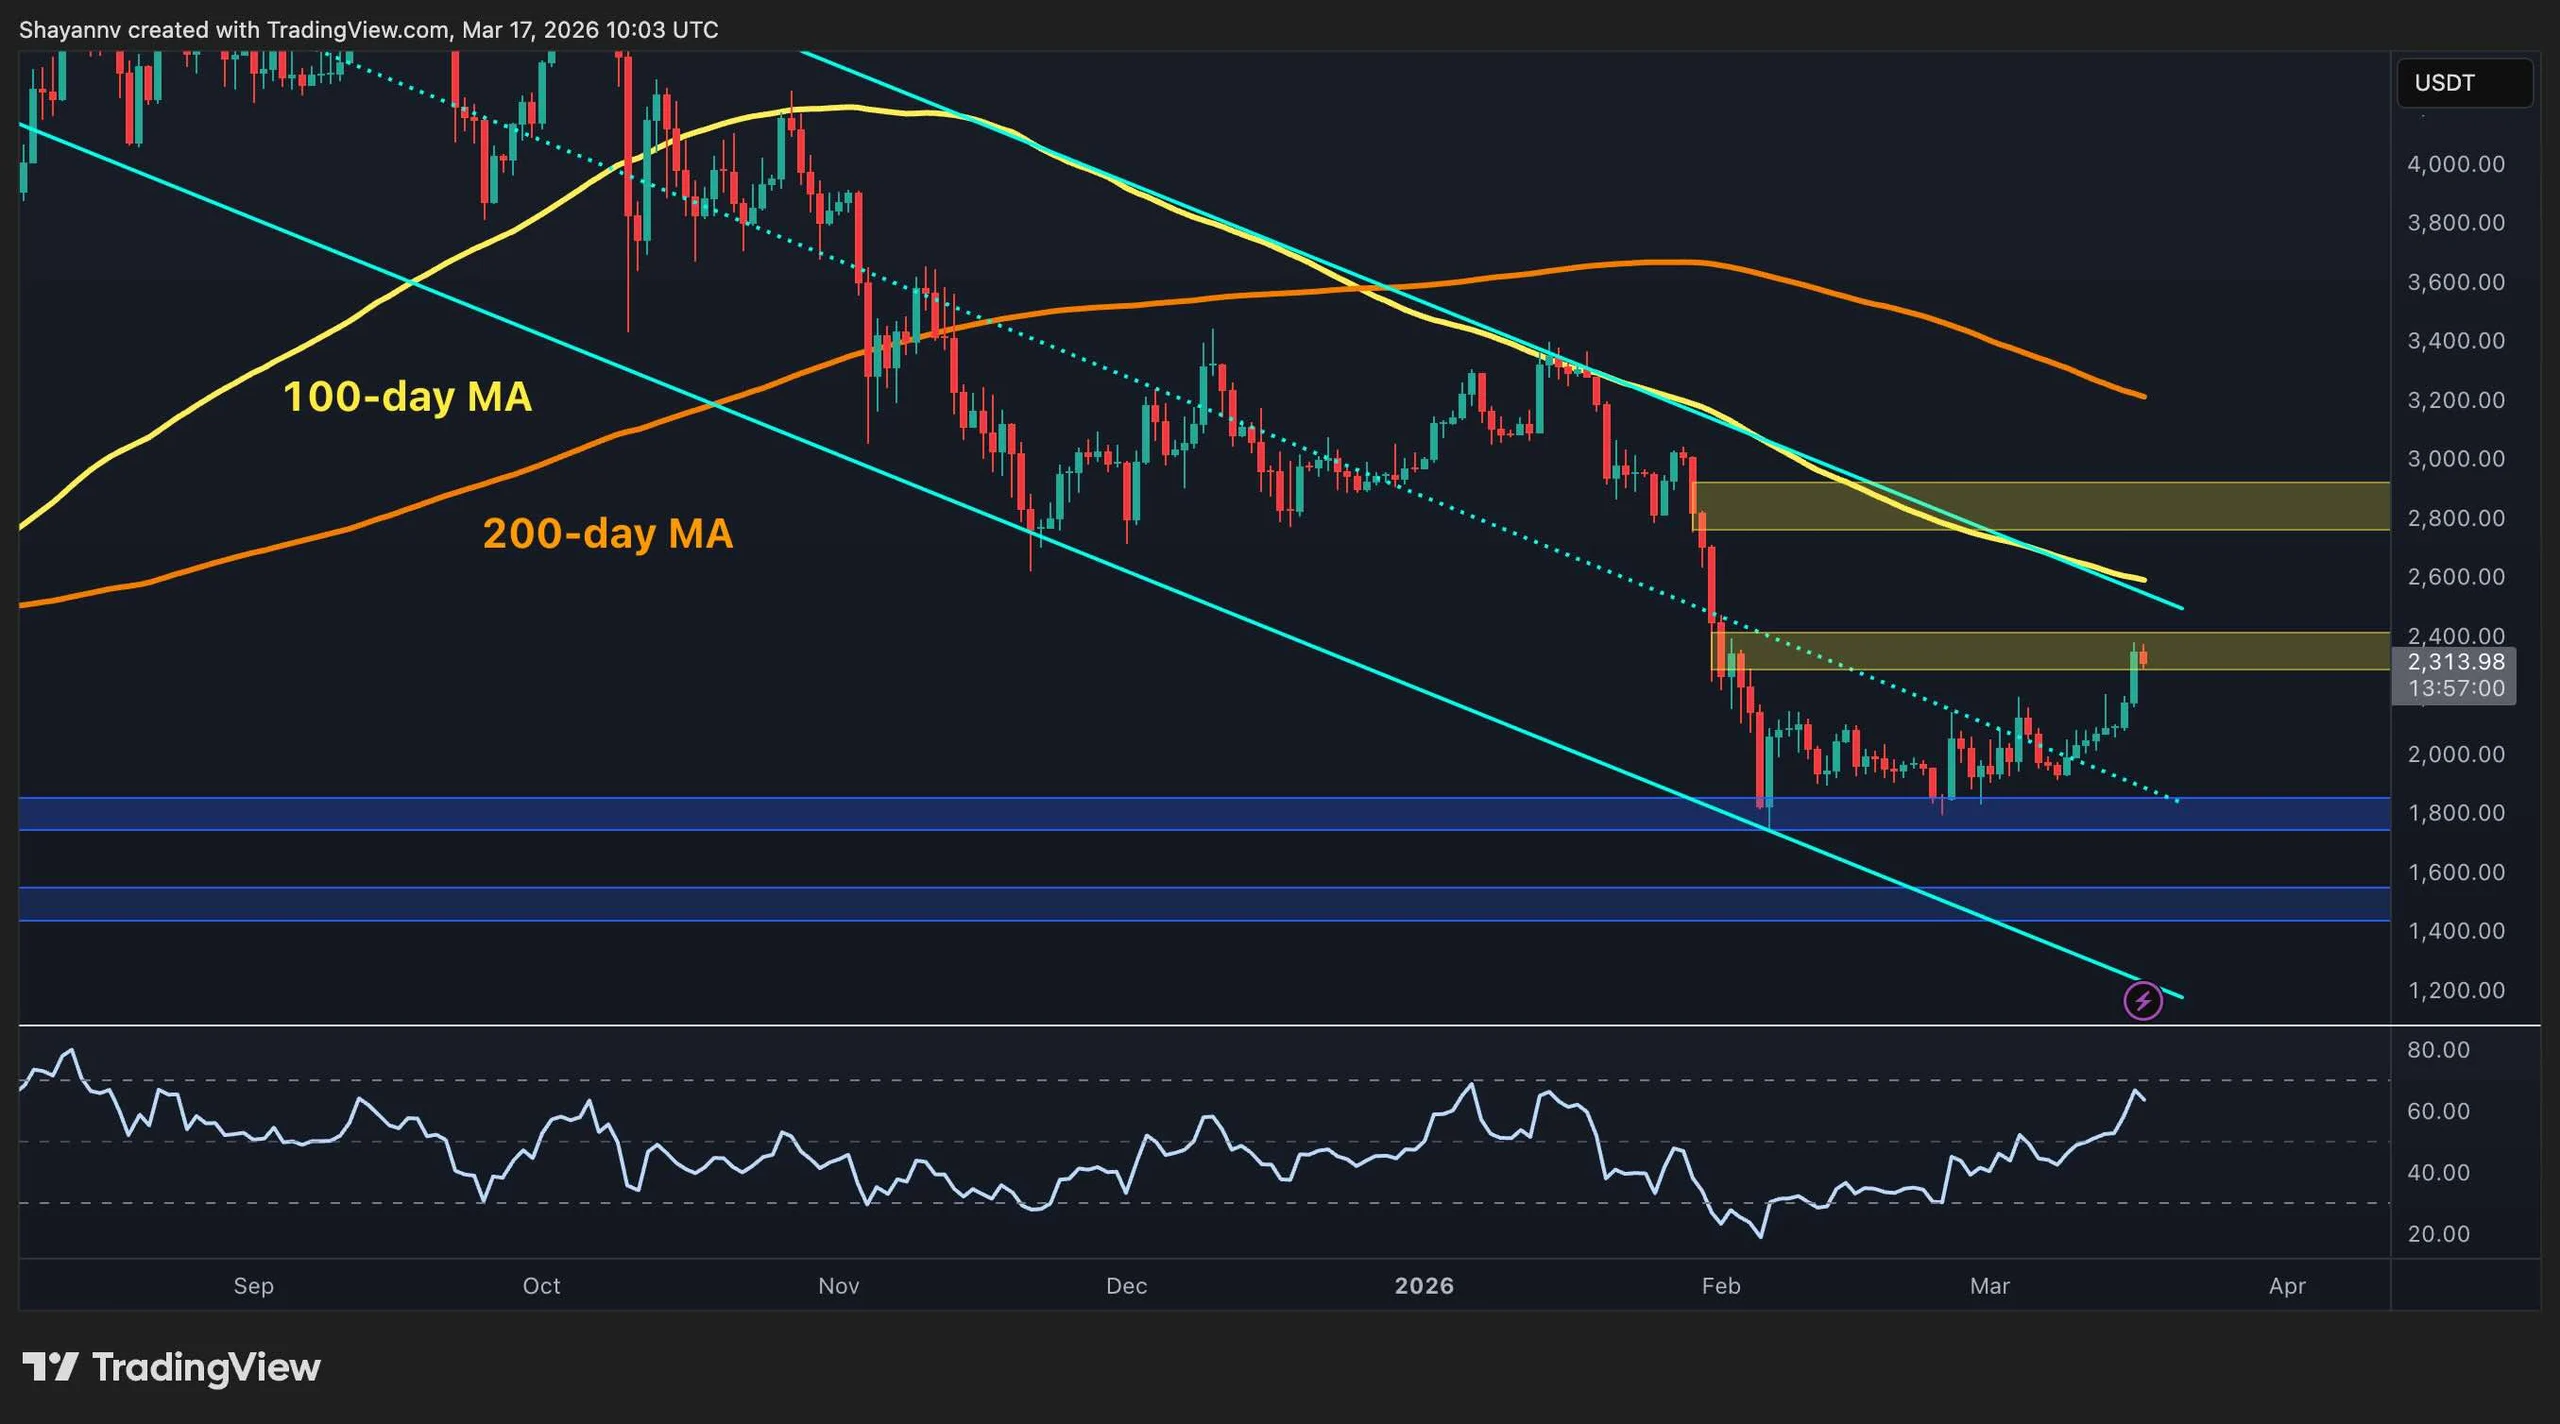
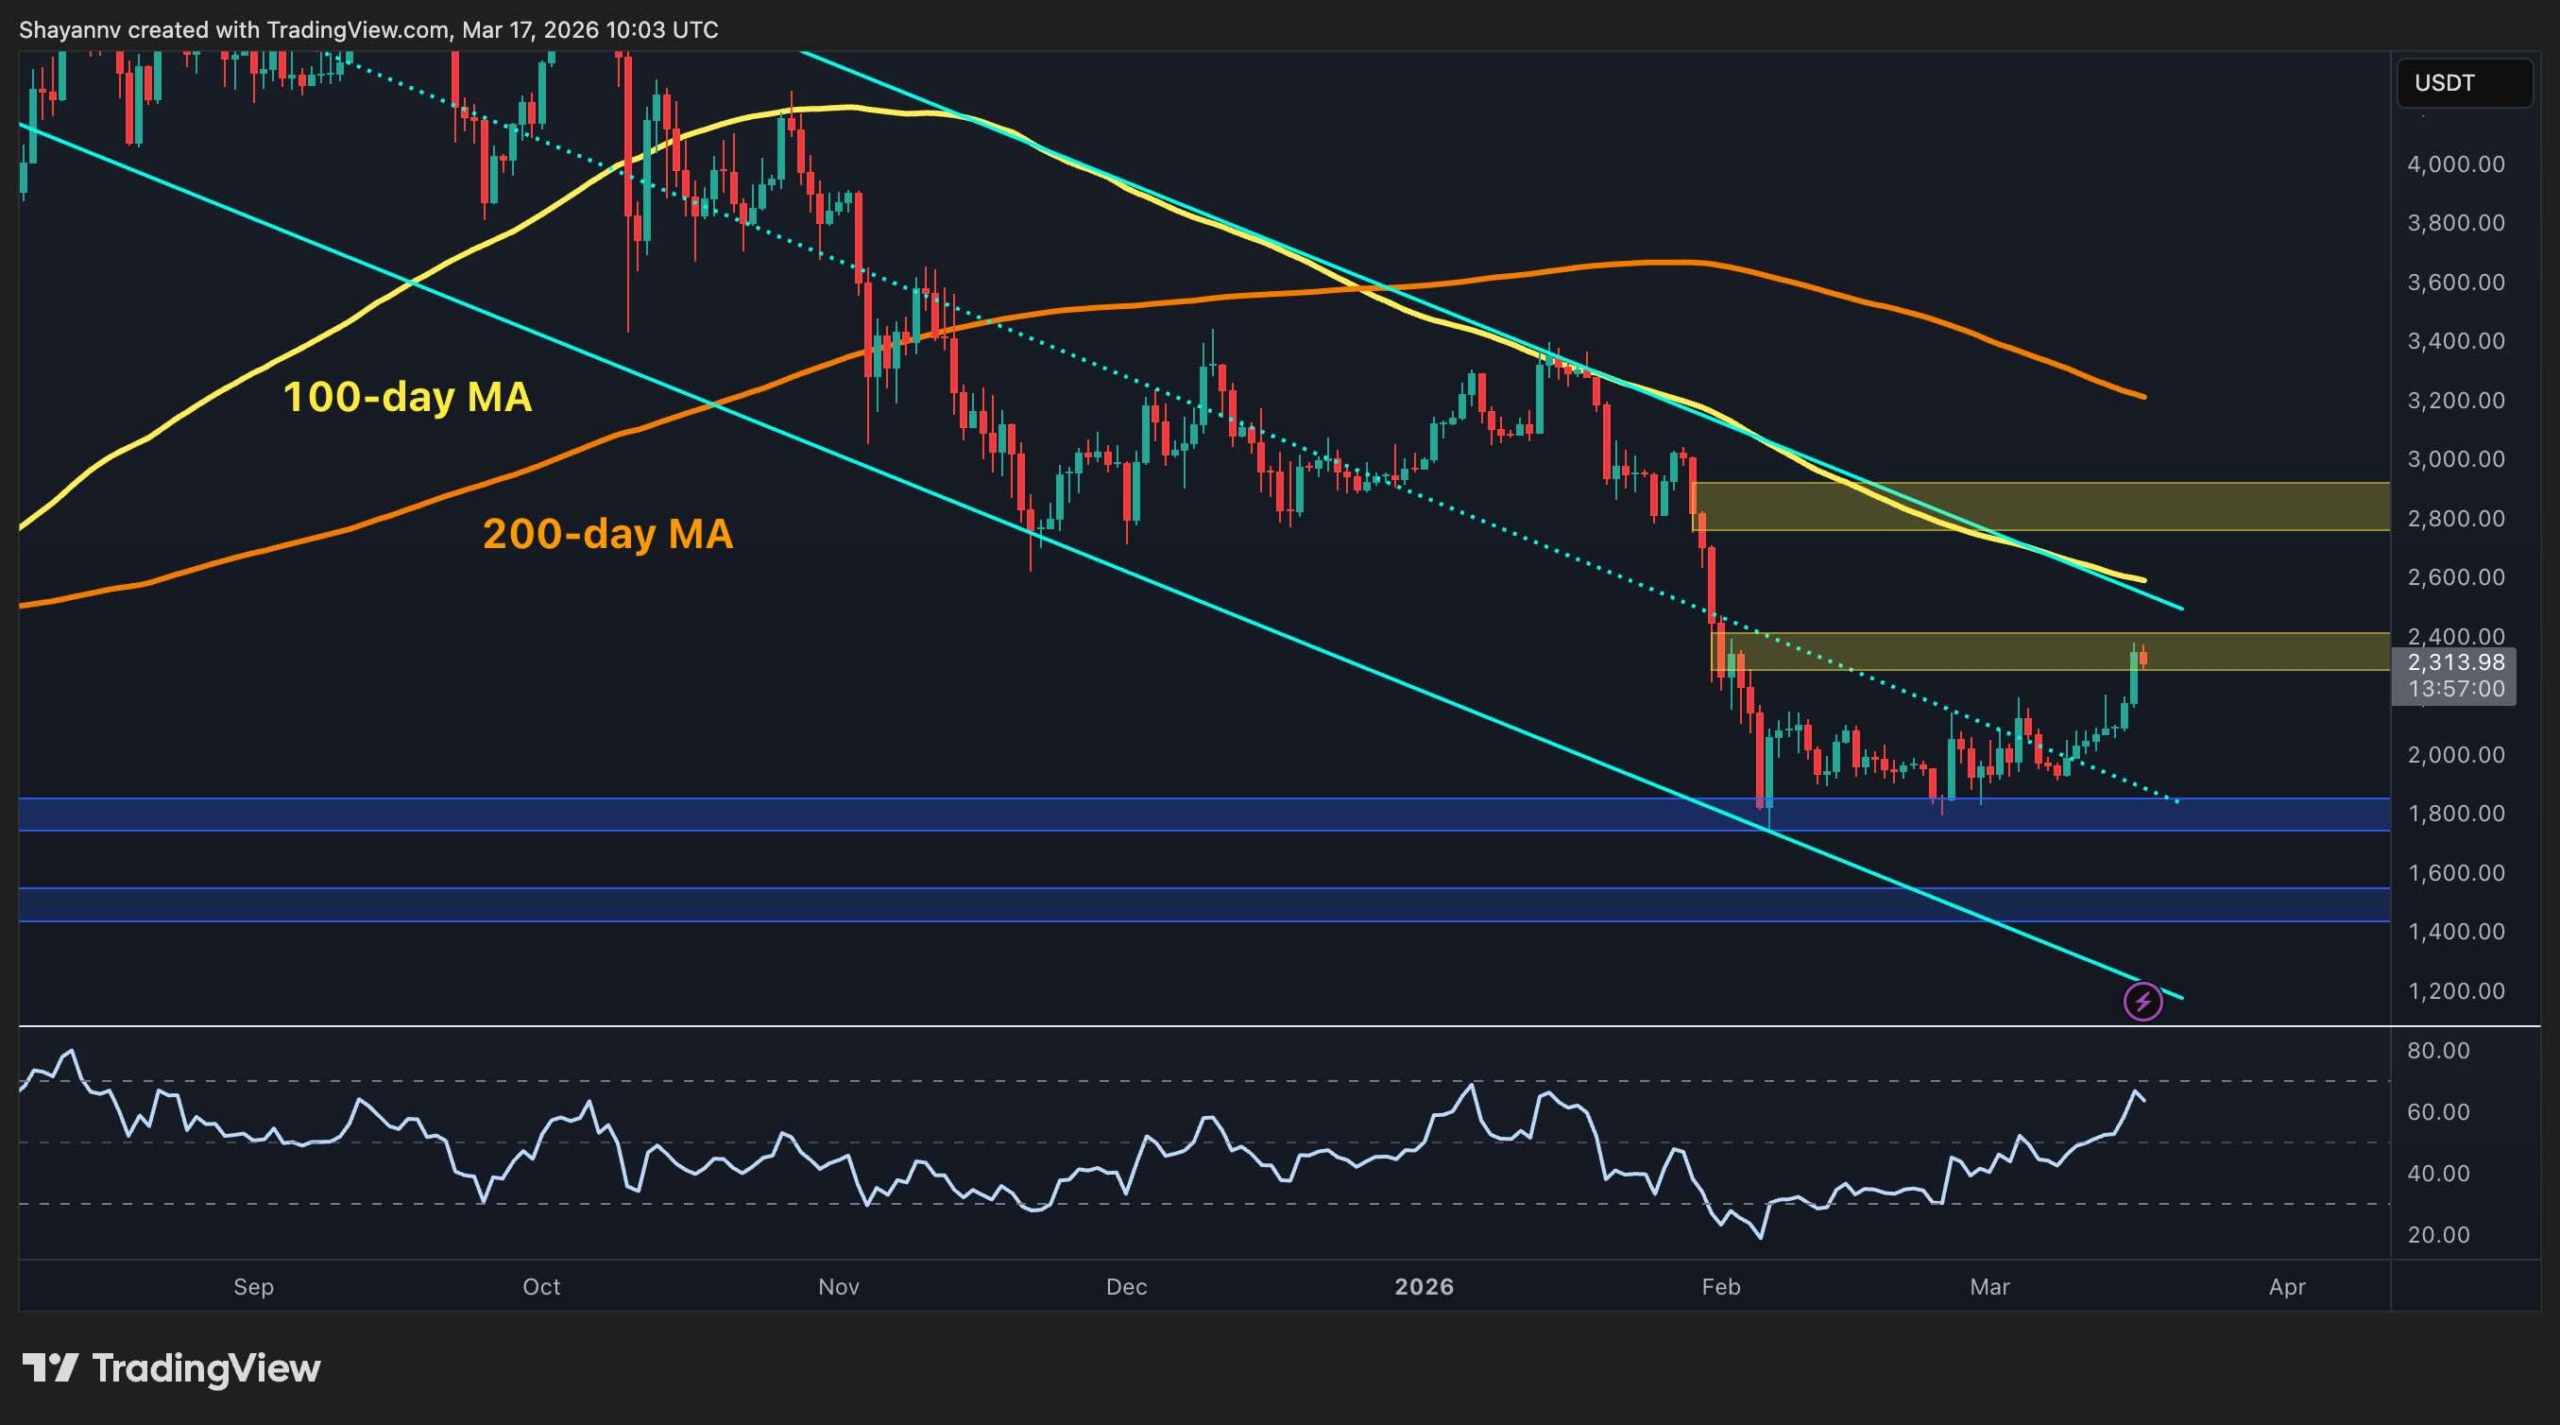
The daily chart has improved, but the broader trend is not fully repaired yet. ETH is still trading below the major 100-day and 200-day moving averages, and the bigger bearish structure from the previous months has not been completely invalidated. Even so, the strong reaction from the $1,800 region confirms that buyers have been defending that area aggressively.
The asset is now trading near the $2,300 to $2,400 supply zone, which is the next major battleground. If buyers manage to turn this area into support, the path could open toward the higher resistance band near $2,800. If not, this move may end up being just a strong relief rally inside a still-damaged higher timeframe structure.
ETH/USDT 4-Hour Chart
On the 4-hour chart, the recovery looks much cleaner. ETH has been climbing inside an ascending channel, printing higher highs and higher lows, which shows clear short-term control by buyers. The asset has even broken above the channel, pointing to a potentially more aggressive rally, if the current move does not become a fake breakout by dropping back inside the channel. Momentum has also expanded sharply, with RSI pushing into the overbought territory as the price accelerated into resistance.
That said, the market is no longer trading in the middle of the range. It is now testing the upper boundary of the recent advance and pressing into overhead supply at the same time. This usually means the next move matters a lot. It can either be a breakout continuation above the channel and resistance, or a fakeout and drop toward the mid-channel and the $2,000 to $2,100 area.

On-Chain Analysis
The on-chain backdrop is constructive. Ethereum’s 30-day transaction count exponential moving average remains elevated relative to most of the past cycle, even after cooling off from its recent spike.
That suggests network activity has not collapsed with the prior price weakness and that underlying usage is still holding up fairly well. However, it also shows that a potential capitulation phase is happening, as many holders have become active in selling their coins and exiting the market quickly. However, for every seller, there is a fresh buyer.
Overall, the network is showing better participation than price alone might suggest. That does not guarantee immediate upside, but it does support the idea that the recent rebound has a stronger foundation than a purely speculative bounce. If the price can now follow through above resistance, the on-chain picture would start to align much more clearly with a broader recovery thesis.
Binance Free $600 (CryptoPotato Exclusive): Use this link to register a new account and receive $600 exclusive welcome offer on Binance (full details).
LIMITED OFFER for CryptoPotato readers at Bybit: Use this link to register and open a $500 FREE position on any coin!
Disclaimer: Information found on CryptoPotato is those of writers quoted. It does not represent the opinions of CryptoPotato on whether to buy, sell, or hold any investments. You are advised to conduct your own research before making any investment decisions. Use provided information at your own risk. See Disclaimer for more information.


Bitcoin traded around $68,780 on Tuesday as U.S. spot bitcoin ETFs posted their strongest daily inflow in more than a month.
Funds added a combined $471 million on April 6, according to SoSoValue data, marking the largest inflow since Feb. 25 and the sixth-biggest daily total this year. The figure remains below January’s peak flow regime, when multiple trading days topped $700 million.
These high inflows come as bitcoin continues to stall below $70,000, with weak spot demand and distribution by large holders capping upside. ETFs have increasingly offset that pressure, acting as a primary source of marginal buying.
Macro signals offer limited direction. Markets are pricing a 98% probability that the Federal Reserve will hold rates steady at its April meeting, according to Polymarket data, with minimal expectations for near-term cuts or hikes.
Bitcoin’s relationship with global monetary policy may be shifting, with ETFs changing not just the scale of demand but its timing.
A recent Binance Research report finds bitcoin’s correlation with its Global Easing Breadth Index, which tracks 41 central banks, has turned sharply negative since 2024, the same year U.S. spot ETFs were approved. Before then, bitcoin tended to follow easing cycles with a lag. That relationship has now flipped, with the inverse effect nearly three times stronger.
The shift reflects who sets the marginal price. Retail once reacted to macro after the fact. ETF-driven institutional flows are more forward-looking, positioning ahead of expected policy moves.
“BTC may have evolved from a macro ‘lagging receiver’ to a ‘leading pricer,’” Binance Research wrote.
ETF inflows continue to absorb supply and anchor prices, which could explain the continued daily inflow.
If what Binance Research proposes holds, bitcoin may keep trading as a forward-looking asset, pricing in central bank pivots before traditional markets rather than reacting to them after the fact.

Total US bankruptcy filings climbed 14% in the first quarter of 2026, reaching 150,009 cases between January and March, up from 132,094 during the same period last year.
The increase spans consumer and commercial categories alike, according to data from Epiq AACER published by the American Bankruptcy Institute (ABI).
US Bankruptcy Filings Surge As Inflation Takes Its Toll
Small business filings showed the most dramatic acceleration. Subchapter V elections surged 67% to 833 from 499 a year earlier. Commercial Chapter 11 filings also rose 37%, climbing from 1,764 to 2,422.
Consumer filings told a similar story. Individual Chapter 7 cases increased 17% to 89,259. Chapter 13 filings rose 8% to 51,962. Total consumer filings reached 141,573. But what’s behind the rise?
“Persistent inflation, high interest rates, restricted credit, and global instability continue to compound the economic challenges of struggling families and small businesses,” ABI Executive Director Amy Quackenboss stated.
The Federal Reserve Bank of New York’s latest report on household finances underlines the pressure. Household debt hit $18.8 trillion by the end of Q4 2025. Credit card balances reached $1.28 trillion, with notable deterioration in mortgage and student loan arrears as well.
Follow us on X to get the latest news as it happens
Legislative Response and Outlook
Congress is weighing measures to ease access to bankruptcy protection. Legislation introduced recently by Senator Chuck Grassley in the Senate and Representative Ben Cline would permanently raise the small business reorganization threshold for Chapter 11 to $7.5 million. It would also lift the Chapter 13 debt ceiling to $2.75 million.
However, relief may not come quickly. The IMF has projected that US inflation will not return to the Fed’s 2% target until early 2027, suggesting elevated borrowing costs will persist well into next year.
Meanwhile, the US national debt recently surpassed $39 trillion, adding further strain to an already stretched fiscal environment. Whether legislative action can keep pace with growing financial distress remains an open question heading into Q2.
Subscribe to our YouTube channel to watch leaders and journalists provide expert insights
The post US Bankruptcy Filings Spike 14% in Q1 2026: What’s Driving the Surge appeared first on BeInCrypto.
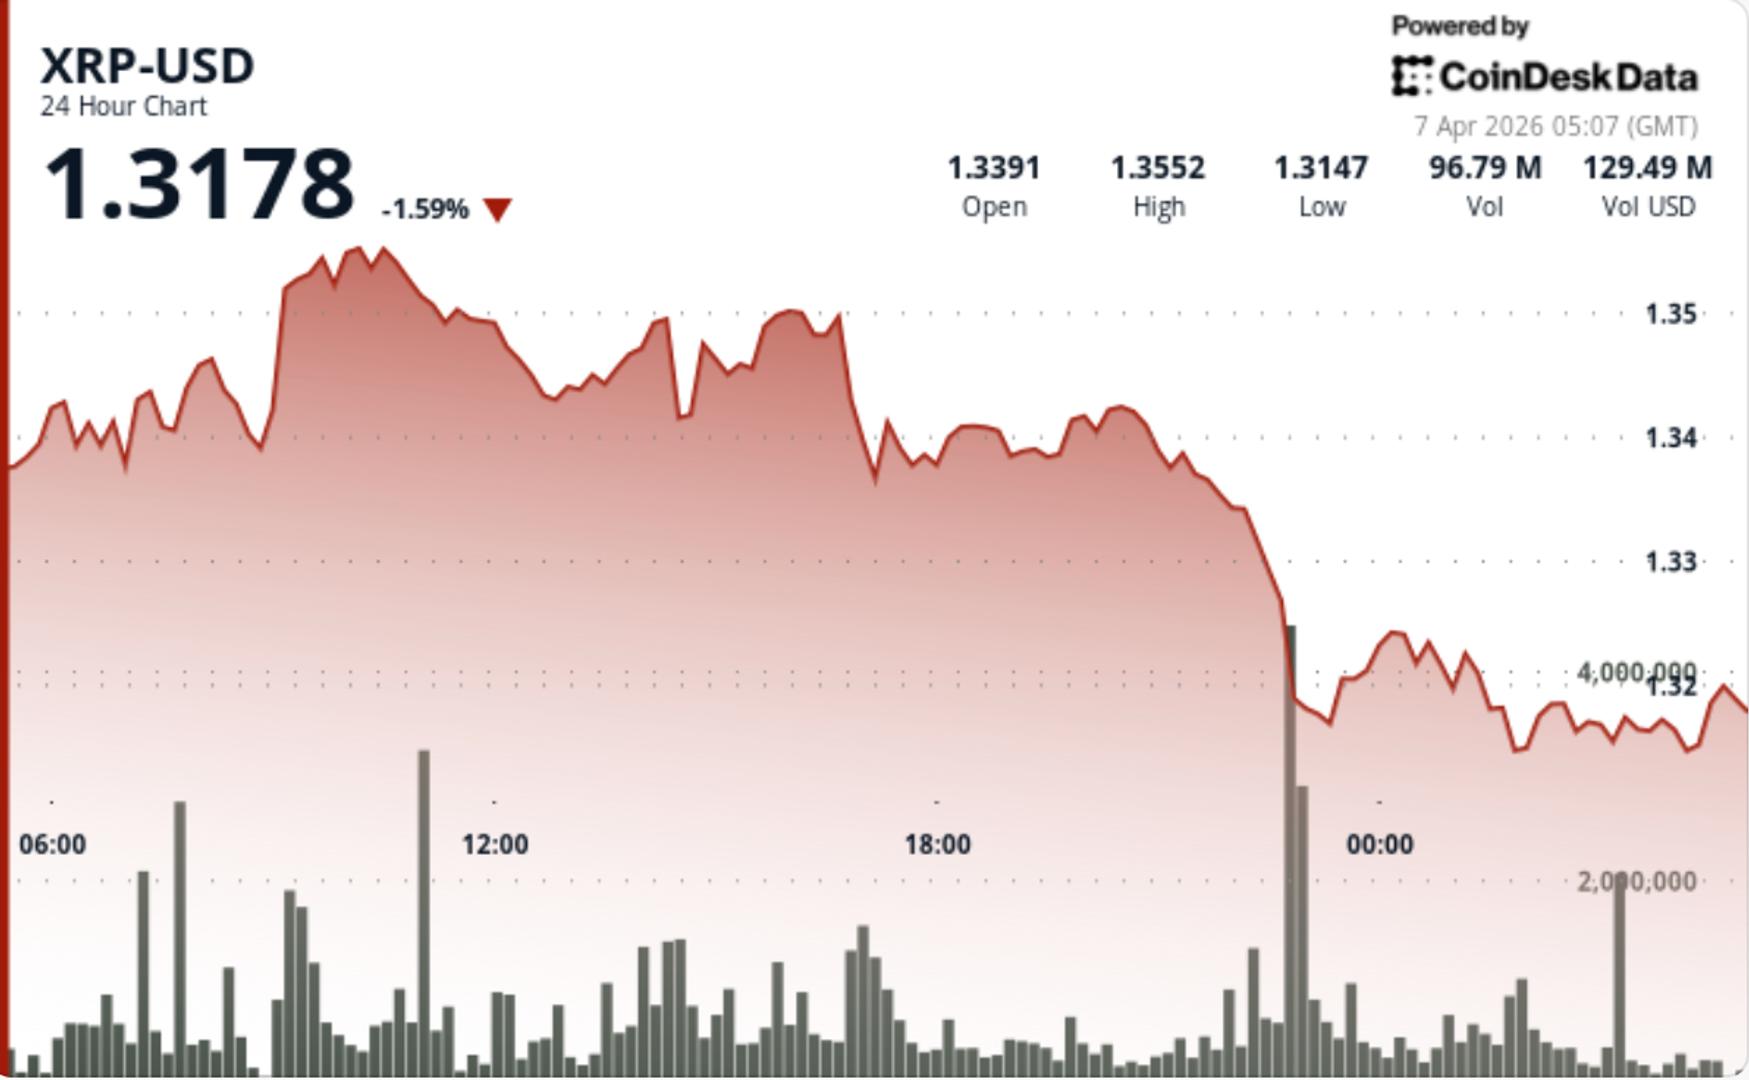

Rejection at $1.35 and collapsing depth raise risk of sharper moves as positioning builds.
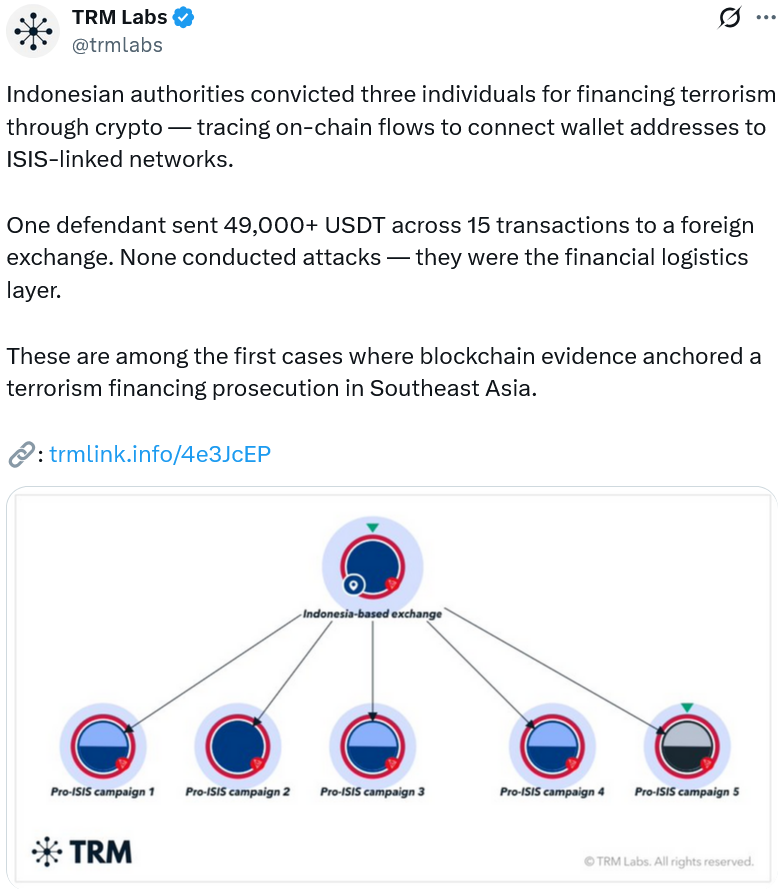
Onchain evidence was key to securing the conviction of three individuals for terrorism financing in Indonesia in 2024 and 2025, reflecting a clear shift in the way courts value onchain evidence.
“Indonesian courts have demonstrated that cryptocurrency evidence — wallet addresses, transaction histories, on-chain flows — is not only admissible but can anchor a terrorism financing prosecution,” TRM said in a statement Sunday.
TRM said terrorism financing networks have preferred cryptocurrency as a mechanism of choice to move money, as authorities and regulators have been slow to treat it with the same level of scrutiny as traditional fiat channels, but noted that this is now changing.
Indonesian authorities traced one defendant sending more than $49,000 worth of USDt (USDT) across 15 transactions from a local exchange to a foreign platform, with the funds later routed to an ISIS-linked terrorism fundraising campaign in Syria, according to the blockchain firm.
Indonesia’s financial intelligence team and its counterterrorism police unit, Densus 88, carried out the analysis and presented the findings to Indonesian courts, which accepted the blockchain data as key evidence in each of the three cases.

Indonesia is not the only country in Southeast Asia using blockchain analytics to catch criminals, TRM said.
“Similar patterns are emerging across Southeast Asia, where governments are investing in blockchain intelligence capabilities and enhancing collaboration between public and private sectors to address illicit finance risks.”
TRM Labs said that Singapore and Malaysia’s financial intelligence units and law enforcement agencies are also building the technical capacity to trace cryptocurrency flows.
Related: Drift Protocol says $280M exploit took ‘months of deliberate preparation’
On April 1, Cambodian and Chinese officials captured Li Xiong, a leader of the Huione Group, an organization that served scam centers in Cambodia that carried out “pig butchering” frauds and other investment schemes to steal crypto from victims around the world.
Xiong was extradited to China, where he is set to face fraud and money-laundering charges.
His extradition came three months after the arrest of Chen Zhi, the head of Prince Group, which operates Huione Group.
TRM reported in February that illicit entities received about $141 billion worth of stablecoins in 2025, marking a five-year high.
Magazine: Are DeFi devs liable for the illegal activity of others on their platforms?

Iran reportedly struck Jubail Industrial City in Saudi Arabia’s Eastern Province on April 7.
According to media reports, Iranian ballistic missiles and drones sparked large fires at the site. Jubail is one of the world’s largest industrial hubs and a cornerstone of Saudi Arabia’s petrochemical sector.
“Jubail and Yanbu (where Saudi has its second largest petrochemical complex) account for 85% of Saudi Arabia’s non-oil exports,” Theti Mapping wrote.
Follow us on X to get the latest news as it happens
According to Drop Site, an adviser to Iranian Parliament Speaker Mohammad Bagher Ghalibaf posted on X that Tehran considers Saudi Arabia a “main instigator” alongside Israel. The advisor warned that,
“The damage it will inflict on Saudi Arabia and bin Salman’s financial partners in the Trump family is beyond calculation.”
What Iran’s Counter-Proposal Contains
Meanwhile, Iran has formally rejected Washington’s 15-point peace plan with a 10-point counter-framework.
The counter-framework conditions any deal on security guarantees against future attacks, a permanent end to the war, Israeli withdrawal from Lebanon, and full US sanctions relief.
Tehran also proposed reopening Hormuz in exchange for those concessions, but attached a $2 million-per-ship transit fee split with Oman. Iran would direct Hormuz fee revenues toward reconstruction rather than accepting formal war reparations.
The twin moves signal Tehran’s intent to negotiate from a position of strength, even as President Trump’s 8 PM ET Tuesday deadline for reopening the Strait of Hormuz approaches.
“Iran has clearly and overtly won the war and will only accept an ending that consolidates its gains and creates a new security regime in the region. The true state of affairs is this: it is Trump who has about 20 hours to either surrender to Iran or his allies will return to the Stone Age. We will not back down!” Mahdi Mohammadi, strategic adviser to Iranian Parliament Speaker Mohammad Bagher Ghalibaf, posted.
Polymarket traders continue to price slim odds on a near-term US-Iran ceasefire. The prediction platform assigns only a 3% chance of that happening by April 7.
The market impact of the latest escalation is clearly visible. Bitcoin (BTC) dipped roughly 2% to around $68,500 in early Tuesday. At the same time, Brent crude jumped over 1% past $111. Gold fell 0.54%, and silver dropped 1.1%.
US equity indices, however, held relatively stronger, with the Nasdaq Composite, Dow Jones Industrial Average, and Russell 2000 all posting modest gains.
Whether Tehran’s gambit forces a diplomatic breakthrough or triggers the infrastructure strikes Trump promised will likely become clear within hours.
Subscribe to our YouTube channel to watch leaders and journalists provide expert insights
The post Iran Strikes Saudi Arabia’s Al Jubail Hours Before Trump’s Hormuz Deadline appeared first on BeInCrypto.
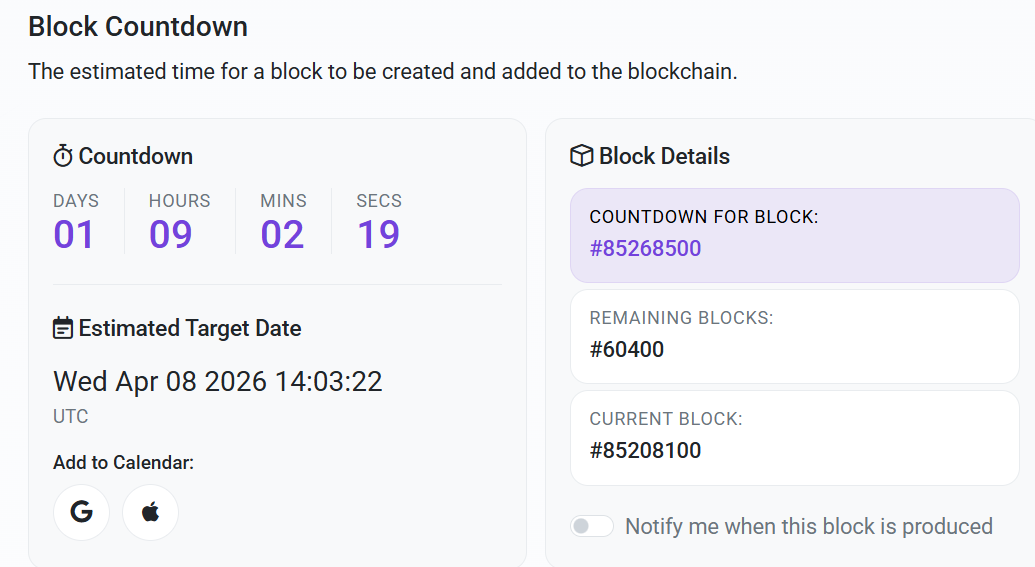
The Polygon Foundation confirmed the Giugliano hardfork will activate on mainnet at block 85,268,500, roughly 2 p.m. UTC on April 8.
The upgrade targets faster finality and improved fee transparency as part of the network’s broader push toward higher throughput for payments and tokenized assets.
What the Giugliano Upgrade Changes
The hardfork allows block producers to announce blocks earlier, reducing the time users wait for transaction confirmation to become irreversible.
Testing on the Amoy testnet last month showed a roughly two-second improvement in finality time.
Giugliano also embeds EIP-1559-style fee parameters directly into block headers. This gives developers and applications more efficient access to gas pricing data at the protocol level.
New Remote Procedure Call (RPC) endpoints accompany the fee changes. These let wallets and decentralized applications query fee information without relying on external estimations.
“This upgrade enables faster finality by letting producers announce blocks earlier, adds fee parameters directly in block headers, and introduces new RPC support for fee data,” Polygon shared.
Node operators must update Bor to v2.7.0 or Erigon to v3.5.0 before the activation block. Regular users and developers do not need to take any action.
A Stability Push After a Rough 2025
The upgrade arrives after a turbulent stretch for Polygon (POL) network reliability. In September 2025, a consensus bug caused finality delays of up to 15 minutes, prompting an emergency hard fork to restore normal operations.
Two months earlier, a validator exit triggered a bug in the Heimdall consensus layer that halted finality for roughly one hour.
Since then, the team has shipped several hardforks to tighten stability. The Madhugiri upgrade in December 2025 raised throughput to approximately 1,400 transactions per second.
The Lisovo hardfork in March 2026 added improvements to smart contract reliability and subsidized gas for AI agent transactions.
Part of the Gigagas Vision
Giugliano fits within Polygon’s Gigagas roadmap, announced in June 2025, which targets 100,000 TPS for global-scale payments and real-world asset settlement.
The phased plan began with the Bhilai upgrade in July 2025, which boosted throughput to over 1,000 TPS and reduced finality from over 60 seconds to roughly 5.
The network now processes around 2,600 TPS, with internal devnets reportedly hitting above 5,000. Whether faster finality and better fee tooling translate into sustained usage growth will depend on post-upgrade network data in the coming weeks.
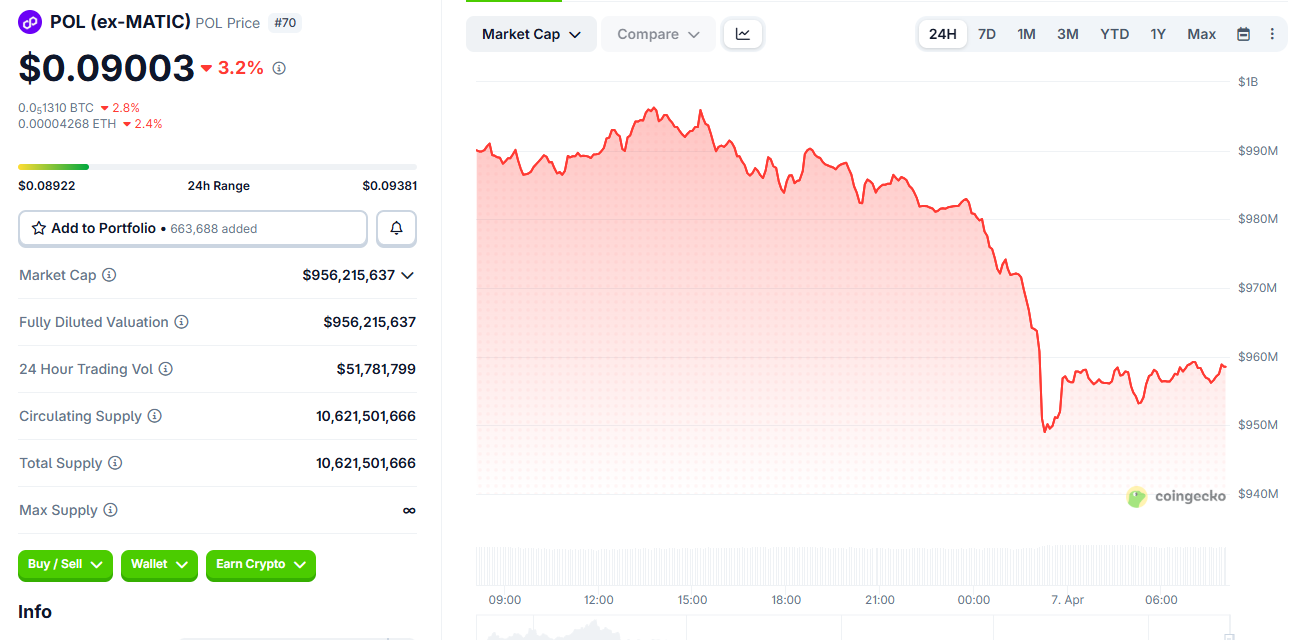
Despite anticipation for the harfork, Polygon’s powering token, POL, was down by almost 5%, trading for $0.09003 as of this writing.
The post Polygon’s Giugliano Hardfork Signals a Stability Push After a Rough 2025 appeared first on BeInCrypto.
Crypto World
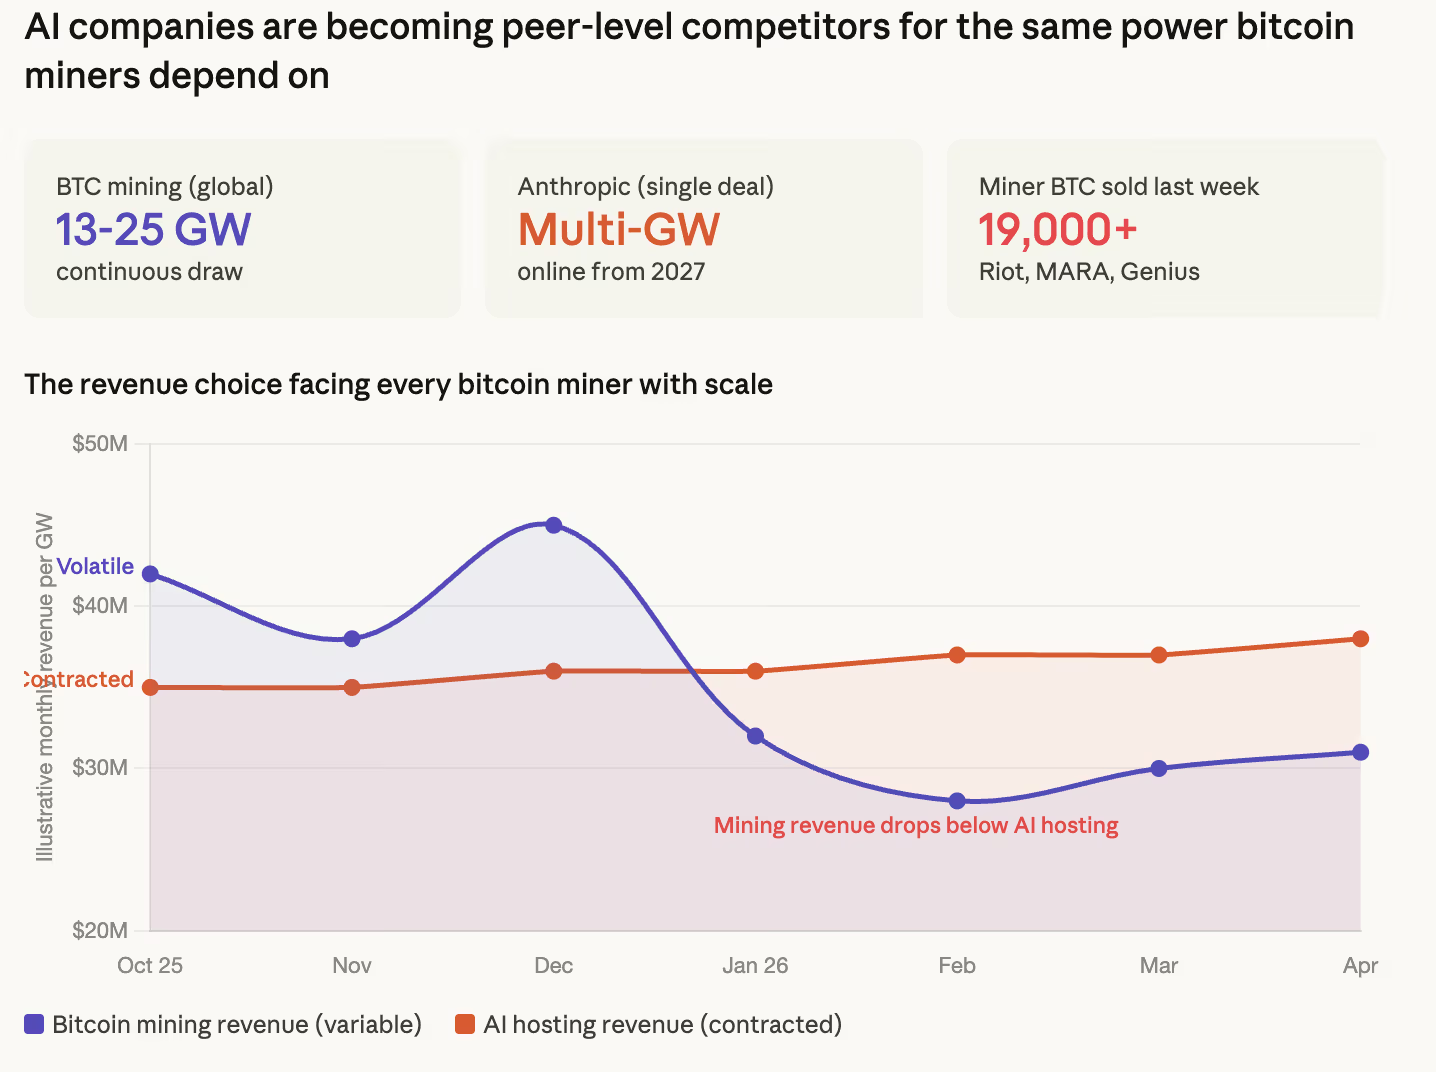
Bitcoin miners face a new rival for cheap power as Anthropic signs multi-gigawatt compute deal
Anthropic has announced a partnership with Google and Broadcom for “multiple gigawatts” of next-generation TPU compute capacity expected to come online starting in 2027, a commitment the company called its most significant to date as revenue growth accelerated to a $30 billion annual run rate from $9 billion at the end of 2025.
The scale of AI compute demand is now competing directly with bitcoin mining for the same scarce resources — grid connections, land permits, cooling infrastructure, and cheap electricity.
We’ve signed an agreement with Google and Broadcom for multiple gigawatts of next-generation TPU capacity, coming online starting in 2027, to train and serve frontier Claude models.
— Anthropic (@AnthropicAI) April 6, 2026
A Cambridge tracker estimates bitcoin mining draws roughly 13 to 25 gigawatts of continuous power globally depending on hardware efficiency assumptions.
Anthropic securing multiple gigawatts from a single deal, on top of existing capacity across AWS Trainium, Google TPUs, and Nvidia GPUs, shows just how quickly AI is becoming a peer-level competitor for the same energy infrastructure that miners depend on.
And Anthropic is one company. OpenAI, which raised $122 billion last week and described compute as a “strategic moat,” is building across an even wider infrastructure portfolio spanning five cloud providers and four chip platforms.
The aggregate AI compute buildout now represents one of the largest sources of new electricity demand in the United States, arriving at the same moment bitcoin miners are deciding whether to mine bitcoin or rent their infrastructure to AI companies.

That decision is increasingly going one direction. Core Scientific converted a significant portion of its mining capacity to AI hosting through a deal with CoreWeave. Iris Energy and Hut 8 have expanded their AI and high-performance computing revenue. Riot Platforms, MARA Holdings, and Genius Group disclosed selling more than 19,000 BTC from their treasuries last week, a sign that mining economics alone are not sustaining operations at current prices and difficulty levels.
A bitcoin miner running a gigawatt of capacity earns revenue that fluctuates with bitcoin’s price and network difficulty. The same gigawatt rented to an AI company earns a contracted rate with predictable cash flows.
At $69,000 bitcoin with difficulty at all-time highs and energy costs rising alongside every other industrial consumer competing for the same grid capacity, the AI rental often pays better.
The revenue numbers behind the expansion tell their own story. Anthropic said the number of business customers spending more than $1 million annually on Claude has doubled from 500 to over 1,000 in less than two months.
None of this means bitcoin mining is dying, however. The network’s hashrate continues to hit record levels above 1 zetahash per second.
But the miners who survive the current cycle may look less like energy companies that produce bitcoin and more like infrastructure companies that happen to mine bitcoin on the side while renting their real asset, cheap power at scale, to an AI industry that cannot build data centers fast enough.
The Solana Foundation on Monday announced a new security auditing framework for Solana-based protocols in addition to an incident-response network, warning that “adversaries are rapidly innovating.”
The Solana Foundation, a Swiss organization that supports the adoption and security of Solana, and Web3 security firm Asymmetric Research unveiled the Solana Trust, Resilience and Infrastructure for DeFi Enterprises (STRIDE), stating that it was a “structured program for evaluating, monitoring and escalating security across Solana projects.”
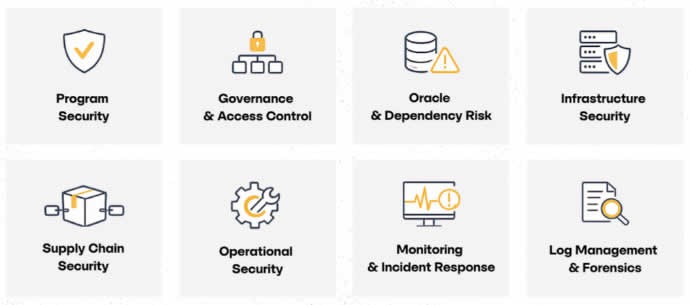
The initiative works to evaluate the security of protocols across eight pillars: program security, governance and access control, oracle and dependency risk, infrastructure security, supply chain security, operational security, monitoring and incident response, as well as log management and forensics.
Protocols are independently assessed against these requirements, with findings published publicly, said Asymmetric Research. “This gives users, investors, and the broader ecosystem real transparency into the security posture of the protocols they interact with.”
The announcement comes just a week after one of the largest DeFi exploits this year, with the Drift Protocol losing around $280 million following a social engineering attack from North Korean-linked threat actors.

Solana Incident Response Network
The Solana Foundation also announced the Solana Incident Response Network (SIRN), a network of security firms for real-time incident response across the Solana ecosystem.
“Members will share threat intelligence, coordinate responses to active incidents, and contribute to the ongoing evolution of the STRIDE framework,” it stated.
Related: Crypto hackers steal $169M from 34 DeFi protocols in Q1: DefiLlama
The foundation did not mention artificial-intelligence agents directly, but the announcement comes at a time when they are becoming an increasing threat to crypto protocols.
In January, $40 million was drained from the Solana DeFi platform Step Finance, with AI agents amplifying the damage by executing large transfers autonomously, KuCoin reported last week.
Attackers hit 34 DeFi protocols in Q1
Malicious actors stole over $168 million in cryptocurrency from 34 DeFi protocols in the first quarter of 2026, according to data from DefiLlama.
However, the figure has fallen significantly from the same period last year, when $1.58 billion was pilfered in Q1, 2025.
The largest exploit for the period was the private key compromise of Step Finance.
Magazine: No more 85% Bitcoin collapses, Taiwan needs BTC war reserve: Hodler’s Digest
Newly uncovered call logs suggest Argentine President Javier Milei spoke with one of the entrepreneurs behind the Libra token multiple times on the night he promoted the cryptocurrency, raising questions about Milei’s assertion that he had no connection with the project.
According to logs obtained by Argentine prosecutors investigating the token’s collapse, which were seen by The New York Times, there were reportedly a total of seven phone calls between the unnamed entrepreneur and Milei before and after he made his Libra promotion post on X.
The contents of those calls remain unknown, according to the Times.
The collapse of the Libra token has seen Argentine lawyers hit Milei with fraud charges and there were also calls for his impeachment. Fraud can attract a prison sentence of between one month and six years in Argentina.
Cointelegraph has contacted Argentina’s presidential office for comment.
Libra investors lost at least $251 million
In February 2025, Milei made a post on X promoting the Libra token as a way to grow Argentina’s economy by funding small businesses and startups.
The token surged before losing more than 96% of its value from its peak, costing investors around $251 million. Milei later deleted his posts, prompting accusations of a possible rug pull.
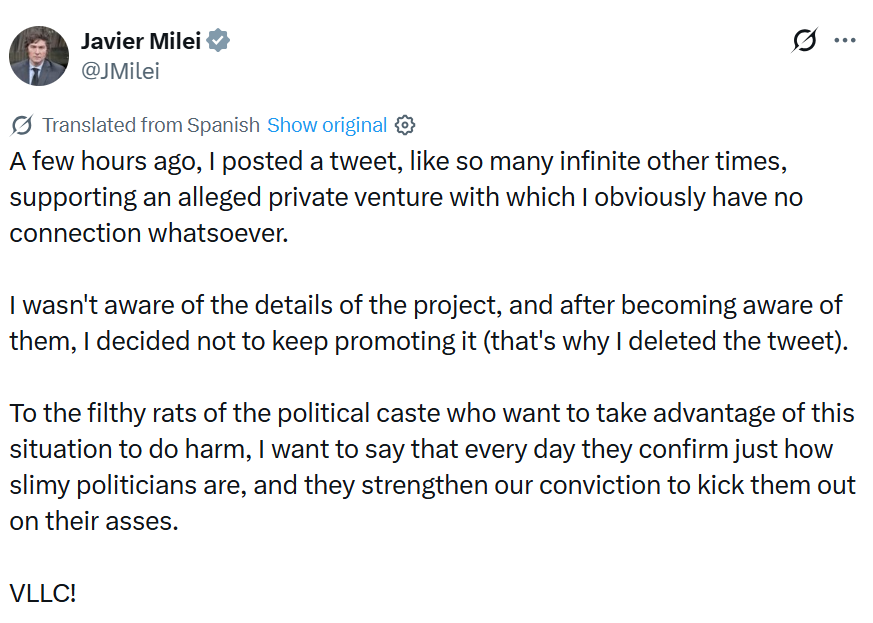
Milei has denied any wrongdoing in promoting the short-lived token, saying he was merely highlighting a private venture and had no involvement in the project.
“A few hours ago, I posted a tweet, like so many infinite other times, supporting an alleged private venture with which I obviously have no connection whatsoever,” he said in a post on X.
“I wasn’t aware of the details of the project, and after becoming aware of them, I decided not to keep promoting it, that’s why I deleted the tweet.”

Federal investigation into Libra collapse ongoing
Following the Libra collapse, federal prosecutors launched an investigation that has named Milei as a person of interest. The case remains ongoing.
Argentina’s Anti-Corruption Office cleared Milei last June of violating public ethics rules and found his post was personal rather than in his capacity as president.
Related: Argentina turns up the heat in Libra scandal with sweeping asset freeze
In a recent March update, a judicial investigation uncovered a draft document on crypto lobbyist Mauricio Novelli’s phone suggesting a possible $5 million agreement connected to Milei’s promotion of the Libra token.
The draft note was reportedly written just three days before Milei posted about the Libra token on X, but it does not specify who would receive the funds.
Magazine: Bitcoin may take 7 years to upgrade to post-quantum — BIP-360 co-author

The proposal includes a startup exemption, a fundraising exemption and an investment contract safe harbor for issuers.
US Securities and Exchange Commission Chair Paul Atkins has revealed that a key crypto market safe harbor proposal has landed at the White House for review.
Speaking at the Digital Assets and Emerging Technology Policy Summit on Monday, Atkins said the Regulation Crypto Assets proposal — outlined by the SEC in mid-March — has now been submitted to the Office of Information and Regulatory Affairs.
“We will have reg crypto that we will be proposing here shortly. It’s in fact at OIRA right now, which is the next step before being published,” he said.
Regulation Crypto Assets covers three main ideas: a startup exemption, a fundraising exemption and an investment contract safe harbor for issuers.
If the proposal does end up becoming official rules as part of the SEC’s oversight, it could drive more crypto innovation in the US while providing further regulatory clarity for the industry.
Atkins emphasized that the SEC wants to “hear from the marketplace” to make the whole package “workable.” He did not go into many specifics but said there were a few things the SEC is “building into it” alongside measures such as crypto safe harbors and exemptive relief.

SEC proposal is taking shape
Generally, the SEC first votes to approve a formal proposal, which is then sent to OIRA for review. OIRA then completes the review and it is published in the Federal Register and put up for public feedback.
Cointelegraph reached out to the SEC for comment on the matter.
Related: CFTC chief launches innovation task force focused on crypto framework
The startup exemption would enable projects to raise up to a defined amount over a four-year period with softer disclosure requirements, while the fundraising exemption would enable issuers to raise a defined amount over 12 months while “retaining the ability to rely on other exemptions from registration under the federal securities laws.”
The investment contract safe harbor would protect certain assets from the definition of a security once the project team has ceased all of its managerial efforts “represented or promised” as part of the investment contract.

Disgruntled researcher leaks “BlueHammer” Windows zero-day exploit

The Quantum Financial System, XRP, New Currency, and Universal Basic Income!

Harry Kane: Why Real Madrid Champions League tie could make or break his Ballon d’Or hopes

Smart energy pays enters the US market, targeting scalable financial infrastructure

Why Israel is blocking foreign journalists from entering

Bitcoin: We’re Entering The Most Dangerous Phase
The Quantum Financial System, XRP, New Currency, and Universal Basic Income!

Pak-UAE Financial Update | Debt Repayment Plan Finalized | 2 Countries Step In to Support Pakistan

Financial Advisors React to the BEST and WORST Tax Advice
-

 NewsBeat4 days ago
Steven Gerrard disagrees with Gary Neville over ‘shock’ Chelsea and Arsenal claim | Football
-

 Business4 days ago
No Jackpot Winner and $194 Million Prize Rolls Over
-

 Fashion3 days ago
Weekend Open Thread: Spanx – Corporette.com
-

 Crypto World5 days ago
Gold Price Prediction: Worst Month in 17 Years fo Save Haven Rock
-

 Business1 day ago
Three Gulf funds agree to back Paramount’s $81 billion takeover of Warner, WSJ reports
-
Crypto World7 days ago
Dems press CFTC, ethics board on prediction-market insider trades
-

 Sports2 days ago
India men’s 4x400m and mixed 4x100m relay teams register big progress | Other Sports News
-

 Business3 days ago
Expert Picks for Every Need
-

 Business5 days ago
Login and Checkout Issues Spark Merchant Frustration
-

 Tech7 days ago
EE TV is using AI to help you find something to watch
-

 Sports7 days ago
Tallest college basketball player ever, standing at 7-foot-9, entering transfer portal
-

 Tech7 days ago
How to back up your iPhone & iPad to your Mac before something goes wrong
-

 Tech7 days ago
What Are The Biggest Limitations Of Supercomputers?
-

 Crypto World6 days ago
Bitcoin enters the public bond market as Moody’s gives a first-of-its-kind crypto deal a rating
-
Crypto World6 days ago
Bitcoin stalls below key resistance as technical signals skew bearish
-

 Politics7 days ago
Transform Your Space with Stunning Small Works
-

 Politics6 days ago
Starmer’s centre has collapsed, and the left was right all along
-

 Tech5 days ago
Commonwealth Fusion Systems leans on magnets for near-term revenue
-
Business2 days ago
No Jackpot Winner, Prize to Climb to $231 Million
-

 Fashion7 days ago
Zara Turns Up the Heat With New Swimwear
You must be logged in to post a comment Login