

Crypto World
Ethereum Foundation stakes $46M in ETH as treasury activity ramps up


The Ethereum Foundation has staked over $46 million worth of ether in its largest single-day allocation, while continuing to rotate parts of its treasury through sales.
Summary
- Ethereum Foundation has staked 22,517 ETH worth over $46 million in its largest single-day deposit into the Beacon Chain.
- The move has followed a 2025 treasury strategy to deploy holdings for yield.
On-chain data from Arkham Intelligence shows the foundation transferred 22,517 ETH (ETH) to the Ethereum Beacon Deposit Contract at around 1:38 a.m. ET on Monday.
The contract is used to lock ETH into the network’s proof-of-stake system, where it helps validate transactions and secure the chain. The move marks the foundation’s biggest recorded staking transaction so far.
The latest deposit builds on a broader shift in treasury management that began last month, when the nonprofit first staked 2,016 ETH following a 2025 policy update outlining plans to actively deploy treasury assets to generate returns while supporting the network’s long-term development.
According to the foundation, this approach allows it to both strengthen Ethereum’s security and fund core operations, including protocol research and development, ecosystem growth initiatives, and community grants.
The increase in staking activity comes shortly after the foundation also executed a separate treasury transaction, selling 5,000 ETH in an over-the-counter deal worth just over $10.2 million to BitMine Immersion Technologies.
It marked the second instance of the foundation directly selling ETH to a corporate treasury firm, following a 10,000 ETH sale to SharpLink Gaming in July last year. The foundation has maintained that periodically selling assets across market cycles allows it to sustain development efforts without relying solely on external funding.
At the time of writing, ETH price was trading above $2,057, up more than 2.5% over the past 24 hours, with gains extending across both weekly and monthly timeframes.


Binance will allow non-U.S. users to trade more than 7,000 U.S. stocks and ETFs as the exchange pushes deeper into traditional markets.
Summary
- Binance will let non-U.S. users trade over 7,000 U.S. stocks and ETFs commission-free.
- Users can buy fractional shares from $5 using USDT, USDC, BNB and selected cryptocurrencies.
- Binance plans bStocks on BNB Chain as tokenized equities race gains more exchange backing.
Binance opens U.S. stock access
The new service will offer zero-commission trading and fractional share purchases starting at $5, according to Fortune. The feature will target users outside the United States.
Customers will be able to buy equities using USDT, USDC, BNB and selected cryptocurrencies. Nest Trading will provide brokerage services, while Alpaca will handle custody, dividends and corporate actions.
The rollout gives Binance users access to major U.S. equities without leaving the exchange’s platform. It also adds another asset class to a business that already offers spot crypto, derivatives and other market products.
Binance co-CEO Richard Teng told Fortune that U.S. stocks represent well over half of the global equities market. He said many overseas users still face high costs and friction when trying to buy them.
bStocks tokenized equities are planned
Binance also plans to launch tokenized stocks called bStocks in the coming weeks. The product will allow eligible users to convert supported equities into on-chain assets on BNB Chain.
The planned service would create synthetic versions of selected stocks in token form. Binance says this could allow continuous on-chain access and possible use in decentralized finance applications.
“Native bridge from traditional stock ownership to programmable, always-on tokenized assets at a global scale,” Binance said in a statement to Fortune.
The company said bStocks may support use cases such as lending and liquidity provision. The product has not launched yet, and Binance has not listed all supported equities.
Tokenized stock race widens
The move comes as more exchanges test tokenized exposure to public markets. As previously reported by crypto.news, Bitget launched Reality with more than 100 tokenized assets, including U.S. stocks and ETFs backed 1:1 through regulated brokers.
That report said Reality supports stablecoin dividend payouts, DeFi-compatible tokenized assets, and 24/5 minting and redemption. The platform also includes selected private-market and pre-IPO-linked products.
Coinbase has been building toward an “everything exchange” model, as previously reported. That strategy includes crypto, derivatives, options, tokenized stocks, equities, token sales and prediction markets.
These moves show that crypto exchanges are no longer limiting growth to digital assets. They are adding traditional market products while keeping stablecoins and blockchain settlement at the center.
Wall Street also moves on-chain
Traditional exchanges are also testing tokenized securities. Recent reporting showed that NYSE filed a rule change to allow eligible tokenized securities to trade beside regular shares on the same order book.
Under that proposal, tokenized assets would keep the same ticker, CUSIP, rights and privileges as the original securities. Clearing and settlement would remain within existing market rails during the pilot.
Binance’s plan is different because it targets non-U.S. users through a crypto exchange interface. It also links stock access with future on-chain conversion through bStocks.
The launch places Binance more directly in the race between crypto exchanges, brokers and Wall Street firms. The main test will be whether users adopt stocks and tokenized equities inside a platform best known for crypto trading.
Crypto World
Berkshire Hathaway (BRK.B) Strikes $6.8B Deal for Taylor Morrison in Abel’s First Mega-Acquisition

Key Highlights
- Berkshire Hathaway has finalized a $6.8 billion all-cash acquisition of homebuilder Taylor Morrison Home Corp.
- The $72.50 per share purchase price represents a 24% premium over Taylor Morrison’s $58.50 Friday close
- This marks Greg Abel’s inaugural major transaction as CEO following his January succession from Warren Buffett
- Taylor Morrison shares surged up to 23% in premarket activity; Berkshire Class B stock remained relatively flat
- Transaction completion is anticipated in the latter half of 2026
Berkshire Hathaway has finalized an agreement to purchase homebuilder Taylor Morrison Home Corp. through an all-cash transaction totaling $6.8 billion. The acquisition price stands at $72.50 per share, delivering a substantial 24% premium above Taylor Morrison’s $58.50 closing price from Friday’s session.
Berkshire Hathaway Inc., BRK-B
Taylor Morrison shares (TMHC) rocketed up to 23%, reaching $71.75 during Monday’s premarket session. Meanwhile, Berkshire’s Class B stock (BRK.B) showed minimal movement.
The transaction represents CEO Greg Abel’s inaugural significant acquisition since assuming leadership from Warren Buffett this past January. In a statement, Abel emphasized that the deal “reinforces our long-standing commitment to U.S. housing.”
This marks Berkshire’s most substantial transaction since acquiring Occidental Petroleum’s petrochemical division for $9.7 billion in January.
As of the conclusion of Q1 2026, Berkshire maintained an unprecedented $381.1 billion cash position in cash and Treasury securities. Market observers had been eagerly anticipating Abel’s capital allocation strategy.
Berkshire’s Class B stock has declined 5.6% year-to-date, contrasting with the S&P 500’s 10.7% advance during the identical timeframe. Some shareholders had anticipated that a major acquisition could provide momentum for the stock.
Abel’s remarks regarding the potential consolidation of Berkshire’s homebuilding divisions generated considerable interest. This approach would represent a departure from Berkshire’s historical philosophy of maintaining operational independence for acquired companies.
Christopher Davis from Hudson Value Partners characterized it as “a notable departure” from Berkshire’s established methodology, while noting that “investors will welcome that evolution.”
The Taylor Morrison Portfolio
Taylor Morrison ranks among America’s premier homebuilders. Operating from its Scottsdale, Arizona headquarters, the company maintains over 350 residential communities spanning 12 states throughout the nation.
Beyond construction, the company provides comprehensive financial services encompassing mortgage lending, title services, escrow management, and insurance products — creating an integrated service platform complementing its primary construction operations.
Current leadership, including CEO Sheryl Palmer, will remain at the helm. Palmer noted that Berkshire’s “long-term orientation is uniquely well-suited to the multi-year investment cycle of homebuilding.”
Berkshire maintains existing housing market exposure through Clayton Homes and an equity position in Lennar Corp. (LEN). The Taylor Morrison acquisition significantly amplifies that presence.
Transaction Context
The purchase arrives during challenging conditions for homebuilding companies. April witnessed a 2.8% decline in new residential construction activity. Single-family housing starts plummeted 9%, marking the sharpest contraction since August.
Mortgage interest rates have simultaneously risen to levels not observed since August, intensifying pressure on both prospective homebuyers and construction companies.
During Berkshire’s annual shareholder meeting held earlier this month, Abel revealed the company maintained a curated list of potential acquisition candidates. “There will be dislocations in markets that will allow us to act,” he stated during the proceedings.
The transaction is projected to reach completion during the second half of 2026. Goldman Sachs and Moelis & Co. are serving as financial advisors to Taylor Morrison throughout the transaction.
Separately, Berkshire revealed a fresh $2.6 billion investment position in Delta Air Lines during the first quarter of 2026.

Crypto World
BTC, ETH prices drop even as futures show growing taste for risk. XLM, HYPE gain: Crypto Markets Today


June kicked off in the red for crypto markets as the U.S. and Iran exchanged fire and peace talks failed to translate into reduced tensions in the region. The CoinDesk 20 Index (CD20) fell 2% since midnight UTC, with bitcoin and ether (ETH) both losing about 1%.
At $72,700, bitcoin is currently negative for a sixth time in seven days, following a 3.5% slide last month, usually a period with positive returns. It averages a 7.4% rise in May, according to Coinglass data. A record 10 days of net withdrawals from spot bitcoin exchange-traded funds (ETFs) saw $2.97 billion leave the investment vehicles.
The CoinDesk DeFi Select Index led the day’s decliners, dropping 2.6% since midnight, with all six members lower. Ondo Finance’s ONDO token fell 2.8%, and has now lost 17% since founder Nathan Allman died unexpectedly last week.
Hyperliquid’s HYPE stood out, adding 1.26% since midnight. A five-day streak of gains took it to a record high $73.94, its fourth in four days, as capital enters newly introduced ETFs based on the token, which started trading only last month.
U.S. stock indexes replayed Friday’s divergence, with S&P 500 and Nasdaq 100 micro-futures both adding about 0.2%.
Derivatives positioning
- BTC open interest sits at $19.5 billion, essentially level from a week ago, with speculative positioning also broadly unchanged.
- Funding rates are positive across multiple venues at 0%–10% annualized, with the prior Deribit spike now back to normal. The three-month annualized basis is 2.8%, up from 2.2% last week, pointing to a mild improvement in institutional risk appetite.
- Options positioning leans modestly bullish. Put/call volume over the past 24 hours splits 61/39 in favor of calls, while one-week 25-delta skew sits at 12.3% compared with 12.4% last week. Front-end implied volatility (DVOL) has ticked up to 37 from multi-month lows, suggesting the recent compression may be easing. The 1 month–6 month term structure remains in contango, with markets continuing to price near-term calm alongside longer-dated uncertainty.
- Coinglass data shows $282 million in 24 hour liquidations, with a 60-40 split between longs and shorts. ETH (59 million) and BTC ($48 million) were the leaders in terms of notional liquidations.
- The Binance liquidation heatmap indicates $72,280 as a core liquidation level to monitor in case of a price drop.
Token talk
- Stellar’s XLM jumped 40.4% in 24 hours to $0.2862, lifting market cap above $9.6 billion, on the back of a May 27 announcement that DTCC, Wall Street’s central clearinghouse, will connect its tokenized securities platform to the Stellar network in the first half of 2027.
- The deal makes Stellar the first public blockchain in DTCC’s multichain tokenization strategy.
- Open interest (OI) in XLM perps rose 10.9% to about $361 million as the rally unfolded, CoinGlass data show, with roughly $12 million in derivatives liquidations across the move. The combination of expanding OI alongside rising spot volume points to fresh long positioning rather than short covering doing the heavy lifting, even with the short squeeze underneath.
- Spot turnover hit about $2.3 billion on the day, up about 34%, showing the move was backed by real demand rather than a thin-liquidity spike. XLM outperformed every other top-20 token over the period.
- The breakout cleared a monthslong descending channel that had constrained the token since late last year, with the rally running from long-term support near $0.14 through prior resistance at $0.20 and $0.26.
- DTCC oversees more than $114 trillion in assets and processes about $2.5 quadrillion in securities transactions annually, putting Stellar’s selection at the center of how Wall Street brings tokenized stocks, ETFs and U.S. Treasuries onto a public blockchain.
- The partnership sits on the SEC’s December 2025 No-Action Letter authorizing the firm to tokenize real-world assets it custodies, with production testing targeted for July, wider rollout in October, and broader availability in the first half of next year.
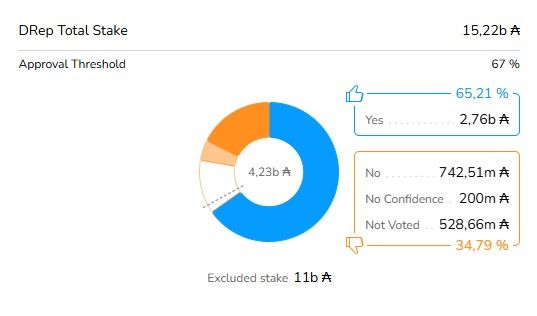
The Cardano Foundation has cancelled its annual Summit, which it had scheduled for Oct. 5–6 in Singapore. The Cardano (ADA) community stakeholders voted against funding the event from the network’s treasury.
The rejected proposal had requested 7.8 million ADA to cover the cost of the two-day event. This amount equals roughly $1.83 million. The vote outcome reflects Cardano’s on-chain governance model, under which treasury expenditures require community approval before funds are released.
Community Skepticism Sinks the Budget
Even a revised version of the proposal, which had already reduced the original ask by 22%, failed to win over enough delegates. Critics pointed to a significant gap between projected revenues and costs.
The event’s gross budget stood at $2.26 million against a revenue target of just $450,000, leaving the treasury to cover the bulk of expenses. Critics also raised additional concerns centered on the front-loading of funds. The network had slated 6.24 million ADA for release before delivering the event.

Some delegates who abstained acknowledged the revisions but said they did not believe the Summit format was the most cost-effective path to institutional adoption. Alternatives cited included smaller invite-only meetings, side events, and private roundtables.
The result adds to a pattern of contested Cardano treasury governance votes in recent months. Earlier this year, the community rejected a 32.9 million ADA research funding proposal.
EMURGO Steps In via TOKEN2049
Despite the cancellation, Cardano will maintain a presence in Singapore during the same week. A separate proposal by EMURGO to sponsor TOKEN2049, held Oct. 7–8, passed the governance vote. The Cardano Foundation said it is currently assessing next steps and evaluating future community engagement opportunities.
ADA is currently trading at $0.2327, down 1.8% over the past 24 hours, with a market cap of approximately $8.7 billion. The Hoskinson governance overhaul announced earlier this year may shape how similar proposals are structured and evaluated going forward.
The post Cardano Summit 2026 Cancelled After Community Vote Rejects Treasury Proposal appeared first on BeInCrypto.
Crypto World
These Altcoins Explode by Double Digits as Bitcoin Price Dips Below $72,000: Market Watch
The cryptocurrency market remained shaky over the past 24 hours. Bitcoin failed to build on its weekend recovery attempt and remained under pressure.
Several altcoins, however, delivered explosive double-digit gains, which creates a rather mixed picture across the broader market.
Bitcoin Price Struggles Near $72K
Bitcoin’s price action has worsened since yesterday’s market update, when it was trying to stabilize close to $74,000. Instead of reclaiming that level, BTC reversed lower and is currently found at slightly below $73,000 after dipping to an intraday low near $72,500.
The move shows that buyers continue struggling to regain control following last week’s volatility. Bitcoin remains very close to a key short-term support zone (around $72,000).
A decisive break lower could invite more selling pressure, considering that traders are already closely watching macro headlines, overall risk sentiment, and ETF flows.
It’s worth noting that the broader crypto market remains softened, with the total market capitalization hovering around $2.55 trillion. Bitcoin’s dominance remains above 57%, suggesting that traders are still cautious toward altcoins, despite isolated rallies.

These Altcoins Lead Gainers
The altcoin market was more divided. Several tokens posted very strong gains. Humanity (H) was the standout performer, surging by roughly 81% throughout the past 24 hours. LAB also jumped by more than 52%.
Worldcoin (WLD), which led yesterday’s altcoin rally, remained among the stronger performers, increasing by another 13% to around $0.38. This move extends its recent momentum and keeps the Sam Altman-linked token in focus.
On the downside, the biggest losers from the Top 100 include Morph, Algorand, and Bitcoin Cash, all of which lost between 6% and 8%.

The post These Altcoins Explode by Double Digits as Bitcoin Price Dips Below $72,000: Market Watch appeared first on CryptoPotato.
Bitcoin (BTC) heads into June with new local lows as the US-Iran war drives crypto market nerves.
- Iran ceasefire hopes hang in the balance as military strikes return, but US President Donald Trump appears confident that “it will all work out well in the end.”
- BTC price weakness quickly returns after the May close, with $72,000 liquidity on the radar.
- US employment data could still deliver a classic BTC price tailwind.
- Bitcoin long-term holders are putting February’s $60,000 lows in doubt as a reliable floor.
- Sentiment research calls for a flush of overly optimistic traders’ positions next.
Trump on Iran: “Just sit back and relax”
News of strikes on Iranian targets keep the Middle East conflict firmly on the radar as a source of crypto market volatility this week.
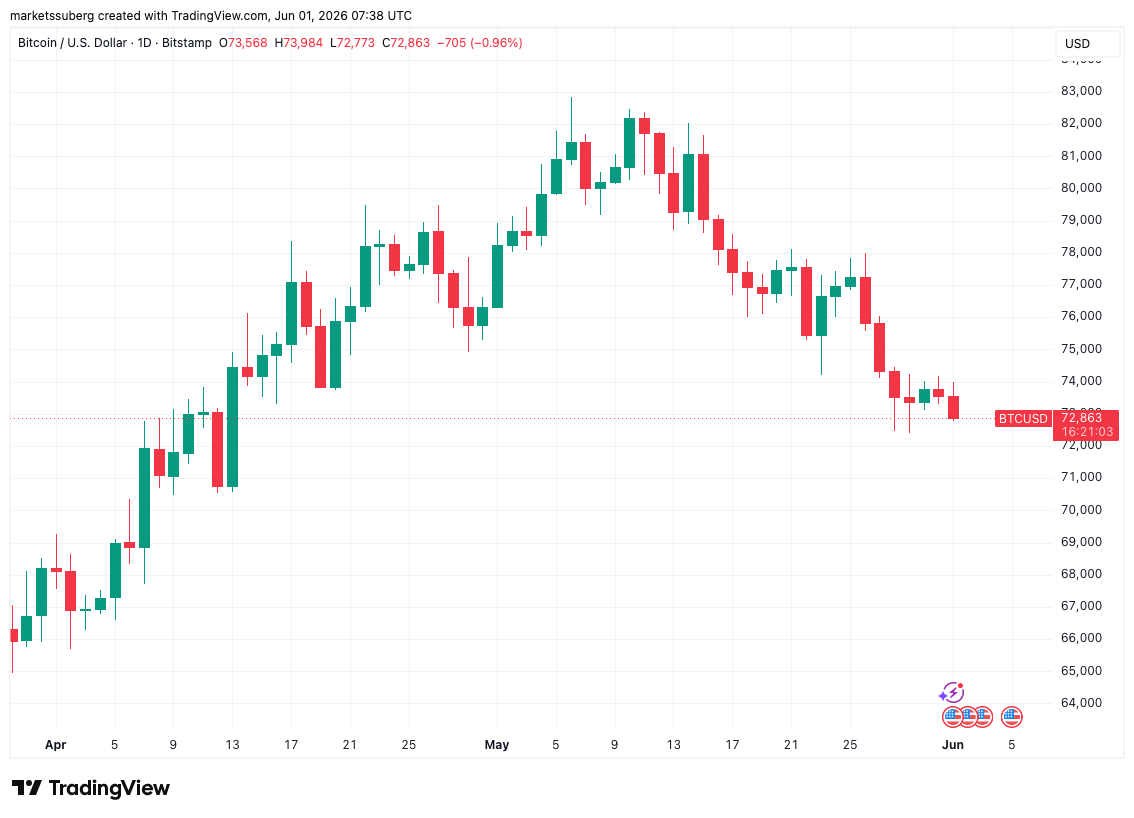
Exchanges of fire meant that BTC price action quickly came under pressure following the monthly close, dropping below $73,000.

BTC/USD one-day chart. Source: Cointelegraph/TradingView
The latest events further brought into question the odds of a ceasefire being signed, with this notionally meant to last at least 60 days.
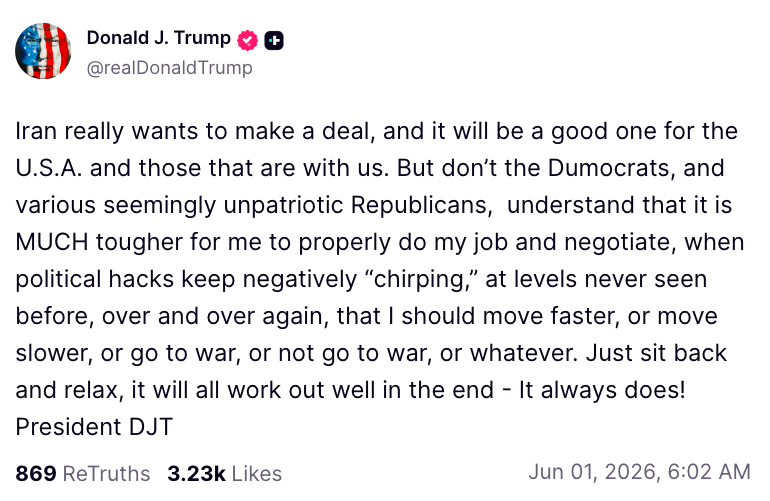
“Iran really wants to make a deal, and it will be a good one for the U.S.A. and those that are with us,” US president Donald Trump wrote in a post on Truth Social on Monday.
Trump referenced hurdles in the form of political dissent at home — rather than specific problems involving Iran itself — as the reason for the lack of progress.
He concluded:
“Just sit back and relax, it will all work out well in the end – It always does!”
Source: Truth Social
Despite Bitcoin feeling the heat, US stocks looked set to continue a trend of divergence with crypto as the new week began. S&P 500 futures opened the week up by around 0.25%.
Commenting on the factors driving the equities rally, which last week saw repeat new all-time highs, trading resource Mosaic Asset Company put AI firmly in focus.
“The narrative driving the stock market has hardly changed in recent weeks,” it wrote in the latest edition of its regular analysis series, Mosaic Chart Alerts.
“Optimism around a potential peace deal between the U.S. and Iran helps to spark a rally in the major indexes. For the most part, there has been very little substance behind the headlines, but that hasn’t stopped the rally in stocks linked to the AI infrastructure buildout.”
Bitcoin price caught between liquidity and CME gap
Bitcoin started the first week of June with a bump as US-Iran war tensions quickly spilled over into BTC price action.
Data from TradingView shows a trip below $73,000 just hours after the weekly and monthly candle close.
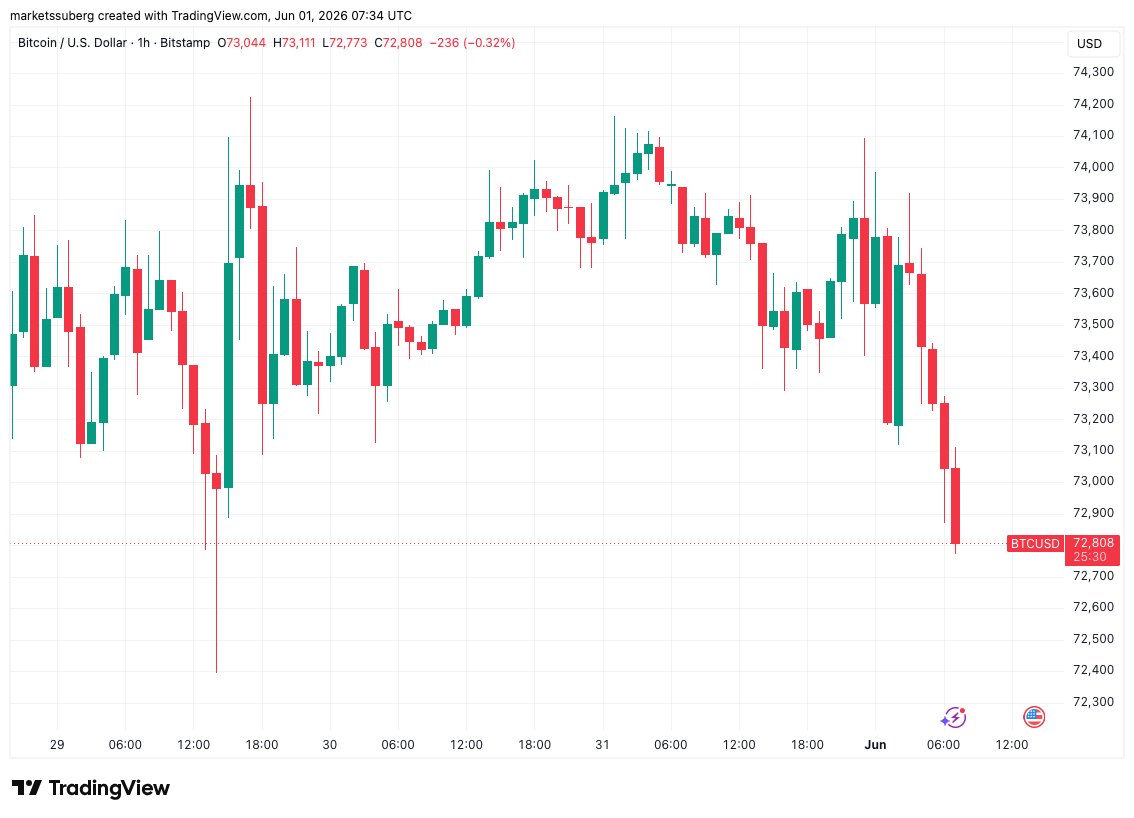
BTC/USD one-hour chart. Source: Cointelegraph/TradingView
“For now price is stuck within this mini-range since last week,” trader Daan Crypto Trades summarized in his latest analysis on X.
“~$74.2K keeps rejecting price as resistance while ~$72.7K is held as support. Those are the levels to watch in the short term.”
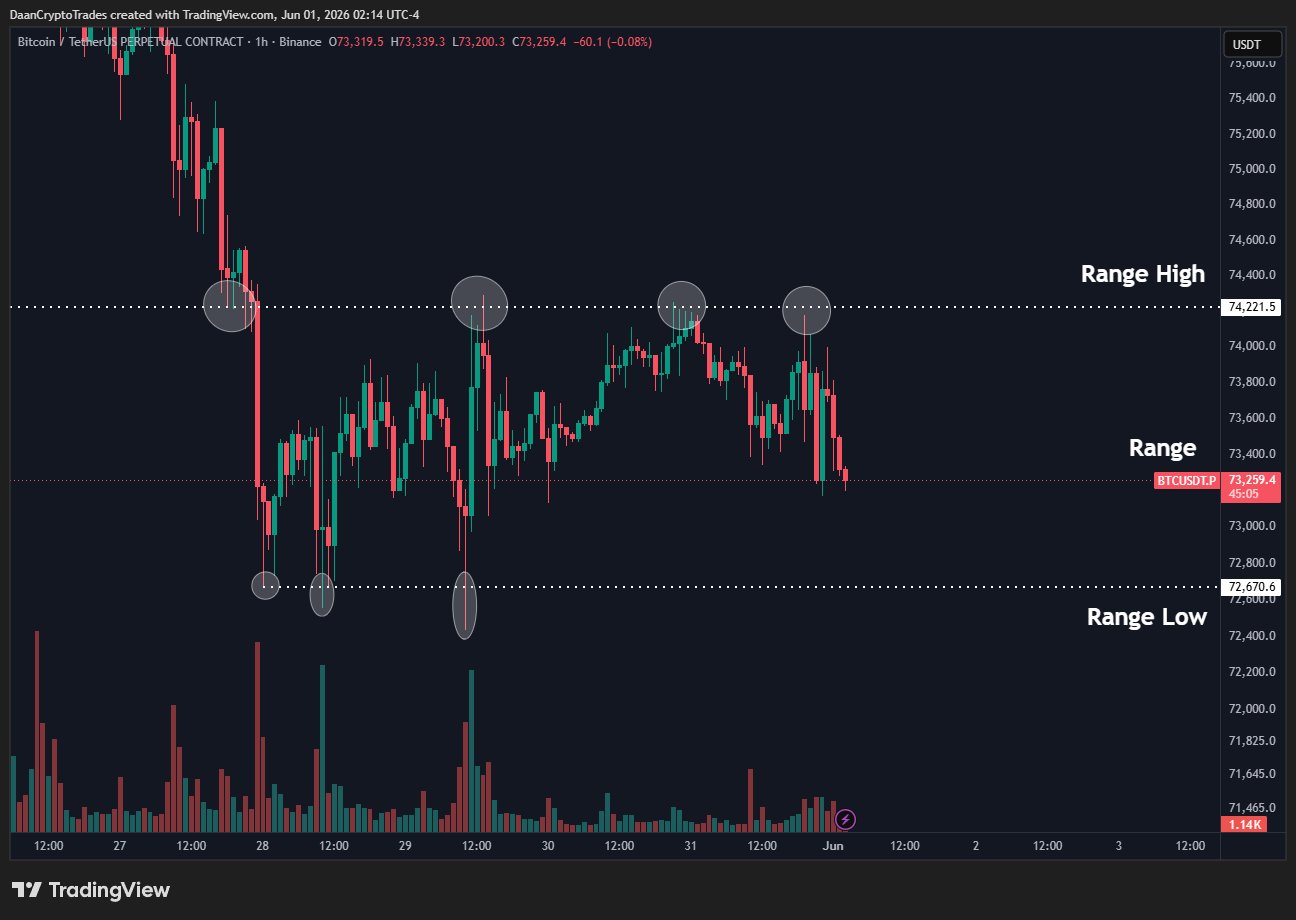
BTC/USDT perpetual contract one-hour chart. Source: Daan Crypto Trades/X
Trader CW suggested that the price was targeting nearby high-liquidity levels on exchange order books, notably a position closer to $72,000.
“The buy wall for $BTC whales is at 72k and the sell wall is at 80k,” they added.
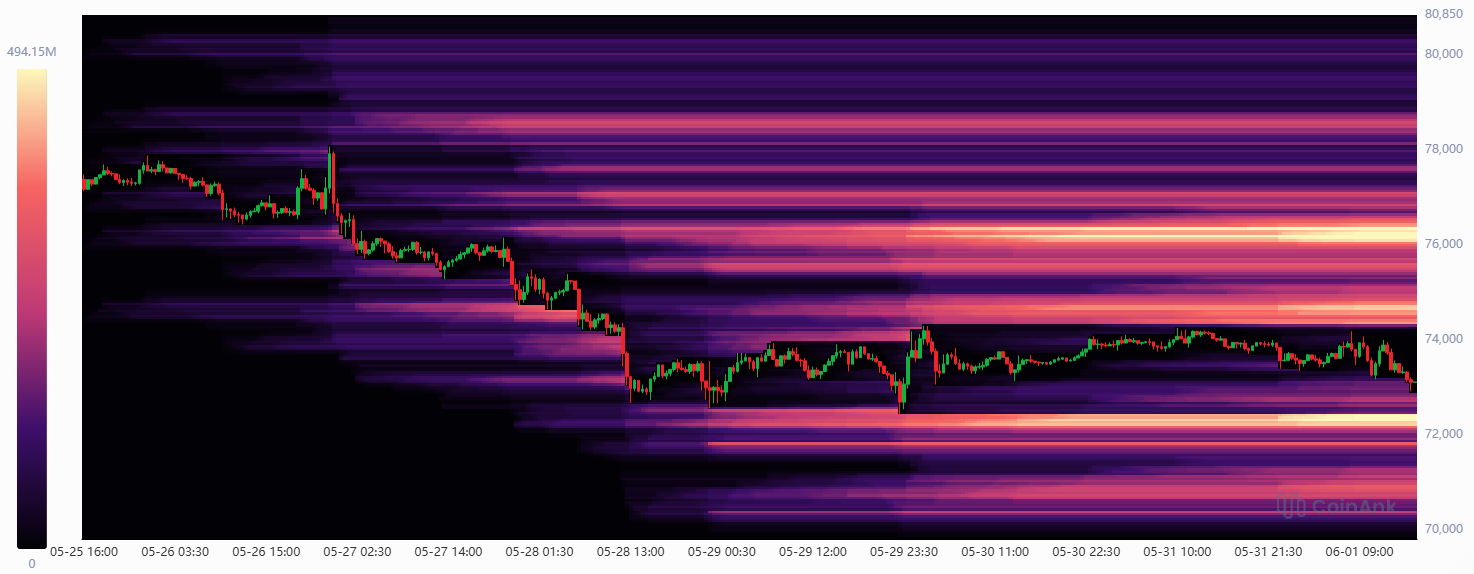
BTC order-book liquidation heatmap. Source: CW/X
A silver lining came from the weekly close itself, which preserved what trader and analyst Rekt Capital said would be a key level for bulls — $73,000.
“If Bitcoin manages to Weekly Close above $73k then price will be one step closer to confirming the Double Bottom breakout & be positioned to try to trend continue,” he told X followers at the weekend.
To the upside, trader CrypNuevo flagged a lone CME Group’s Bitcoin futures near $75,000 as a potential short-term BTC price target.
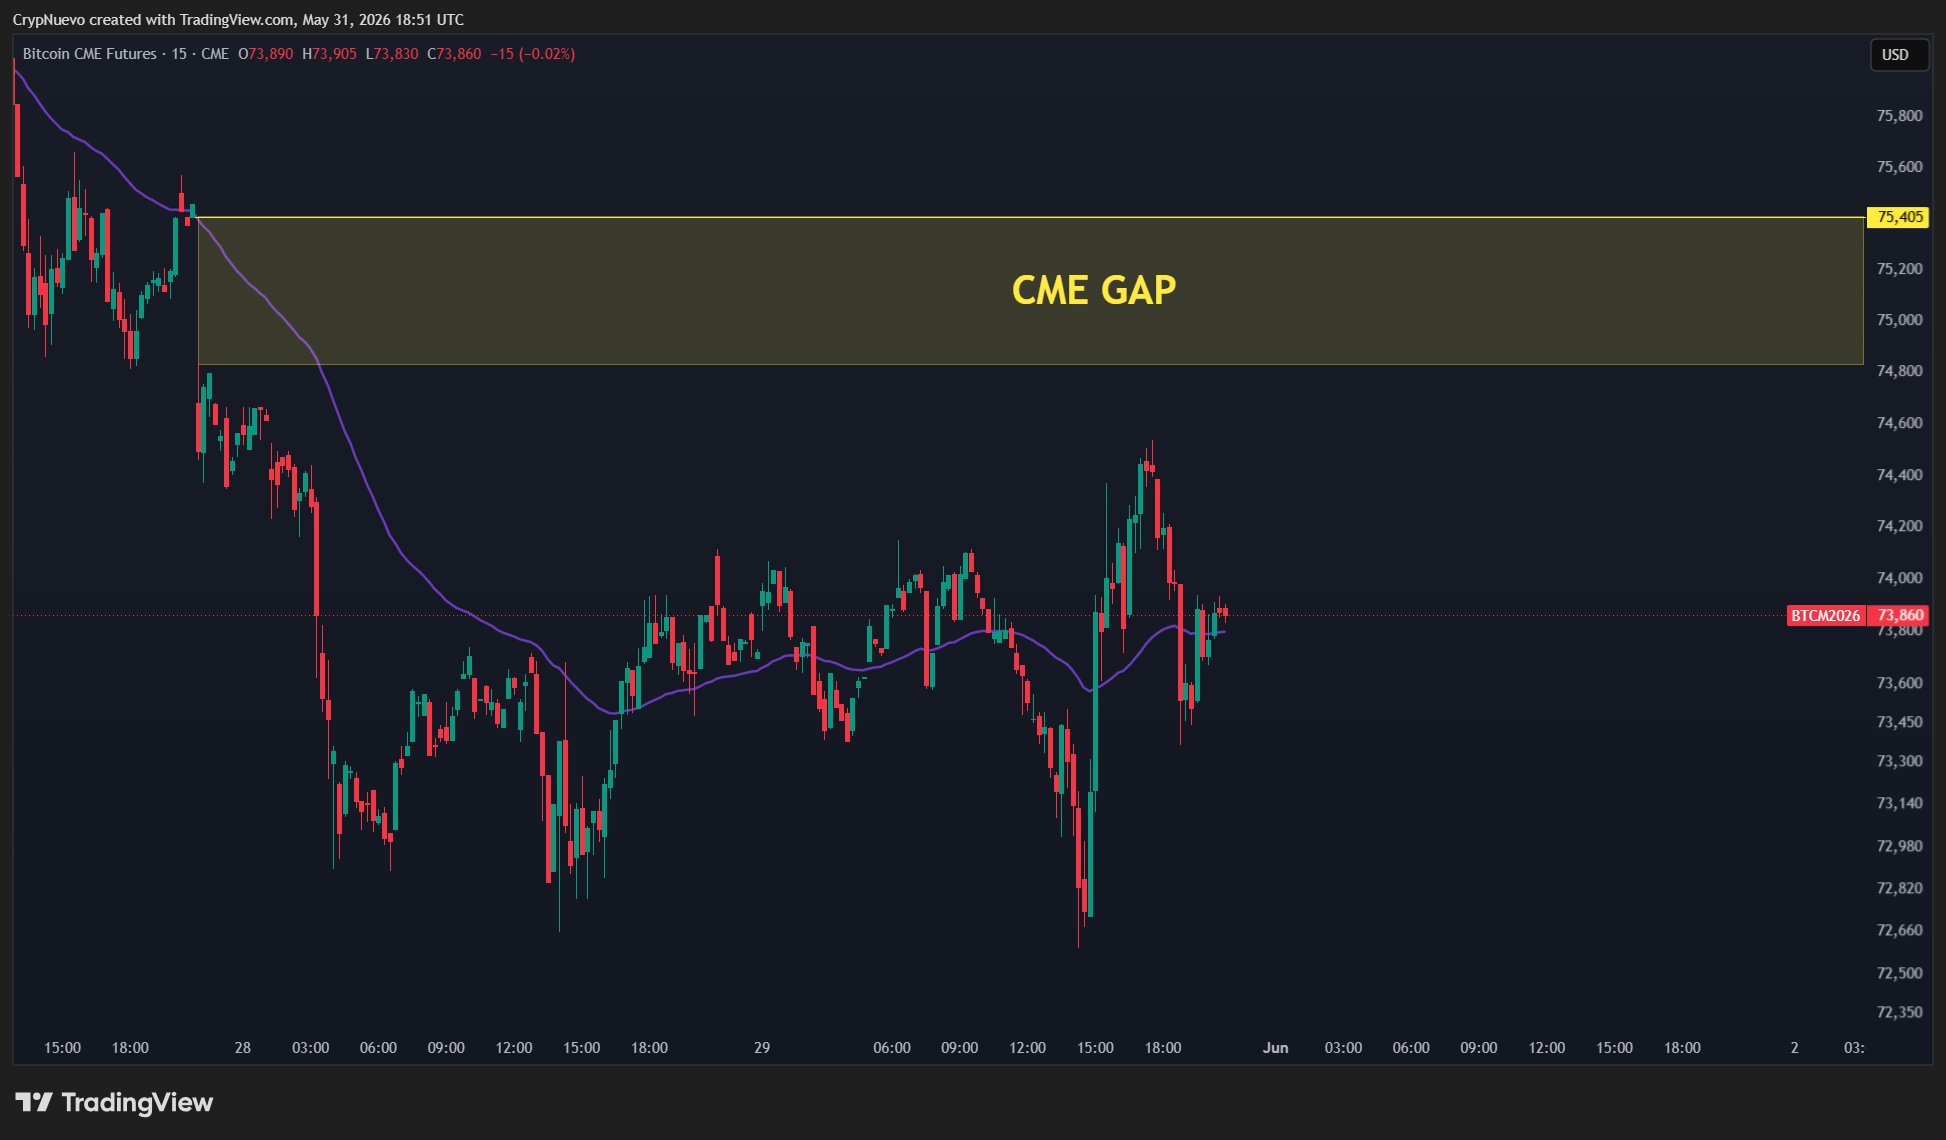
CME Bitcoin futures 15-minute chart. Source: CrypNuevo/X
As Cointelegraph reported, CME gaps became a thing of the past last week as its futures market started to trade 24 hours a day, seven days a week.
CrypNuevo said that they were looking for a “W”-shaped reversal pattern for price on low time frames.
PMI leads potential BTC price boost sources
The coming week sees inflation data yield to employment cues as the labor market becomes traders’ key focus.
Monday starts with the May print of the Institute for Supply Management (ISM) Manufacturing Purchasing Managers’ Index (PMI) — one of two core PMI releases this week.
ISM has been in a fresh uptrend since earlier in the year, when it ended a three-year period of contraction and immediately delivered a tailwind to Bitcoin price performance.
Commenting, entrepreneur and investor Mark Chadwick had some good news for crypto bulls. Based on business cycles, recent PMI figures could preclude a new period of gains.
“Expansion zones perfectly align with previous Alt Seasons – and we’re about to expand! The data backs it up too: ISM PMI has been above 50 for 3 straight months. Above 50 = expansion,” he wrote in an X post alongside data from pseudonymous analyst TechDev.
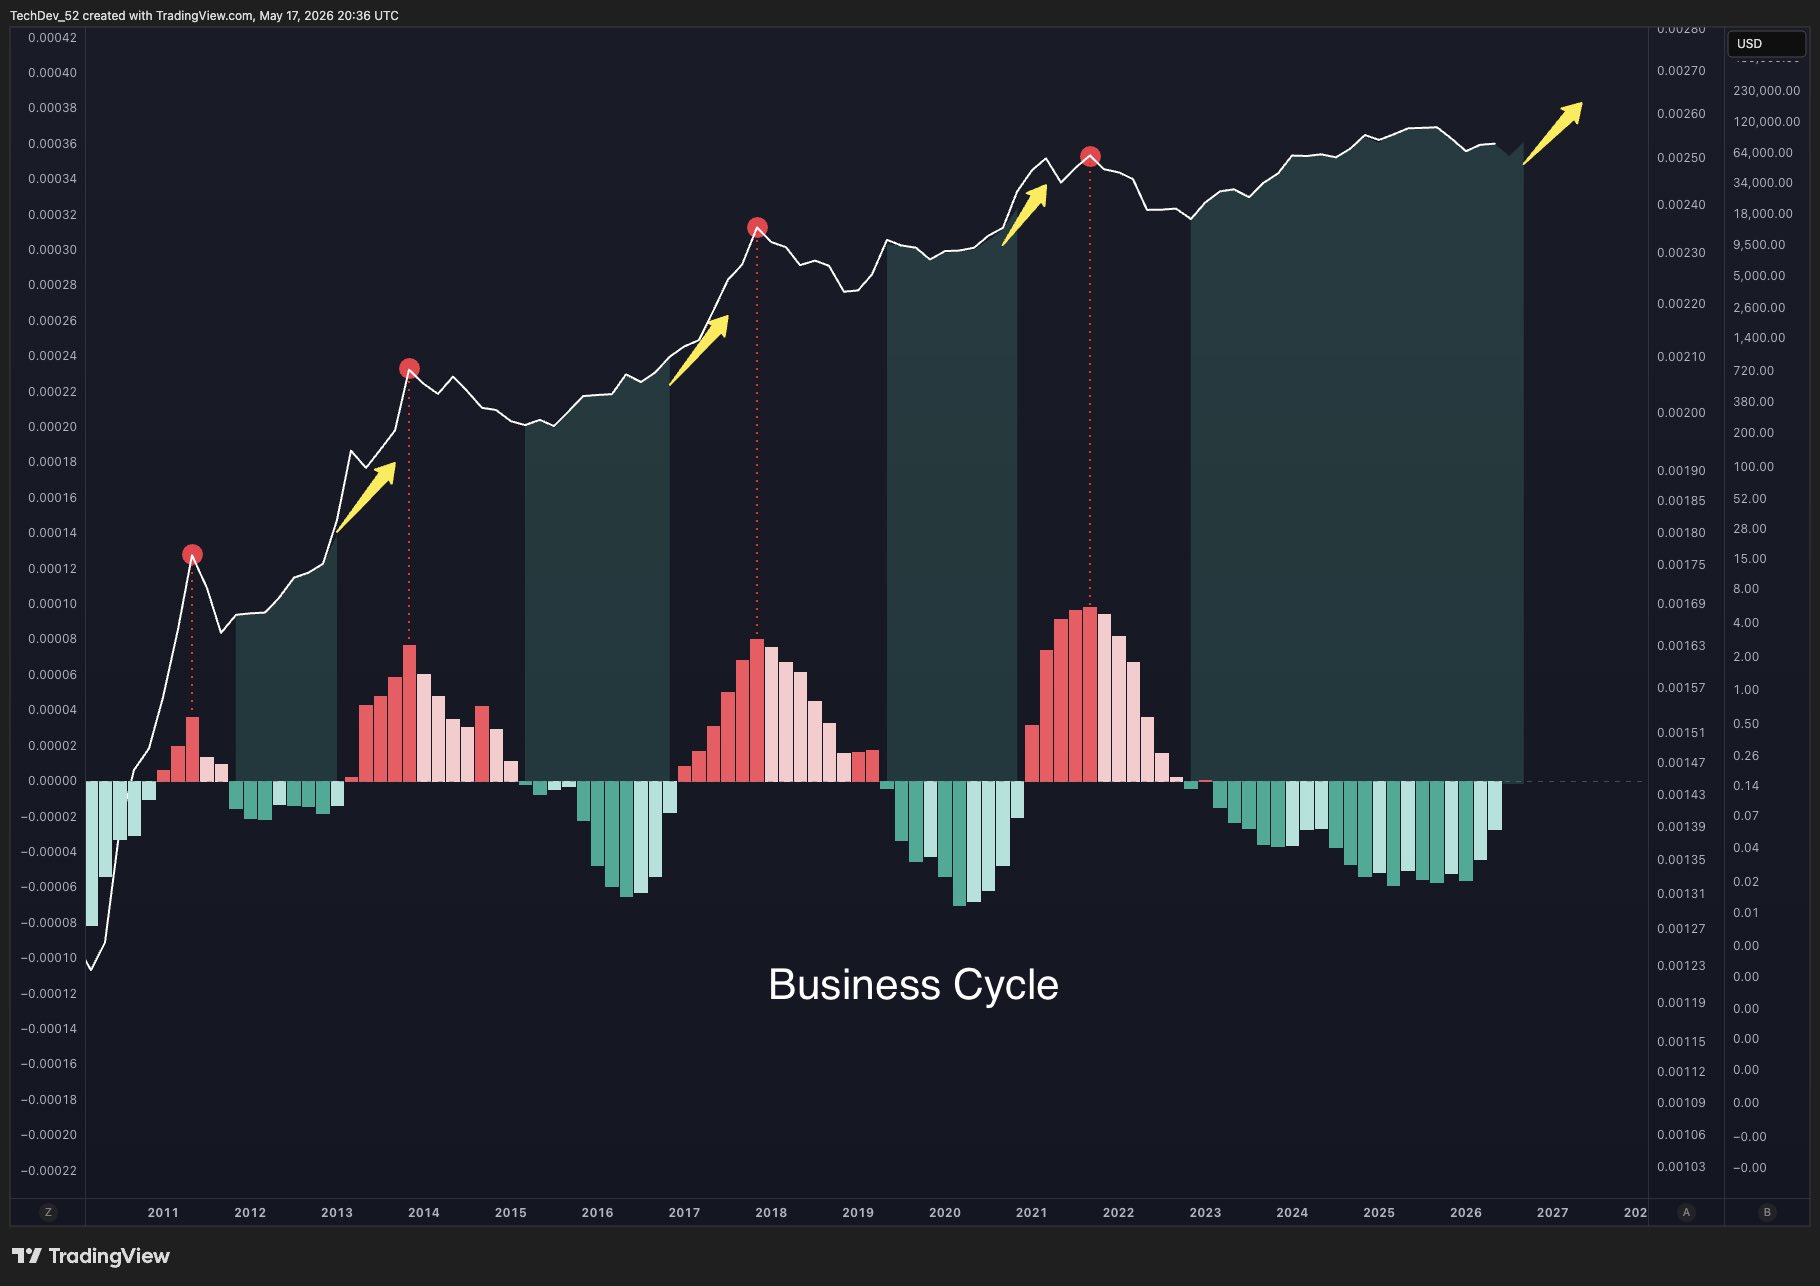
BTC/USD versus employment cycle. Source: Mark Chadwick/X
The coming days also see US nonfarm payrolls numbers, providing a snapshot of the labor market against a backdrop of rising inflation.
In a note of caution, Mosaic Asset Company reminded readers of last week’s high Personal Consumption Expenditures (PCE) inflation report.
“For investors hoping that the boost in inflation could be temporary from the jump in energy prices, the report contained bad news,” it continued.
“The core goods figure that excludes food and energy rose by 2.8% and is one of the biggest increases in decades outside of the pandemic aftermath.”
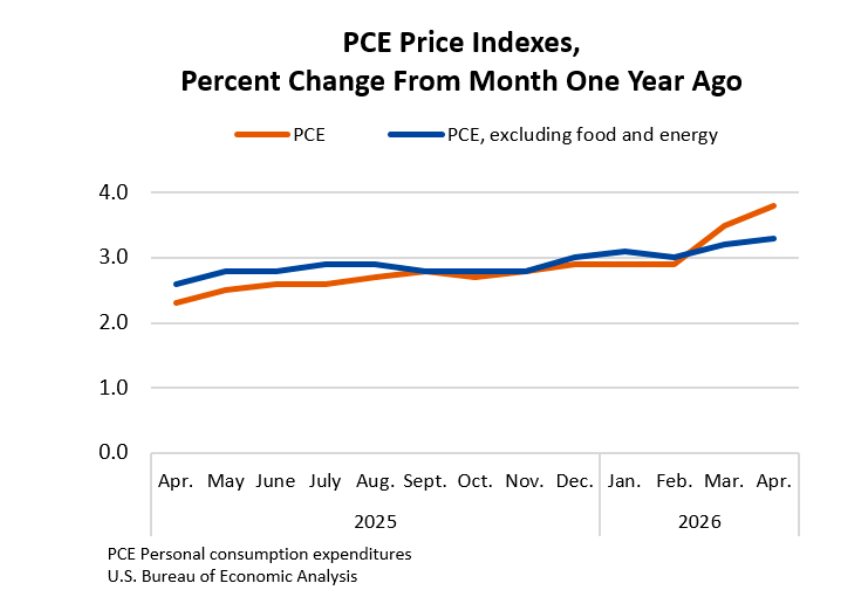
US PCE index % change (screenshot). Source: Bureau of Economic Analysis
Bitcoin long-term holders may produce a new bear-market low
Bitcoin holder trends mean that the BTC price bottom may well still be ahead in the 2026 bear market.
New findings from onchain analytics platform CryptoQuant cast doubt on the BTC price rebound from multiyear lows near $60,000.
“A rebound during a downtrend is hard to read as a bottom, because even within it the LTH (long-term holder) UTXO share keeps rising rather than declining,” contributor AbstractRyu wrote in a Quicktake blog post on Monday.
The post compares unspent transaction outputs (UTXOs) involving coins dormant for more than or less than six months, with the former classed as LTH coins.
“On Realized Cap – UTXO Age Bands (%), there are only two ways the LTH (6m+) share grows: existing holdings age in place without being spent, or STH (short-term holder) coins cross the six-month mark and reclassify as LTH,” it explains.
“Neither reflects fresh demand reviving turnover. That is why a rising share, on its own, is hard to read as bullish.”
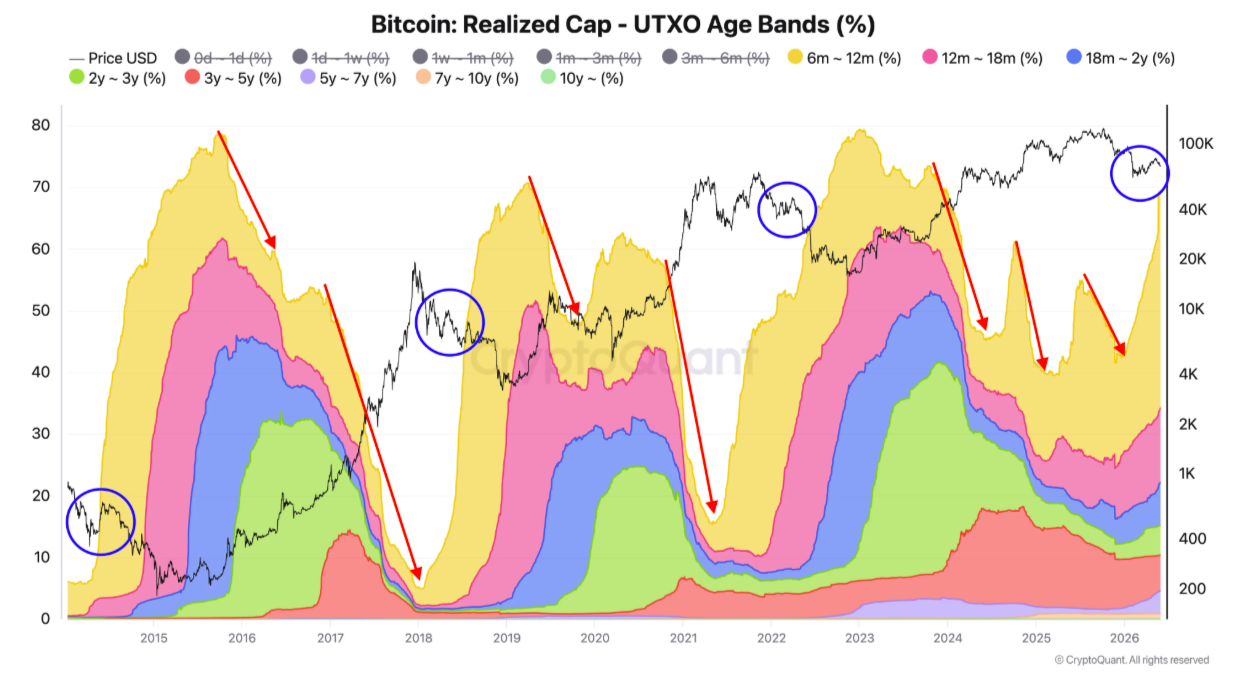
Bitcoin UTXO age data (screenshot). Source: CryptoQuant
As such, even BTC/USD rebounding by $20,000 versus its local lows is not enough to insure the market against a new macro floor. For this, LTH activity must pick up via some form of “distribution” phase.
“At present, the LTH band share has not declined at all, even through the rebounds marked by the blue circles,” AbstractRyu concluded alongside an explanatory chart.
“Distribution has not begun, and last month’s rebound, too, was likely a dead-cat bounce. The bottom is not yet in.”
Bitcoin “long-leaning bias” in need of a flush
Bitcoin continues to field concerns over a “long squeeze” thanks to overly bullish bets on BTC price action.
Related: Bitcoin price record 90-day uptrend ‘resembles bull market rally:’ New analysis
In an analysis over the weekend, CryptoQuant contributor Nino flagged positive funding rates as an ongoing signal to be “cautious” in the current market.
Funding rates, as Cointelegraph reported, have flipped net positive, indicating a “long-leaning bias” among traders.
Now, on a three-day rolling basis, funding is approaching its highest levels since the start of the year — even as price action itself tracks sideways.
“Recent market observations suggest that the 72-period moving average cluster for funding rates is showing a positive bias, approaching levels reminiscent of the peak seen in late January 2026,” Nino summarized.
“Coupled with the current stagnation in price action, this dynamic could imply an accumulation of long positions that have yet to translate into sustained upward momentum.”
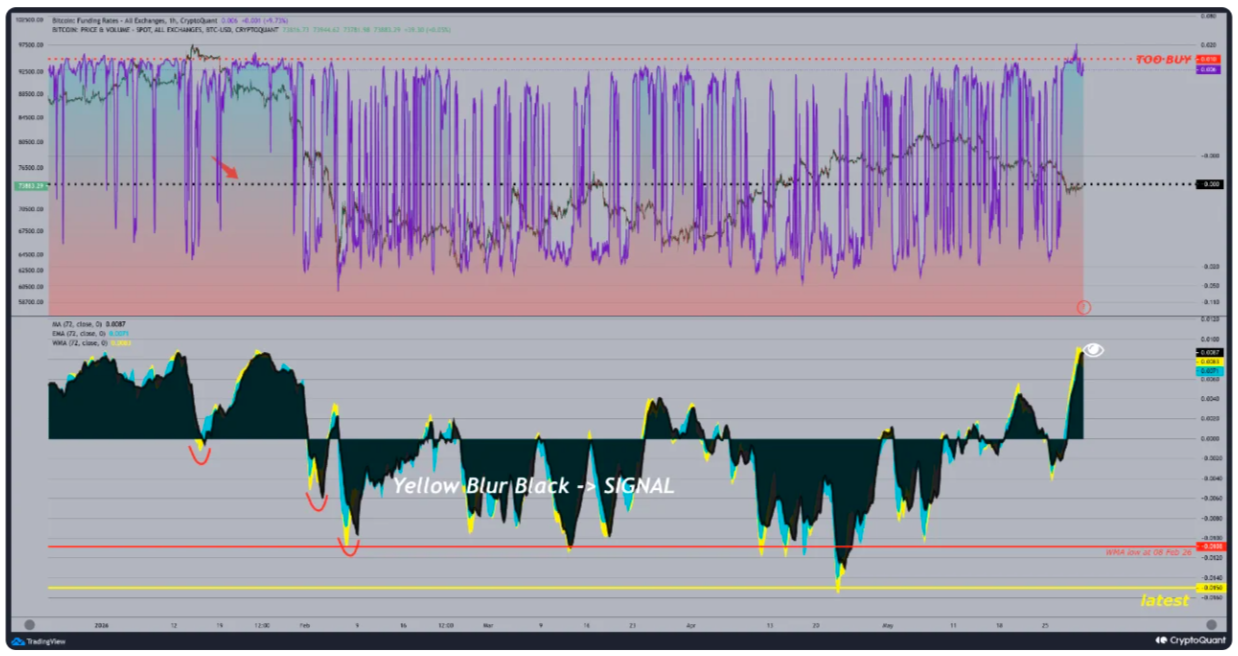
Bitcoin funding rate data (screenshot). Source: CryptoQuant
The implication is that price could redress the balance of longs and shorts by liquidating the former with a drop to new local lows.
“Consequently, the short-term outlook appears somewhat cautious, raising the possibility of a near-term downward leg as the market might need to clear potential excess leverage,” Nino added.
In its own analysis, crypto sentiment platform Santiment described the overall market mood as its most “lopsided positive” of 2026 so far.
“The current euphoria contrasts sharply with the bearish ETF flow picture and warrants caution,” it advised.
Last week Reuters? No. This article is rewritten. A $1.26 billion block trade in BlackRock’s iShares Bitcoin Trust (IBIT) was executed via a dark pool by an unidentified seller, according to analysis from NYDIG’s head of research, Greg Cipolaro. The move, involving 29.2 million IBIT shares, is interpreted by Cipolaro as evidence of a large directional holder exiting a concentrated bet rather than a routine unwind of a basis trade. The seller reportedly accepted the sale at about $1.01 below the prevailing market price of $44.17, effectively paying roughly $29.5 million in exchange for immediate execution.
The trade drew attention not only for its size but for the mechanics: a private venue, not a public market, and a sizable discount to immediate liquidation. Such characteristics are often associated with institutional liquidity needs, but Cipolaro cautioned that the available data cannot definitively distinguish between a forced liquidity event and a deliberate portfolio repositioning. “While the transaction details themselves cannot answer that question, they do demonstrate that at least one sophisticated holder was willing to pay approximately $29.5 million to eliminate a $1.26 billion bitcoin-linked position immediately,” he noted in his research release.
Bitcoin, meanwhile, faced a cautious reaction. The day of the IBIT block sale saw BTC retreat around 2.8%, though market observers noted that the move was absorbed without triggering a broader rout, a view echoed by Bloomberg ETF analyst Eric Balchunas. “The market absorbed the sale well,” Balchunas observed at the time.
“The key unanswered question is whether the seller was responding to idiosyncratic constraints or expressing a broader investment view.”
Beyond the immediate price action, the activity fed into a broader tailwind of ETF outflows. Farside Investors’ data show US-listed Bitcoin ETFs extending a streak of net outflows to 11 straight trading days, with a $333.6 million outflow recorded on the same day as the IBIT sale. In total, more than $2.9 billion has flowed out of these funds since May 14, marking a meaningful shift in near-term demand for BTC exposure through traditional exchange-traded vehicles.
The behavioral backdrop accompanying these flows is tepid at best. The Crypto Fear & Greed Index registered a score of 29 out of 100 on Monday, signaling fear in the market, and the index tracked an average “fear” rating for May. These sentiment readings dovetail with a period of uncertainty around large, liquidations and the durability of ETF-driven demand in the BTC space.
What to watch next: monitoring ETF outflow trajectories, liquidity conditions in dark pools, and Bitcoin’s price resilience as macro cues evolve will shed light on whether institutional demand for exposure through regulated products remains steady or continues to ebb amid ongoing market volatility.
Related coverage: Bitcoin’s price moves, ETF block sales, and market absorption dynamics continue to unfold as the crypto ecosystem recalibrates to a changing liquidity landscape.
Key takeaways
Market dynamics and what to watch next
Sentiment signals and investor behavior


Donald Trump used a Monday morning Truth Social post to blame Democrats and Republican critics for complicating a near-final Iran agreement.
The post followed weekend US strikes on Iranian military sites and a Tehran counterattack on a US air base in the Gulf.
The exchange marks the latest escalation in a 12-week war. Negotiators were reportedly close to a 60-day framework covering Hormuz shipping and Iran’s nuclear program.
Deal Collapse and Political Pushback
Trump’s Monday post argued that Iran wants a deal but that domestic critics are making it harder to negotiate. He had earlier requested edits to clauses governing Iran’s enriched uranium and the timing of US verification.
“Iran really wants to make a deal, and it will be a good one for the U.S.A. and those that are with us. But don’t the Dumocrats, and various seemingly unpatriotic Republicans, understand that it is MUCH tougher for me to properly do my job and negotiate, when political hacks keep negatively “chirping,” at levels never seen before, over and over again, that I should move faster, or move slower, or go to war, or not go to war, or whatever. Just sit back and relax, it will all work out well in the end – It always does!” Donald Trump posted on The Truth Social.
The draft framework would require Iran to clear all mines from the Strait of Hormuz within 30 days. It would also recommit Tehran to no nuclear weapons, in exchange for oil sanctions waivers. Roughly 20% of global petroleum passes through that chokepoint daily.
The Strait of Hormuz reopening talks have set energy prices through the conflict.
Former Secretary of State Mike Pompeo led Republican pushback, calling the proposed terms a sanctions giveaway. The internal split has complicated White House timing.
US Strikes and Tehran’s Counter
US Central Command described the weekend operations as defensive. They targeted missile launch positions and vessels deploying mines in southern Iranian waters. Iranian state media confirmed a counter-strike on a US air base in the Gulf without detailing casualties.
The war began after February’s joint US-Israeli campaign. The strikes killed senior Iranian officials, including Supreme Leader Ali Khamenei. Tehran’s closure of the strait has since triggered a sustained Asian energy market shock. It has cut roughly a fifth of global oil flows.
Iranian state outlet Fars said Trump’s recent posts contradict the agreed text. The 60-day pause memorandum remains under White House review. Treasury continues its Operation Economic Fury crackdown on Iranian sanctions evasion networks.
What Markets Are Pricing
Risk assets stayed largely flat into Monday. Bitcoin (BTC) traded near $73,300, down less than 1% over 24 hours. Ethereum (ETH) sat at roughly $1,994 according to CoinGecko data.
Earlier May strikes had pushed crypto liquidations near record levels. Leveraged positioning has since cooled, leaving traders less exposed to weekend headlines.
Equity futures and oil are moving within tight ranges. The coming week may show whether Trump signs the pending framework or escalates further.
The post Donald Trump Blames 2 Groups for Stalling the Iran Deal appeared first on BeInCrypto.


The first week of June may turn crypto’s 2025 policy wins into hard deadlines. Comment periods for the GENIUS Act’s stablecoin rules start closing this week, reaching the point where a federal framework stops being statute and becomes the operating rules issuers have to build to.
What gets settled in those windows decides who can issue, what reserves they hold and whether yield survives. Banks have spent the past few months pushing to slow the rollout, a fight over yield-bearing stablecoins that has already stalled the Clarity Act for months. The Senate floor opens June 3 to try again.
The value of stablecoins in circulation, which Samara Cohen, BlackRock’s global head of market development, called the “bridge between traditional finance and digital liquidity,” has kept rising and hit a record $322 billion in late May. The ECB is now warning these instruments could cement dollar dominance.
Macro and geopolitical impact will also need to be closely monitored. While economic data will provide further hints on the Fed’s future policy direction, an earlier-than-expected ceasefire in the Middle East could revive risk appetite.
What to Watch
(All times ET)
- Crypto
- June 2: Comment periods for GENIUS Act stablecoin frameworks close for the Treasury, FDIC and FinCEN/OFA
- June 3: The Senate floor window reopens to consolidate the Clarity Act into a single vehicle with CFTC provisions and GENIUS Act updates, targeting a August signing.
- Q3: Ethereum to move forward with the ‘Glamsterdam’ upgrade, featuring parallel execution, ePBS MEV reforms, a 200M gas limit target, and lower layer-1 transaction fees.
- Macro
- June 1, 10 a.m.: U.S. ISM Manufacturing PMI for May est. 52.6 (Prev. 52.7); Prices est. 85.3 (Prev. 84.6)
- June 1, 6 p.m.: South Korea Inflation Rate YoY for May est. 3.0% (Prev. 2.6%)
- June 2, 5 a.m.: Eurozone Inflation Rate YoY Flash for May est. 3.3% (Prev. 3.0%); Core Inflation YoY Flash est. 2.4% (Prev. 2.2%)
- June 2, 10 a.m.: U.S. JOLTs Job Openings for April est. 6.8M (Prev. 6.866M)
- June 3, 8:15 a.m.: U.S. ADP Employment Change for May est. 110K (Prev. 109K)
- June 3, 10 a.m.: U.S. ISM Services PMI for May est. 53.6 (Prev. 53.6)
- June 4, 8:30 a.m.: U.S. Initial Jobless Claims for period ending May 30 est. 216K (Prev. 215K)
- June 5, 8:30 a.m.: U.S. Nonfarm Payrolls for May est. 96K (Prev. 115K); Unemployment Rate est. 4.3% (Prev. 4.3%)
- June 5, 8:30 a.m.: U.S. Average Hourly Earnings MoM for May est. 0.3% (Prev. 0.2%)
- June 7: OPEC+ 41st Ministerial Meeting and 66th JMMC
- Earnings
- June 1: HIVE Digital Technologies (HIVE), post-market, -$0.22
Token Events
- Governance Votes & Calls
- Superfluid DAO is voting on continuing the yield backends for both ETHx and USDCx with their current code across all networks. Voting ends on June 1.
- ENS DAO is voting on a social proposal to determine the structural framework and election timeline for Term 7 of its working groups. Voting ends on June 1.
- ShapeShift DAO is voting to distribute $150,681.30 of unallocated exploit revenue to affected DeFi communities and to add discostu to the engineering workstream for business development. Voting ends on June 2 and June 3.
- Decentraland DAO is voting on lowering the voting power (VP) threshold for governance proposals from 6 million to 5 million or less, aiming to address declining voter participation. Voting ends on June 2.
- 1inch Network DAO is voting to renew its recognized delegate program for 12 months with an updated $220,000 budget and stricter performance criteria. Voting ends on June 3.
- Arbitrum DAO is voting on proposals to fund the Arbitrum Foundation with $16M in RWAs, 1,740 ETH, and 230M ARB for continued operations, and to transition Arbitrum Nova into a minimized, low-cost maintenance state. Voting ends on June 4.
- Lightchain AI DAO is voting on migrating 4.42 billion LCAI from its Ethereum-based treasury to its native Lightchain mainnet DAO treasury at a 1:1 ratio, and on approving a BitMart listing agreement and $30,000 listing fee. Voting ends on June 5 and 6.
- Unlocks
- Token Launches
- June 1: Venice (VVV) reduces token emissions by 1 million tokens per year.
- June 1: Drift (DRIFT) to be delisted from Upbit Korea.
- June 2: Sei (SEI) to unveil a “new blockchain revaluation framework for financial services” with Mastercard.
- June 4: Augur hard fork deadline.
Conferences
Crypto World
Micron (MU) Stock Soars Past $1 Trillion: What’s Fueling the Memory Chip Giant’s Epic Rally?

Key Takeaways
- Micron achieved a $1 trillion valuation momentarily on May 26 following UBS’s price target increase to $1,625 — representing the most aggressive forecast among 46 Wall Street firms tracking the company.
- Shares surged 17.4% that session, extending gains to over 220% year-to-date and a remarkable 830% over the trailing twelve months.
- Second quarter fiscal results showed revenue climbing nearly threefold to $23.86 billion, while adjusted earnings per share of $12.20 crushed expectations of $9.19.
- The company’s entire 2026 allocation of HBM (high-bandwidth memory) has been fully committed, with next-generation HBM4 production already underway for Nvidia’s upcoming Vera Rubin architecture.
- Analyst consensus leans heavily toward “Strong Buy,” with firms pointing to constrained AI memory availability that may extend into 2027.
Micron achieved a landmark valuation that caught many market watchers off guard when it briefly surpassed $1 trillion in market capitalization on May 26. Shares rocketed 17.4% to close at $881.60, after touching a 19.3% intraday peak, following UBS’s decision to nearly triple its price objective from $535 to $1,625.
This figure stands as the most optimistic projection among the 46 investment firms actively monitoring the semiconductor manufacturer.
The surge represents the culmination of an extraordinary performance period. Micron shares have skyrocketed more than 220% since the beginning of the year and climbed over 830% across the past twelve months, fueled by exceptional quarterly results, constrained supply conditions, and surging AI-related memory chip requirements.
Earnings Performance Driving the Momentum
Micron’s second fiscal quarter delivered results that fundamentally altered the company’s narrative. Revenue expanded nearly three times versus the prior year to reach $23.86 billion, compared to $8.05 billion previously. Net income registered at $13.79 billion, translating to $12.07 per diluted share, a dramatic improvement from $1.58 billion twelve months earlier.
Adjusted earnings per share of $12.20 significantly exceeded the Street consensus estimate of $9.19. Gross profit margin reached approximately 75%, demonstrating the substantial pricing leverage Micron has established during this upcycle.
Adjusted free cash flow totaled $6.9 billion for the period. The company closed the quarter with $16.7 billion in cash and marketable securities on its balance sheet.
Looking toward Q3, management projected revenue of $33.5 billion — substantially above the $24.29 billion consensus forecast at that time — alongside adjusted earnings per share guidance of $19.15.
Chief Executive Sanjay Mehrotra noted the company “set new records across revenue, gross margin, EPS, and free cash flow” during Q2, with additional records anticipated in Q3.
What’s Driving Wall Street’s Optimism
Mizuho Securities conducted meetings with Micron leadership on May 26 and maintained its Outperform rating, keeping its $800 price objective unchanged. Analyst Vijay Rakesh highlighted that HBM and DRAM demand stems primarily from AI workloads, noting that availability for major customers remains 30% to 50% short of actual requirements.
Mizuho further indicated this supply-demand imbalance could continue beyond 2026, projecting that HBM4 and HBM4e pricing might increase between 70% and 100% during 2027 after a pricing adjustment in Q4 2025.
Micron’s complete HBM production capacity for 2026 has already been fully allocated. The company is currently manufacturing HBM4 products for Nvidia’s Vera Rubin platform, which supports analyst confidence in sustained pricing strength.
Beyond Mizuho’s assessment, D.A. Davidson launched coverage with a Buy recommendation and $1,500 price target, while Morgan Stanley and KeyBanc have expressed similar positive outlooks. Overall Street sentiment registers as “Strong Buy,” with the average price target of $1,625 suggesting approximately 76% potential appreciation from current trading levels.
Supporting the demand thesis, Micron recently acquired Powerchip’s Tongluo manufacturing facility in Taiwan for $1.8 billion and announced plans for constructing a second site there. Leadership also increased fiscal 2026 capital expenditure guidance to exceed $25 billion.
Not all analysts dismiss potential headwinds. Some warn that incoming production capacity could create pricing pressure on memory products in 2027 and 2028, and Micron fundamentally remains a cyclical enterprise despite AI’s transformative impact on its business model.
Micron currently commands a forward earnings multiple of approximately 8.4x, contrasting with 22x for the S&P 500 and 26x for the Nasdaq 100.

The Painful Truth About Long Covid
Armed police rush to Cambridge street after teenager found with hammer
Stocks to Watch: Nvidia, Qualcomm, easyJet


-

 NewsBeat5 days ago
Israel says it has killed new Hamas military leader in Gaza City airstrikes
-

 Tech5 days ago
NASA taps Blue Origin to deliver lunar rovers for Moon Base initiative
-

 Politics7 days ago
Bridgerton Season 5: Cast, Release Date And Everything We Know So Far
-

 Sports6 days ago
2026 NBA Finals schedule, odds: Knicks await Thunder or Spurs after winning East
-

 News Videos5 days ago
XRP *JUST* SUCCEEDED!!!! CLARITY ACT EXPOSED!!! (SHE EXPOSED IT)
-

 News Videos3 days ago
This is BROKEN! INSANE 5x MONEY CAR WASH WEEK! The NEW GTA Online UPDATE Today! (GTA5 New Update)
-
 Crypto World6 days ago
Micron Crosses $1 Trillion Market Cap as AI Demand Reshapes Memory Sector
-
 NewsBeat7 days ago
Hottest May day ever as London hits 34.8C in 2C leap from previous records
-

 Business5 days ago
Selena Gomez Reportedly Upset Over Benny Blanco’s Comments on Her ‘Terrible’ Diet
-
 Tech6 days ago
China assigns ID codes to 28,000+ humanoid robots
-

 Business6 days ago
Nikkei 225 Surges Past 65,000 for First Time as Iran Peace Hopes Fuel Record Rally
-

 Tech7 days ago
Microsoft’s quiet Claude Code retreat and the real cost of enterprise AI
-

 Tech3 days ago
Waymo dominates autonomous vehicle registrations as Tesla trails behind
-
 Entertainment6 days ago
‘Breaking Bad’ Star’s Easy-to-Binge 6-Part Crime Series Spin-Off Is Finally Heading to Free Streaming
-

 NewsBeat7 days ago
Crowds find riverside shade in York as temperatures soar
-
Tech5 days ago
The Samsung pay deal is the moment Korean unions changed register
-

 Entertainment6 days ago
Days of our Lives 2-Week Spoilers May 25-June 5: Gwen Rages, Abe Confesses & 2 Tragic Anniversaries!
-
 Tech2 days ago
SpaceX just won a second Golden Dome contract. This one is $4.16 billion.
-

 Tech7 days ago
Westone Audio and Etymotic Acquired by Fidelity Collective in Major IEM Market Move
-
 Entertainment6 days ago
Taylor Swift Fans Label Travis Kelce’s Beer-Chugging A ‘Red Flag
You must be logged in to post a comment Login