

Crypto World
Fake Uniswap Website Drains Crypto Wallets as Scammers Pocket $400K

A fake website impersonating Uniswap is draining funds from multiple crypto wallets. The prominent on-chain analyst, pseudonymously known as “b-block,” warned that the scammers currently control at least $400,000 in stolen assets.
Users were urged to rely only on official links and verify protocols through DefiLlama.
Uniswap Tops List of Most-Targeted Platforms
The latest update comes a month after security group SEAL reported a major rise in malicious Google Ads targeting crypto users. It found that attackers were impersonating popular DeFi platforms, wallets, and trading applications to steal funds.
SEAL said it recently blocked over 356 malicious Google ad URLs tied to crypto scams, which targeted platforms such as Uniswap, Morpho Finance, PancakeSwap, Hyperliquid, CoW Swap, and 1inch users
According to the report, attackers used hacked or fraudulently obtained Google advertiser accounts and relied on cloaking, fingerprinting, and nested iframe delivery systems to bypass Google’s automated review checks. Many of the fake ads used trusted Google services such as sites.google.com and docs.google.com to appear legitimate in search results.
SEAL identified crypto drainer families, including Inferno Drainer and Vanilla Drainer, as the most commonly used malware in the campaigns. The report said these tools trick users into signing malicious wallet transactions or entering recovery seed phrases on cloned websites, allowing attackers to take control of wallet assets.
SEAL also added that the advanced infrastructure used in the attacks, including Cloudflare Workers, Arweave-hosted payloads, traffic redirection systems, and proxy layers, can intercept Ethereum RPC requests and monitor user activity in real time.
Uniswap was the most impersonated platform, accounting for 41% of tracked malicious sites. Between March 13 and March 30, confirmed and unattributed losses linked to the campaigns exceeded $1.27 million, although the security group said the actual figure was likely significantly higher.
Rampant Phishing Campaigns
While the recent Uniswap-related scams mainly involved fake websites and malicious Google Ads, a separate phishing campaign earlier this year targeted Ledger users through fraudulent emails. The attack followed a data breach at Ledger’s third-party e-commerce partner, Global-e, which exposed customer contact and order information.
The scammers claimed in emails that Ledger and Trezor had merged and urged users to migrate their wallets via fake websites that requested 24-word recovery phrases. The phishing pages closely copied the companies’ official branding and messaging styles.
More recently, Ripple CTO David Schwartz warned of a phishing campaign that sent fake security alerts that appeared to come from Robinhood’s official email system. The emails passed authentication checks because attackers exploited Robinhood’s account creation flow, which made the messages appear legitimate.
The phishing note claimed a new login from an “iPhone 17 Pro” and prompted users to review suspicious activity through a “Review Activity Now” button, which then directed them toward credential theft. Robinhood later confirmed the issue, but stated that no systems were breached and no funds were affected.
The post Fake Uniswap Website Drains Crypto Wallets as Scammers Pocket $400K appeared first on CryptoPotato.

Crypto World
Bitcoin Price Prediction: Andrew Tate Liquidated for 108 Times, Now He Doubles Down With 40x BTC Long
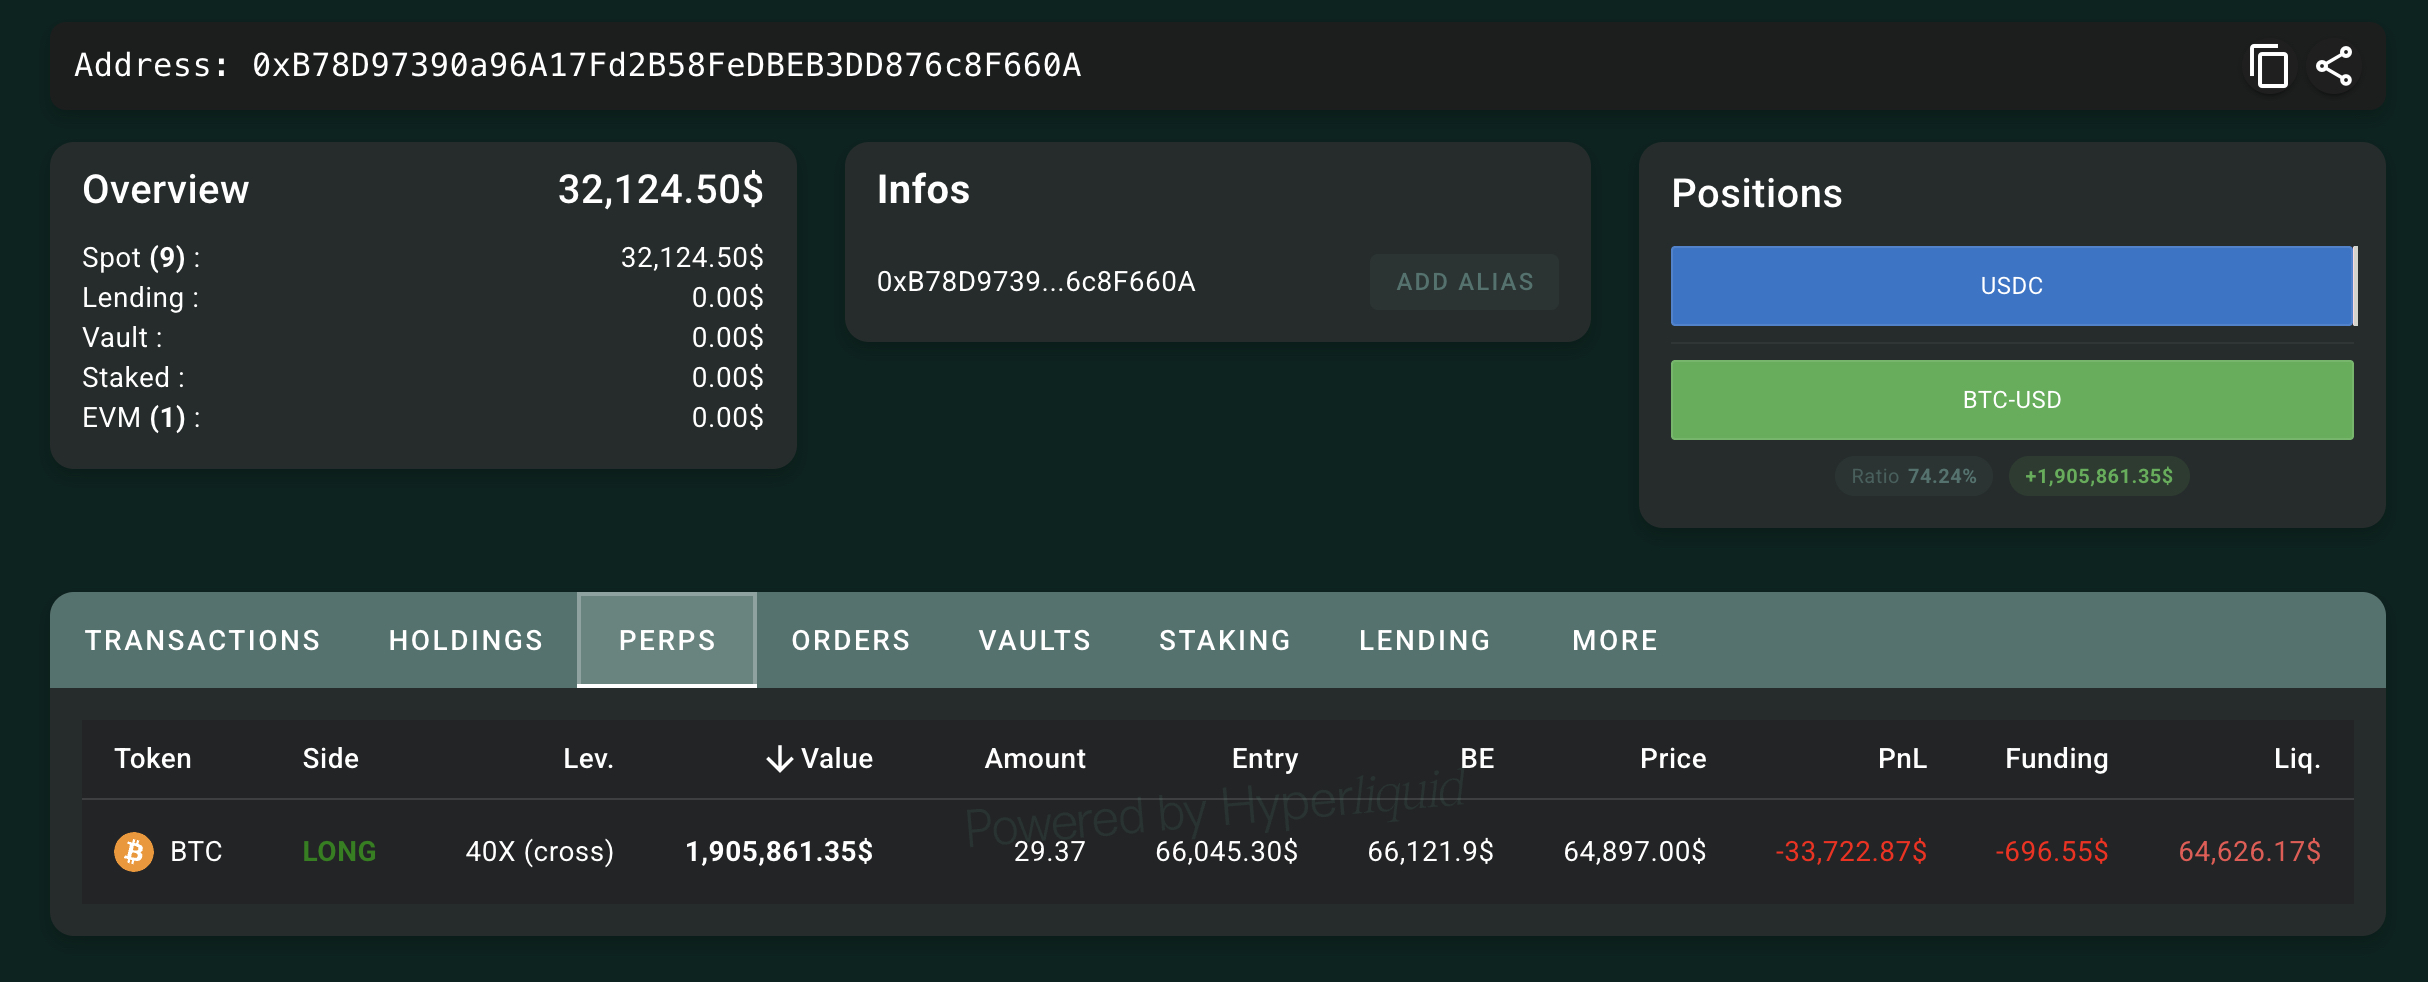
Bitcoin is holding a precarious perch at $65K, price prediction is turning slightly bearish, and the margin for error right now is razor-thin. Into that environment, Andrew Tate has opened a 40x leveraged long on BTC, his 108th attempt at a trade that has ended in liquidation every previous time.
Onchain analytics firm Lookonchain flagged the position: Tate is long 57.36 BTC ($3.76 million), with a liquidation price sitting at $65,216. Spot BTC was trading around $65,500 at the time of the report, a gap of roughly $300 between live price and the wipe-out level.
At 40x leverage, even a brief wick through that level ends the trade. The position is either a bold macro bet or a very public margin call waiting to happen.
Wait, actually, he has been liquidated while this is being written, and he has now reopened another long(changed the headline). Smaller amount now, still at 40X leverage. Anyway, data shows he has been liquidated 108 times now, with 90% being Bitcoin long positions.

Bitcoin has been struggling to push cleanly through the $67k–$69k band, and this stall is the context framing Tate’s outsized risk here.
Discover: The Best Token Presales
Bitcoin Price Prediction: Reclaim $69k Before Bears Take Control? Or Tate Cooked?
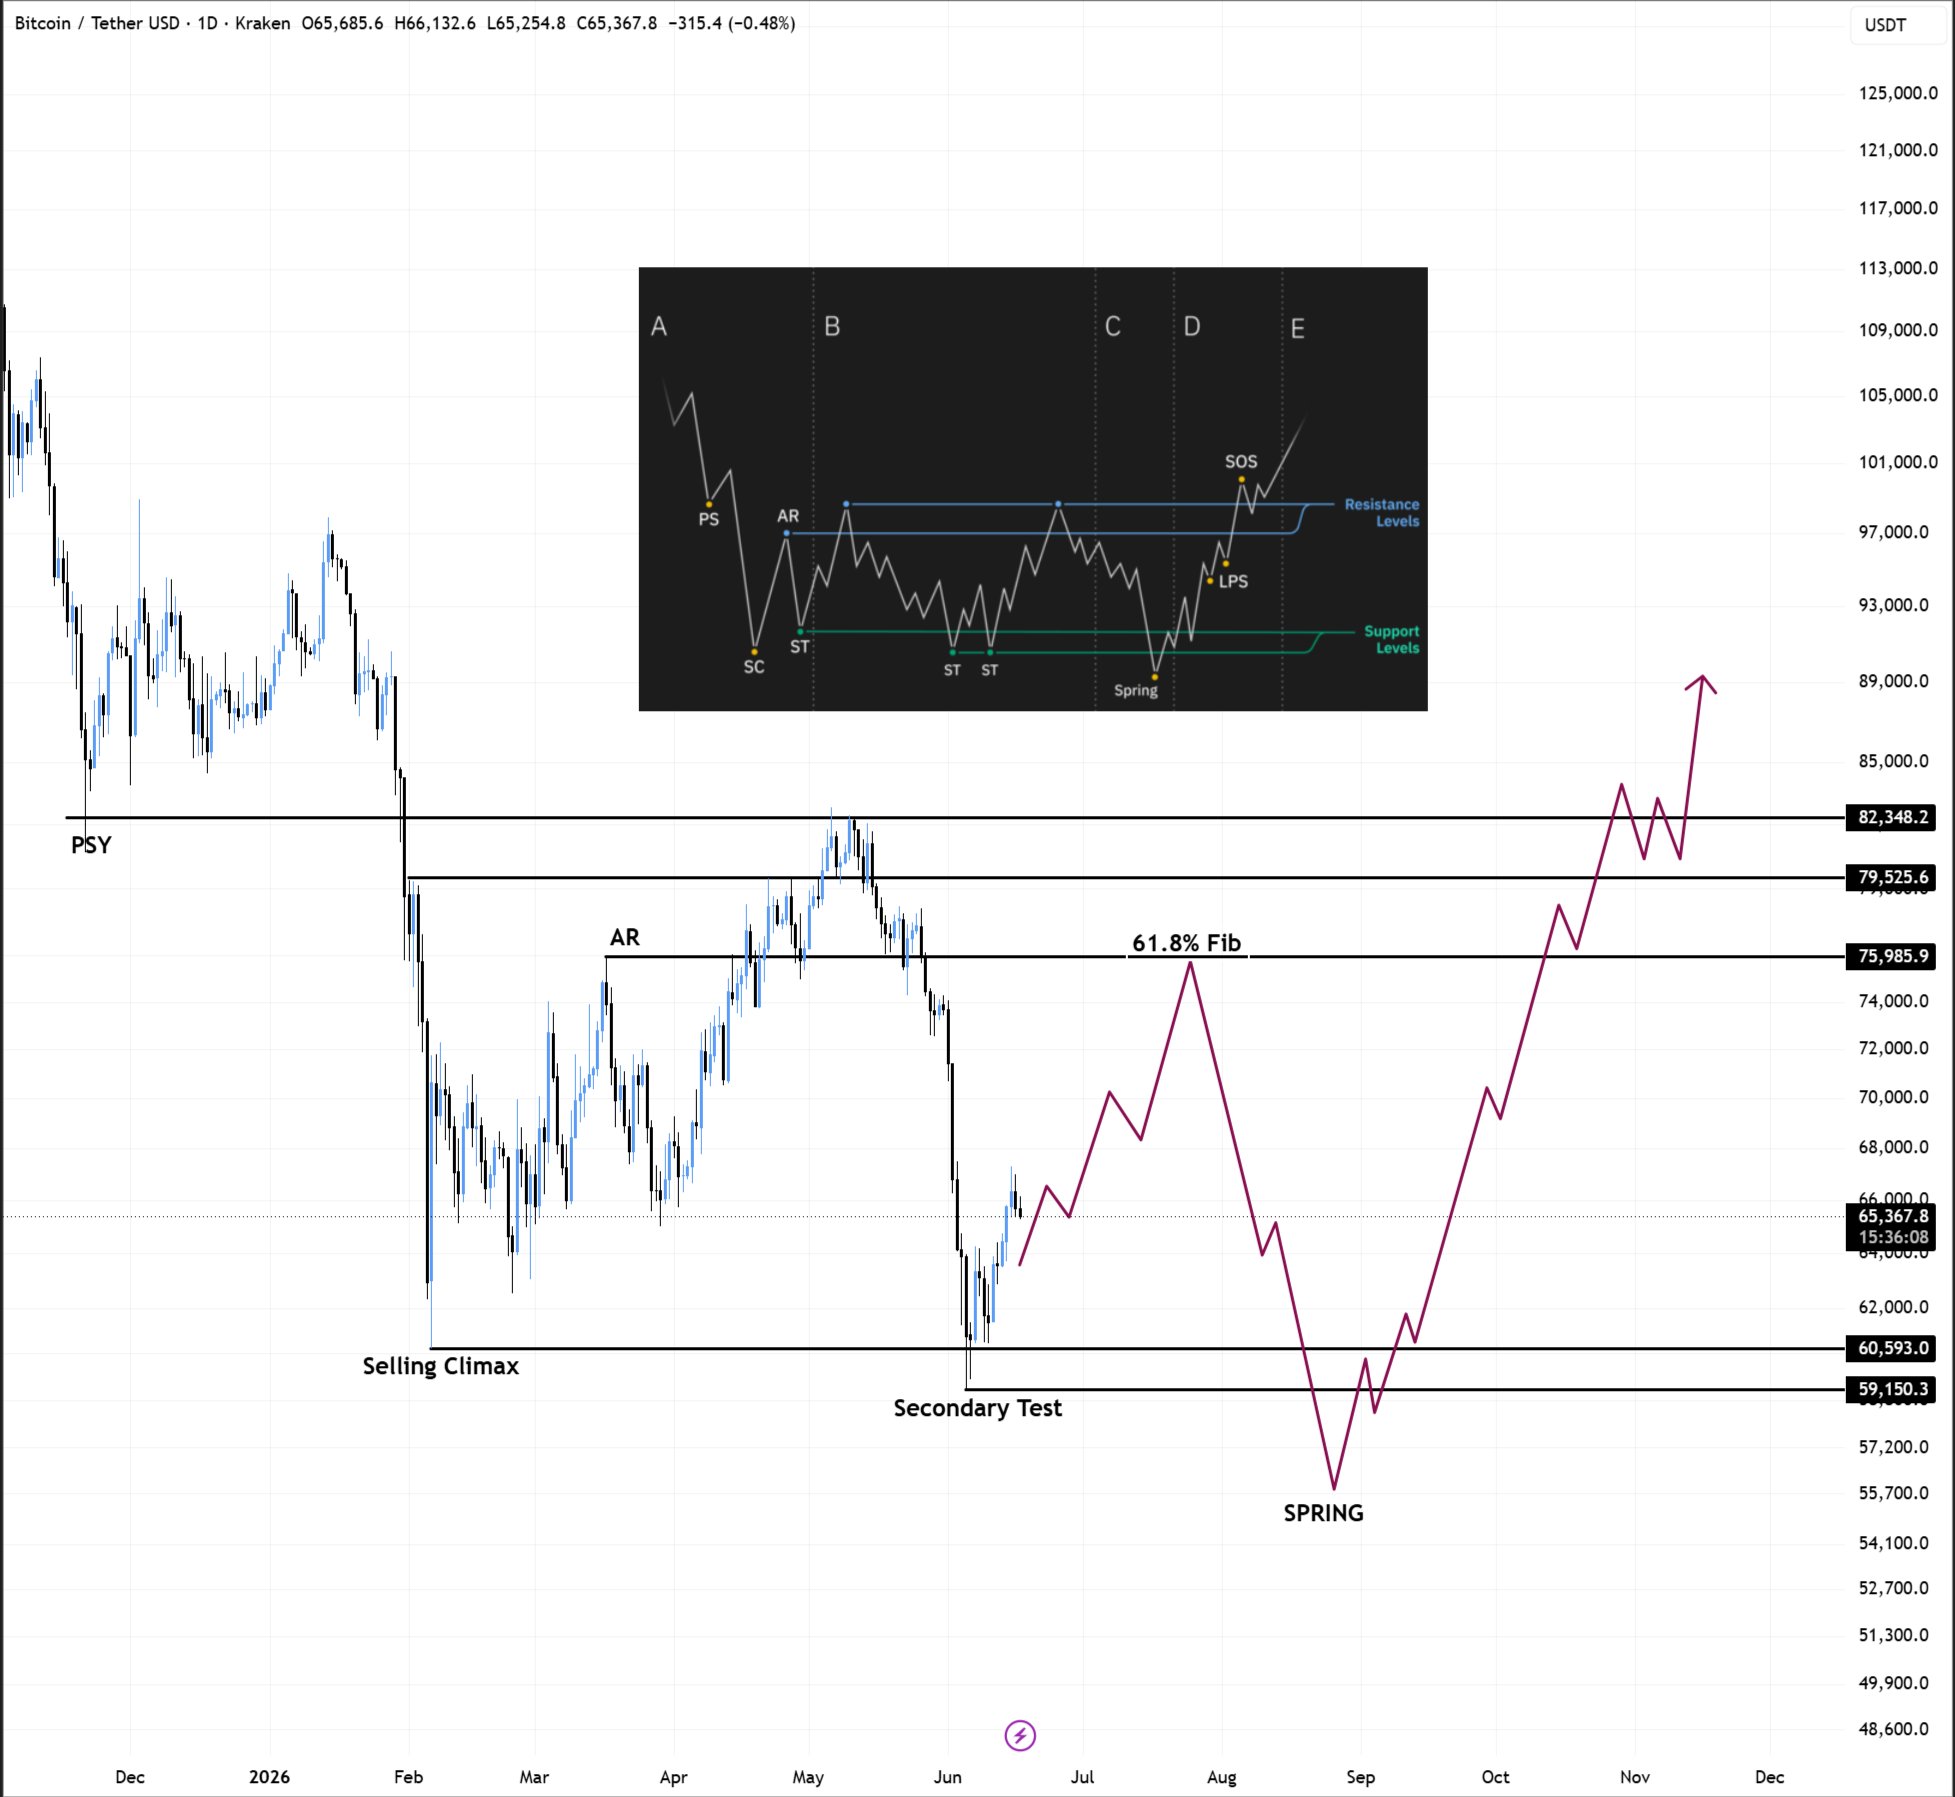
Bitcoin’s technical picture is consolidating. The nearest support sits at approximately $65,000 has been breached. Now, deeper demand zones are clustered between $63,000 and $62,500. On the resistance side, $67,000–$69,000 is the ceiling, followed by a heavier band from $71,500 to $73,000.
The 4-hour chart shows BTC still respecting an ascending trendline, with intraday momentum described as effectively neutral over the past eight hours. Although the price has been slightly sliding, we see small oscillations with no directional commitment.
Since the $65K suuport broke, BTC needs to hold $63,000 and reclaim $65,000, and eventually closes above $71,500, at which point a structural uptrend becomes defensible and short-term targets extend toward $73k.

The most likely scenario would see price continue chopping between $63,500 and $67,000, grinding out consolidation while macro catalysts like Fed data and regulatory headlines remain absent or ambiguous.
Or Tate would be really cooked if the daily close is below $63,000 as it opens a move toward the $62,00 zone. Bearish analysts are already flagging downside Fibonacci targets as low as $52k–$45k if the structure breaks, a scenario that would, incidentally, liquidate Tate before the market even gets interesting on the downside.
Institutional forecasters remain split, with some bullish targets contingent entirely on that $71.5k–$73k zone giving way. Until it does, high-leverage directional bets are trading against the range.
Discover: The Best Crypto to Diversify Your Portfolio
Bitcoin Hyper Targets Early Mover Upside as Bitcoin Tests Key Levels
Here’s the uncomfortable truth for spot BTC holders at current levels: even a clean breakout to $73k represents roughly 11% upside from here. That is not a bad trade, but it is not a life-changing one at this market cap.
The asymmetry that made Bitcoin at $3k or $10k so compelling simply does not exist at $65k. Which is exactly where early-stage Bitcoin infrastructure plays enter the picture.
Bitcoin Hyper ($HYPER) is positioning as the first Bitcoin Layer 2 with SVM (Solana Virtual Machine) integration, bringing Solana-speed smart contract execution directly into the Bitcoin ecosystem without sacrificing BTC’s security layer.
The architecture addresses Bitcoin’s three core limitations in one stack: slow throughput, high fees, and the absence of native programmability. The presale has pulled in $32 million at a current token price of $0.01368, with staking live for early participants. That is real capital allocation, not speculative noise.
For those watching BTC grind in a $4k range while Tate bets $3.76 million at 40x leverage, the calculus on where asymmetric upside actually lives right now is worth running.
Research Bitcoin Hyper here before the current presale stage closes.
The post Bitcoin Price Prediction: Andrew Tate Liquidated for 108 Times, Now He Doubles Down With 40x BTC Long appeared first on Cryptonews.
Citing people familiar with the matter, Reuters reported that the world’s largest cryptocurrency exchange could be forced to stop service to European Union customers as early as next month after its application for a key regulatory license is set to be rejected.
The threat comes from the EU’s Markets in Crypto-Assets (MiCA) framework, which requires digital asset firms operating within its borders to obtain authorization from a national regulator.
Binance to Drop Out of EU?
The report claimed that the exchange’s application through Greece’s Hellenic Capital Market Commission (HCMC) is expected to be denied, which would leave it without the authorization needed to continue serving clients from the bloc after the June 30 deadline.
If the situation escalates, this potential setback could become Binance’s largest regulatory hurdle in Europe since the implementation of MiCA a few years ago. The framework is designed to bring crypto firms under a unified regulatory regime, and even Hungary has turned the tide after the change in administration earlier this year.
As with essentially all reports from legacy media that might be harmful to Binance in any way, the company has taken a strong stance against those claims. A spokesperson pushed back against the coverage from Reuters, indicating that the exchange has worked with regulators for approximately 18 months and understands that the Green watchdog completed its review, with the application considered compliant.
Binance further said it has not received any formal indication from the HCMC that its application might be rejected.
“Binance remains fully committed to securing our MiCA license and operating under a unified European framework.
With 1,500+ compliance professionals globally, we continue to work closely with regulators while keeping users at the center of every decision,” reads a company statement on X.
Teng Concurs
Binance CEO Richard Teng also weighed in on the matter, saying the company is “dedicated to Europe.” He added that Binance and the team are “dedicated to securing our MiCA license and remain ready to operate under a fair, predictable, and genuinely harmonized European framework.”
In a follow-up post, he reassured the company’s user base of millions that their assets “remain secure.”
Please rest assured that your assets remain secure, are and will remain accessible at all times. Our intention is to support an orderly process and minimise disruption to our users. We will provide a further update prior to June 30 2026.
— Richard Teng (@_RichardTeng) June 16, 2026
The post Pushing Back at Reuters: Inside Binance’s Fight for Its European Future appeared first on CryptoPotato.


The day’s main event is Fed Chair Kevin Warsh’s first interest-rate decision. No change in rates is expected, which means markets will be scanning the policy statement, economic projections and the post-meeting press conference for cues.
Here is what could elicit a risk-on, positive reaction from bitcoin
The dot plot: This is a graphical representation of where individual Fed members see interest rates heading. Fed funds futures currently price in an 80% chance of a 25 basis-point increase by December. That’s the reference point for reading the plot: If it shows fewer than 80% of members projecting a hike by December, the BTC price could react positively.
Warsh’s take on rates and inflation: Will the Trump nominee break from market expectations and strike a dovish tone, citing recent oil prices and AI-driven disinflation to lay the groundwork for the rate cuts the administration wants? Or will he fall in line with current market pricing? In the former case, BTC could once again react positively.

Key Takeaways
-
Australia’s High Court delivers unanimous verdict requiring licence for Block Earner’s product
-
ASIC secures significant victory in cryptocurrency product regulation battle
-
Full Federal Court to reconsider penalty determinations following High Court ruling
-
Judges confirm crypto yield offering satisfied financial product criteria
-
Company pivots business model to Bitcoin-collateralized mortgage products
In a landmark decision, Australia’s highest judicial authority has sided with the financial regulator in a critical cryptocurrency licensing battle against Block Earner. The court determined that the company’s discontinued fixed-yield digital currency product required proper financial services authorization. The matter of penalties will now be reconsidered by the Full Federal Court.
Supreme judicial body reverses lower court decision
The seven justices delivered a unanimous verdict that overturned a previous Full Federal Court judgment favorable to Block Earner. The company, managed by Web3 Ventures Pty Ltd, previously provided the Earner yield service. ASIC maintained that the offering was subject to established financial product regulations.
The highest court determined that Earner functioned as an investment facility under Australian law. Additionally, judges concluded the product qualified as a derivative instrument. The judgment noted that yields fluctuated based on digital currency valuations and foreign exchange variations.
This determination bolstered ASIC’s argument that Block Earner required proper Australian financial services authorization. The watchdog emphasized that operating without appropriate licensing deprived customers of essential safeguards under financial services legislation. The penalty phase now proceeds to the Full Federal Court for fresh consideration.
Legal proceedings clarify Australian cryptocurrency framework
ASIC initiated civil penalty action against Block Earner during November 2022. The enforcement targeted the Earner service due to the company marketing it without necessary authorization. Block Earner discontinued the offering that same month.
The Federal Court determined in February 2024 that Block Earner operated an unlicensed managed investment structure. Nevertheless, the court subsequently granted the firm relief from monetary sanctions in June 2024. ASIC contested that relief decision, while Block Earner submitted its counter-appeal during July 2024.
The Full Federal Court granted Block Earner’s counter-appeal in April 2025. It simultaneously rejected ASIC’s penalty appeal at that juncture. The High Court has now overturned those findings and reinstated the regulator’s pursuit of penalties.
Company transitions to cryptocurrency-collateralized financing
Block Earner has subsequently pivoted away from fixed-return cryptocurrency offerings. The firm obtained an Australian Credit Licence during May 2026. It subsequently unveiled intentions to launch cryptocurrency-backed mortgage solutions.
The planned service would enable borrowers to pledge Bitcoin as security for residential financing. This structure would permit customers to obtain credit while maintaining their Bitcoin positions. The licensing approval represented a significant milestone for digital asset lending services in Australia.
Nevertheless, the High Court verdict strengthens ASIC’s regulatory authority over cryptocurrency products. The ruling establishes that existing legislation applies to digital asset offerings when they satisfy financial product criteria. Consequently, cryptocurrency businesses confront increased licensing obligations under Australia’s current regulatory structure.


BitGo is expanding its custody and compliance infrastructure into Europe with a new “crypto-as-a-service” offering designed to align with the European Union’s Markets in Crypto-Assets Regulation (MiCA). The move arrives as exchanges and other regulated crypto firms prepare for a key transition point: the EU-wide requirement for authorization to continue serving customers across member states.
BitGo Europe launched the platform with the explicit aim of supporting MiCA readiness for partners that need to meet regulatory obligations for custody, trading connectivity, onboarding and wallet-related functions. According to Cointelegraph, the company is positioning its regulated setup as a way for service providers to reduce the time required to operationalize compliance measures during the licensing transition.
Key takeaways
- BitGo Europe has launched a MiCA-oriented crypto-as-a-service platform aimed at exchanges and fintech firms.
- The platform is designed to connect partners to regulated custody, trading, onboarding and wallet systems via APIs, while keeping customer-facing control with the partner.
- Compliance tooling referenced by BitGo includes programmatic KYC checks, transaction controls and settlement of supported digital assets.
- BitGo’s expansion builds on prior regulatory authorization: BaFin granted BitGo a MiCA-related license in May 2025.
- Regulatory uncertainty remains across the EU as firms seek MiCA authorizations ahead of the July 1 deadline.
BitGo Europe launches MiCA-focused crypto-as-a-service
BitGo Europe’s new platform is intended to help other crypto businesses meet MiCA requirements through a modular integration model. In its announcement shared with Cointelegraph, the company said partners can use BitGo’s infrastructure for core regulated functions instead of building all compliance and custody capabilities internally.
From an operational standpoint, the approach matters because MiCA compliance is not limited to one-off licensing paperwork. It requires firms to have ongoing systems in place that can support customer onboarding, risk controls, and transaction processing consistent with the regulation’s standards. BitGo’s service model—using application programming interfaces (APIs) to connect services—targets the practical challenge of standing up compliant workflows quickly across multiple EU jurisdictions.
BitGo stated that the service is especially relevant for companies seeking to maintain service continuity while regulatory decisions and authorization timelines evolve. In comments shared publicly by CEO Mike Belshe, he argued that regulated infrastructure can help firms keep operations moving safely and compliantly during licensing delays.
What the platform covers: custody, onboarding, controls and SEPA payments
BitGo’s MiCA-focused offering is built around connectivity to regulated custody and related functions. The company said exchanges and fintech platforms can integrate with BitGo systems for custody, trading integration, onboarding processes and wallet operations.
The service includes features intended to support compliance and operational risk management, such as programmatic KYC checks, transaction controls and settlement of supported digital assets. These capabilities are central to meeting MiCA’s expectations for regulated crypto-asset activity, where firms must demonstrate they can manage customer onboarding and transaction handling in a controlled and auditable manner.
BitGo also referenced support for euro payments through SEPA rails in eligible regions. For institutions and payment operators, the inclusion of fiat connectivity can be a significant part of operational compliance: regulated on- and off-ramp design typically intersects with AML/KYC procedures, transaction monitoring and other controls expected by regulators.
Regulatory pressure ahead of the July 1 MiCA deadline
The launch comes as EU crypto regulation transitions from fragmented national approaches toward a unified framework under MiCA. Under MiCA’s timetable, July 1 is a critical date for authorization requirements governing entities that continue offering crypto-asset services in the EU.
Recent reporting highlighted the possibility that some major exchanges may face difficulties securing authorizations in time. While BitGo did not provide details on whether its infrastructure would allow specific platforms to continue serving EU users if an authorization application is rejected, the broader compliance timing risk is evident: market participants need clarity on regulatory status, and delays can create operational and legal exposure.
Cointelegraph reported that Greek regulators may reject Binance’s MiCA license application, underscoring uncertainty surrounding the licensing pipeline for large venues. For institutions monitoring market structure, these outcomes are material not just from a business perspective, but because they affect where and how regulated service providers can legally operate across borders.
Beyond authorization decisions, MiCA-related implementation also interacts with national transition rules. BitGo pointed to markets where legacy registration regimes are being phased out as the EU-wide framework takes effect. In Lithuania, the transition period for legacy virtual asset service providers ended on Dec. 31, 2025. In Poland, implementation remains unsettled, leaving some companies navigating unclear timelines for how national approvals will map into the new EU system.
Institutional and compliance implications for crypto firms
BitGo’s move reflects a broader trend in European crypto markets: regulated infrastructure providers are increasingly central to how exchanges and fintechs build compliance capabilities. For compliance teams, outsourcing or integrating certain regulated functions can affect the internal control framework, including who is responsible for customer due diligence workflows, how transaction monitoring is performed, what audit trails exist, and how regulatory obligations are allocated across the service chain.
MiCA also creates supervisory expectations around governance, operational resilience and risk controls. While BitGo’s model is designed to enable partners to meet the MiCA standard, regulated counterparties will still need to perform their own due diligence on vendor controls and ensure that contractual and operational arrangements support ongoing compliance. This includes verifying how KYC checks are executed, how transaction controls are enforced, and how fiat-related processes interface with AML/KYC requirements.
From a historical and regulatory context, BitGo’s European expansion is not starting from zero. The company previously obtained authorization under the MiCA framework, with BaFin issuing a license in May 2025. That detail is important for institutional readers because it indicates the company is operating under an EU supervisory authorization rather than operating purely as an offshore service. In turn, this can reduce—but not eliminate—regulatory uncertainty for partners seeking integrations that align with EU oversight.
However, unresolved questions remain across the sector. Licensing decisions for major firms can change quickly, and the legal landscape will continue to evolve through regulator guidance, enforcement actions and court-related developments where applicable. Partners evaluating integrations will need to track not only the vendor’s authorization status but also the regulatory expectations for their own licensed activities.
What to watch next
BitGo Europe’s launch will likely be tested by how exchanges and fintech providers operationalize MiCA compliance under real-world timelines and regulatory outcomes across member states. Market participants and compliance teams should monitor MiCA authorization decisions, evolving national implementation details, and how regulators interpret responsibility for customer onboarding and transaction controls within multi-party infrastructure models.

BitGo says it has launched “crypto-as-a-service” in Europe, positioning the firm’s regulated custody and compliance infrastructure as a practical bridge for exchanges and fintech companies rushing to meet the EU’s Markets in Crypto-Assets Regulation (MiCA). The move comes as the July 1 MiCA authorization deadline approaches and uncertainty grows around how certain large platforms will handle licensing in individual member states.
According to a statement shared with Cointelegraph, BitGo Europe’s platform is designed to help service providers connect core functions—custody, trading support, onboarding and wallet capabilities—through APIs, rather than building an entire compliance stack from scratch. The company framed the launch as a way to keep businesses operating “safely and compliantly” during regulatory transitions, with BitGo CEO Mike Belshe arguing that regulated infrastructure can reduce downtime when licenses are delayed.
Key takeaways
- BitGo Europe launched a MiCA-oriented crypto-as-a-service platform aimed at exchanges and fintech firms that need regulated infrastructure.
- The service is presented as an API-based way to integrate regulated custody, programmatic KYC checks, transaction controls, and settlement.
- BitGo’s EU approach is tied to MiCA readiness ahead of the EU-wide July 1 authorization deadline.
- The firm says the need is acute in markets such as Poland and Lithuania, where legacy registration pathways are being phased out.
- BitGo did not clarify whether its infrastructure would allow specific exchanges to continue operating in the EU if a license application is rejected.
MiCA deadline pressure reshapes the EU custody race
MiCA sets a common authorization standard across the European Union for crypto-asset firms that wish to continue serving customers. The July 1 deadline is particularly significant for platforms that have not yet secured the required authorization to operate under the new regime.
Recent reporting highlighted the potential for uneven outcomes as regulators decide on major firms’ applications. Earlier coverage from Cointelegraph noted that Greek regulators may reject Binance’s MiCA license application, raising questions about how the largest exchange by trading volume might adjust its EU footprint if authorization does not go through.
In that environment, BitGo’s pitch is aimed at reducing friction for businesses that must comply with MiCA while continuing to offer products during the transition. While BitGo did not explicitly state how its platform would work in the event of a rejected license for a specific exchange, the emphasis on “keeping you moving” suggests an intent to support continuity where regulatory readiness is still in progress.
What BitGo Europe’s “crypto-as-a-service” includes
BitGo Europe said the product is built for integration-heavy use cases. Rather than asking partners to replace their customer-facing systems, the platform is designed to let exchanges and fintech companies plug into BitGo’s services via APIs.
BitGo’s Europe push reportedly builds on earlier groundwork: the firm obtained authorization under the relevant framework more than a year ago, and Germany’s Federal Financial Supervisory Authority (BaFin) issued the license in May 2025. With that license as a foundation, BitGo is now marketing an operational suite intended to reduce the time and cost involved in reaching MiCA-aligned operations.
Among the components BitGo describes are:
- Programmatic KYC checks that can be executed through the platform.
- Transaction controls intended to enforce rules around activity.
- Settlement support for supported digital assets.
- Euro payments via SEPA rails in eligible regions, aimed at connecting fiat on- and off-ramps to a regulated operating setup.
For exchanges and intermediaries, the practical value of this approach is that regulatory capabilities—particularly custody and compliance workflow—can be sourced from a licensed infrastructure provider. The model also potentially shifts the compliance burden away from each partner building bespoke controls, while still allowing the partner to keep direct ownership of its customer-facing products.
Regional transition gaps in Poland and Lithuania
BitGo’s statement also emphasized that MiCA transition pressures vary by country. The firm highlighted markets including Poland and Lithuania, where older national registration regimes are being phased out as the EU-wide system takes effect.
In Lithuania, BitGo points to the end of a transition period for legacy virtual asset service providers on Dec. 31, 2025. In Poland, it says implementation remains unresolved, leaving some firms in a state of uncertainty regarding which approvals they can rely on as the MiCA framework rolls forward.
This matters for operators because the compliance timeline is not uniform across jurisdictions. Even when MiCA is the overarching EU structure, companies often face a multi-layer regulatory reality—national requirements, transition rules, and regulator-by-regulator outcomes—that can affect product availability, onboarding, and the ability to process fiat rails.
BitGo CEO Mike Belshe argued that Europe is moving toward a more unified and durable regulatory framework for digital assets. In his view, MiCA readiness is not only about obtaining authorization but also about having systems that can continue functioning during licensing delays. He said the company was built for such moments and positioned BitGo Europe as a route for businesses to meet the MiCA standard while continuing to serve the market.
Open questions: continuity, licensing outcomes, and partner readiness
While BitGo’s launch is clearly aimed at helping partners operationalize MiCA compliance, important uncertainties remain. The company did not confirm whether its infrastructure would specifically allow an exchange to continue operating if a MiCA license application is ultimately rejected. Cointelegraph attempted to request clarification but did not receive a response by publication time.
For the market, the bigger takeaway is that regulated custody and compliance tooling are becoming a competitive differentiator as the EU transition tightens. Investors and industry participants will likely watch how quickly exchanges and fintech providers are able to integrate licensed infrastructure, and whether regulator decisions—such as those affecting major firms’ applications—drive further consolidation in compliance services.
With MiCA authorization decisions approaching, the next phase will hinge on how effectively exchanges and service providers can translate “license readiness” into real operational continuity—especially in countries where legacy pathways have already ended or remain unresolved.


Pre-IPO perpetual futures volume on crypto exchanges reached roughly $12 billion in June, a 6,000-fold jump from March.
The notable growth came as traders chased exposure to technology giants.
Pre-IPO Perpetuals Now Drive 55% of Crypto Equity Trades
Pre-IPO perpetual futures let traders speculate on private companies before their shares reach public markets. The contracts track expected valuations without the ownership of shares.
Volume in these products climbed from $2 million in March to $715 million in May, according to CryptoQuant data. June then pushed the figure to about $12 billion.
Pre-IPO products form part of a wider push to trade traditional assets on crypto rails. Exchanges have added oil, metals, and equity perpetuals.
Consequently, pre-IPO contracts accounted for 55% of all perpetual equity trading on crypto exchanges in June. That share stood at just 5% in May.
“This growth coincides with increased market interest in Pre-IPO perpetuals including SpaceX, OpenAI and Quantinuum, as well as the launch of additional equities offerings on crypto platforms,” the report read.
Follow us on X to get the latest news as it happens
Binance Captures 83% of Pre-IPO Perpetuals Market in June Boom
Meanwhile, CryptoQuant data shows Binance leading the segment by a wide margin. The exchange recorded $10.3 billion in pre-IPO perpetual volume in June. That figure marks a 20-fold increase over its May total.
Binance now holds an 83% share of all pre-IPO perpetual trading. Bitget trails in second place with $1.3 billion in June volume.
Notably, several private companies have gone public in June. Quantinuum listed on Nasdaq under the ticker QNT on June 4. SpaceX followed on June 12, trading under the ticker SPCX. OpenAI has not set an IPO date. However, the company filed a confidential S-1 with the SEC.
Subscribe to our YouTube channel to watch leaders and journalists provide expert insights
The post Pre-IPO Perpetual Trading Grows 6,000x Since March on Tech Bets appeared first on BeInCrypto.
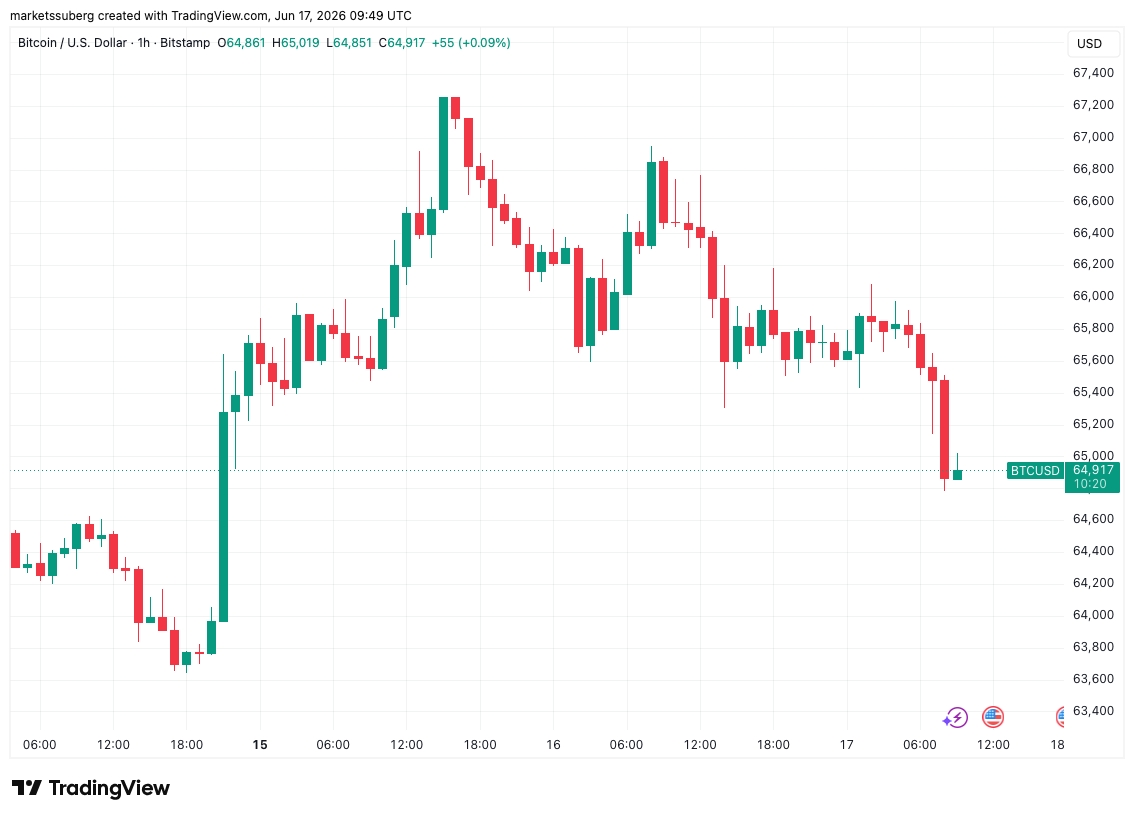
Bitcoin (BTC) fell below $65,000 on Wednesday as traders predicted the impact of a key macro event.
Key points:
- Bitcoin approaches the next Fed interest-rate decision near important support.
- BTC price analysis warns that “bearish” moves typically accompany FOMC days.
- $55,000 remains on the table as a target next.
BTC price analysis: FOMC could “set the tone” for June
Data from TradingView showed intraday lows of $64,782 on Bitstamp.

BTC/USD one-hour chart. Source: Cointelegraph/TradingView
The US Federal Reserve was due to decide on changes to interest rates at 2pm Eastern time — a move that formed the week’s main volatility catalyst.
The meeting of the Federal Open Market Committee (FOMC) would be the first under new Fed chair, Kevin Warsh, making his remarks at the subsequent press conference just as important as the overall outcome.
As Cointelegraph reported, Warsh had been under pressure to cut rates despite the inflationary impact of the US-Iran war.
“FOMC could set the tone for the rest of the month,” trader Killa wrote in an X post on the topic.
Killa noted that BTC price action tended to weaken around Fed decisions.
“Right now, BTC is forming a bullish narrative into the event, but as I always say, the outcome is usually priced in before the news is released,” they continued.
“If recent history is any indication, we have generated far more bearish reactions than bullish ones.”
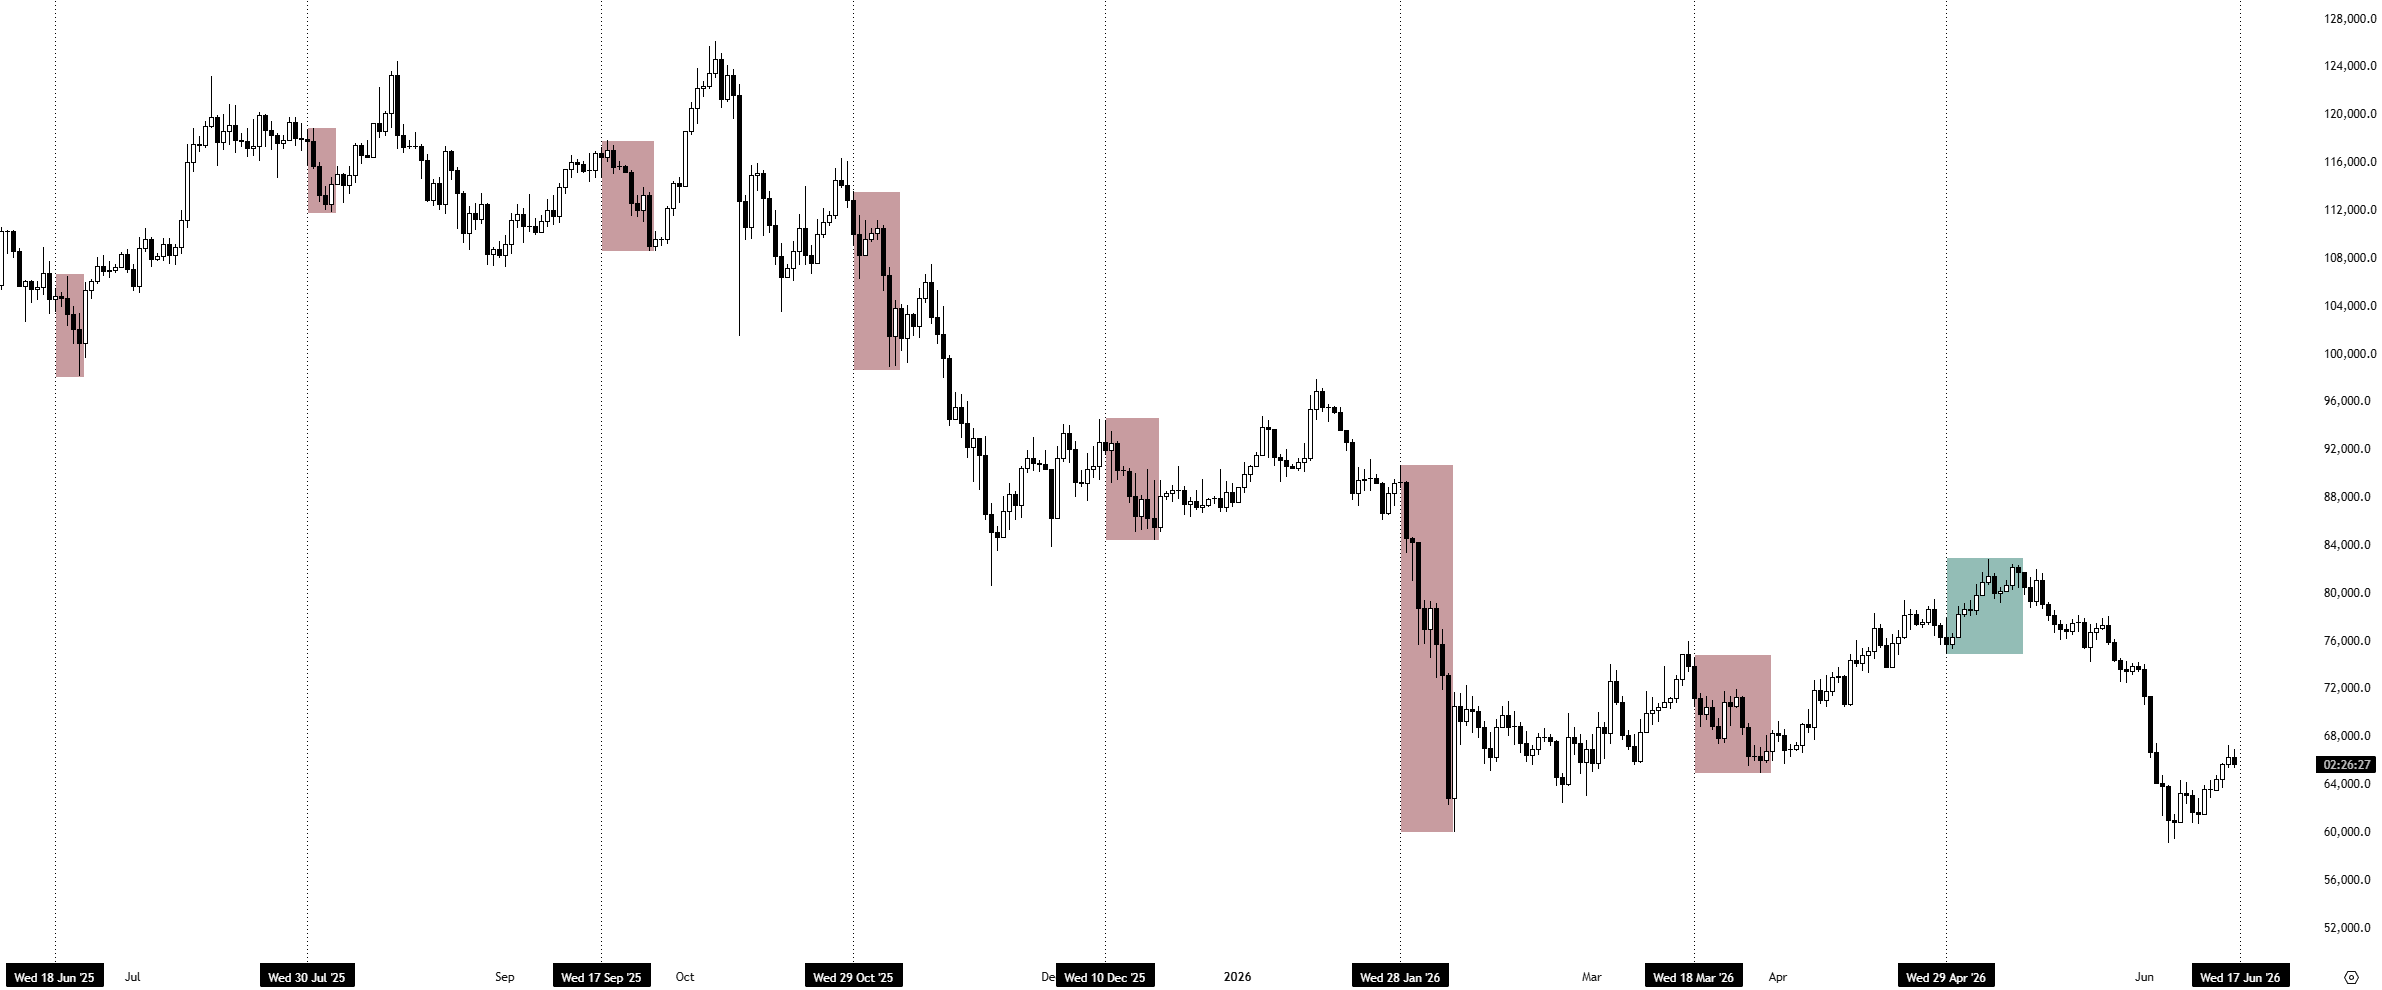
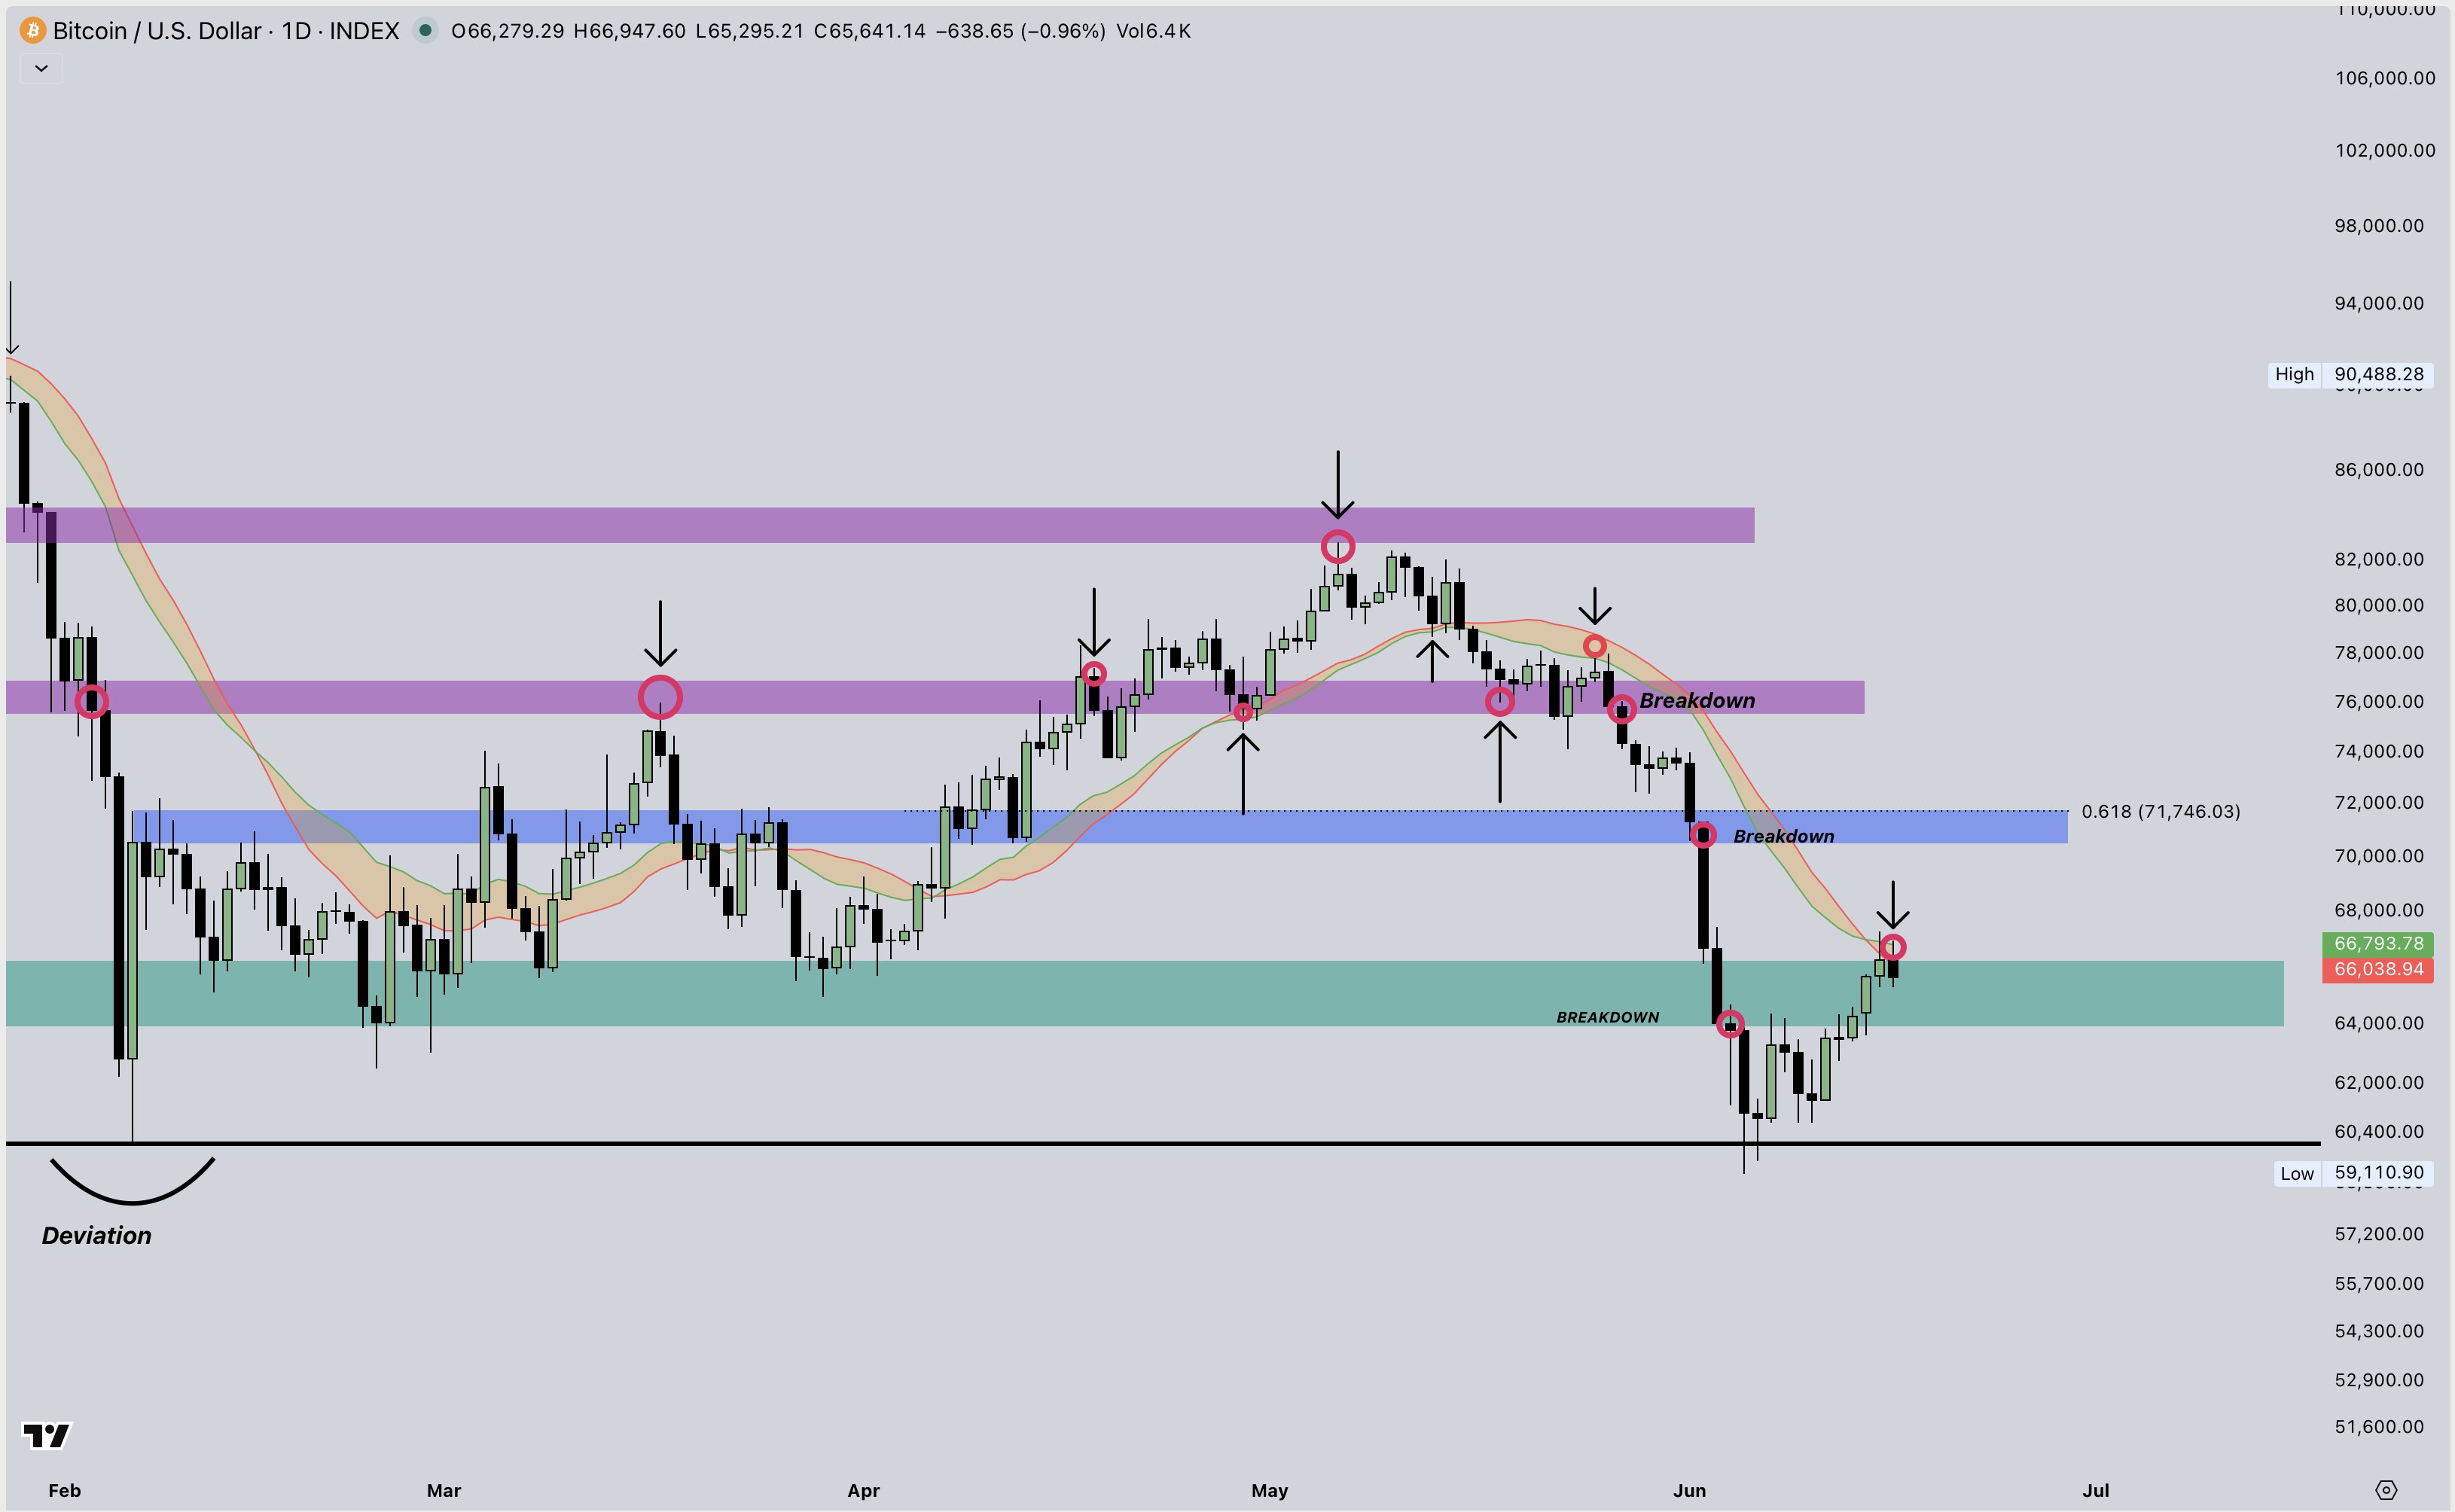
BTC/USD chart with FOMC meetings marked. Source: Killa/X
On Tuesday, Bitcoin already experienced a loss of momentum, even as stocks headed higher on Iran relief. Analysis had already warned that price would likely stall above $67,000 as demand remained subdued.
“We need to maintain bullish market structure from here… (64K). If not, there’s a strong chance we revisit the $60K lows after this pivot,” Killa warned.
Bitcoin trader preserves $55,000 target
Other perspectives included a “short-term bounce” for Bitcoin before the resumption of the bear market.
Related: Bitcoin miner ‘capitulation’ comes as trader sees later 2026 bear-market bottom
“FOMC meeting is happening today, exactly when the US-Iran peace deal is very close,” Niels, cofounder of marketing agency STABL, told X followers.
“IMO, Bitcoin could show some strength but eventually it’s going to $55,000.”
BTC/USDT one-day chart. Source: Niels/X
A more optimistic take came from analytics account Cryptic Trades, which saw the rebound continuing after the FOMC.
BTC/USD, it said, had rejected at two key moving averages that together form Bitcoin’s daily bull market support band.
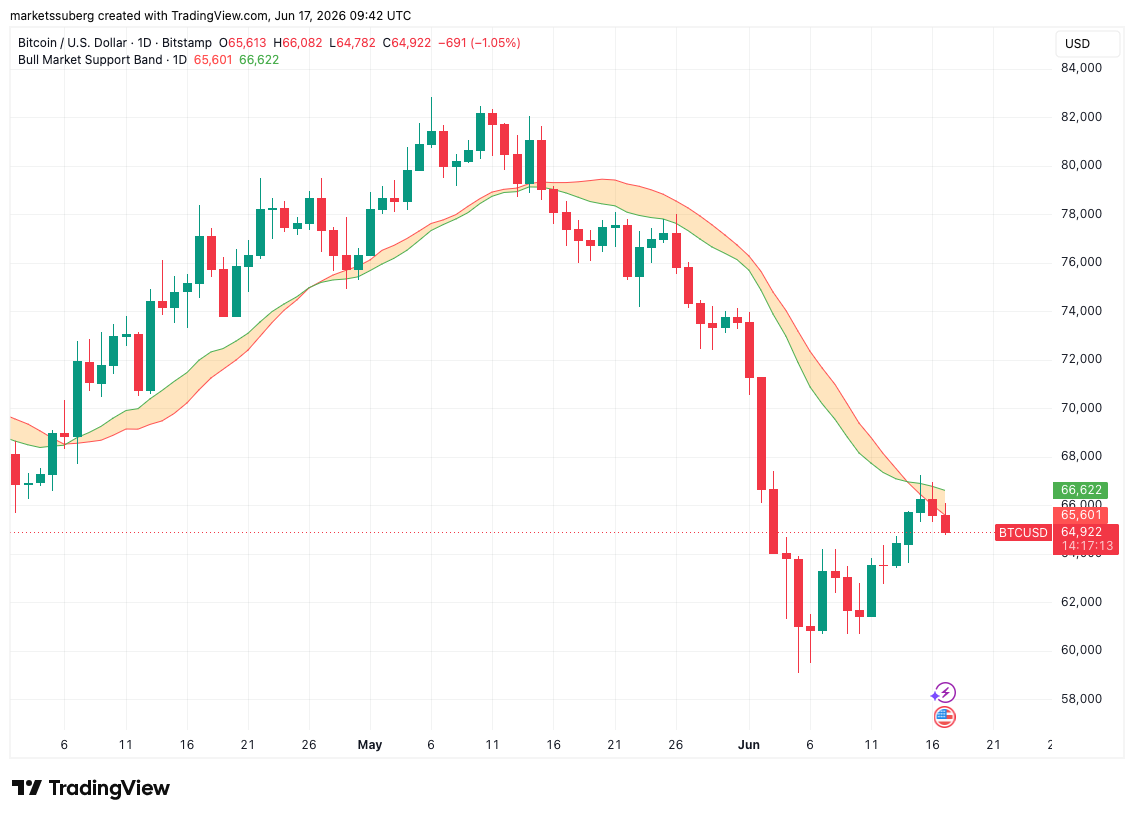
BTC/USD one-day chart with bull market support band. Source: Cointelegraph/TradingView
“However, after this pullback, the next big leg up is coming,” Cryptic Trades predicted.
BTC/USD one-day chart. Source: Cryptic Trades/X


Cathie Wood bought $529.7 million of SpaceX stock on its first day of trading and sold Tesla shares at the same time. Both companies belong to Elon Musk, but Wood’s conviction has clearly shifted.
The trades came on June 12, SpaceX’s IPO day, when shares surged 19% and Musk’s net worth crossed $1 trillion for the first time. ARK bought 3.29 million SpaceX shares at the IPO price of $135, a position worth $529.7 million at closing. ARK then trimmed Tesla alongside Advanced Micro Devices, Rocket Lab, Roku, and Baidu on the same day.
Why Wood Is Moving On From Tesla
Tesla has been one of ARK’s core holdings for years, and Wood has publicly defended it through multiple down cycles. But the EV maker faces a different landscape today: Chinese rivals have narrowed the gap, margins are under pressure, and Musk’s political visibility has become a liability for some buyers.
SpaceX is a different proposition. Its Starlink satellite internet division is the company’s only profitable business, and it is growing fast. Wood first bought SpaceX in late 2023, and the stake became the largest holding in ARK’s roughly $1 billion internal venture fund. The IPO gave ARK the chance to scale that conviction in public markets.
The SpaceX Trade and Its Risks
The $529.7 million buy is a large commitment, even by ARK’s standards. SpaceX priced its IPO at $135 and closed 19% higher on day one.
SpaceX carries an accumulated deficit of $41.3 billion as of March 31. And the IPO’s retail allocation sits at 30% of the offering, three to six times the typical level.
ARK’s Performance Context
The ARK Innovation ETF is up 1.61% year to date, while the S&P 500 has gained around 9%. Over the past 12 months, the fund recorded roughly $294 million in net outflows. A Morningstar analysis found the fund wiped out $7 billion in investor wealth from 2014 to 2024.
Wood’s IPO bets follow a pattern. ARK bought Coinbase after its 2021 listing and CoreWeave more recently, each time seeking early exposure to high-conviction names. SpaceX is the biggest version of that bet yet.
Whether SpaceX turns that deficit into durable profit, or this becomes ARK’s next painful lesson, is a question the market will spend years answering.
The post Cathie Wood Swaps Tesla for SpaceX in $529M Elon Musk Pivot appeared first on BeInCrypto.
The Fixed Range Volume Profile (FRVP) is a technical analysis tool that allows traders to spot where trading volume has concentrated within a chosen price range. It shows the trading volume traded at each price level. Traders read these levels to gauge market participation and to locate potential support and resistance levels. Higher-volume prices tend to mark stronger areas of interest.
The Fixed Range Volume Profile (FRVP) is a popular tool among traders as it provides a wide range of signals. However, its complex appearance can put some traders off. In this article, we’ll take a deep dive into the FRVP, how to use it in a trading strategy, and some common mistakes to avoid.
What Is Fixed Range Volume Profile (FRVP)?

The Fixed Range Volume Profile (FRVP) is an advanced tool that plays an important role in assessing market activity. It provides a comprehensive view of the market by shedding light on trading volume and price data over a specific period. Unlike traditional price-based indicators, the FRVP incorporates volume data, offering a deeper insight into market liquidity and supply and demand dynamics.
Most chart indicators measure market activity against time. The FRVP measures it against price instead. It groups the volume traded at each price level inside a fixed range. This shows where buyers and sellers were most active. Compared with other volume indicators that plot volume bar by bar, the FRVP reveals which prices mattered, not which moments. This makes imbalances between supply and demand more straightforward. A price with heavy volume saw strong participation. A price with light volume saw little.
The FRVP presents a distribution of trading activity, represented by horizontal bars at various price levels, typically from one key swing point to another (e.g. a swing high to a swing low). It shows areas of high and low activity and may help traders spot areas where the market has spent considerable time and where it traded through easily.
Traders anchor the FRVP between two swing points because that range captures one complete move. The profile then reflects only the volume traded during that leg. This keeps the analysis focused, rather than spread across the whole chart. Many traders bracket a trend leg, a range, or a sharp news-driven move. The result is a clearer read of where value built up inside that move.
How Fixed Range Volume Profile Works
So how does the Fixed Range Volume Profile work? The FVRP indicator measures volume at price across a range you define. You pick a start point and an end point on the chart. The indicator then adds up the volume traded at each price level and stacks the totals sideways. The longer the horizontal bar, the more volume changed hands at that price.
In trading, volume measures the total units traded over a given period. It signals how much interest sits behind a price move. High volume points to strong participation and an active market. Low volume points to weaker interest and a more passive one. The Fixed Range Volume Profile indicator takes that idea and ties it to price, not the clock.
This is where volume profile trading differs from standard volume bars. A tall bar shows a price where the market was active. This reflects acceptance, a core idea in auction market theory and price discovery. A short bar shows a price the market passed through fast. Acceptance builds value. Rejection moves price on. Reading the two together shows where business was actually done.
The calculation runs in four steps:
- Select the range. You mark a start and end point, usually a swing high to a swing low.
- Split the range into rows. The tool divides the price range into thin horizontal bands.
- Allocate the volume. It assigns the volume from each bar to the price rows it covers.
- Plot the profile. It draws the totals as a sideways histogram showing volume by price.
The result locks to the move you chose. Scrolling or zooming the chart does not change it.
Components of FRVP
The Fixed Range Volume Profile can be broken down into several key components. Each one marks a different type of price behaviour inside your selected range. Read together, they show where the market built value and where it moved on. These definitions follow standard volume profile methodology used across charting platforms.
Point of Control (POC)
The Point of Control (POC) is the price level with the highest traded volume within the selected range. The POC can be considered as the price level where the market found the most acceptance and is usually plotted as a red line. It is often the most watched level in the whole profile. Traders treat the POC as a balance point. Price tends to return to it over time. That makes the POC a level where support or resistance can form.
Value Area
The Value Area represents the price range where a specified percentage of total volume has occurred, typically 70%. It demonstrates the levels at which most trading activity has transpired. The upper boundary is the Value Area High (VAH). The lower boundary is the Value Area Low (VAL). Traders treat the VAH and VAL as the boundaries of fair value. Price inside the Value Area points to balance. A move beyond either edge can signal the market is seeking new value. Both edges often draw reactions when price tests them.
High Volume Nodes (HVN)
A High Volume Node (HVN) represents a peak in volume at a price level. It marks a price the market accepted and traded heavily. HVNs often act as strong support and resistance, as price tends to slow around them. Several HVNs can sit close together to form a wider zone of interest.
Low Volume Nodes (LVN)
A Low Volume Node (LVN) represents a trough in volume at a price level. It marks a price the market rejected and moved through quickly. Price tends to travel fast across LVNs toward the next HVN. These thin zones often highlight potential breakpoints in a move.
Both nodes play key roles in volume profile analysis. With the POC, they give traders reference points for reading market structure.
FRVP Applications in Market Analysis
Now that we’ve answered, ‘What is the Fixed Range Volume Profile?’, let’s take a look at three ways to incorporate the indicator into a strategy. The tool is rarely used on its own. A sound Fixed Range Volume Profile strategy combines it with price action and risk management. The profile shows where volume sits. Price action confirms how the market reacts there.
If you’d like to see how it works for yourself, you can consider heading over to FXOpen’s TickTrader platform and test the Fixed Range Volume Profile.
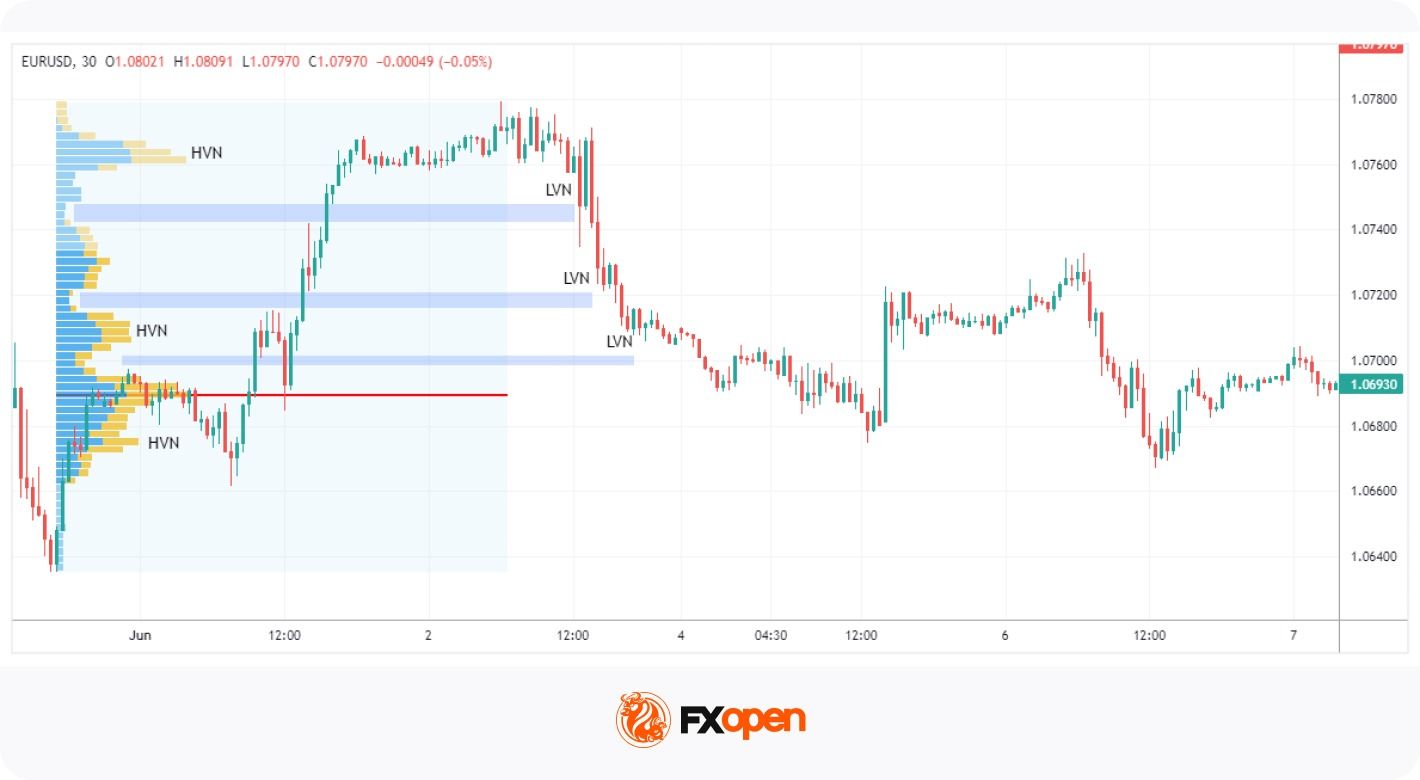
Identifying Trend Continuation with FRVP

One of the most common applications of the Fixed Range Volume Profile is its use in gauging market trends. The interaction of price with high and low-volume areas can give valuable insights into market sentiment.
When analysing market trends using the FRVP, traders first pay close attention to areas of low volume, or LVNs. These areas, characterised by limited trading activity, often suggest an imbalance between supply and demand where the market moved rapidly. As such, they create a price gap or vacuum in the profile.
In the markets, these low-volume gaps are likely to be filled over time. An asset’s price usually tends to move quickly through these areas in search of the next area of value, represented by HVNs. As such, LVNs can act as powerful directional indicators, pointing to the potential for swift price movements, either upward or downward, to reach the next HVN, where market acceptance is greater.
This is the core of HVN and LVN trading: price tends to travel from one value area to the next. It moves fast through thin LVN zones and slows at dense HVN ones. In a bullish case, price clears an LVN and runs up toward a higher HVN. In a bearish case, it drops through an LVN toward a lower HVN. Traders watching for trend continuation often note a few things:
- Where the nearest LVN sits relative to current price
- Which HVN is the likely target once the LVN is crossed
- Whether the wider trend agrees with that direction
- How price behaves on the first test of the HVN
HVNs and LVNs as Support and Resistance Zones
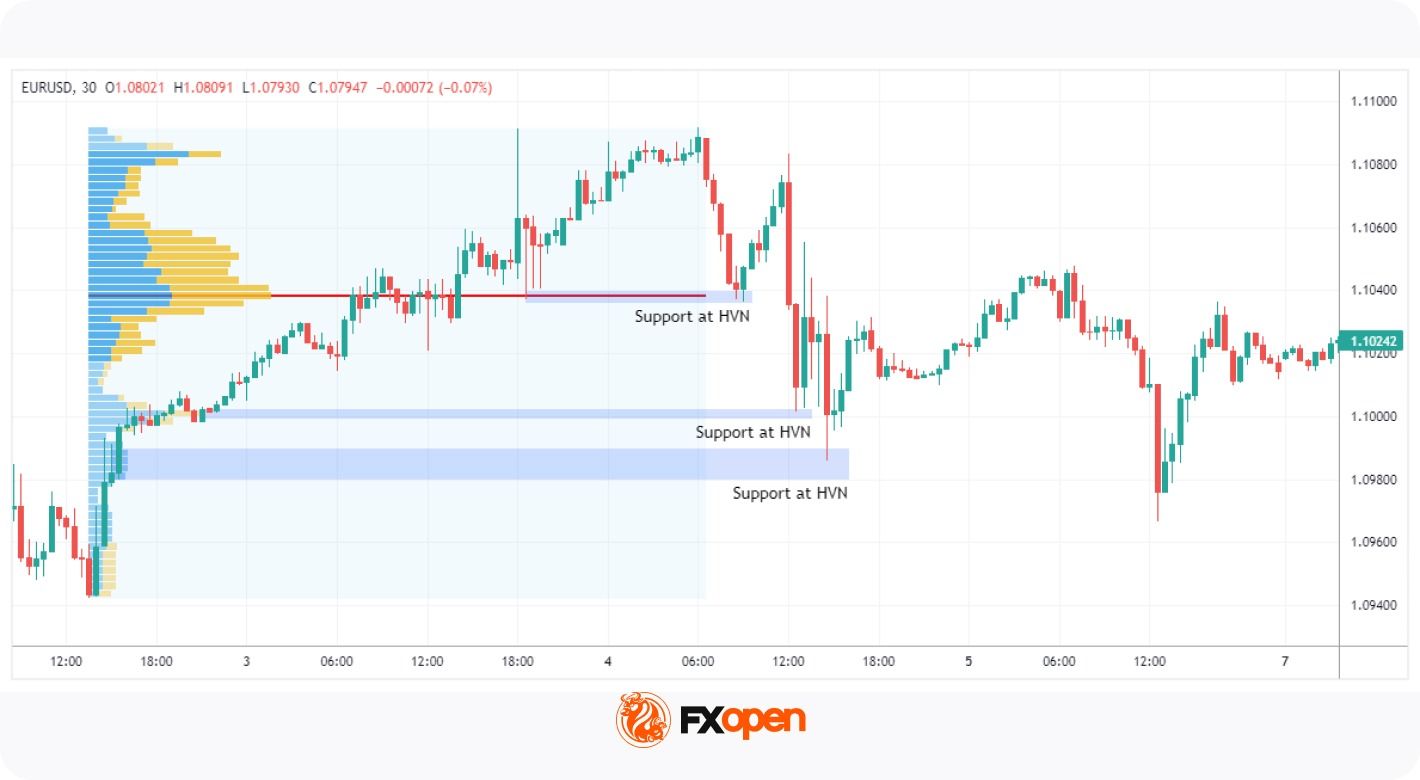
The FRVP can be an invaluable tool in identifying support and resistance levels. HVNs often indicate levels of strong support or resistance as they reflect periods where a significant amount of trading has occurred. These are areas where the market has shown acceptance, often making them difficult to breach.
Conversely, LVNs, with their relatively lower trading activity, often highlight potential breakpoints. Because these are levels at which the market has shown rejection. They are less likely to act as strong support or resistance areas, and the price is more likely to pass through them more quickly.
The split comes down to acceptance versus rejection. Where the market accepted price, volume built up and a zone holds. Where it rejected price, volume stayed thin and the zone gives way. Using the Fixed Range Volume Profile for support and resistance rests on reading that difference. The table below summarises how the two nodes tend to behave.
Therefore, traders can use HVNs and LVNs as a basis to establish potential entry and exit points in their trading strategies. For example, a trader may consider entering a long position when the price breaks above an HVN (an area of resistance). Similarly, an LVN above the current price might be a good target for this long trade, as the price could rise quickly to this level.
Point of Control (POC) in Market Analysis
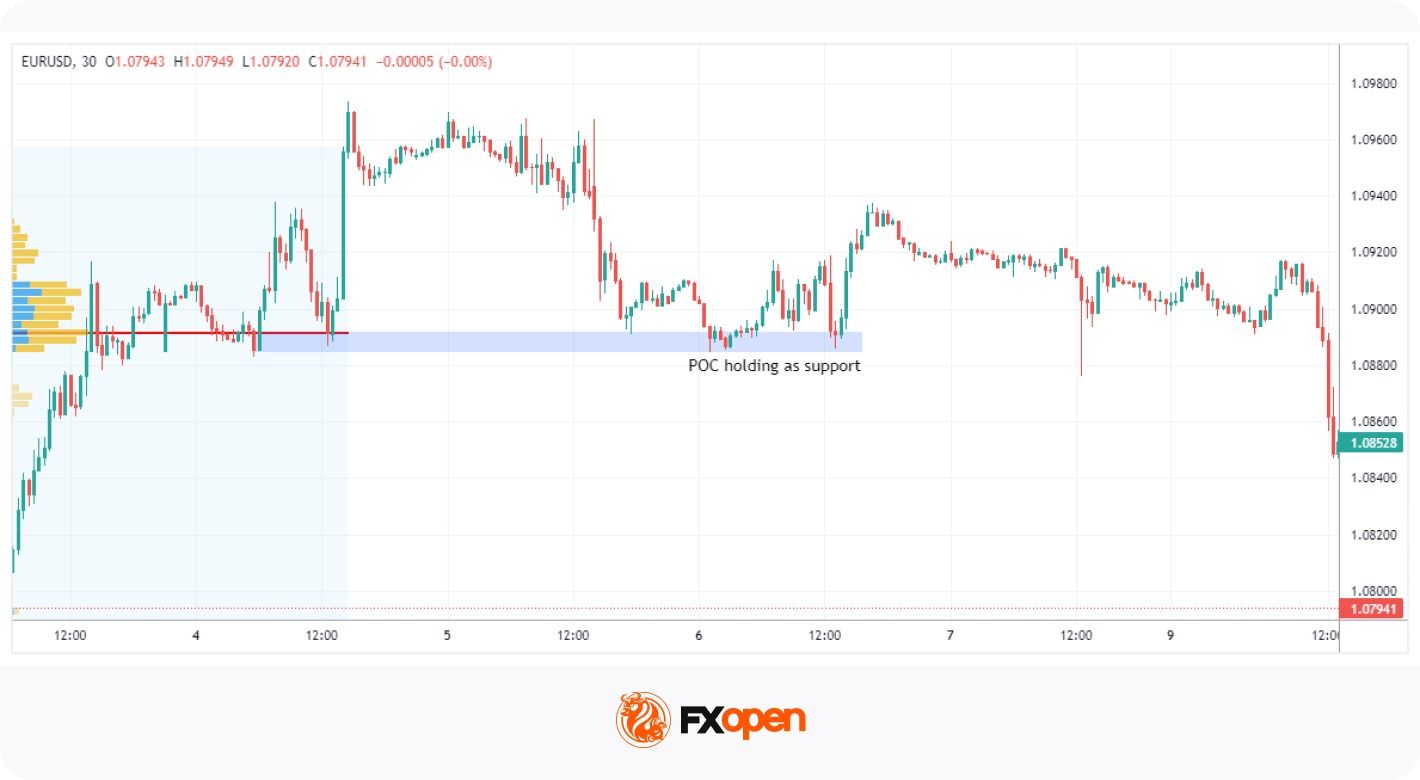
In addition to HVNs and LVNs, the Point of Control (POC) is another widely used element within the Fixed Range Volume Profile. Price often revisits the POC because it marks the range’s balance point. It is where the most business was done, so the market treats it as fair value.
In an upward-trending market, the POC often acts as a support level, where buyers may enter or add to long positions, expecting the price to bounce back upwards. Conversely, in a downward-trending market, the POC can serve as a resistance level, where sellers might consider short positions, anticipating market rejection.
In a broader Fixed Range Volume Profile strategy, traders often look at:
- Whether price stalls or pushes straight through the POC
- How volume behaves as price returns to the level
- Where the POC sits against the wider price action
Fixed Range Volume Profile vs Session Volume Profile vs Visible Range
The Fixed Range Volume Profile is one of three common volume profile types. The other two are the Session Volume Profile and the Visible Range Volume Profile (VRVP). All three plot volumes by price. They differ in how the range is set.
The Fixed Range Volume Profile vs Session Profile vs Visible Range Volume Profile question comes down to control. With FRVP, you pick the start and end points by hand. The profile then stays locked to that move. The Session Volume Profile sets its own range. It resets automatically at the open of each trading session. The Visible Range Volume Profile uses whatever bars are on screen. It redraws as you scroll or zoom.
Traders pick the tool to match the question. FRVP is used for a completed move traders want to study closely. The Session Volume Profile is popular for intraday work, where each day’s value matters. The Visible Range Volume Profile is applied for a fast read of the wider chart. Many traders run more than one together. A fixed range over a key leg, paired with the current session, can give context that neither offers alone.
Selecting the Range for FRVP Analysis
The range you choose shapes everything the FRVP shows you. The same chart can produce different profiles depending on where you start and finish. So the choice of range is the important decision when using the tool. A well-chosen range captures one clean phase of market activity. A poorly chosen one mixes unrelated moves and blurs the read.
Most traders anchor the profile between two clear points. A swing high to a swing low is the common choice, as it brackets a single move. This ties the profile to a defined piece of market structure rather than an arbitrary stretch of chart.
Several range types tend to suit the tool:
- Trend legs: a single push from one swing point to the next, to see where volume built during the move.
- Consolidations: a sideways range or period of consolidation, to find the levels the market kept returning to.
- News-driven moves: a sharp reaction to an event, to map where volume settled once the move calmed.
- Swing ranges: a full swing from high to low, often used alongside a swing trading approach.
Because the output depends on the input, two traders can read the same chart differently. One brackets the whole trend. Another brackets only the latest leg. Both profiles are valid, but they answer different questions. Many traders test a few ranges over the same area. They look for levels that hold up across more than one selection, since those tend to carry more weight.
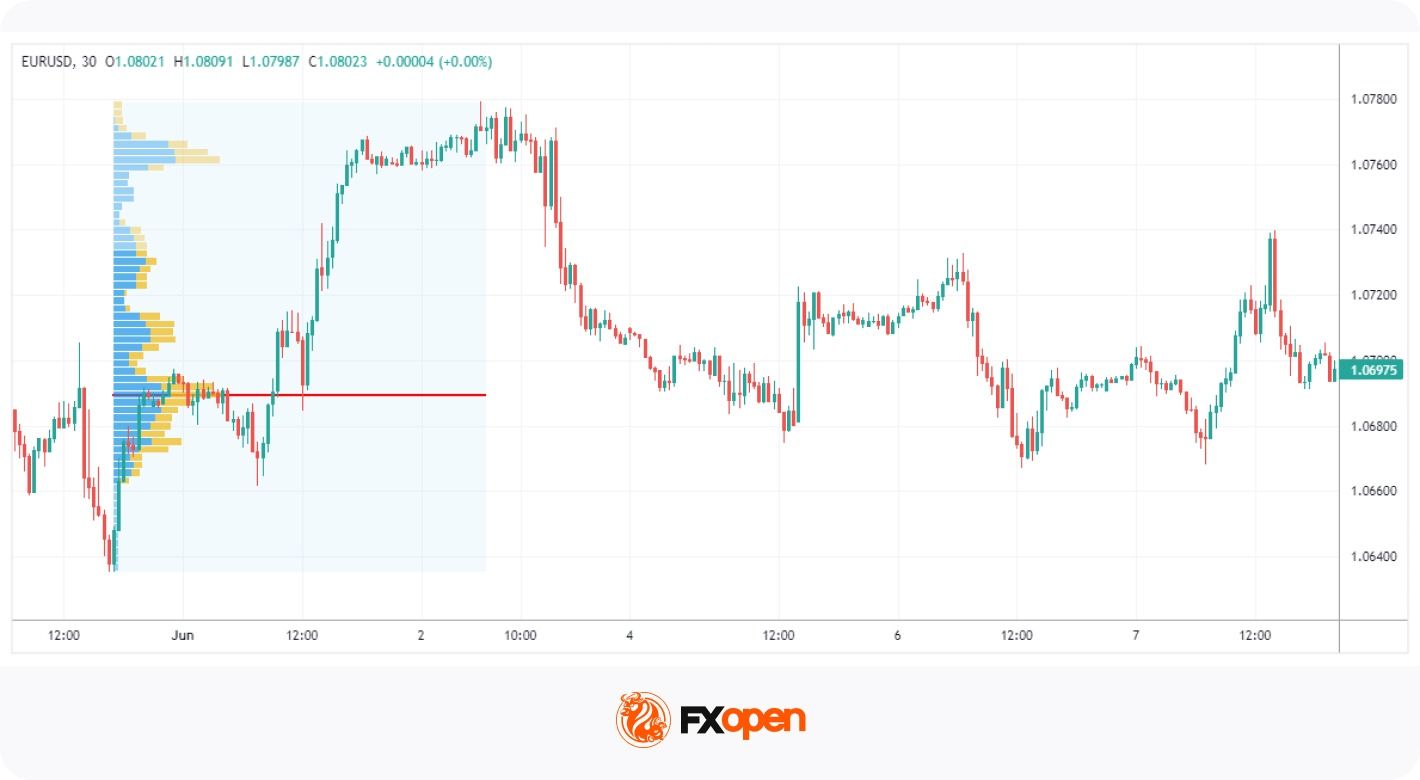
FRVP Example: Analysing a Market Range
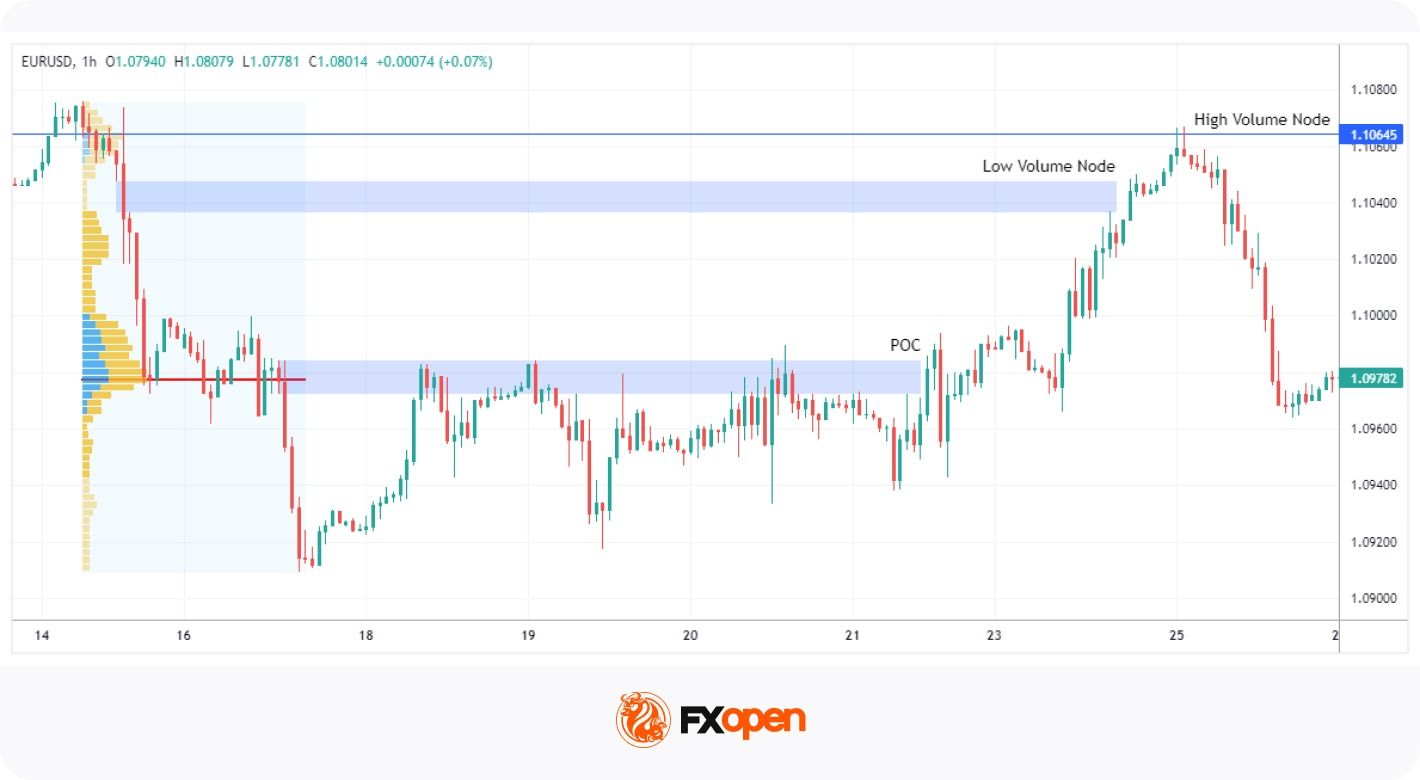
In this example, we see the market cooling off after a prolonged uptrend to the left (finishing just on the edge of the chart). The price fell sharply, finding a bottom. Given the distinct high and low points, the FRVP tool is set to those two points. The walkthrough below breaks the move into five steps.
- Set the range. With clear high and low points in place, the profile is anchored from the swing high to the swing low. This brackets the full move for analysis.
- Read the POC. The first area to notice is the POC, which acted as strong resistance within the multi-day range. Traders could have anticipated this area to hold, using other forms of technical analysis to find entries on a lower timeframe.
- Mark the LVN target. The POC area was eventually pierced through, indicating that it may be time for the price to come and meet the LVN toward the top of the range. This level represented the area with the lowest volume in the entire range. Combined with the prior bullishness offscreen, traders could have been confident that the price would at least reach this area, acting as a solid target if they had bought earlier near the POC.
- Watch the HVN reaction. However, it moved higher to tap the HVN (blue line). Notice that it’s the area with the highest volume besides the POC. After reaching the HVN, the price quickly reversed.
- Confirm the turn. Similar to the POC, traders could have anticipated bearishness from this area. The shooting star pattern here acted as confirmation.
Common FRVP Mistakes
So what are the common mistakes many traders make when using the Fixed Range Volume Profile indicator? The list below covers the ones that catch traders out most often.
- Misreading volume nodes: Traders may assume all HVNs or LVNs carry equal weight. Their importance shifts with the broader market context, so strong bullishness can see an HVN traded straight through.
- Ignoring other indicators: Relying on the FRVP alone makes for a one-dimensional approach. A sound strategy pairs it with tools that confirm reversals, like the Relative Strength Index (RSI) or MACD.
- Over-relying on historical data: The FRVP maps past activity, not future moves. Fundamental drivers still matter and belong in the analysis.
- Selecting the wrong range: A poorly chosen range mixes unrelated moves and distorts the profile. The levels it produces then carry little meaning.
- Ignoring higher timeframes: A profile read in isolation can clash with the wider trend. Checking a higher timeframe gives needed context.
- Treating nodes as exact prices: HVNs and LVNs mark zones, not precise lines. Expecting prices to turn at a single level often disappoints.
- Skipping risk management: Using the FRVP without risk management leaves a strategy exposed when a level fails to hold.
Advantages and Limitations of FRVP
Like any tool, the FRVP indicator has clear strengths and real limits. Knowing both may help traders use it in the right place. It reads volume well, but it does not act as a standalone system.
On the plus side, the volume profile indicator shows where genuine activity occurred, not just when. It ties volume directly to price, which standard volume bars cannot do. It also locks to a chosen move, so the analysis stays focused. That makes it useful for marking support, resistance and likely target zones.
The limits matter just as much. The FRVP reflects past activity, so it offers no guarantee about future moves. Its output depends entirely on the range you select, which adds a layer of judgement. On forex charts, the volume shown is often tick volume rather than true traded volume. And the tool is always combined with other forms of analysis.
Key Takeaways
The Fixed Range Volume Profile may help traders analyse where trading activity was concentrated within a selected price range. By highlighting key areas such as the Point of Control, Value Area, High Volume Nodes, and Low Volume Nodes, it provides additional context on where the market found acceptance or rejection.
Like any technical tool, the FRVP is commonly used alongside price action analysis, market structure, and risk management. Since the profile’s output depends heavily on the range selected, traders typically take care to choose ranges that reflect meaningful market swings or trading sessions.
With an understanding of how to use the FRVP indicator, you might consider opening a trading account with FXOpen to access over 700 markets across forex and CFDs.
FAQ
What Is Fixed Range Volume Profile (FRVP)?
Fixed Range Volume Profile (FRVP) is a volume analysis tool that displays how much trading activity occurred at different price levels within a user-defined range. Instead of focusing on volume over time, it organises volume by price, which may help traders identify areas where the market spent the most and least effort transacting.
What Does the Point of Control Mean in FRVP?
The Point of Control (POC) is the price level that recorded the highest trading volume within the selected range. Traders often monitor the POC because it can represent a key area of market acceptance, where buyers and sellers were most active, and where price may later find support, resistance, or balance.
What Are HVNs and LVNs?
High Volume Nodes (HVNs) are price levels where a large amount of trading occurred, often indicating areas of market acceptance and potential support or resistance. Low Volume Nodes (LVNs) are levels with relatively little trading activity and may represent zones of rejection where price can move through more quickly.
How Is FRVP Different From Session Volume Profile?
The main difference is that FRVP analyses a manually selected price range, allowing traders to focus on specific market swings, consolidations, or trends. Session Volume Profile, by contrast, automatically calculates volume distribution for predefined trading sessions without requiring manual range selection.
Can FRVP Identify Support and Resistance Levels?
Many traders use FRVP to identify potential support and resistance areas. High Volume Nodes and the Point of Control often highlight prices where significant trading activity occurred, which can attract future market interest. However, these levels are not guaranteed to hold and are typically assessed alongside other forms of technical analysis.
What Is the Value Area in a Volume Profile?
The Value Area is the range of prices that contains approximately 70% of the total traded volume within the selected profile. It is bounded by the Value Area High (VAH) and Value Area Low (VAL). Traders often use these levels to assess whether price is trading in an area of perceived value or moving beyond it.
Which Markets Can FRVP Be Used On?
FRVP can be applied to a wide range of markets, including forex and CFDs. The tool is particularly popular among traders who analyse market structure and volume distribution, as it may help highlight areas where significant trading activity has taken place.
This article represents the opinion of the Companies operating under the FXOpen brand only. It is not to be construed as an offer, solicitation, or recommendation with respect to products and services provided by the Companies operating under the FXOpen brand, nor is it to be considered financial advice.

Bitcoin’s Reset May Be Here…
Man charged after ‘woman, child, and police officers assaulted’ on street
Manipal Hospitals is said to plan $1 billion IPO in July


-

 Business3 days ago
No Jackpot Winner as $257 Million Prize Rolls Over to $269 Million Monday Draw
-

 Crypto World6 days ago
Oppenheimer backs SpaceX as $70 billion retail frenzy builds
-

 Fashion5 days ago
Weekend Open Thread: Tuckernuck – Corporette.com
-

 Crypto World6 days ago
Markets Rally as SpaceX IPO Looms Amid Iran Tensions and Inflation Surge
-
Crypto World2 days ago
Zimbabwe Requires Crypto Businesses to Register Annually Under New FIU Regulations
-

 Tech4 days ago
NanoClaw integrates JFrog registries to secure AI agent downloads
-

 Tech5 days ago
This Week In Security: Microsoft On Microsoft, Register Your Domains, Linux On ARM, And FreeBSD Joins The File Cache Club
-

 Crypto World4 days ago
Bitget enters Argentina’s regulated crypto market through PSAV registration
-
 Tech6 days ago
Dutton Ranch star claims they ‘didn’t see any disruption’ on set following Chad Feehan’s exit from Yellowstone spinoff fueled by Taylor Sheridan clash rumors
-

 NewsBeat6 days ago
El Nino has formed in the Pacific and could set records, forecasters say
-

 Politics6 days ago
Politics Home | Healey Resignation Is “Colossal Failure Of Government”, Says Former Labour Defence Secretary
-
 Entertainment6 days ago
Donnie Wahlberg & More Heat Up Las Vegas at Circa’s Barry’s Downtown Prime
-
 Tech6 days ago
Opendoor Ends India Operations, Fueling a Bigger Conversation About AI and Outsourcing
-

 Sports6 days ago
First Time Since 1971: Australia Register Historic Low In ODI Cricket
-

 Politics6 days ago
Belfast burns, while Met chief points finger at Iran and Russia
-

 Business6 days ago
AT&T: Verizon's 27% Outperformance Sets Up A Solid Entry Point
-

 NewsBeat5 days ago
FBI searches office of Ohio voter registration group
-
 Tech5 days ago
Anthropic is spending $150M to embed 1,000 AI fellows inside nonprofits. No degree required.
-

 Politics6 days ago
Modi thanks Trump for wishes as US attacks Indian seafarers
-
 Entertainment5 days ago
‘The Pitt’s Fan-Favorite Doctor Confirms Noah Wyle Gave His Blessing to Return [Exclusive]
You must be logged in to post a comment Login