

Crypto World
Forex Kill Zone Times and ICT Trading Sessions
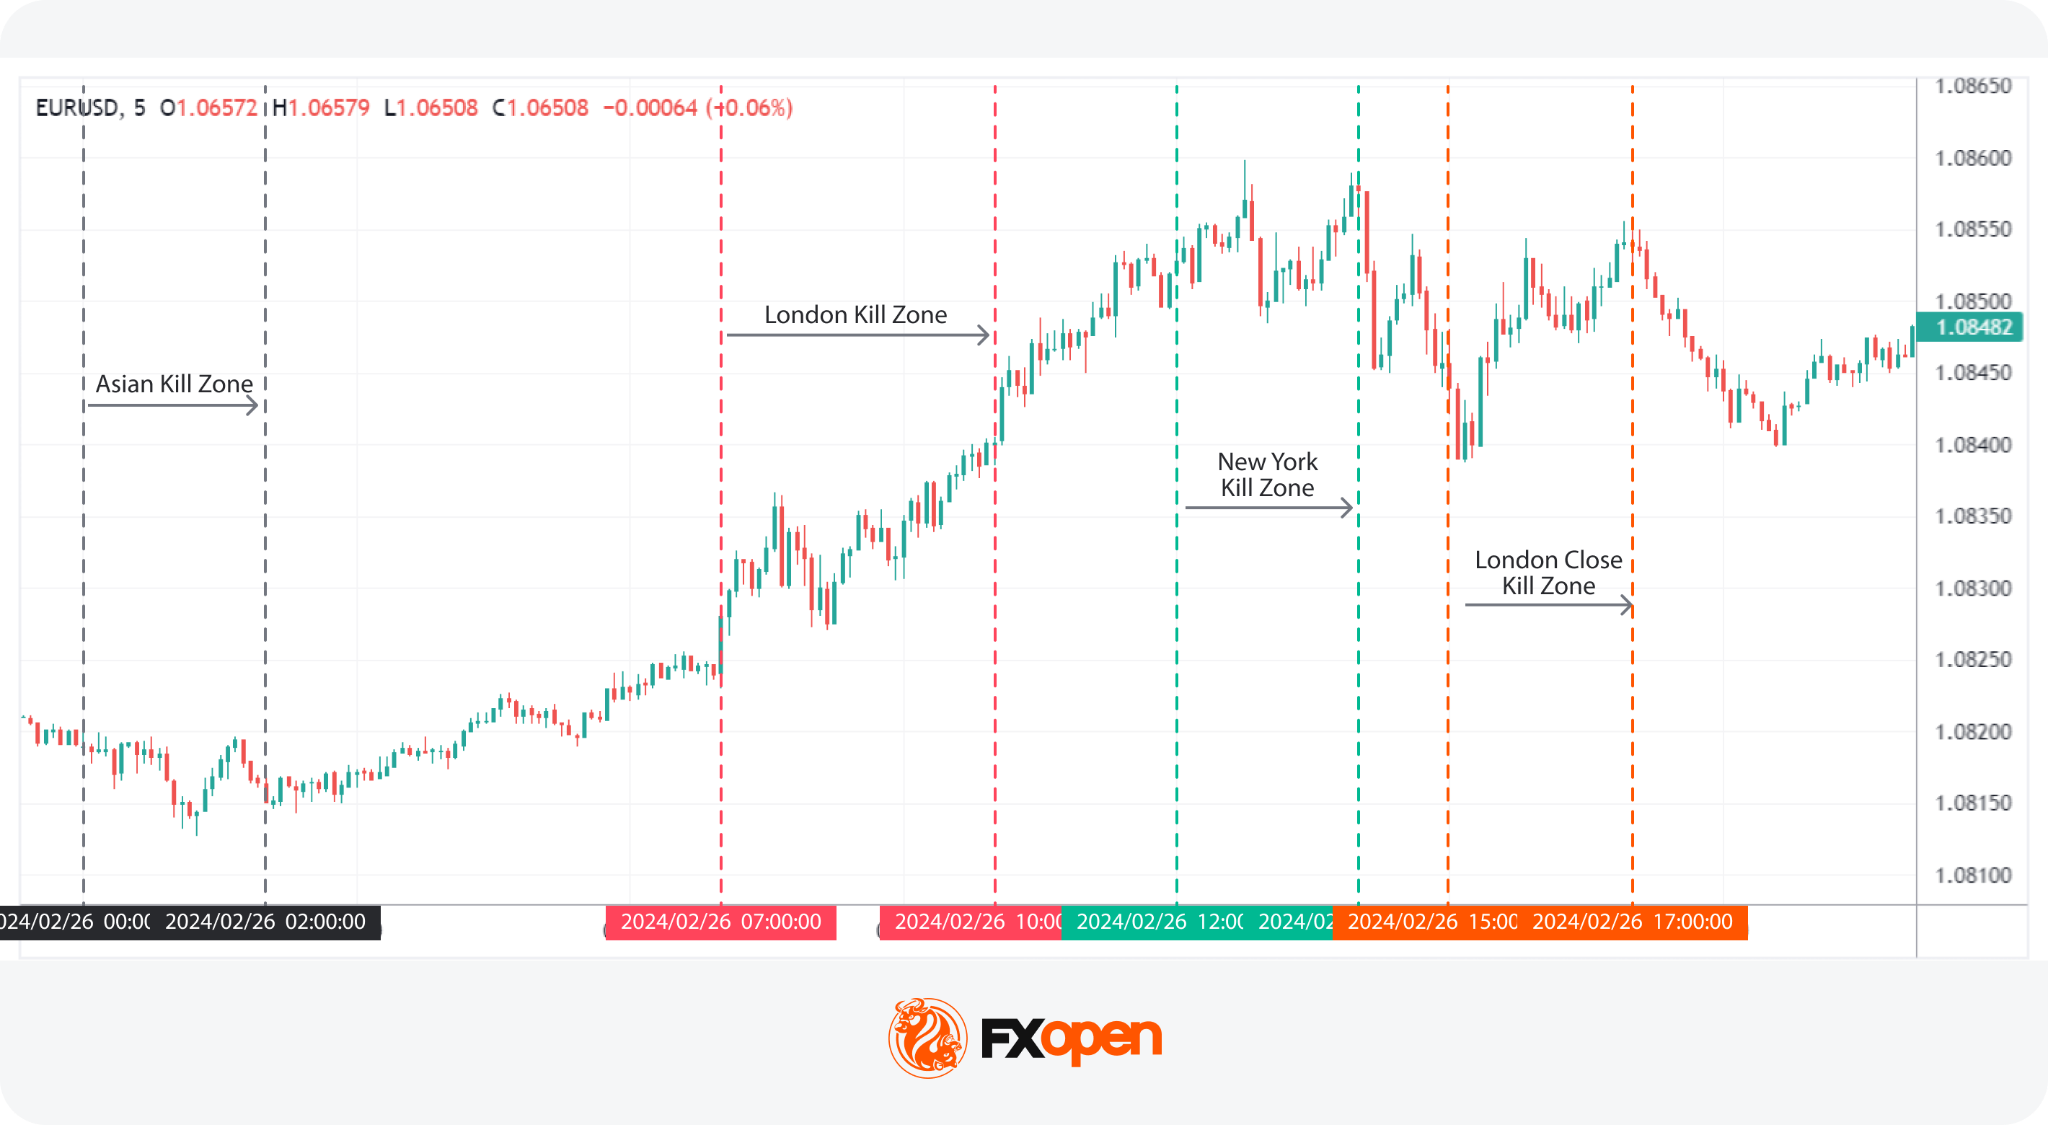
Kill Zone trading is a method that focuses on the most liquid and volatile periods of the trading day. It aims to align trades with institutional activity during specific time windows. The concept comes from the Inner Circle Trader (ICT) method, with ICT Kill Zone times covering the Asian, London, and New York sessions. These forex Kill Zone times mark specific intraday periods when liquidity, trading volume, and institutional activity tend to increase, with the London Kill Zone time among the most active windows.
This article explains forex Kill Zone times, the main trading sessions, and the role of institutional order flow in Kill Zone trading.
What Is a Forex Kill Zone?
A forex Kill Zone is a short, high-activity window when a currency pair tends to see higher volatility and trading volume. These windows usually align with the open of a major session or occur during forex session overlaps. The concept, popularised by Michael Huddleston, also known as the Inner Circle Trader, highlights the importance of timing in trading strategies.
These active windows sit inside the broader forex market sessions. The forex market operates 24 hours a working day across four major sessions: Sydney, Tokyo, London, and New York. Each session reflects the working hours of its regional financial centre.
A trading session and a Kill Zone are not the same thing. A session lasts around nine hours and covers a region’s full trading day. A Kill Zone is a shorter window, often two to three hours, when order flow tends to concentrate. Forex Kill Zones therefore act as focused periods within these longer sessions.
Two main forces drive this concentration of activity during a Kill Zone. Liquidity rises as institutional order flow enters the market, which can tighten spreads. Volatility tends to rise as that heavier order flow moves price more quickly. A session overlap strengthens both effects, since two regions trade at once. The London and New York overlap is the clearest example, and it shapes much of Kill Zone trading.
Forex Kill Zone Times at a Glance
Forex Kill Zone times group into four main windows across the trading day, each tied to the main ICT trading sessions. The table below sets out each window in GMT for winter and summer, the pairs that tend to lead it, and how the market usually behaves.
The Asian window keeps the same GMT trading times year-round, since Tokyo does not observe daylight saving. For current session times, traders often confirm the windows against a forex trading hours reference.
Main ICT Kill Zone Times in Detail

Each Kill Zone period corresponds to transitions in major forex markets worldwide. The windows differ in their typical pairs, pace, and liquidity.
Below, we’ve described each along with the key ICT Kill Zone times. You can see how currency pairs react during these times in FXOpen’s TickTrader trading platform.
1. Asian Kill Zone
Asian Kill Zone Time Period: 23:00 GMT to 02:00 GMT in winter and in summer.
This window coincides with the opening of Asian markets, primarily Tokyo. This period sees increased activity in currency pairs with AUD, NZD, and JPY.
During these hours, price tends to trade inside a tight range rather than trend strongly. This is known as the Asian range, and traders watch its high and low as reference levels. Lower participation means liquidity builds slowly rather than driving large moves. That accumulated liquidity can matter later, since the high and low of the Asian range often shape the first London moves. A break of either level after the London open can signal where larger order flow is heading.
2. London Kill Zone Time
ICT London Kill Zone Time Period: 08:00 GMT to 11:00 GMT in winter (07:00 GMT to 10:00 GMT in summer).
This window is known for its volatility and significant trading volume, particularly involving EUR and GBP. As the London session opens, it often establishes the daily highs (in bullish markets) or lows (in bearish markets).
Much of this reaction centres on the Asian session highs and lows formed overnight. Price often sweeps these levels first, taking liquidity that rested above or below the Asian range. A liquidity sweep of this kind can precede a sharper move once the level breaks. London session volatility can rise quickly as European volume enters. Traders study these conditions to prepare for potential breakouts or reversals.
3. New York Kill Zone Time
New York Kill Zone Time Period: 13:00 GMT to 16:00 GMT in winter (12:00 GMT to 15:00 GMT in summer).
This window marks the overlap of the London and New York sessions, creating a critical period for USD-paired currencies.
USD pairs become more active when the New York forex session overlap occurs because American volume joins a market London is still trading. The New York Kill Zone draws traders from two continents at once, which lifts liquidity and pace. High-impact US economic data is often released during this period, including inflation and employment figures. These releases can move USD pairs sharply within minutes, so volatility tends to spike around them.
Traders seek continuation or reversal of the trends established over the London session, employing strategies that capitalise on the volatility to maximise returns.
4. London Close Kill Zone
London Close Kill Zone Time Period: 15:00 GMT to 17:00 GMT in winter (14:00 GMT to 16:00 GMT in summer).
As the London session concludes, this window typically exhibits less volatility but still offers conditions for strategic trades. Traders might observe retracements or continuations of earlier trends.
European participation declines as London desks close their books for the session. With fewer active participants, liquidity and volatility usually eases versus the London and New York windows. Moves can still occur, though they often lack the force seen during the main overlap. Strategies here often centre on trend exhaustion as European traders step back before the US close.
Trading Considerations During Kill Zones
When engaging with Kill Zones in forex, practical considerations are important for leveraging these periods. Keep in mind these things:
Economic Calendar Events
High-impact data often lands during the New York Kill Zone and the London hours. Releases such as interest-rate decisions and employment figures can create market volatility. Many traders check an economic calendar before a session to see what is scheduled.
Daylight Saving Time Adjustments
Traders account for time zone shifts such as British Summer Time (BST) and Eastern Daylight Time (EDT) when planning their trading schedules. These shifts can impact the real-time operation of forex markets by altering the relative timing of session openings and peak activity periods.
BST is GMT+1, moving the London window to an hour earlier for those trading on GMT. During BST, which typically runs from late March to late October, the London Kill Zone shifts from 07:00 to 10:00 GMT. Conversely, EDT, which is GMT-4, affects those in the US by advancing the New York window to start and end an hour earlier. This period typically extends from the second Sunday in March to the first Sunday in November.
For a quick conversion, add one hour to GMT during BST to reach local London time. Traders also confirm broker or server time, since platform clocks may differ from GMT.
Risk Management
Trading these windows means facing periods of rapid, hard-to-anticipate price movement. Sound risk management may potentially help traders manage that exposure.
- Volatility-Based Position Sizing: Adjusting position sizes based on volatility may be useful. In more volatile periods like the London or New York openings, reducing position size might help manage potential losses.
- Time-Specific Stop-Loss Orders: Stop-loss orders that reflect the heightened activity levels is another risk management tool. Pre-defined risk limits, set before the session, may potentially help traders avoid reactive decisions when price moves quickly. Wider stops may suit the New York window, where price gaps are more common. Slippage can also rise around high-impact news, filling orders away from the intended level.
- Real-Time Monitoring: Active monitoring during these volatile times is vital. Setting alerts at particular levels and indicators may aid in a proactive approach.
Currency Pairs Commonly Traded During Kill Zones
Each Kill Zone tends to favour the major currency pairs tied to the regions trading at that hour. Matching a pair to its active window can place a trade where liquidity is deepest.
EUR/USD is most active across the London and New York windows, when European and US volume overlap. It carries some of the tightest spreads in forex, which suits the faster pace of these hours. GBP/USD also leads during the London Kill Zone, often moving further than EUR/USD on the same news.
USD/JPY draws activity in both the Asian and New York windows, since it bridges two of the regions. It tends to react sharply to US data and to shifts in risk sentiment. AUD/USD is most active in the Asian window, when Australian and regional markets set the early tone.
Liquidity differs across these pairs and across the windows themselves. The major pairs above usually trade with deeper liquidity and narrower spreads than minor or exotic pairs. That depth tends to thin outside the main ICT trading sessions as currency pair activity declines, which can widen spreads and slow fills. For this reason, traders often focus on the pairs whose home session is open.
Key Takeaways
Kill Zone strategies focus on specific periods of the trading day when liquidity and market activity tend to increase. By monitoring these windows, traders can analyse how price behaves around session opens and overlaps, where larger market participants are often most active.
The four forex Kill Zones are the Asian, London, New York, and London Close windows. Each corresponds to a key trading session or session overlap – key institutional trading hours – and ICT Kill Zone times may shift during daylight-saving periods. Understanding these time windows can help traders place market activity into context, as liquidity, volatility, and price behaviour often vary significantly from one session to another.
Those looking to refine their market timing and participate in high-impact trading sessions may consider opening an FXOpen account to access a wide range of currency pairs during these critical periods of volatility.
FAQ
How Could You Use a Kill Zone?
Traders use a Kill Zone to time entries and exits during periods of high volatility and liquidity, capturing significant price movements during specific time windows — usually at the beginning or end of a trading session or when sessions overlap.
How May Traders Participate During ICT Kill Zones?
Traders can engage by monitoring price action, identifying high-probability setups, and executing trades on currency pairs during major institutional trading windows.
What Are Forex Kill Zone Times?
Forex Kill Zone times are specific periods during major trading sessions when liquidity and trading activity tend to increase. They are commonly associated with the Asian, London, New York, and London Close sessions.
What Is the London Kill Zone Time?
The London Kill Zone time generally occurs around the opening hours of the London session. It is commonly referenced as 07:00 to 10:00 GMT in summer or 08:00 to 11:00 GMT in winter.
What Is Kill Zone Trading?
Kill Zone trading is a session-based approach that focuses on trading during periods when market participation and liquidity are typically higher.
What Is the New York Kill Zone?
The New York Kill Zone refers to the period when New York trading overlaps with London. This overlap often creates increased activity in USD-related currency pairs. It is commonly referenced as 13:00 GMT to 16:00 GMT in winter and 12:00 GMT to 15:00 GMT in summer.
Do ICT Kill Zone Times Change During Daylight Saving Time?
Yes. ICT Kill Zone times can shift when London or New York move to daylight saving time. For example, the London Kill Zone typically occurs one hour earlier in GMT during British Summer Time (BST). Traders should check current session schedules and their broker’s server time to ensure they are using the correct timings.
Which Currency Pairs Are Most Active During Kill Zones?
EUR/USD, GBP/USD, USD/JPY, AUD/USD, and other major pairs often show increased activity during their respective regional sessions.
This article represents the opinion of the Companies operating under the FXOpen brand only. It is not to be construed as an offer, solicitation, or recommendation with respect to products and services provided by the Companies operating under the FXOpen brand, nor is it to be considered financial advice.

Most of the crypto sector climbed over the past seven days, yet meme coins slipped 1.1% and split beneath the surface. That divergence is where the meme coins to watch are hiding.
On-chain positioning now tells a sharper story than price. One token is cooling from a record high, another shows whales accumulating then booking profit, and a third has smart money buying the dip whales are selling.
BinanceLife (币安人生)
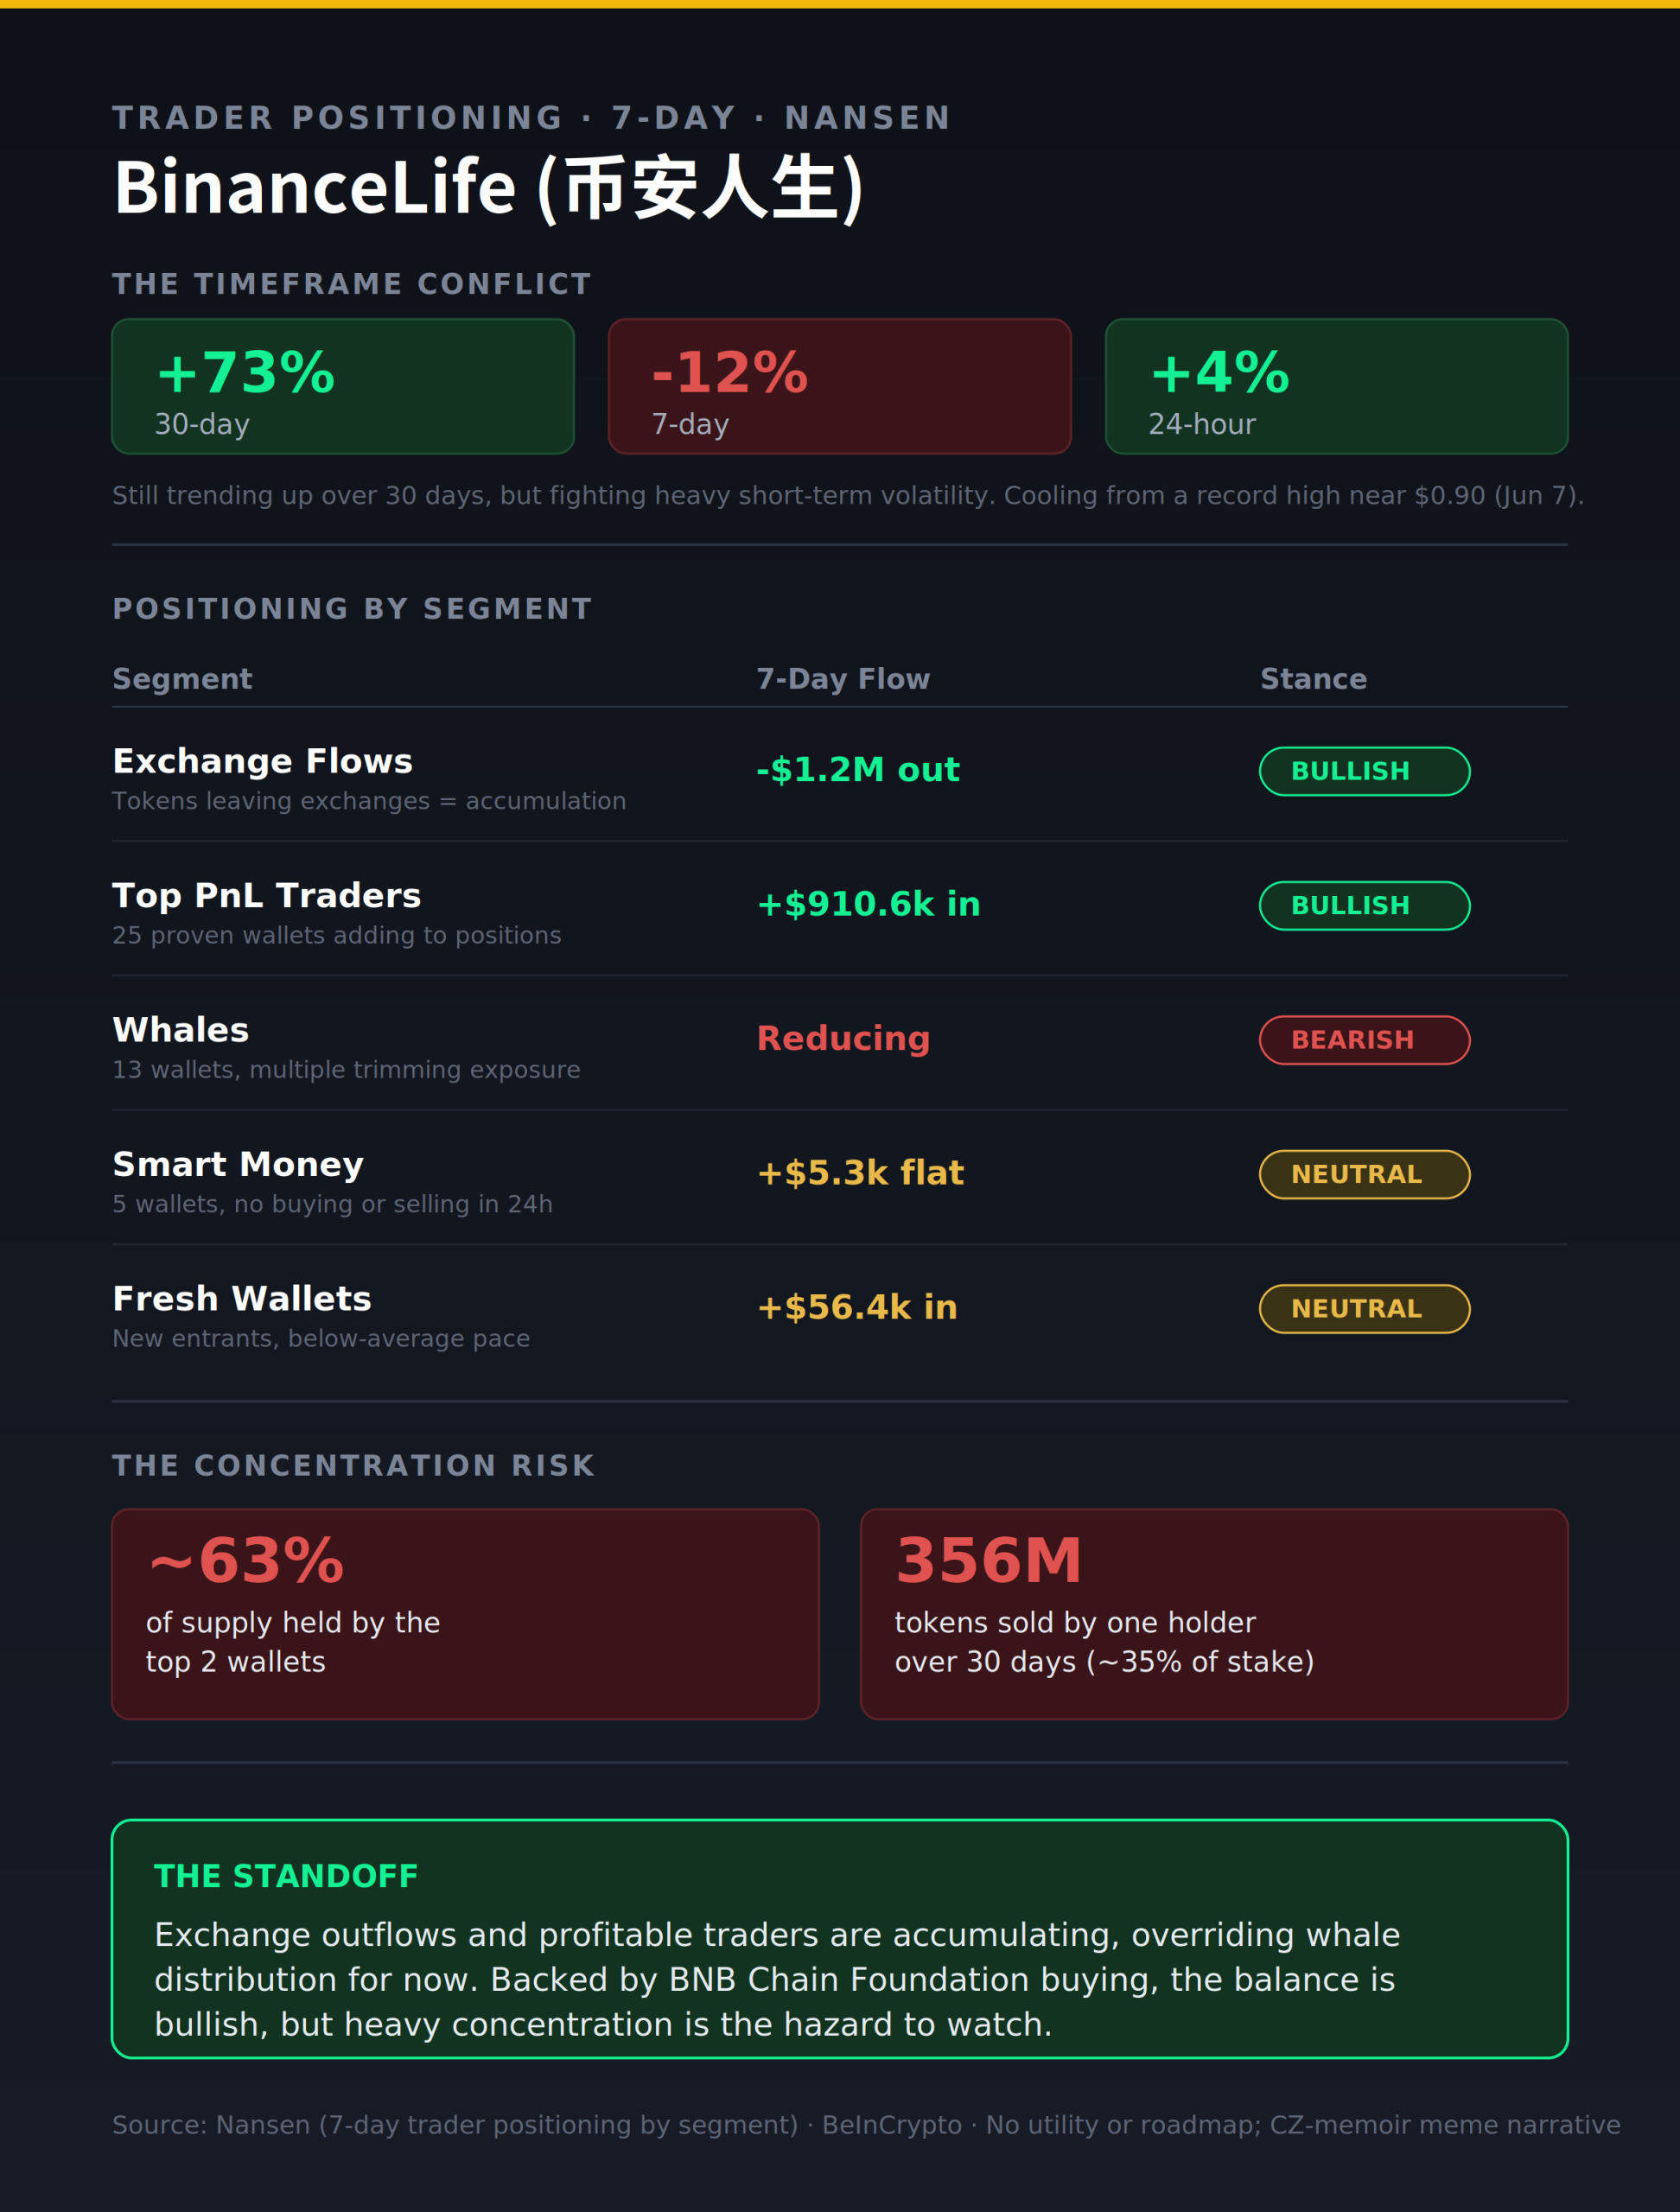
BinanceLife, known in Chinese as 币安人生, is interesting precisely because its timeframes disagree. The token is up more than 73% over 30 days, down about 12% on the week, yet up roughly 4% on the day. That conflict captures a meme coin still trending up but fighting heavy short-term volatility.
Want more token insights like this? Sign up for Editor Harsh Notariya’s Daily Crypto Newsletter here.
It draws its entire narrative from the shared name with CZ’s memoir, with no utility or roadmap behind it. That makes positioning, not fundamentals, the only real guide to where it goes next.
The flows split sharply. Exchange outflows hit $1.2 million over seven days, a classic accumulation pattern as tokens leave exchanges for private wallets. Top profit-taking traders added $910,000 across 25 proven wallets. That is the bullish core.

The risk sits opposite. Multiple whales trimmed positions, one mega-holder sold 356 million tokens, and the top two wallets control roughly 63% of supply. Concentration is the hazard to watch.
The chart frames the next move. After topping near $0.90 on June 7, BinanceLife has corrected inside a descending channel, and its latest push higher was met by sellers (possibly whales) at the channel top. The 20-period exponential moving average, a trend gauge that weights recent prices, sits near $0.68. Holding it keeps $0.69 and then $0.73 in play, and a break above $0.73 would end the bearishness and open a move toward $0.80.

Losing $0.68 puts $0.63 in focus. That level decides whether accumulation or distribution wins.
Pepe (PEPE)
Pepe earns its spot among the meme coins to watch on a clean conflict between whale accumulation and profit-taking. The token is up about 5.2% over seven days and 2.8% on the day, a steady climb that is now drawing sellers.
The on-chain story is the hook. Whale supply, the share held by the largest wallets with exchanges excluded, jumped sharply on June 14, rising from roughly 181 trillion to about 183.6 trillion tokens. That addition is worth close to $7.5 million at current prices, a clear accumulation spike.

Then it turned. Whales have started trimming that fresh stash, easing back toward 183 trillion as the price pushed higher. That sequence, buying hard and then booking profit into strength, is the pattern that defines the week. How deep the profit-taking runs is the question.
The chart sharpens it. Pepe has rebounded almost 17% from its June 6 low near $0.00000252, but volume has thinned steadily since June 12 even as price climbed. Falling volume on a rising price is a bearish divergence, a sign buyers are losing force into resistance.

That resistance sits at $0.00000300, the level where whale selling could cap the move. A daily close above it would show buyers absorbing the distribution, opening a path toward $0.00000331. Failing there hands control back to the sellers trimming their stash. That tug-of-war is what makes Pepe one of the meme coins to watch.
Official Trump (TRUMP)
Official Trump is the macro-sensitive name among the meme coins to watch, tied closely to the US-Iran peace-deal narrative that has driven sentiment since early June. If that deal weakens, TRUMP could see a sharp sentiment swing, which makes its positioning worth tracking now.
The token has been hammered, trading near $1.99 against the $4.50 high it reached in March. A rebound stalled near $2.38, but selling pressure is now easing, which hints the next pullback may be shallower if flows cooperate.
The flows are split but lean constructive. On Hyperliquid perpetual futures, smart traders hold a roughly 3-to-1 long bias and top profit-taking traders added $158,000 over seven days, an inflow running far above their average. That is aggressive accumulation from historically winning wallets.

The offset is whale behavior. Whales cut about $393,000 over the week and one large holder shed 417,000 tokens, while exchange inflows of $457,000 hint at sell pressure. Smart money is buying the dip that whales are selling into.
The chart sets the test. Reclaiming $2.20 keeps the recovery alive, and if smart money holds while whales stay sidelined, $2.64 and $2.99 come into view.

Only a break above $3.35 would end the broader downtrend, which looks distant. If smart money flips to selling alongside the whales, $1.49 returns to the table. That balance makes Official Trump one to watch.
The post 3 Meme Coins to Watch in the Third Week of June 2026 appeared first on BeInCrypto.


Much of the activity has occurred on offshore exchanges, including fast-growing platforms such as Hyperliquid, which has attracted professional traders seeking deep liquidity and continuous access to leveraged markets. Prediction market Kalshi, which introduced perps on its platform earlier this month, saw over $1 billion in trading volume within just one week.
The debut comes weeks after the CFTC signaled that regulated platforms could offer perpetual futures. In May, the agency approved Kalshi’s bitcoin perpetual contracts and issued guidance that also cleared a path for Coinbase (COIN) to connect U.S. customers to global options and perpetual markets.
Kraken has been building toward the introduction through a series of derivatives-focused acquisitions and product releases. The company acquired NinjaTrader in May 2025 and Bitnomial a year later to gain regulated futures infrastructure. It recently added CME-listed crypto futures and margin trading for U.S. customers.
Kraken’s head of derivatives John Palmer told CoinDesk last week that adoption may mirror the trajectory of spot bitcoin exchange-traded funds (ETFs), with sophisticated traders entering first before investment advisers and asset managers follow after completing internal reviews.
At launch, Kraken’s perpetual futures cover major cryptocurrencies including BTC, ETH, SOL, XRP, ADA, LINK, DOGE, LTC and AVAX. The company said it plans to expand the range of contracts and collateral options over time.


Standard Chartered's research division initiated coverage of Uniswap, the largest decentralized exchange, with a thesis that ties its governance token to the institutional tokenization wave. The bank's Geoff Kendrick, global head of digital assets research, argues Uniswap is positioned to become… Read the full story at The Defiant

Pudgy Penguins CEO Lucas Netz claims his mobile game app Pudgy Party lost the NFT firm millions of dollars before it was shuttered last weekend.
The company announced the closure last Friday. It didn’t explain why Pudgy Party was shuttered, only that its web-based game, Pudgy World, is set to exceed Pudgy Party’s metrics.
“[Pudgy Party] being wholly ours, has everything we need to make it the flagship gaming product of the Pudgy Penguins universe,” the company said.
However, in a follow-up meeting with Pudgy Penguin NFT holders, Netz revealed the key numbers leading to Pudgy Party’s closure.
Read more: Web3 collapse accelerates as eight games fail this year
According to X user and Pudgy Penguin holder @ChefJames_, Netz claimed that the game had lost the firm millions of dollars and that if it were to continue, it would cost it another $2.5 million.
Netz added that the game experienced a few short months of popularity before its player count sharply dropped to somewhere between 200 and 300 active users.
Pudgy Party promised users more money than a minimum wage job
Pudgy Party was a third-person platformer that drew inspiration from reality show obstacle courses such as Total Wipeout, and was similar to the game Fall Guys, which itself saw player count highs of 172,026 on Steam.
Developed by Mythical Games and launched in August 2025, the game’s monetization system involved selling skins of the game’s penguin character, which buyers could trade.
Some of these listed skins were on offer for up to $100,000 despite possessing an actual value (floor price) of just 50 cents. During the game’s initial launch, some users were paying above $1,000 for skins, while others supposedly spent up to $5,000.
At one point, Netz claimed that the skin system would allow users to make more money than a minimum wage job if they just played the game full time.
Read more: Pudgy Penguins removes ‘racist’ post after Manchester City complaint
As for what will happen to the skins, @ChefJames_ noted that during the Pudgy Penguin meeting, Netz claimed that there will be a portal put in place for rewards and that skins purchased for Pudgy Party will be transferable to Pudgy World.
More Pudgy Penguin closures to come?
Things could get worse for Pudgy Penguins with the possibility of more closures and cutbacks to come. Indeed, Netz warned that across the coming two weeks, “All Band-Aids will be ripped.”
Some users speculated that Abstact, the blockchain co-founded by Netz, will be on the chopping block next, but not everyone agreed.
During the meeting, Netz also claimed that Pudgy Party didn’t match the brand’s DNA, which is pushing for a social game, aka Pudgy World.
Pudgy World was launched in March 2026 and is another attempt from the firm to create a web3 game. According to Netz, Pudgy World dwarfed Pudgy Party’s player count, with daily player counts up to 20,000.
This game appears inspired by the once popular web game Club Penguin and attempts to recreate the same social experience, albeit with a 3D third-person perspective.
Like Pudgy Party, it also features an ecosystem based around buying and selling cosmetics.


Read more: Pudgy Penguins bets $500K on Vegas Sphere — PENGU still down 85%
Web3 games have been struggling lately, with a growing number shutting down due to low player counts and insufficient revenues.
Among these is Uncharted, the developer behind crypto-based game Fishing Frenzy, which announced that the two were shutting down today.
Got a tip? Send us an email securely via Protos Leaks. For more informed news and investigations, follow us on X, Bluesky, and Google News, or subscribe to our YouTube channel.

Kalshi has deployed an artificial intelligence agent to help decide which prediction markets to launch as trading activity on the platform has climbed to more than $5 billion in a single week.
Summary
- Kalshi has deployed an AI agent called Harrison to help evaluate and recommend new prediction markets.
- FIFA World Cup betting activity helped push Kalshi’s weekly trading volume to a record $5.1 billion.
- The platform’s expansion comes as U.S. regulators and states continue to dispute oversight of prediction market contracts.
According to a Bloomberg report, the prediction market operator has introduced an internal AI system called Harrison to assist with several day-to-day functions tied to its exchange.
The tool is being used to review news developments, monitor competing platforms, recommend new contracts for listing, and identify where liquidity incentives may be most effective.
Bloomberg reported that Harrison forms part of Kalshi’s internal markets team and contributes to the process of evaluating potential contracts before they reach users.
Speaking to the publication, Kalshi co-founder Luana Lopes Lara said the company also employs an AI engineer whose work includes using AI systems to stress-test certification processes and identify possible weaknesses before markets go live.
The rollout comes as prediction markets continue to draw regulatory attention across the United States. State regulators have argued that some event contracts resemble traditional gambling products, while federally regulated exchanges maintain that they operate under commodities laws overseen by the Commodity Futures Trading Commission.
Sports contracts fuel record activity
Trading volumes have accelerated alongside growing interest in sports-related contracts. According to Bloomberg, demand tied to the FIFA World Cup helped push Kalshi to nearly $18 billion in notional trading volume during May, citing data from Dune Analytics.
The same report stated that Kalshi recorded approximately $5.1 billion in volume during the first week of the tournament this month, setting a new weekly high for the platform. Sports markets have become one of the exchange’s fastest-growing categories, joining election, economic, and entertainment contracts that already attract significant user activity.
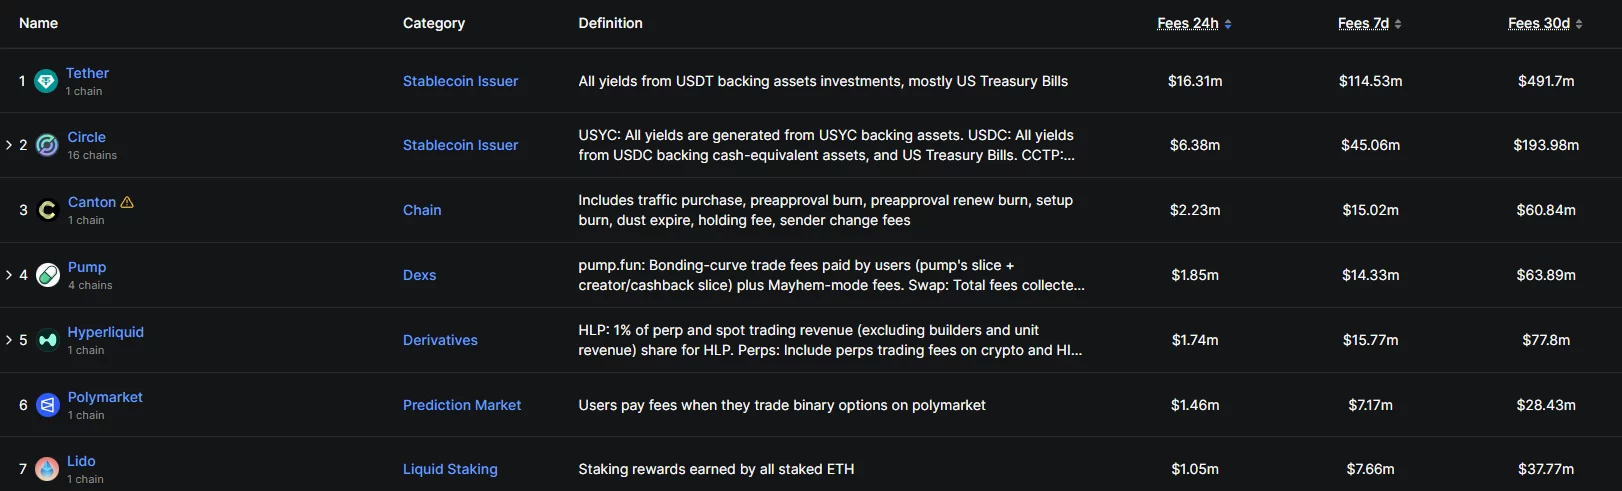
Elsewhere in the sector, sports wagering demand has also boosted activity on prediction market rival Polymarket. According to DefiLlama data, Polymarket generated around $1.46 million in fees over the last 24 hours and roughly $7.17 million during the previous seven days, placing it among the highest fee-generating crypto protocols during those periods.
Federal regulators challenge state enforcement efforts
At the same time, prediction markets remain at the center of an ongoing regulatory debate in the United States. As reported by crypto.news earlier, the CFTC has proposed new rules for prediction market platforms while also defending federally regulated exchanges against enforcement efforts by several states.
According to a lawsuit filed by the CFTC on Friday, the agency has sued New Mexico officials over efforts to apply state gaming laws to federally regulated prediction market exchanges. The regulator argued that event contracts listed on CFTC-registered exchanges fall under federal commodities law and therefore remain subject to its exclusive oversight.
The filing follows New Mexico’s June 4 lawsuit against Kalshi, in which state authorities alleged the platform was offering sports betting without a license and allowing users aged 18 to 20 to participate despite the state’s minimum gambling age of 21.

Paradigm has led a roughly $9 million funding round in El Dorado, a stablecoin-powered payments application built for Latin America. The deal pushes one of crypto's largest venture firms deeper into dollar-rails for emerging markets. The round was reported by The Block, which said Paradigm led the… Read the full story at The Defiant
Crypto World
Charles Hoskinson Stands On $70M BTC Payment From 2016 Manx Entity: Critics Want the Paper Trail

Cardano News: Charles Hoskinson is defending a 1,096 BTC allocation from Cardano’s early foundation structure, an amount worth roughly $454,000 when it was moved in March 2016 and approximately $70 million at current prices.
Hoskinson, speaking in a weekend video AMA focused on governance and treasury management, frames it as payment for a legitimate audit of the original ADA token crowdsale.
The asset appreciation is the problem: a plausible 2016 expense has become a $70 million line item with no public paper trail.
Thomas Braziel, Founder and Managing Partner of 117 Partners, is not accepting the narrative at face value.
BREAKING: Charles Hoskinson appears to disclose that Charles/IOHK received 54,000 BTC from the original Cardano ICO arrangements.
That's:
• ~50% of the entire 108,844 BTC raise
• ~$20-25 million at 2015-16 prices
• ~$3.6 BILLION at today's BTC price
While discussing the… pic.twitter.com/1dk7h8UIl2— Thomas Braziel (@Bkclaims) June 15, 2026
Braziel wants invoices, service agreements, corporate approvals, payment records, and a custody trail showing which entities held the private keys.
His position, stated plainly: “The question was never whether audits cost money. The question was where 1,096 BTC went, who received it, and why.” That gap between Hoskinson’s explanation and verifiable documentation is what’s driving the dispute – and it is becoming one of the most visible crypto governance disputes of 2026.
Discover: The Best Crypto to Diversify Your Portfolio
Cardano News: Hoskinson’s Audit Defense, Three Reviewers, One 2016 BTC Allocation
Hoskinson’s account is specific. He traces the 1,096 BTC to a March 2016 request from Michael Parsons, then-chairman of the Cardano Foundation’s early Isle of Man Foundation structure.
The allocation was meant to cover a comprehensive audit of the ADA crowdsale, a multi-jurisdiction fundraise that ran from October 2015 to January 2017 and raised the bulk of its capital from Japanese investors, totaling roughly 108,844.5 BTC across four rounds.
With Bitcoin closing around $414 on March 13, 2016, the 1,096 BTC translated to approximately $454,000, not an implausible figure for complex, multi-round international compliance work. Hoskinson says the bill was split among three named reviewers: Parsons, John Maguire, and Bruce Milligan.
The steelman version of his position holds: a $454,000 audit fee for a cross-border token sale with significant Japanese retail exposure is within the range of defensible professional fees for that era.
The problem is that 2016 reasonableness doesn’t close a 2026 evidentiary question. Hoskinson has provided a narrative. He has not yet provided documents.
Braziel’s Demands: What the Paper Trail Needs to Show
Braziel’s background matters here. He is a bankruptcy claims investor, someone professionally accustomed to tracing asset flows through dissolved entities and incomplete records.
He began investigating after the Isle of Man Foundation was formally dissolved in December 2025, a dissolution that eliminated one of the primary custodians of relevant historical records.
His demands are concrete: official invoices and service agreements from Parsons, Maguire, and Milligan; board-level approvals authorizing the payment; and on-chain or ledger evidence showing which wallets received the 1,096 BTC and when.
He also questions whether a $454,000 audit bill, paid entirely in Bitcoin, split three ways, aligns with standard corporate audit practice for that period, stating that “the numbers just don’t seem to add up.”
Braziel has been explicit that he is not alleging theft or fraud. This is framed strictly as a transparency and record-keeping inquiry.
That framing is worth taking at face value, but it doesn’t make the evidentiary gap smaller. Former employees have reportedly contacted Braziel privately, which is the detail that signals this isn’t purely an external observer pushing on a closed case.
Isle of Man Foundation, Cardano Governance, and Why the Dissolution Matters
The Isle of Man Foundation served as one of the original holding structures for early Cardano crowdsale proceeds. The Swiss-based Cardano Foundation received a separate tranche, roughly 7,168 BTC, while the Isle of Man entity held the portion that includes the contested 1,096 BTC.
The formal dissolution of the Isle of Man Foundation in December 2025 means the entity that would have been the primary record-keeper no longer exists as a legal structure.
“You can dissolve an Isle of Man foundation under corporate law, but you can’t dissolve blockchain history. The closure of the Manx entity creates a dangerous accountability vacuum regarding the 1,096 BTC,” explained Samuel Cooling, an Isle of Man-based financial journalist.
“As a jurisdiction, the Isle of Man prides itself on compliance and transparency; therefore, seeing a legacy structure wind down without a clear, public handover of historical records is highly unusual. The onus is now entirely on the Swiss Cardano Foundation to prove that this transition wasn’t a corporate rug pull on historical transparency”.
That’s an accountability gap regardless of whether the underlying payments were legitimate. Community members have argued that the Cardano Foundation, which succeeded the Isle of Man structure, now bears responsibility for producing whatever historical records survive.

This dispute is not occurring in isolation: Cardano has already navigated a separate controversy around a 318 million ADA transaction from 2021, which prompted an independent 128-page audit by McDermott Will & Emery and BDO that cleared Hoskinson of misappropriation.
That audit raised the baseline expectation for documentary evidence on historical fund movements.
Hoskinson’s criticism of governance discussions playing out on X is noted; his call for “effective conversation” in Discord and structured forums is reasonable in principle. But telling critics to move off X while declining to publish source documents doesn’t resolve the underlying question.
Discover: The Best Token Presales
The post Charles Hoskinson Stands On $70M BTC Payment From 2016 Manx Entity: Critics Want the Paper Trail appeared first on Cryptonews.
Crypto World
SpaceX IPO leaves retail investors with too few shares and a tough hold-or-sell decision

Billboards in Times Square celebrate the SpaceX IPO debut at the Nasdaq on June 12th, 2026.
Adam Jeffery | CNBC
Retail investors who clamored for shares in SpaceX‘s blockbuster initial public offering received only a fraction of what many had requested, and are already split on what to do with the stock.
Across online investing forums, users complained of allocations as small as a single share despite requesting far larger amounts. Those who did receive stock are taking different approaches, with some selling into the company’s market debut while others are holding for the long haul.
Marvin Jung, a 51-year-old investor who requested 1,000 shares through Robinhood and received just 17, opted to quickly sell his stake after trading began.
“I have exited my position of SpaceX stock at $160,” Jung said. “It’s struggling too much and can’t find its footing. I’ll continue to watch and return in about six months when the lockup period is over.”
SpaceX shares rose another 6% on Monday, extending gains after the company’s record-breaking Nasdaq debut. The stock surged 19% on Friday to close around $161, up from its IPO price of $135 a share, lifting the company’s market value above $2 trillion.

SpaceX since IPO
Ross Cameron, 41, founder of trading education platform Warrior Trading, also came away with far fewer shares than he sought. He initially requested 2,500 shares through Schwab before increasing the order to 4,250 shares ahead of the deadline. He ultimately received 147 shares at the IPO price of $135.
“I would’ve liked to have gotten more shares filled because it would’ve increased my total profit, but I understand the demand was very high,” Cameron said. “My plan is to hold the shares unless they break $150, and take profit if they get closer to $200 a share.”
Cameron is also cautious about the months ahead, expecting a wave of selling pressure once lockup restrictions expire and additional shares become available for trading.
“I still think that the next six months will create a wave of selling due to the lockup expiration period,” Cameron said. “I don’t think there will be enough buying to support the current prices when those shares come onto the market.”
Most subscribed offering
The demand was intense across brokerage platforms. SoFi Technologies said SpaceX was “the largest and most subscribed offering” on its platform to date, adding that all qualified investors who requested shares received an allocation. Even so, many retail investors reported receiving only a fraction of the stock they requested.
Fidelity was also able to allocate shares to all eligible customers who sought to participate in the IPO, according to a source familiar with the matter, though some clients received fewer shares than requested given the SpaceX IPO demand was high relative to the available supply.
Others are taking a longer-term view. Helaine Markham, co-owner of Markham Trading, received all two shares she requested in the IPO and intends to hold the stock.
Markham said she has not added to her position because she views SpaceX’s valuation as “aggressive” and expects additional volatility as lockup restrictions expire and more shares become available for trading. She plans to wait for further price discovery before potentially increasing her stake.
The mixed reactions highlight the challenge facing investors trying to value one of the market’s most closely watched companies. While some see SpaceX as a rare long-term opportunity tied to the growth of Starlink and commercial space exploration, others are wary of the company’s now $2 trillion valuation and are choosing to take profits early.
Symbolic one-share allocations
Justin Sacco, founder of Sacco Financial, received 11 shares through Charles Schwab after requesting 75. Rather than sell, Sacco added to his position after the stock started trading, purchasing four additional shares in the open market and bringing his total holdings to 15 shares.
“I was certainly hoping to receive more than 11 shares after requesting 75,” Sacco said. “At the same time, considering the unprecedented demand for the IPO, I wasn’t shocked by the outcome. The fact that I received a meaningful allocation at all felt like a win.”
Sacco said he plans to hold these shares long term even though he has grown concerned about the lofty valuation.
Sacco’s experience was relatively fortunate compared with some retail investors. On Reddit’s WallStreetBets forum, users posted screenshots showing allocations of just a single share despite requesting hundreds or even thousands. Others joked that the tiny allocations amounted to little more than a souvenir from one of the most anticipated IPOs in recent memory.
CNBC has reached out to Robinhood, ETrade, Schwab for comment on retail allocation.

Crypto World
Warren Buffett AI Agent (WarrenAI) Predicts Incredible Bitcoin Price by The End of 2026

The number that stands out from Warren AI Bitcoin price predicts is not $140,000 or even $200,000. It is $50,000 to $55,000, because that is the bear case floor, and the fact that it frames that level as resilience rather than disaster tells you everything about how it views Bitcoin’s current position in the market cycle.
With BTC at $66,500, the downside scenario is a 17% to 25% pullback. The upside scenario is a 2x to 3x. That asymmetry is the whole argument.
The bull thesis runs on 3 converging forces. The post-halving supply cycle is still playing out, institutional infrastructure keeps deepening with every ETF filing and corporate treasury allocation, and macro conditions that are currently a headwind eventually rotate back to favoring scarce hard assets.
Warren AI is not predicting when those catalysts converge; it is predicting that when they do, the market cap math gets interesting fast.
A $140,000 to $200,000 Bitcoin implies a $3T to $4T market cap, which sounds aggressive until you remember gold alone sits north of $20T.
The bear case earns its place too. Higher-for-longer rates, tighter regulation, and a wave of crypto deleveraging could all conspire to push BTC back into the $50,000 to $55,000 band.
But the word choice is deliberate, resilient floor, not breakdown, not capitulation. Even Warren AI’s pessimistic scenario is framed as a buying opportunity rather than a trend change.

Bitcoin Price Prediction: The Bounce That Could Change Everything
What makes this moment interesting on the chart is that BTC just did something it has not done convincingly in months. It bounced.
Price sits at $66,572 after printing a low near $60,000 earlier this month, and that recovery candle off the June low is the first real sign of demand stepping in at a structurally meaningful level.
The $60,000 to $62,000 zone has now been tested twice this year, held twice, and rejected sellers both times. That is not a coincidence; it is the market telling you where the buyers live.
The overhead picture is less comfortable. Every recovery attempt since the $126,000 peak has rolled over, and the $70,000 to $72,000 region is now loaded with trapped longs from the May selloff who will be looking to exit.
Getting through that supply pocket cleanly is the real test before any conversation about $80,000 or beyond becomes credible.
The RSI is the most compelling piece of this right now. It is reading 44.87 with the signal line way down at 27.16, a gap of nearly 18 points.
That is not a small divergence. RSI spent weeks pinned in the oversold basement while price ground lower, and now it has ripped back through its average with serious velocity.
That kind of momentum recovery, especially when it leads price rather than follows it, tends to precede sustained bounces rather than fakeouts.
It does not guarantee the $140,000 case plays out, but it strongly suggests the $60,000 low is more likely a launchpad than a waystation on the way to $50,000. Warren AI’s end-of-year target starts with surviving this zone, and right now, the chart says the bulls are doing exactly that.
You Might Like What Warren AI Predicts About LiquidChain
The money that wins cycles never announces where it is going.
Large caps are not broken. They are out of the room. Bitcoin, Ethereum, and XRP have been testing the same ceilings for weeks. Every macro catalyst has a new arrival date. Every institutional wave has a new quarter attached. Waiting on someone else’s decision is not a trade. It is a waiting room.
Capital that understands cycles moves before the destination has a name.
Small market cap infrastructure plays operate on physics large caps cannot replicate. A rotation that vanishes as noise at Bitcoin’s scale reprices an undiscovered project by multiples. The opportunity exists in the gap between what something is genuinely worth and what the market has assigned it. That gap closes permanently the moment discovery happens.
Multi-chain fragmentation has never been solved. Bitcoin, Ethereum, and Solana exist as completely isolated systems with no shared architecture and no native interoperability. Every time value crosses those boundaries it pays for that in fees, slippage, and failed transactions. Every single time.
Warren AI predicts LiquidChain makes that crossing free. All 3 networks inside one execution environment. Single deployment. Complete ecosystem access. No tax on any interaction.
The presale is at $0.01454 with just over $830,000 raised. Early and undiscovered.
Execution is unproven. Adoption is unknown. Established assets offer predictability toward a ceiling the market already sees. LiquidChain is an entry point that disappears once the market finds it.
Explore the LiquidChain Presale
The post Warren Buffett AI Agent (WarrenAI) Predicts Incredible Bitcoin Price by The End of 2026 appeared first on Cryptonews.
Bitcoin has staged a notable recovery over the past few days after a sharp correction drove the asset toward a major demand zone around $60K.
The rebound appears to have been fueled in part by improving macro sentiment following the preliminary peace agreement between the U.S. and Iran, which significantly reduced geopolitical uncertainty and boosted risk appetite across global markets.
The easing of tensions triggered a broad rally in risk assets while supporting Bitcoin’s recovery from recent lows.
Bitcoin Price Analysis: The Daily Chart
On the daily timeframe, BTC remains within a broader corrective structure despite the recent bounce from the $60K psychological support zone.
This area once again attracted substantial demand, producing a strong reaction and allowing buyers to regain some control in recent sessions. However, Bitcoin is now approaching its first significant resistance cluster around $65K-$67K, which previously acted as support before turning into supply following the breakdown.
The current rebound appears constructive, but the broader structure remains bearish in the short term. BTC continues to trade below the broken channel and beneath the major resistance region around $72K-$74K. As a result, the ongoing move could still be interpreted as a relief rally unless buyers manage to reclaim higher supply levels.
Should Bitcoin face rejection from the current $65K-$67K supply zone, another corrective move toward the $62K support area remains a realistic scenario. Conversely, a successful breakout above this region would expose the next resistance zone around $72K-$74K.
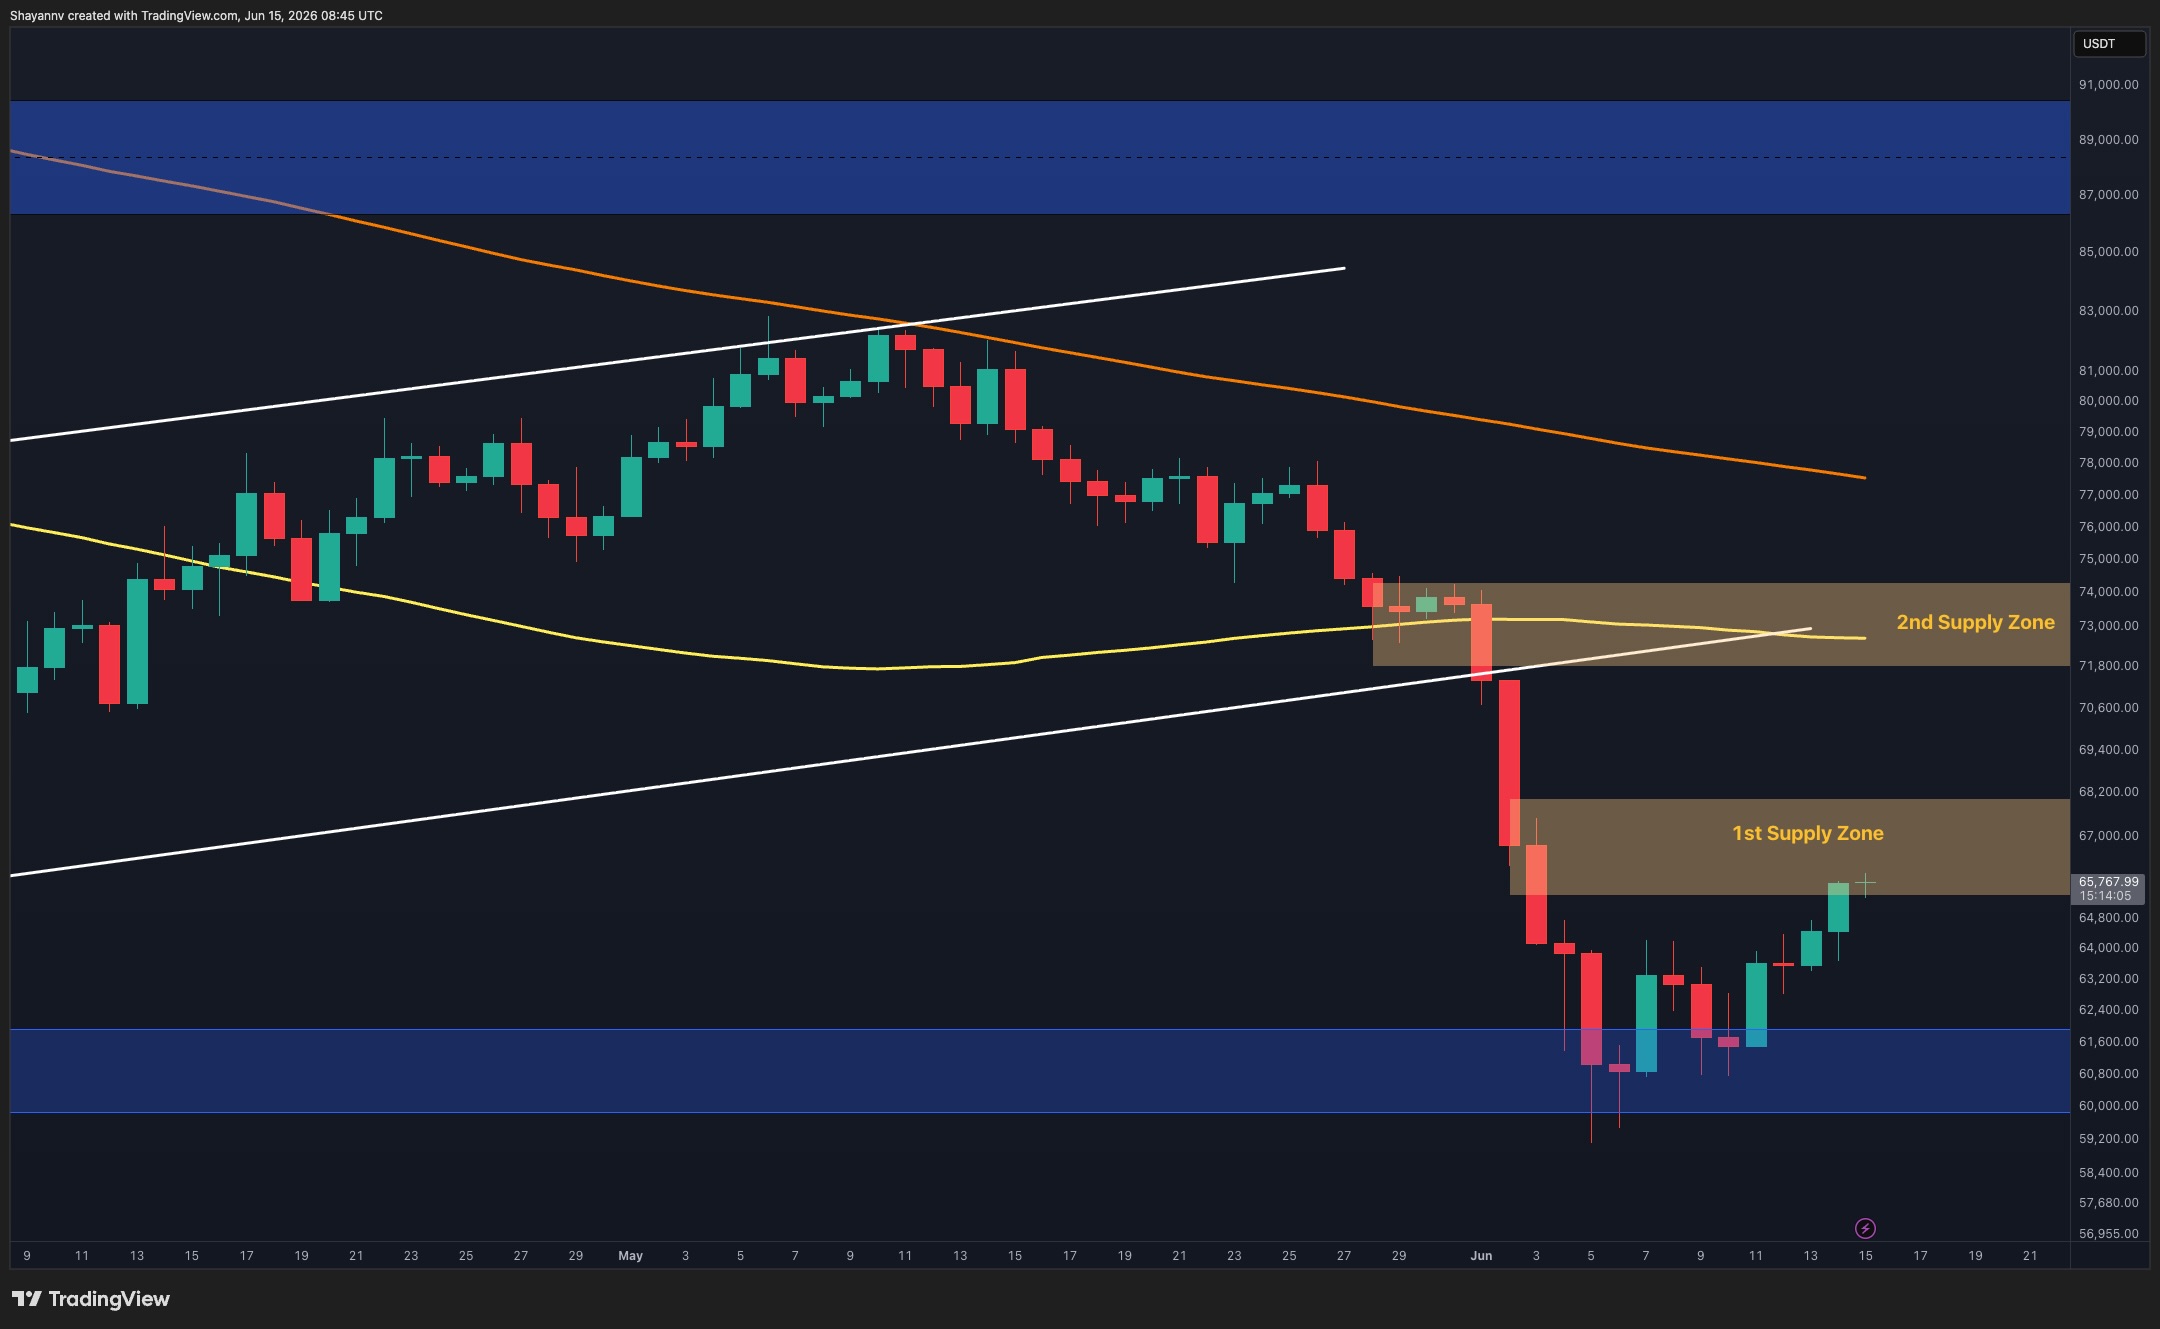
BTC/USDT 4-Hour Chart
The 4-hour chart reveals that Bitcoin has recovered steadily from the recent bottom near $60K, forming a rising wedge/flag pattern while climbing from the lower boundary of the demand zone.
The latest surge has pushed the asset directly into the first supply zone between roughly $65.5K and $68K. This area represents the most important short-term obstacle for bulls, as it coincides with a previous consolidation range that eventually triggered the sharp breakdown.
Although momentum has improved considerably following the geopolitical developments, the market is now testing a region where sellers may attempt to regain control. A rejection from the current supply zone could lead to a pullback toward the wedge support and potentially the $62K-$63K area.
If buyers manage to absorb the supply and establish acceptance above $68K, the probability of a deeper recovery toward the higher resistance cluster near $72K-$74K would increase significantly. Until then, the price remains vulnerable to short-term retracements after the recent impulsive move.

Onchain Analysis
The UTXO Age Bands Realized Price chart provides an interesting view of investor positioning during the recent correction.
Bitcoin is currently trading below the realized price of the 1M-3M holder cohort, which is positioned around $75K, while remaining above the realized price of the 18M-2Y cohort near $74K. These levels often act as important psychological zones because they represent the average acquisition cost of different groups of market participants.
The recent decline below the short-term holders’ cost basis suggests that many newer investors are currently holding unrealized losses, a condition that typically weighs on market sentiment during corrections.
The continued upward trend in both realized price cohorts also suggests that capital entered the market aggressively throughout the previous advance. While this does not eliminate the possibility of additional downside volatility, it supports the view that the current phase resembles a correction within a larger cycle rather than a complete trend reversal.
For now, on-chain data remains constructive, but from a technical perspective, Bitcoin is approaching a critical resistance area where the recent relief rally may face its first meaningful challenge. A temporary pullback from the $65K-$68K region would therefore not be surprising before the market attempts a larger recovery.

The post Bitcoin Price Analysis: Can BTC Extend Its Rally After Reclaiming $66K? appeared first on CryptoPotato.

World Cup 2026: Debutants Cape Verde hold European champions Spain to shock draw

Adani and Jabil plan to make AI data-centre gear in India

LISA – ‘MONEY’ (ft. BLACKPINK)


-

 Business1 day ago
No Jackpot Winner as $257 Million Prize Rolls Over to $269 Million Monday Draw
-

 Crypto World4 days ago
Oppenheimer backs SpaceX as $70 billion retail frenzy builds
-

 Crypto World4 days ago
Markets Rally as SpaceX IPO Looms Amid Iran Tensions and Inflation Surge
-

 Fashion3 days ago
Weekend Open Thread: Tuckernuck – Corporette.com
-
 Crypto World18 hours ago
Zimbabwe Requires Crypto Businesses to Register Annually Under New FIU Regulations
-

 Entertainment6 days ago
The Ryan Gosling True Crime Thriller On Netflix That Gets Even Stranger, Stream It Now
-
 Sports6 days ago
Bangladesh beat Australia after 20 years in ODIs, register only their second win over six-time world champions | Cricket News
-

 Tech3 days ago
NanoClaw integrates JFrog registries to secure AI agent downloads
-

 Tech3 days ago
This Week In Security: Microsoft On Microsoft, Register Your Domains, Linux On ARM, And FreeBSD Joins The File Cache Club
-

 Crypto World2 days ago
Bitget enters Argentina’s regulated crypto market through PSAV registration
-

 Politics4 days ago
Politics Home | Healey Resignation Is “Colossal Failure Of Government”, Says Former Labour Defence Secretary
-
 Tech4 days ago
Dutton Ranch star claims they ‘didn’t see any disruption’ on set following Chad Feehan’s exit from Yellowstone spinoff fueled by Taylor Sheridan clash rumors
-

 NewsBeat4 days ago
El Nino has formed in the Pacific and could set records, forecasters say
-
 Tech5 days ago
‘This is Seattle’s position on AI’: City Council votes unanimously to pause big new data centers
-
 Entertainment4 days ago
Donnie Wahlberg & More Heat Up Las Vegas at Circa’s Barry’s Downtown Prime
-

 Sports4 days ago
First Time Since 1971: Australia Register Historic Low In ODI Cricket
-
 Tech4 days ago
Opendoor Ends India Operations, Fueling a Bigger Conversation About AI and Outsourcing
-

 Politics4 days ago
Belfast burns, while Met chief points finger at Iran and Russia
-

 Business6 days ago
Thailand Ranks Second Worldwide for AI Adoption Growth, Microsoft Reports
-

 NewsBeat3 days ago
FBI searches office of Ohio voter registration group
You must be logged in to post a comment Login