
Crypto World
Fragile Optimism in Crypto as ETF Flows Return


Spot Bitcoin ETFs added $145 million, Ethereum saw $57 million inflows, signaling fragile optimism after a sharp crypto sell-off.
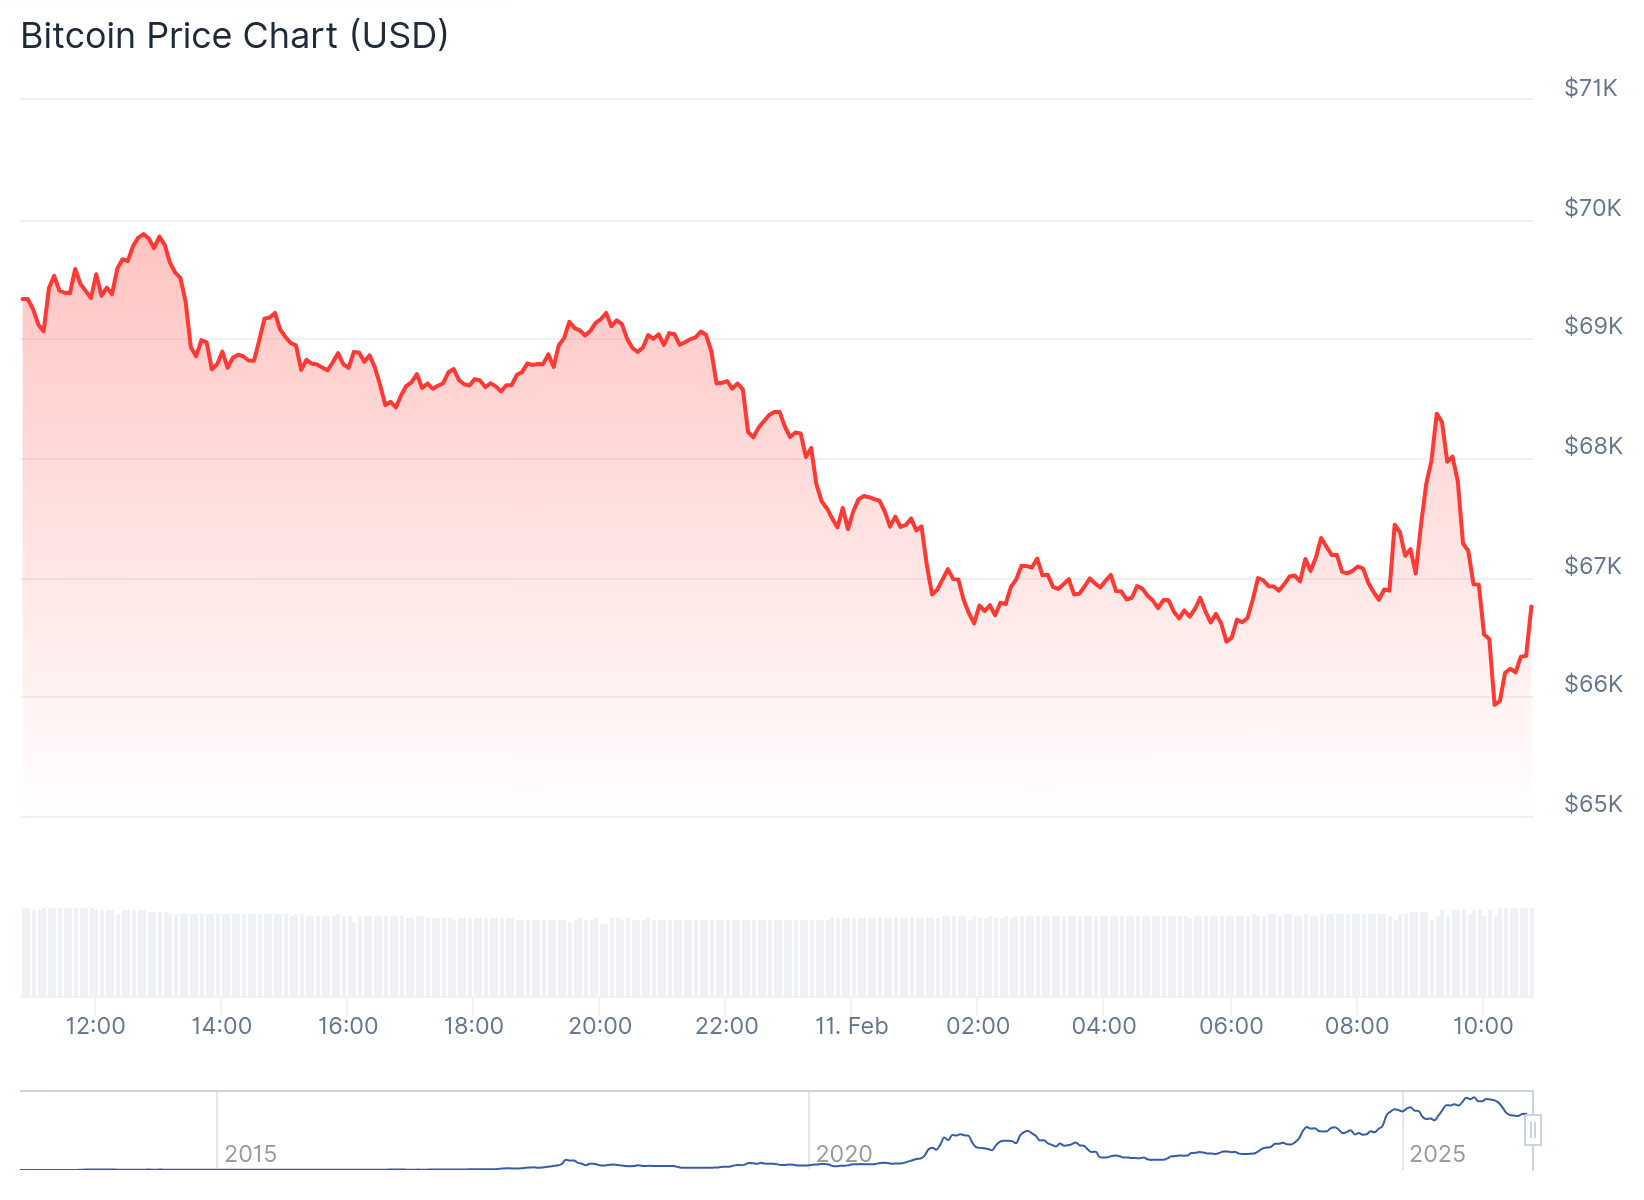
Even though they were trading at around $68,000 and $1,980, respectively, at the time of writing, Bitcoin and Ethereum bounced yesterday after sharp sell-offs, with BTC reaching $71,000 and ETH climbing to $2,150 following the resumption of spot ETF inflows.
The rebound renewed speculation that BTC may have established a local floor, but traders are also bracing for today’s Non-Farm Payroll (NFP) report and Friday’s Consumer Price Index (CPI) release, two data points that could reset Federal Reserve rate expectations and determine whether the rally holds.
ETF Flows Turn Positive, But On-Chain Data Signals Volatility Ahead
In its latest market update, digital asset trading firm QCP noted that spot Bitcoin ETFs recorded $145 million in net inflows yesterday, building on Friday’s $371 million. Spot ETH ETFs also reversed course with $57 million in net inflows after three days of red.
The shift follows a period of intense selling pressure that recently drove BTC to around $60,000, its lowest level since before the November 2024 U.S. elections.
Despite the inflows, on-chain data suggests market participants are preparing for continued turbulence. For example, CryptoQuant contributor CryptoOnchain reported that on February 6, over 7,000 BTC moved from Binance to other spot exchanges, making it the second-highest daily volume in the past year.
At the same time, the seven-day moving average of flows from Binance to derivative exchanges spiked to 3,200 BTC, the highest level since January 2024. The analyst interpreted the migration of funds to derivative platforms as a sign that large holders are either hedging downside risk or positioning for sharp price swings.
Meanwhile, QCP market watchers revealed that the Coinbase BTC discount has narrowed from approximately 20 basis points to 9 basis points, signaling a moderation in U.S.-led selling. But the Crypto Fear & Greed Index remains at 9, deep in “extreme fear” territory, with the trading firm describing conditions as “thin ice that happens to be holding.”
You may also like:
Historical Context and On-Chain Trends
Bitcoin’s correction has drawn the broader market lower, with the OG cryptocurrency dipping below $67,000 and altcoins such as ETH, XRP, and BNB losing significant ground. The total crypto market capitalization has fallen to $2.36 trillion, shedding over $50 billion in daily value. Still, not all assets have mirrored this decline, as the likes of XMR gained 3%, while ZRO entered the top 100 following a 20% surge.
Unlike previous cycles, this downturn has avoided major systemic failures. Chainlink co-founder Sergey Nazarov pointed out on February 10 that real-world assets (RWAs) on the blockchain are expanding despite price volatility, with institutional interest sustained by technological advantages and 24/7 markets.
While the market looks for big economic changes, the increase in ETF investments provides some hope, but QCP warns that past price changes and how derivatives are set up mean traders should be careful and manage risks wisely.
SECRET PARTNERSHIP BONUS for CryptoPotato readers: Use this link to register and unlock $1,500 in exclusive BingX Exchange rewards (limited time offer).


Paxful Holdings, which pleaded guilty last year to accusations from U.S. authorities that it had fostered illegal prostitution, violated money-laundering laws and knowingly handled criminal proceeds, was sentenced to pay a $4 million penalty, much reduced because of the business’ current ability to pay.
The peer-to-peer bitcoin marketplace that had been popular in Africa shut down in 2023, but Paxful had processed as much as $3 billion in crypto trades from 2017 to 2019, according to U.S. authorities, including transactions for customer Backpage, an advertising platform for illicit sex work.
“This sentence sends a clear message: companies that turn a blind eye to criminal activity on their platforms will face serious consequences under U.S. law,” said U.S. Attorney Eric Grant for the Eastern District of California, in a statement.
On the Paxful platform, customers negotiated trades of digital assets for other items, such as cash, prepaid cards and gift cards. The founders were said to have marketed the site as a way around the Bank Secrecy Act’s anti-money-laundering constraints.
Prosecutors originally contemplated a penalty of more than $112 million, but the firm was determined to be able to pay no more than $4 million.
Read More: Paxful’s Fall: Questions in the Peer-to-Peer Bitcoin Exchange’s Demise
The current Cardano price is revisiting a critical multi-year support zone amid extreme oversold conditions, placing it at a key inflection point for a potential macro reversal.
Summary
- Four-year historical support is being tested, a level that has held since 2022
- Value area low adds strong confluence, reinforcing demand at current prices
- Weekly RSI is deeply oversold, signaling potential momentum exhaustion
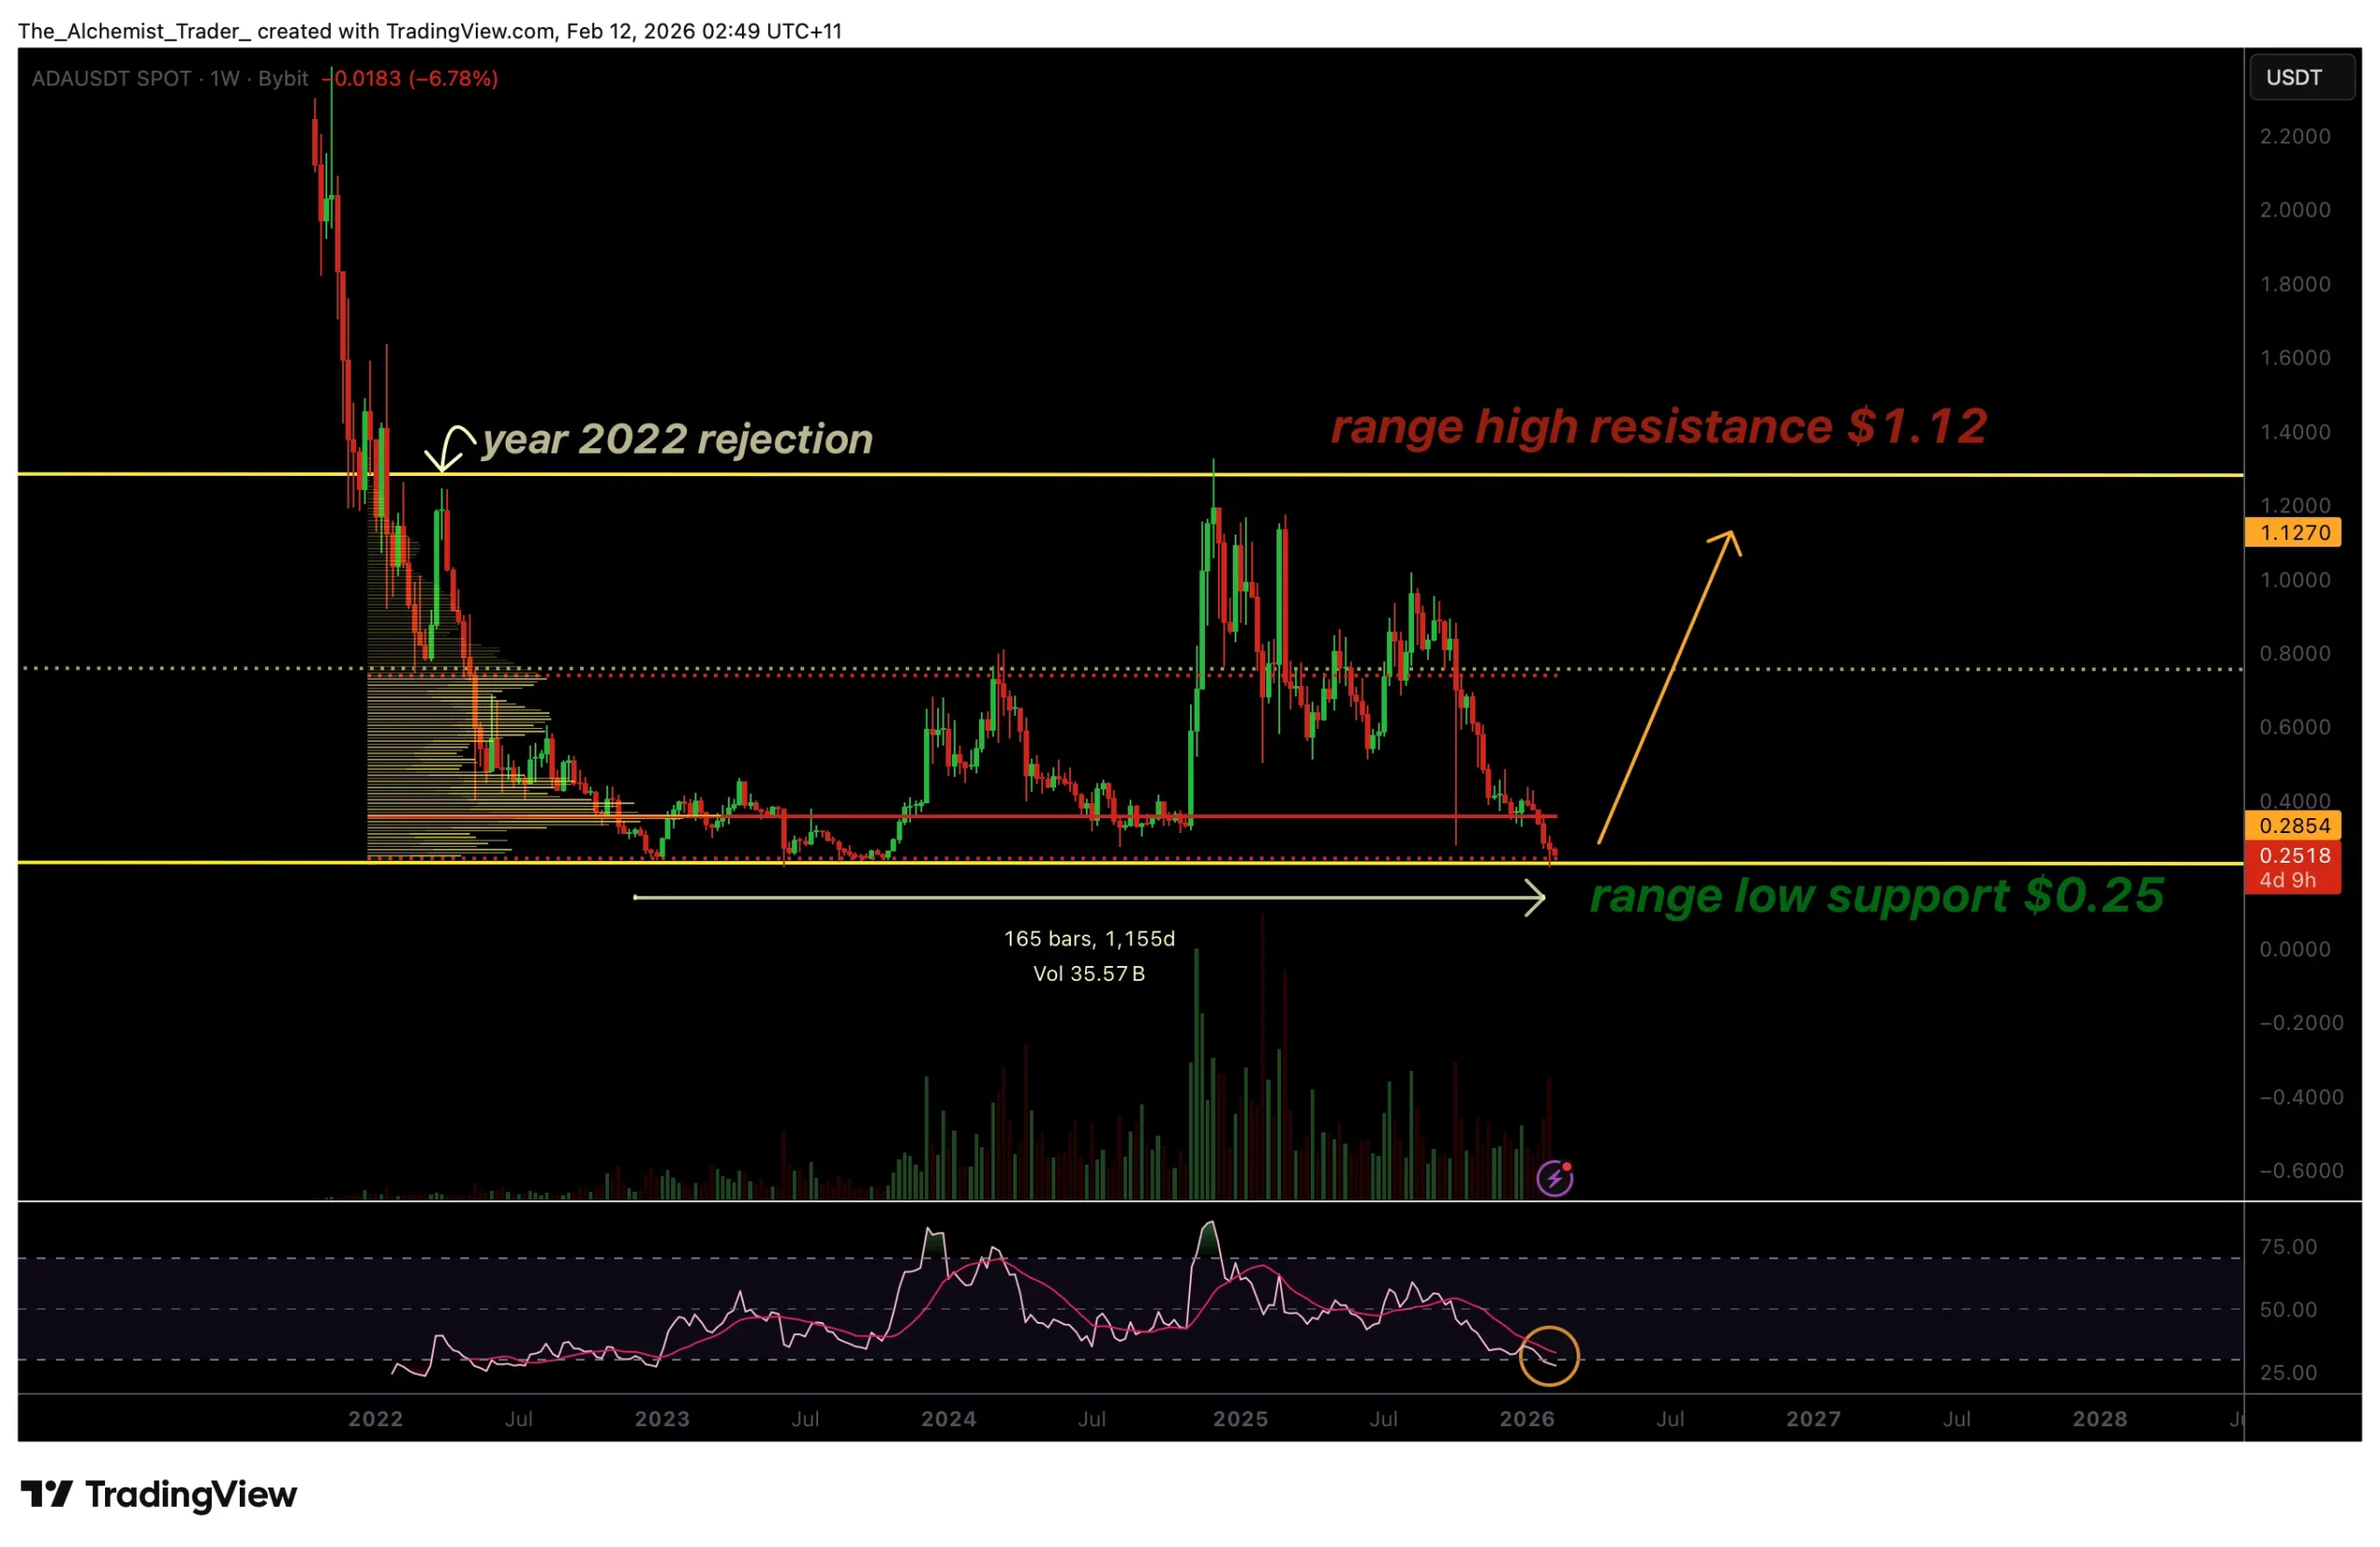
Cardano (ADA) price action has returned to one of the most important technical levels on its chart, revisiting a historical support zone that has remained intact for more than four years.
As broader market weakness persists, ADA has rotated back toward a long-term range low that has consistently acted as a floor during previous market cycles.
This retest comes at a time when momentum indicators are flashing extreme oversold conditions, increasing the probability that a meaningful reaction could develop from this region.
While short-term sentiment remains cautious, the larger technical picture suggests Cardano may be approaching a make-or-break level that could define its next major directional move.
Cardano key technical points
- Four-year macro support is being retested, dating back to 2022
- Value area low aligns with current price, reinforcing structural support
- Weekly RSI is deeply oversold, signaling potential momentum reversal

Cardano’s current position on the chart holds significant historical significance. In 2022, price rejected sharply from the range high and rotated lower toward the $0.25 region, establishing a major range low. Since that initial retest, ADA has consistently held above this support on every subsequent pullback, confirming its relevance as a long-term demand zone.
The fact that price has once again returned to this level suggests the market is testing whether buyers remain willing to defend value at historically attractive prices. As long as this support holds on a closing basis, the broader range structure remains intact.
Value area low adds technical confluence
Adding to the importance of the current zone is the value area low, which is located in the same region as the multi-year support. The value area low often represents the lower boundary of fair value within a trading range, and frequently acts as a magnet during corrective moves.
When price revisits this area after extended downside pressure, it often signals that the market is searching for equilibrium. The convergence of long-term support and value-area lows significantly increases the likelihood of a reaction, especially if selling momentum begins to slow.
Extreme oversold RSI signals momentum exhaustion
One of the strongest technical signals currently supporting a potential reversal thesis is the relative strength index (RSI) on the weekly timeframe. The RSI has dropped into extreme oversold territory, a condition that has historically preceded strong counter-trend moves in Cardano.
Oversold readings on higher timeframes do not guarantee immediate reversals, but they often indicate that downside momentum is becoming exhausted. When combined with major structural support, these conditions increase the likelihood of a sharp, impulsive reaction when buyers step back in.
If a reversal does occur from this zone, the RSI is likely to shift aggressively higher, reflecting a change in momentum rather than a slow grind upward.
Upside rotation toward range highs
From a market-structure perspective, maintaining this four-year support keeps Cardano within its broader trading range. A successful defense at this level would increase the likelihood of a rotational move back toward higher targets, including a revisit to the range high over time.
Such rotations often begin with powerful relief rallies, especially when initiated from deeply oversold conditions. However, confirmation will be required through sustained bullish closes and expanding volume before a broader trend shift can be validated.
What to expect in the coming price action
From a technical, price-action, and market-structure perspective, Cardano is positioned at a critical historical inflection point. Continued acceptance above the four-year support zone would favor a bullish rotation scenario, supported by oversold momentum conditions.
Conversely, a decisive breakdown below this level would invalidate the long-term range thesis and expose ADA to deeper downside risk. For now, the technical evidence suggests that Cardano is at a level where meaningful buyers may begin to re-enter the market.
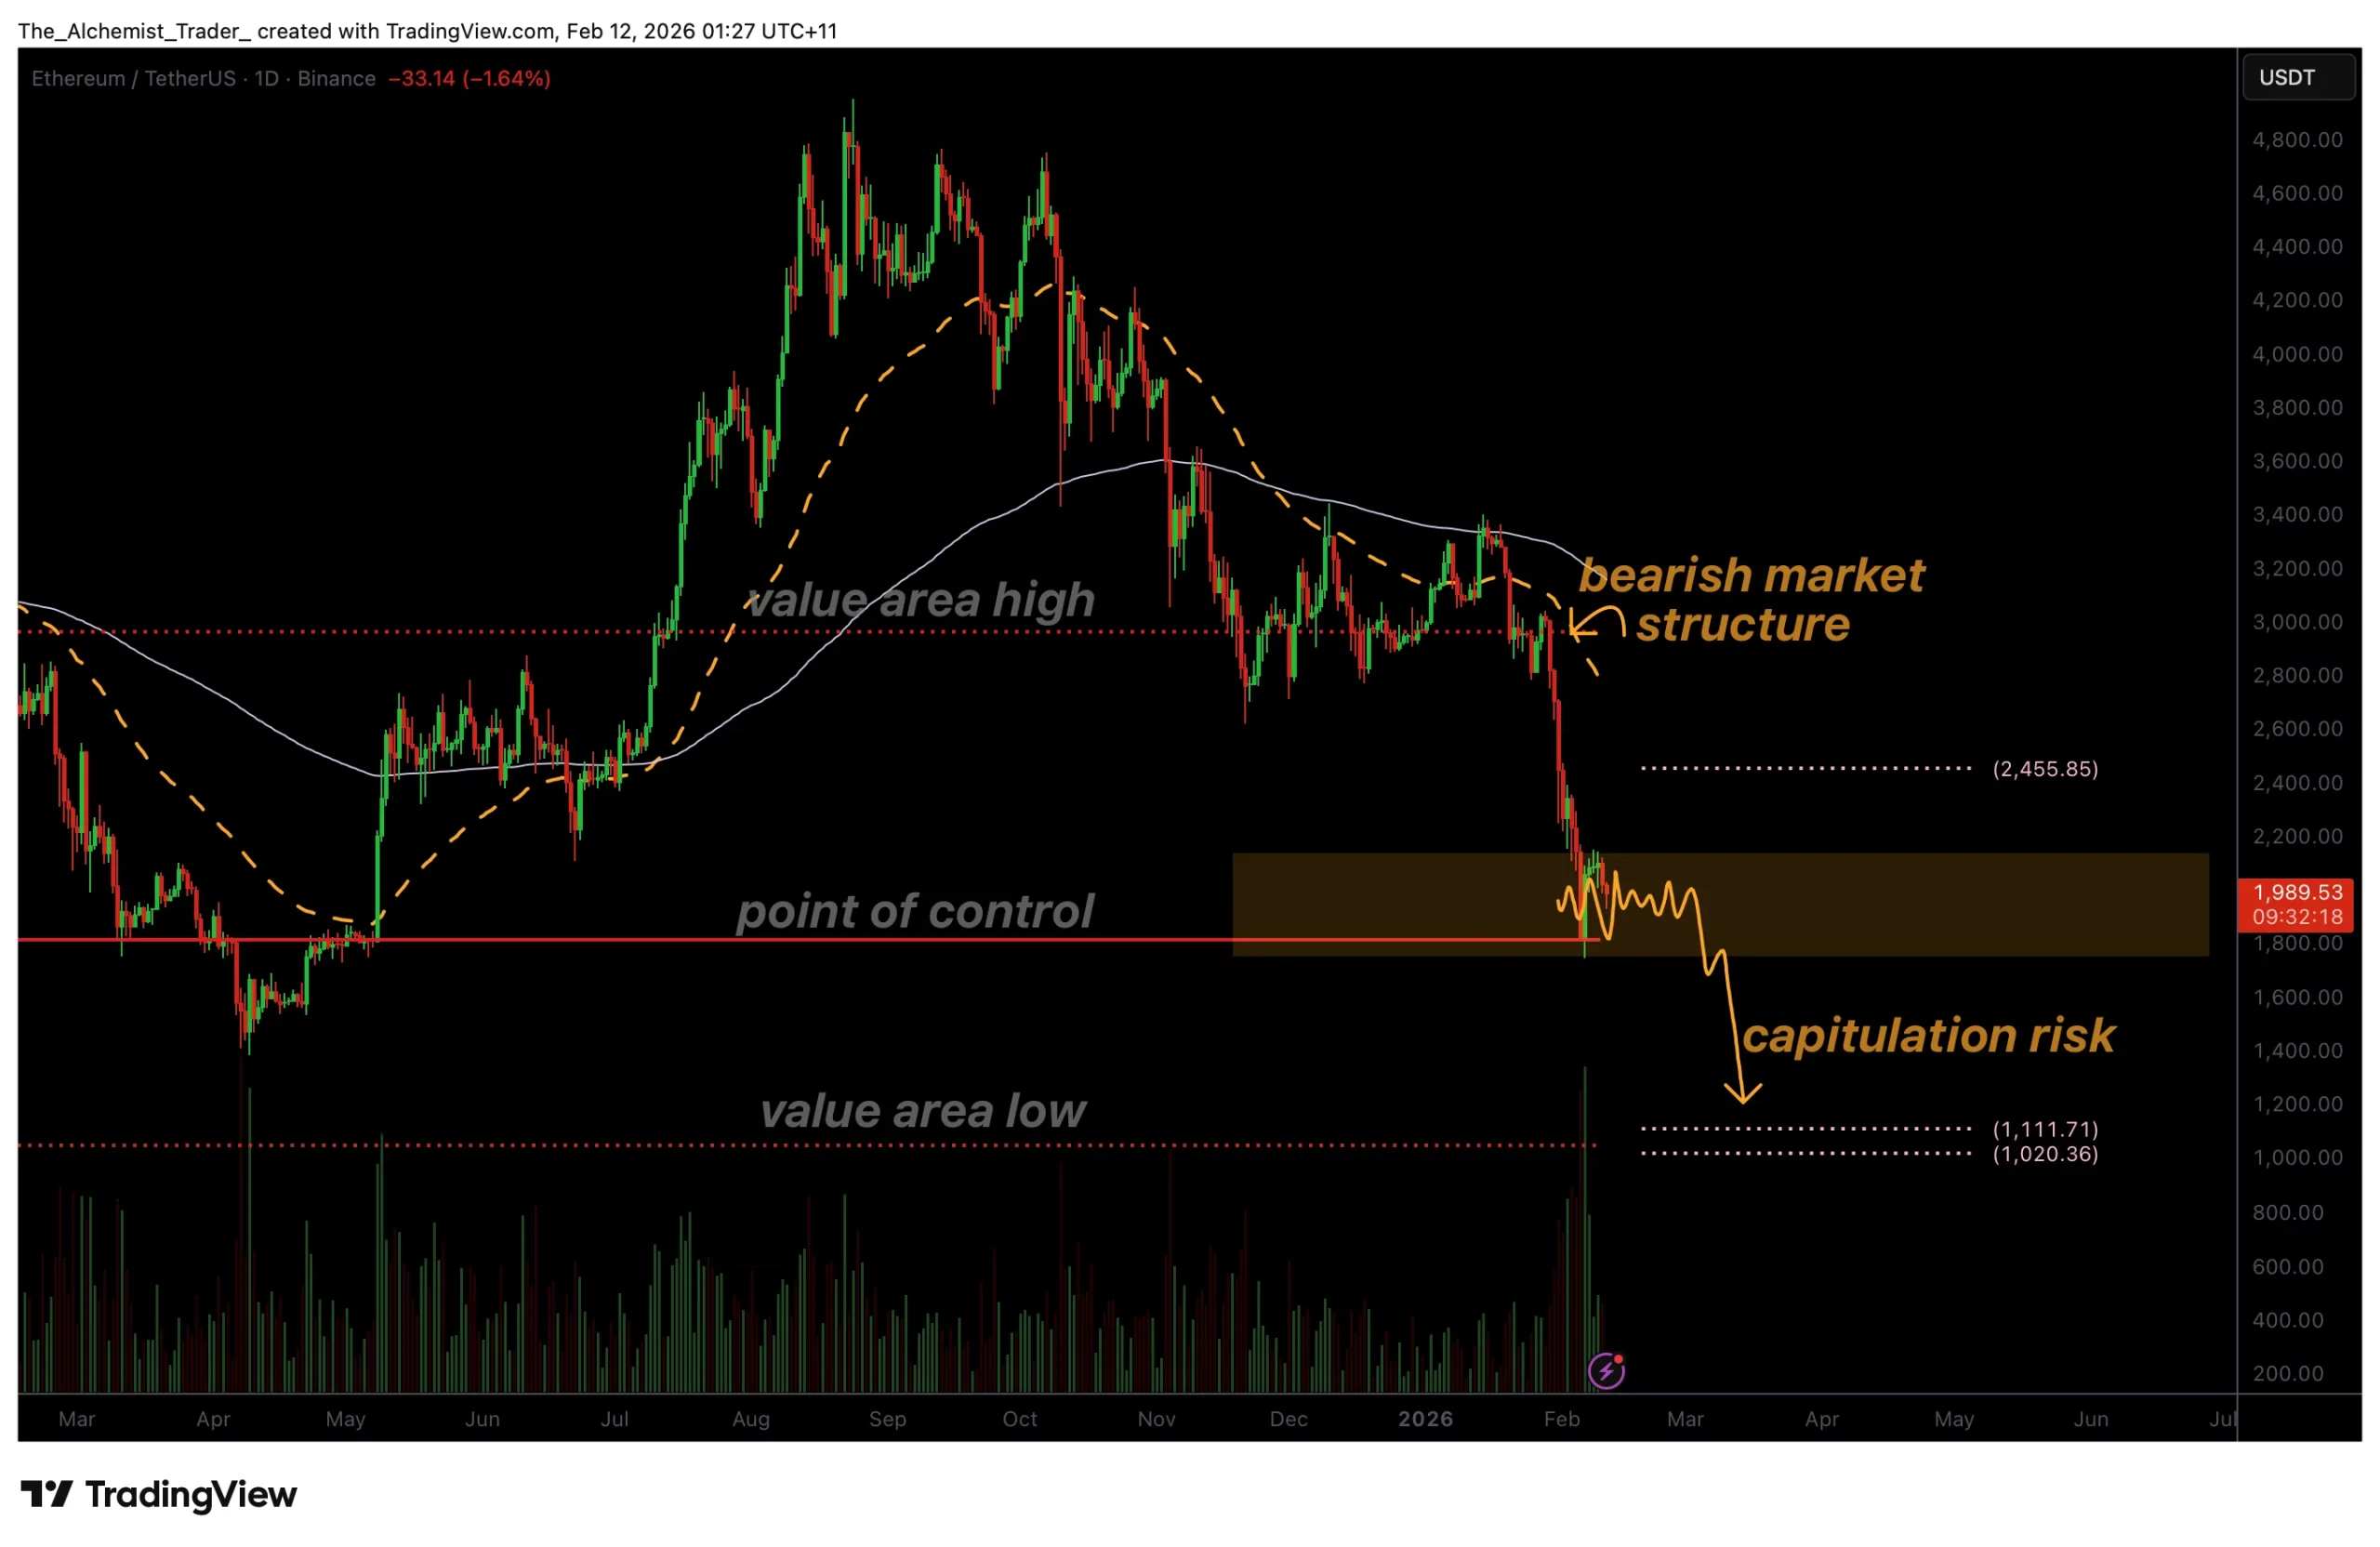
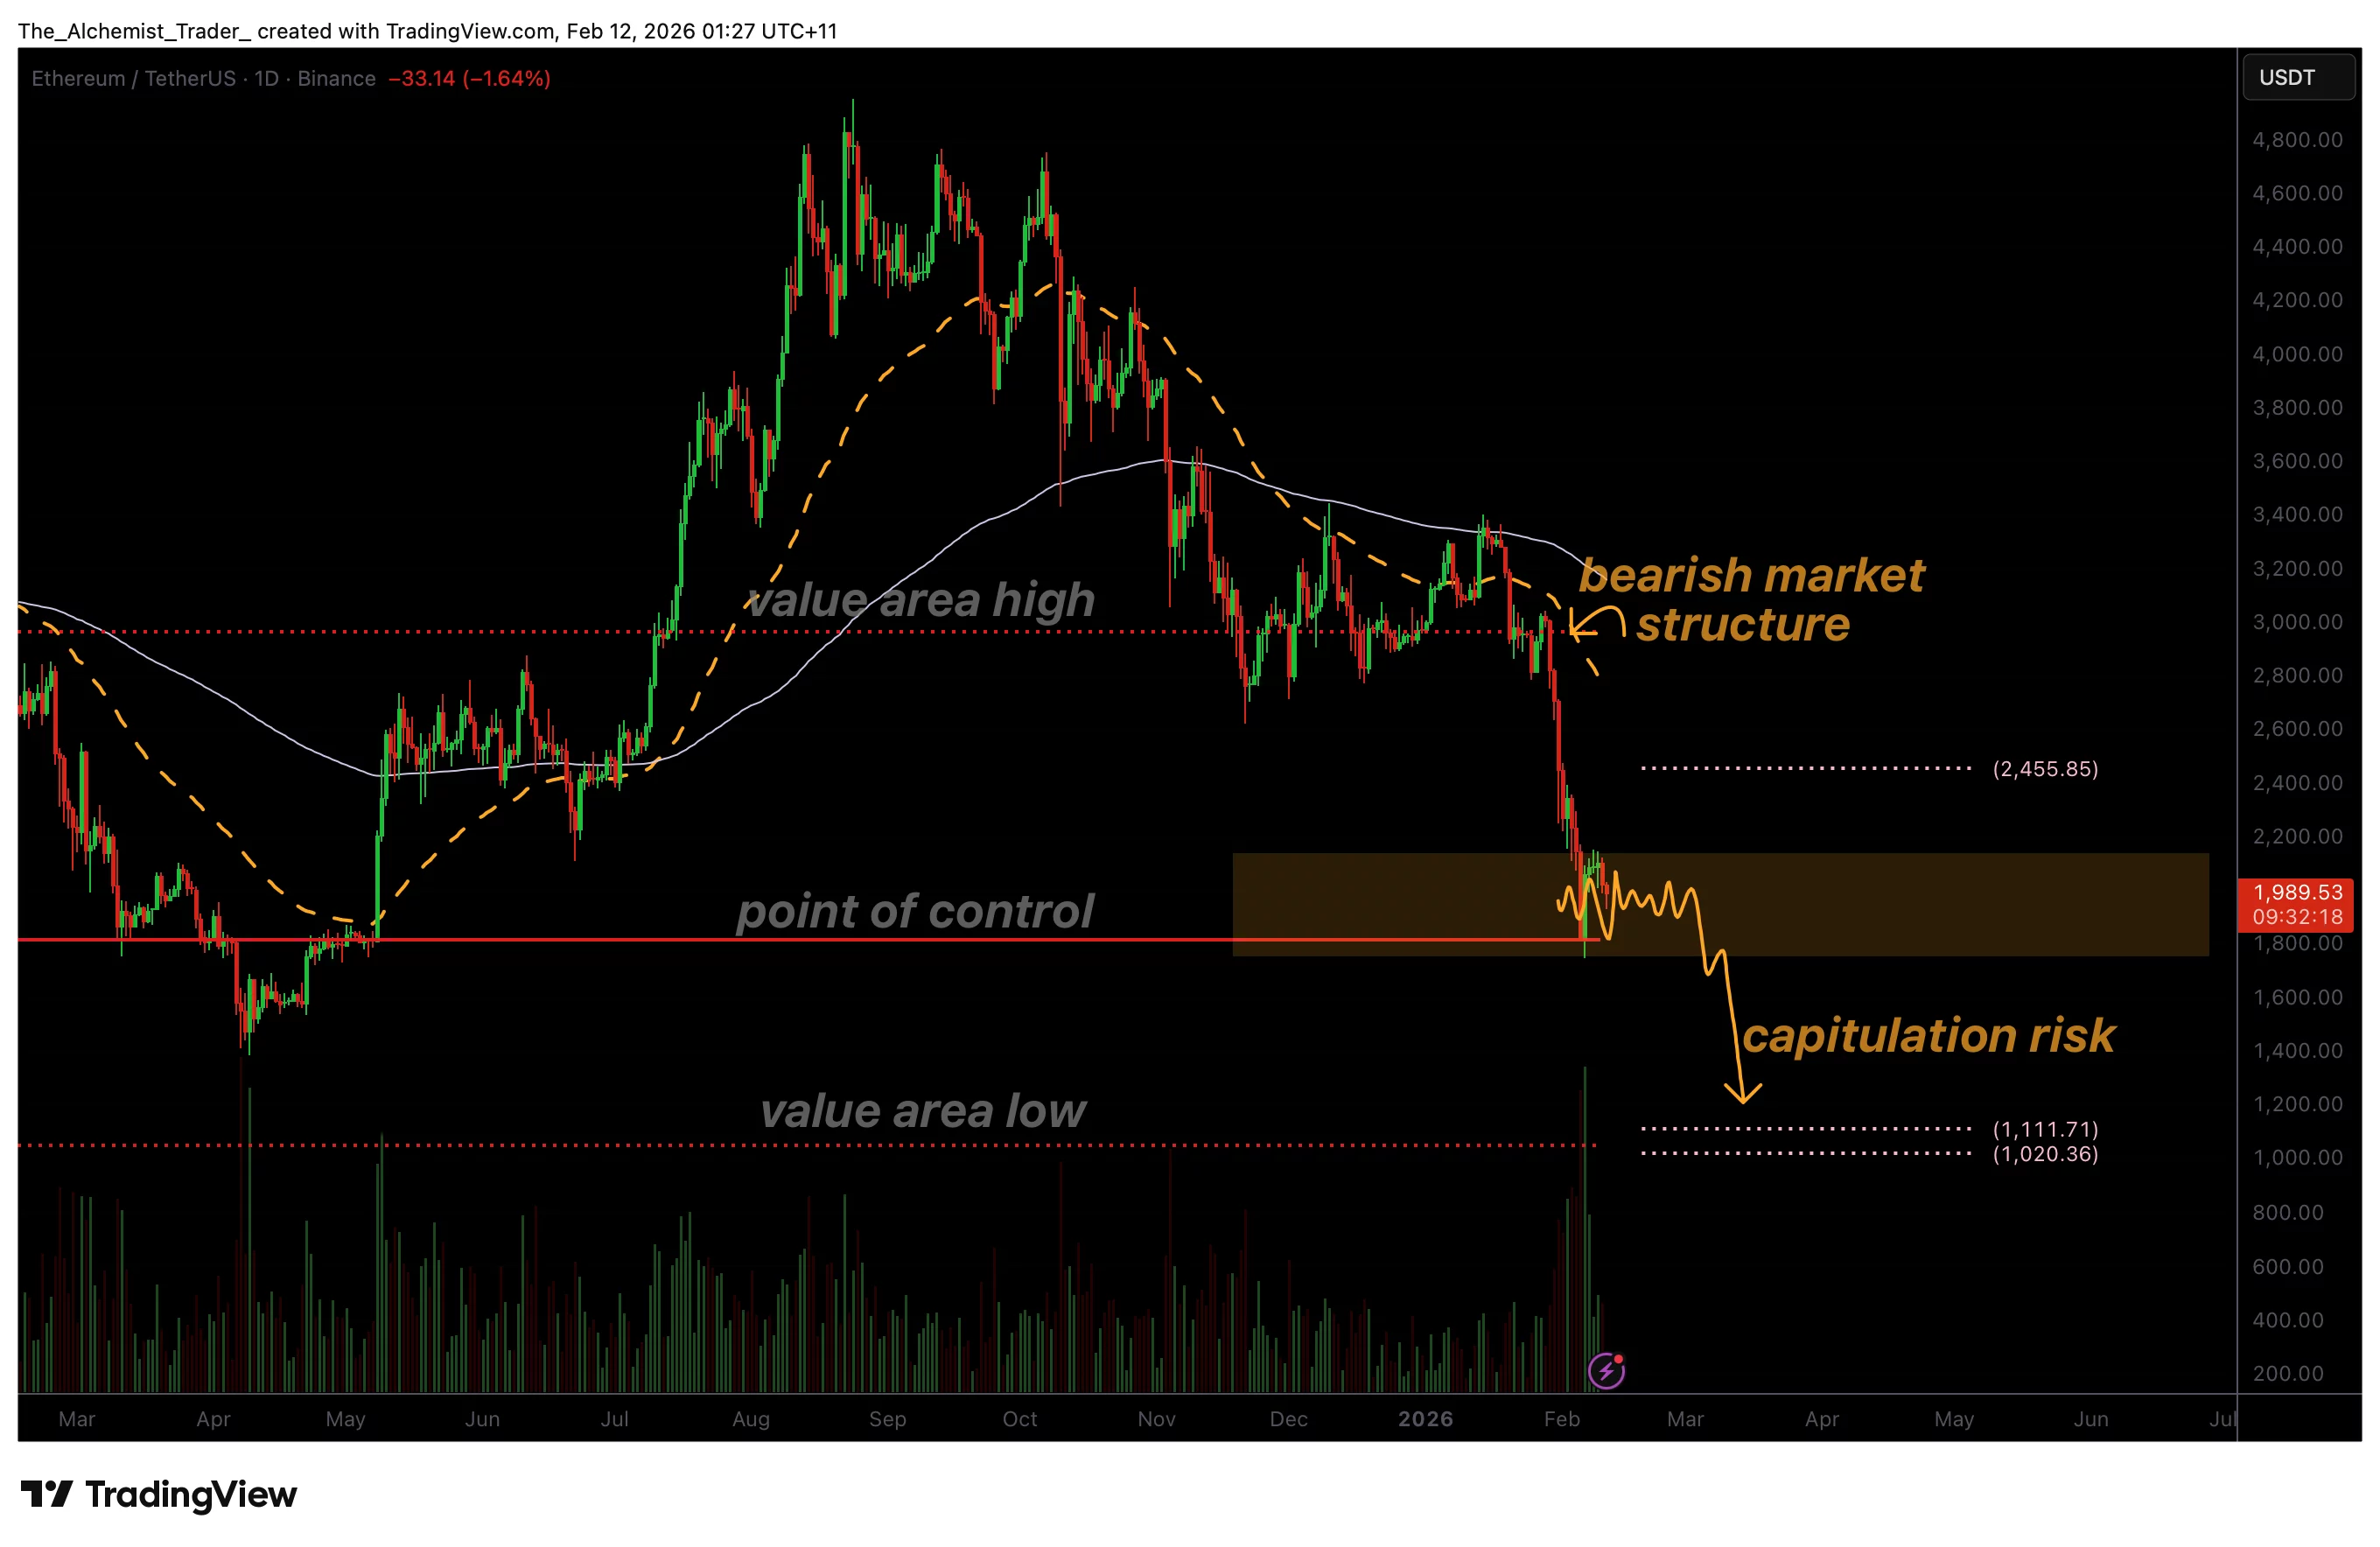
Ethereum’s price is consolidating at a critical high-volume support near $1,800, but fading bullish participation raises the risk of a deeper corrective move and potential capitulation to the downside.
Summary
- $1,800 point of control is weakening, increasing downside vulnerability
- Sideways price action lacks bullish volume, signaling distribution risk
- Loss of support could trigger capitulation, toward the value area low
Ethereum (ETH) price action is approaching a pivotal moment as it continues to trade around a major support zone defined by the point of control (POC) near $1,800. This level represents the area of highest traded volume in the current range and has acted as temporary support following the recent sell-off. However, despite holding this zone for several sessions, Ethereum has failed to produce a convincing bullish continuation on the daily timeframe.
As consolidation drags on and volume weakens, concerns are growing that this pause may not represent accumulation, but rather distribution before another leg lower. If Ethereum fails to defend this high-volume support on a closing basis, the probability of a capitulation-style move increases.
Ethereum price key technical points
- Point of control near $1,800 is under pressure, acting as the last major high-volume support
- Daily consolidation shows weak follow-through, signaling fragile demand
- Loss of support opens downside toward the value area low, aligned with Fibonacci extension targets
Ethereum’s current behavior around $1,800 is technically significant. While price has not yet broken down, the lack of upward follow-through following the initial bounce is a warning sign. In strong reversals, consolidation at support is typically accompanied by expanding bullish volume and higher daily closes. Instead, Ethereum has spent multiple sessions moving sideways, suggesting that buyers are struggling to regain control.
This type of price action often precedes continuation moves rather than reversals. When markets consolidate at high-volume nodes without renewed demand, the likelihood increases that support will eventually give way as sellers absorb remaining bids.
Volume profile highlights lack of bullish commitment
From a volume profile perspective, Ethereum’s current bounce lacks conviction. Bullish volume has steadily declined since price first reacted from the $1,800 region, indicating that buying interest is not strong enough to sustain a meaningful recovery. This imbalance between price stabilization and falling volume often points to exhaustion rather than strength.
As a result, the current structure resembles a pause within a broader corrective trend rather than a base for reversal. Without a clear volume expansion, Ethereum remains vulnerable to renewed selling pressure.
Capitulation risk grows below the point of control
The point of control often acts as a stabilizing force during consolidation phases. However, once the price loses the POC on a daily closing basis, it typically signals a shift from balance into imbalance. In Ethereum’s case, such a move would likely trigger an acceleration lower as price seeks the next major area of acceptance.
Below the current range, the next key target sits at the value area low, which aligns with the 1.618 Fibonacci extension of the current downside move. This zone represents a classic capitulation target, where emotional selling and liquidity sweeps often occur before markets attempt to form durable bottoms.
A move into this region would not necessarily imply long-term bearish continuation. Instead, it could represent the final stage of the current corrective cycle, flushing weak positioning and resetting market structure.
What to expect in the coming price action
From a technical, price-action, and market-structure perspective, Ethereum is at a make-or-break level. Continued consolidation without bullish expansion increases the probability that the $1,800 support will eventually fail. A confirmed daily close below the point of control would significantly raise the risk of a capitulation move toward the value area low.
For the bearish scenario to be invalidated, Ethereum would need to reclaim higher value levels with strong volume and demonstrate sustained acceptance above current resistance. Until that occurs, downside risk remains elevated.
Crypto World
$5 Million Mega Giveaway: Is Zero Knowledge Proof the Best Crypto to Buy Today vs. Solana & Tron?

The crypto world in early 2026 is feeling the heat! While veteran networks like Tron and Solana keep the global economy moving, the search for the best crypto to buy today is leading many to fresh protocols with huge rewards. With the market currently stuck in “Extreme Fear” (the index just hit a low of 14), investors are trading risky bets for projects that offer real value.
Right now, everyone is comparing the rock-solid Tron (TRX) price and the high-speed Solana price prediction models against the exciting ZKP crypto. What’s really turning heads? Zero Knowledge proof’s massive $5 million USD giveaway. It’s a huge draw for people looking to beat market gloom with some serious community prizes.
The Tron (TRX) Price: A Steady Workhorse in a Wild Market
TRON has found its sweet spot as the “reliable engine” of the digital world. It doesn’t care about hype; it cares about moving money fast and cheap. Because it’s the go-to layer for stablecoin transfers and retail payments, people actually use it every day. This is why the Tron (TRX) price is looking so tough right now, holding steady around $0.28 even while other “riskier” coins are taking a hit.

Looking forward to late 2026, things are looking bright for TRX. If TRON keeps its crown as the stablecoin king, experts think it could climb to between $0.40 and $0.60. Of course, it’ll need to keep its transaction numbers high and stay on the right side of new rules. Even with the market’s “Extreme Fear” (the index actually bottomed out at 17 recently), TRX stands out as a safe harbor in a very stormy sea.
Solana Price Prediction: Can High Performance Beat Market Fear?
Solana (SOL) is currently in a tug-of-war. On one hand, the network is on fire—hitting a record 150 million transactions a day! On the other, big investors have cooled off, making the coin extra sensitive to the market’s current “Extreme Fear” (Index: 14). This has cast a bit of a shadow over the short-term Solana price prediction. If the $100 psychological floor breaks, technical signals suggest we could see a slide down to the $85 support level.

But don’t count SOL out! Big banks like Standard Chartered are still dreaming big, setting an end-of-2026 target of $250. They see this current dip as a healthy move away from “meme coins” toward becoming the backbone of global micropayments. While the road might be bumpy right now due to sell-offs, Solana’s sheer speed continues to win over real users, setting the stage for a massive comeback by late 2026.
$5 Million USD Giveaway: ZKP’s Massive Reward is Live!
If you’re hunting for the best crypto to buy today, you’re probably looking for a project that gives back. Zero Knowledge Proof (ZKP) is doing just that with a giant $5 million USD giveaway. This isn’t just a small token airdrop; they are picking 10 lucky winners to take home $500,000 in ZKP coins each!
Getting in is easy:
- Hold at least $100 in ZKP tokens.
- Follow their official social media pages.
- Share the giveaway post.
The real secret? The referral system. The more friends you bring in, the more entries you get. It’s a limited-time chance to stack your odds before the crowd catches on.
Meanwhile, the ZKP Presale is moving fast! We are currently in Stage 2, Round 3, with the daily supply capped at 190M tokens. Over $1.83M has already been raised, so the clock is ticking.

Yesterday’s price was just 0.00006 USD, and here’s the kicker: any tokens not sold are burned forever. With the supply dropping to 180M in the next stage, ZKP is proving to be a serious, utility-first alternative to the usual market noise.
Final Thoughts
Early 2026 is a test of nerves for every trader. Whether you’re leaning on the Tron (TRX) price for its stability or studying the Solana price prediction for a long-term win, one thing is obvious: real infrastructure wins.
At the same time, projects like ZKP show that the right incentives can reward those who move early, even when the rest of the market is scared. When looking for the best crypto to buy today, the smartest move is a mix—respecting the reliable old guard while making room for the high-potential new players.

Explore ZKP:
Website: https://zkp.com/
Buy: buy.zkp.com
Telegram: https://t.me/ZKPofficial
Disclaimer: This is a Press Release provided by a third party who is responsible for the content. Please conduct your own research before taking any action based on the content.

Coinbase stock price retreated by over 5% on Wednesday as traders and investors remained pessimistic about its business ahead of its fourth-quarter earnings report.
Summary
- Coinbase share price is stuck in a bear market after falling from $445 in 2025 to $153.
- The company will publish its fourth-quarter financial results on Wednesday.
- Robinhood’s crypto revenue slumped 38%, and Coinbase’s figure dropped as well.
Wall Street pros are turning bearish on Coinbase
Coinbase, the biggest crypto exchange in the U.S., dropped to $154, down sharply from its 2025 high of $445. This crash has erased billions of dollars in value, with the valuation dropping from close to $100 billion to $41 billion.
The stock retreated as Wall Street analysts scaled down their target amid the ongoing crypto market crash. JPMorgan reduced its target from $399 to $290, while maintaining the overweight rating. Cantor Fitzgerald also reduced the stock target to $221 from $277, while Citigroup cut from $500 to $400.
The most bearish analyst is Ed Engel of Compass Point, who lowered the target from $230 to $190, while maintaining a sell rating.
Coinbase stock also retreated after Robinhood’s stock price plunged by over 10% after releasing its results on Tuesday. A key reason for its weak financial results was that its closely-watched crypto revenue dropped by over 38% in the fourth quarter. It has grown by triple digits in the previous quarters.
Therefore, there is a likelihood that Coinbase will also publish weak financial results after the market closes on Wednesday. Third-party data shows that Coinbase’s retail transaction volume dropped by 15% as Bitcoin (BTC) and other altcoins dropped. This is notable as the transaction revenue is the biggest part of its business.
Wall Street analysts expect Coinbase’s revenue to come in at $1.84 billion, down 78% from the same period in 2024. This decline will occur despite revenue from Deribit, a company it acquired last year. If this estimate is accurate, then its annual revenue will drop by 19.1% to $7.24 billion.
Worse, Coinbase will likely experience another weak first quarter because of the ongoing crypto market crash, with Bitcoin moving to $67,000 today and crypto ETF outflows continue. These factors likely explain why Cathie Wood’s Ark Invest has dumped the stock.
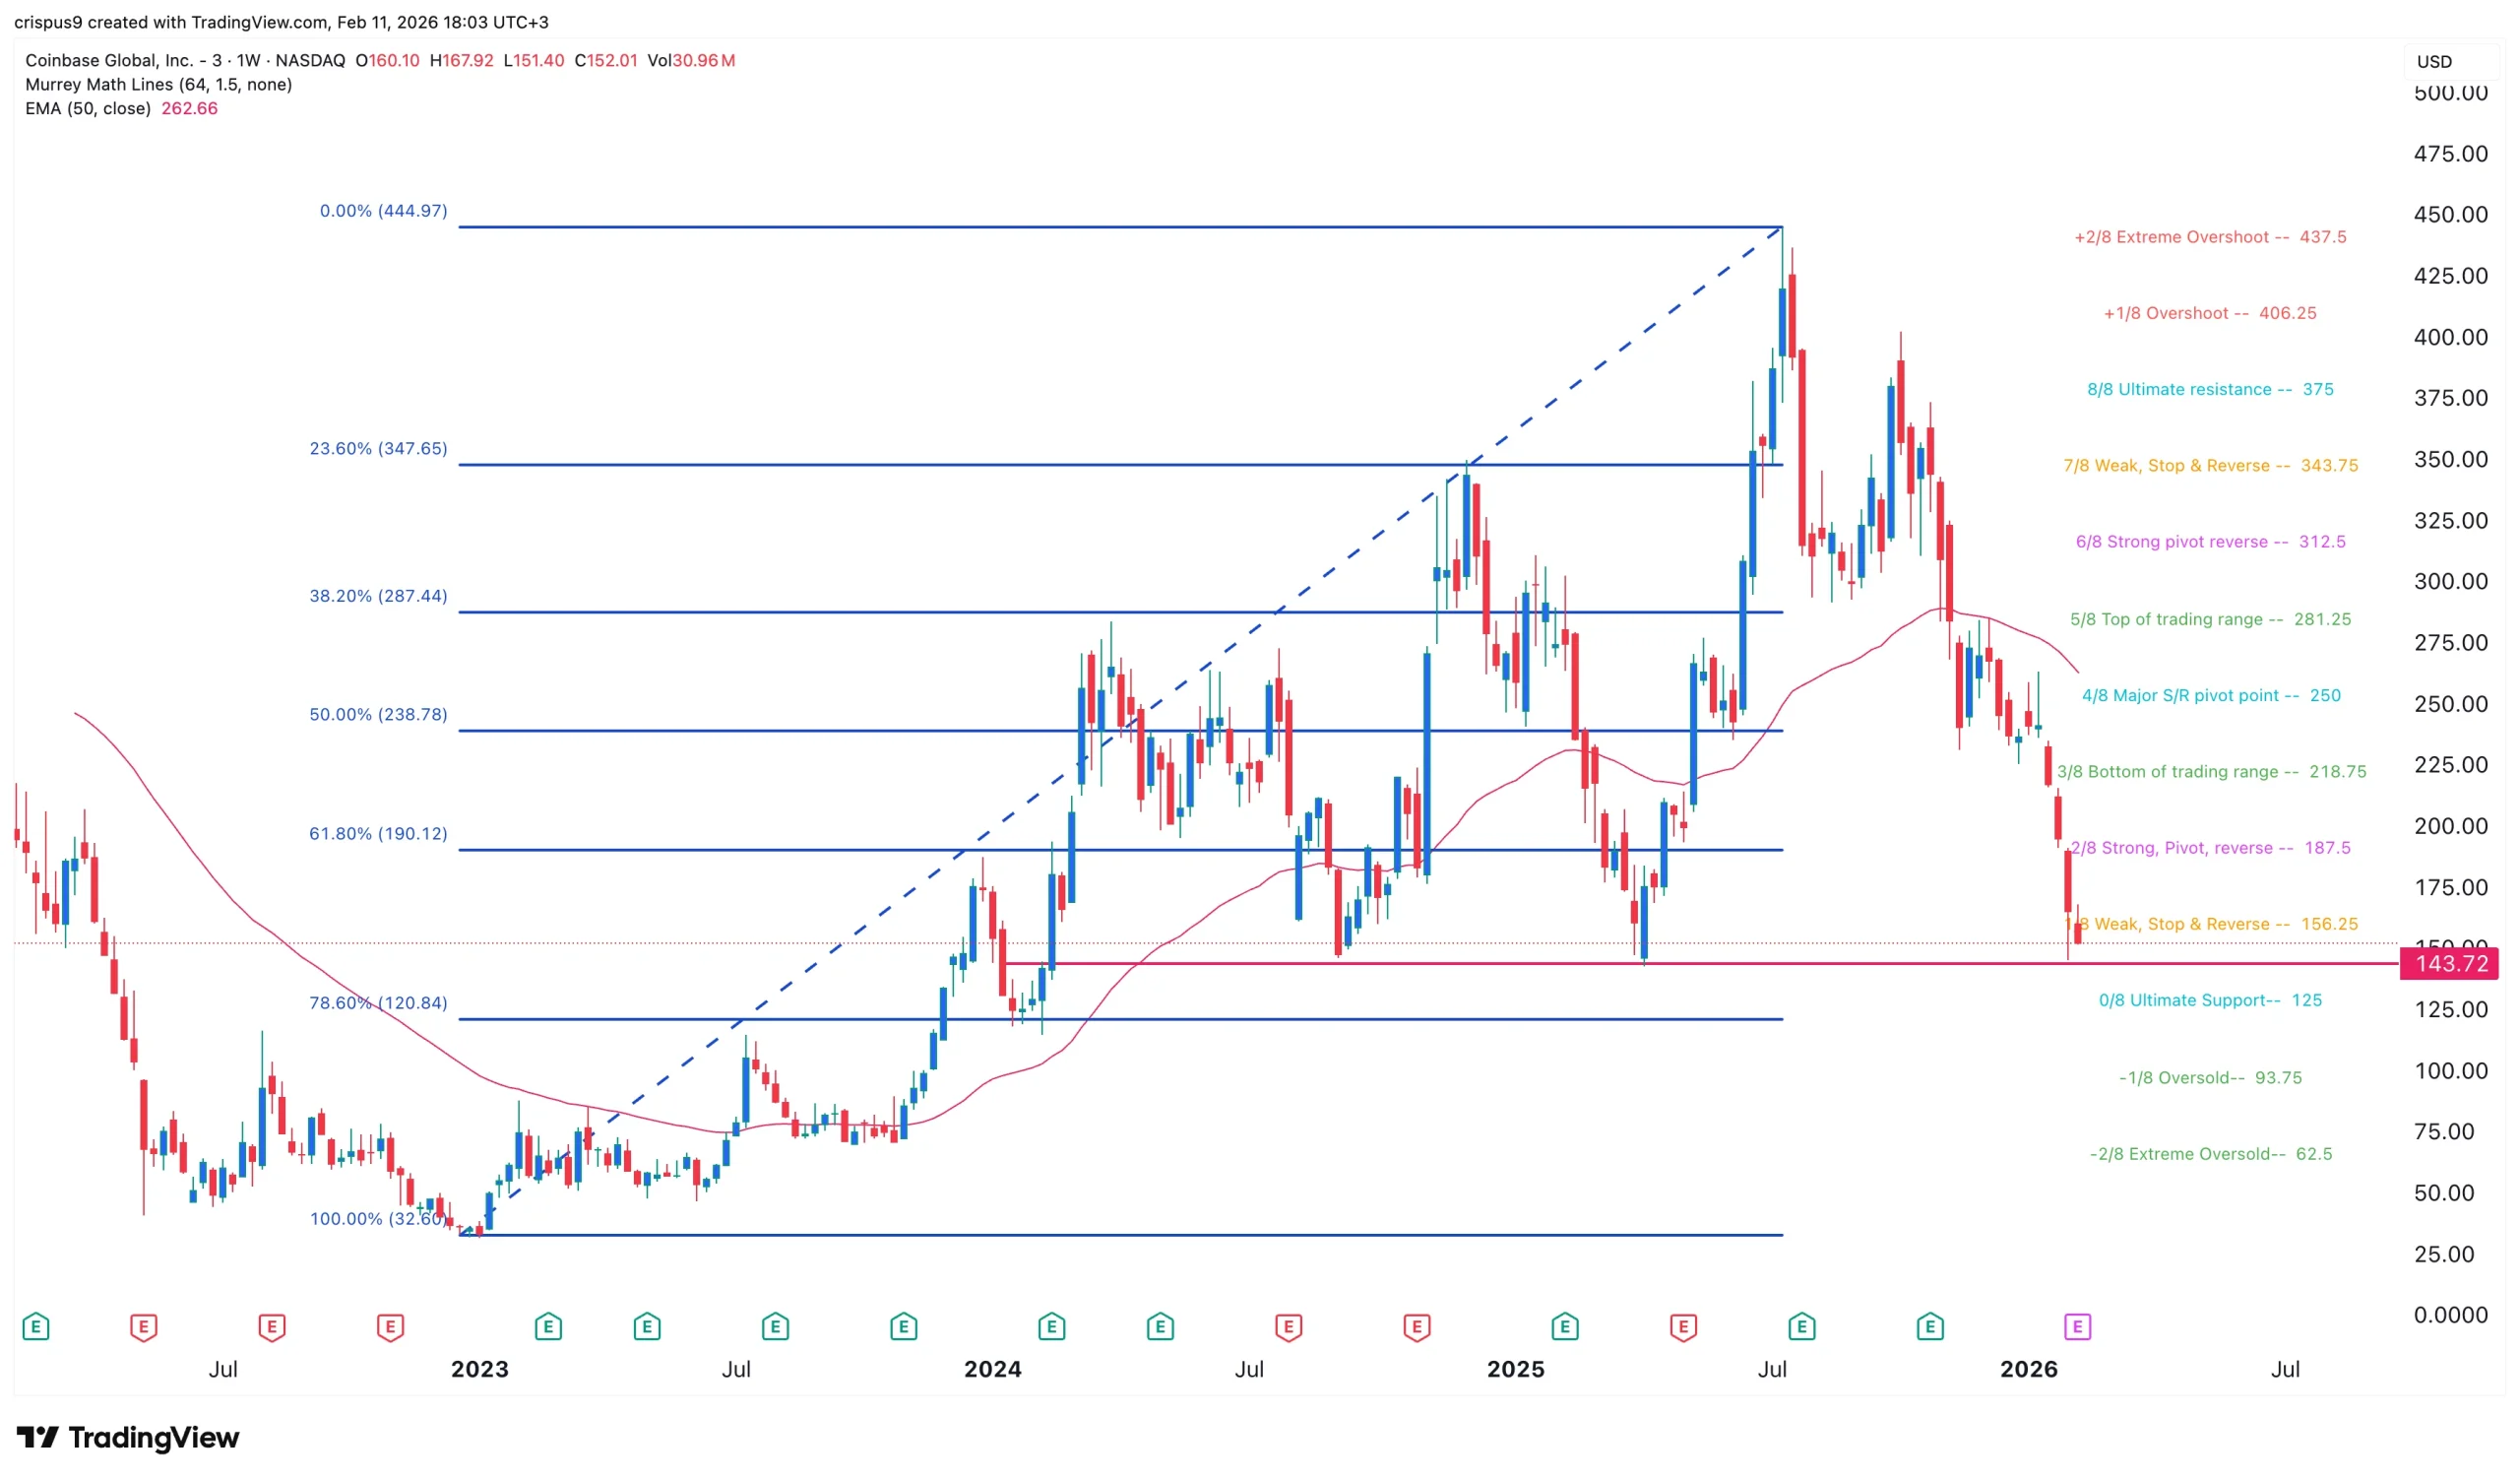
Coinbase stock price technical
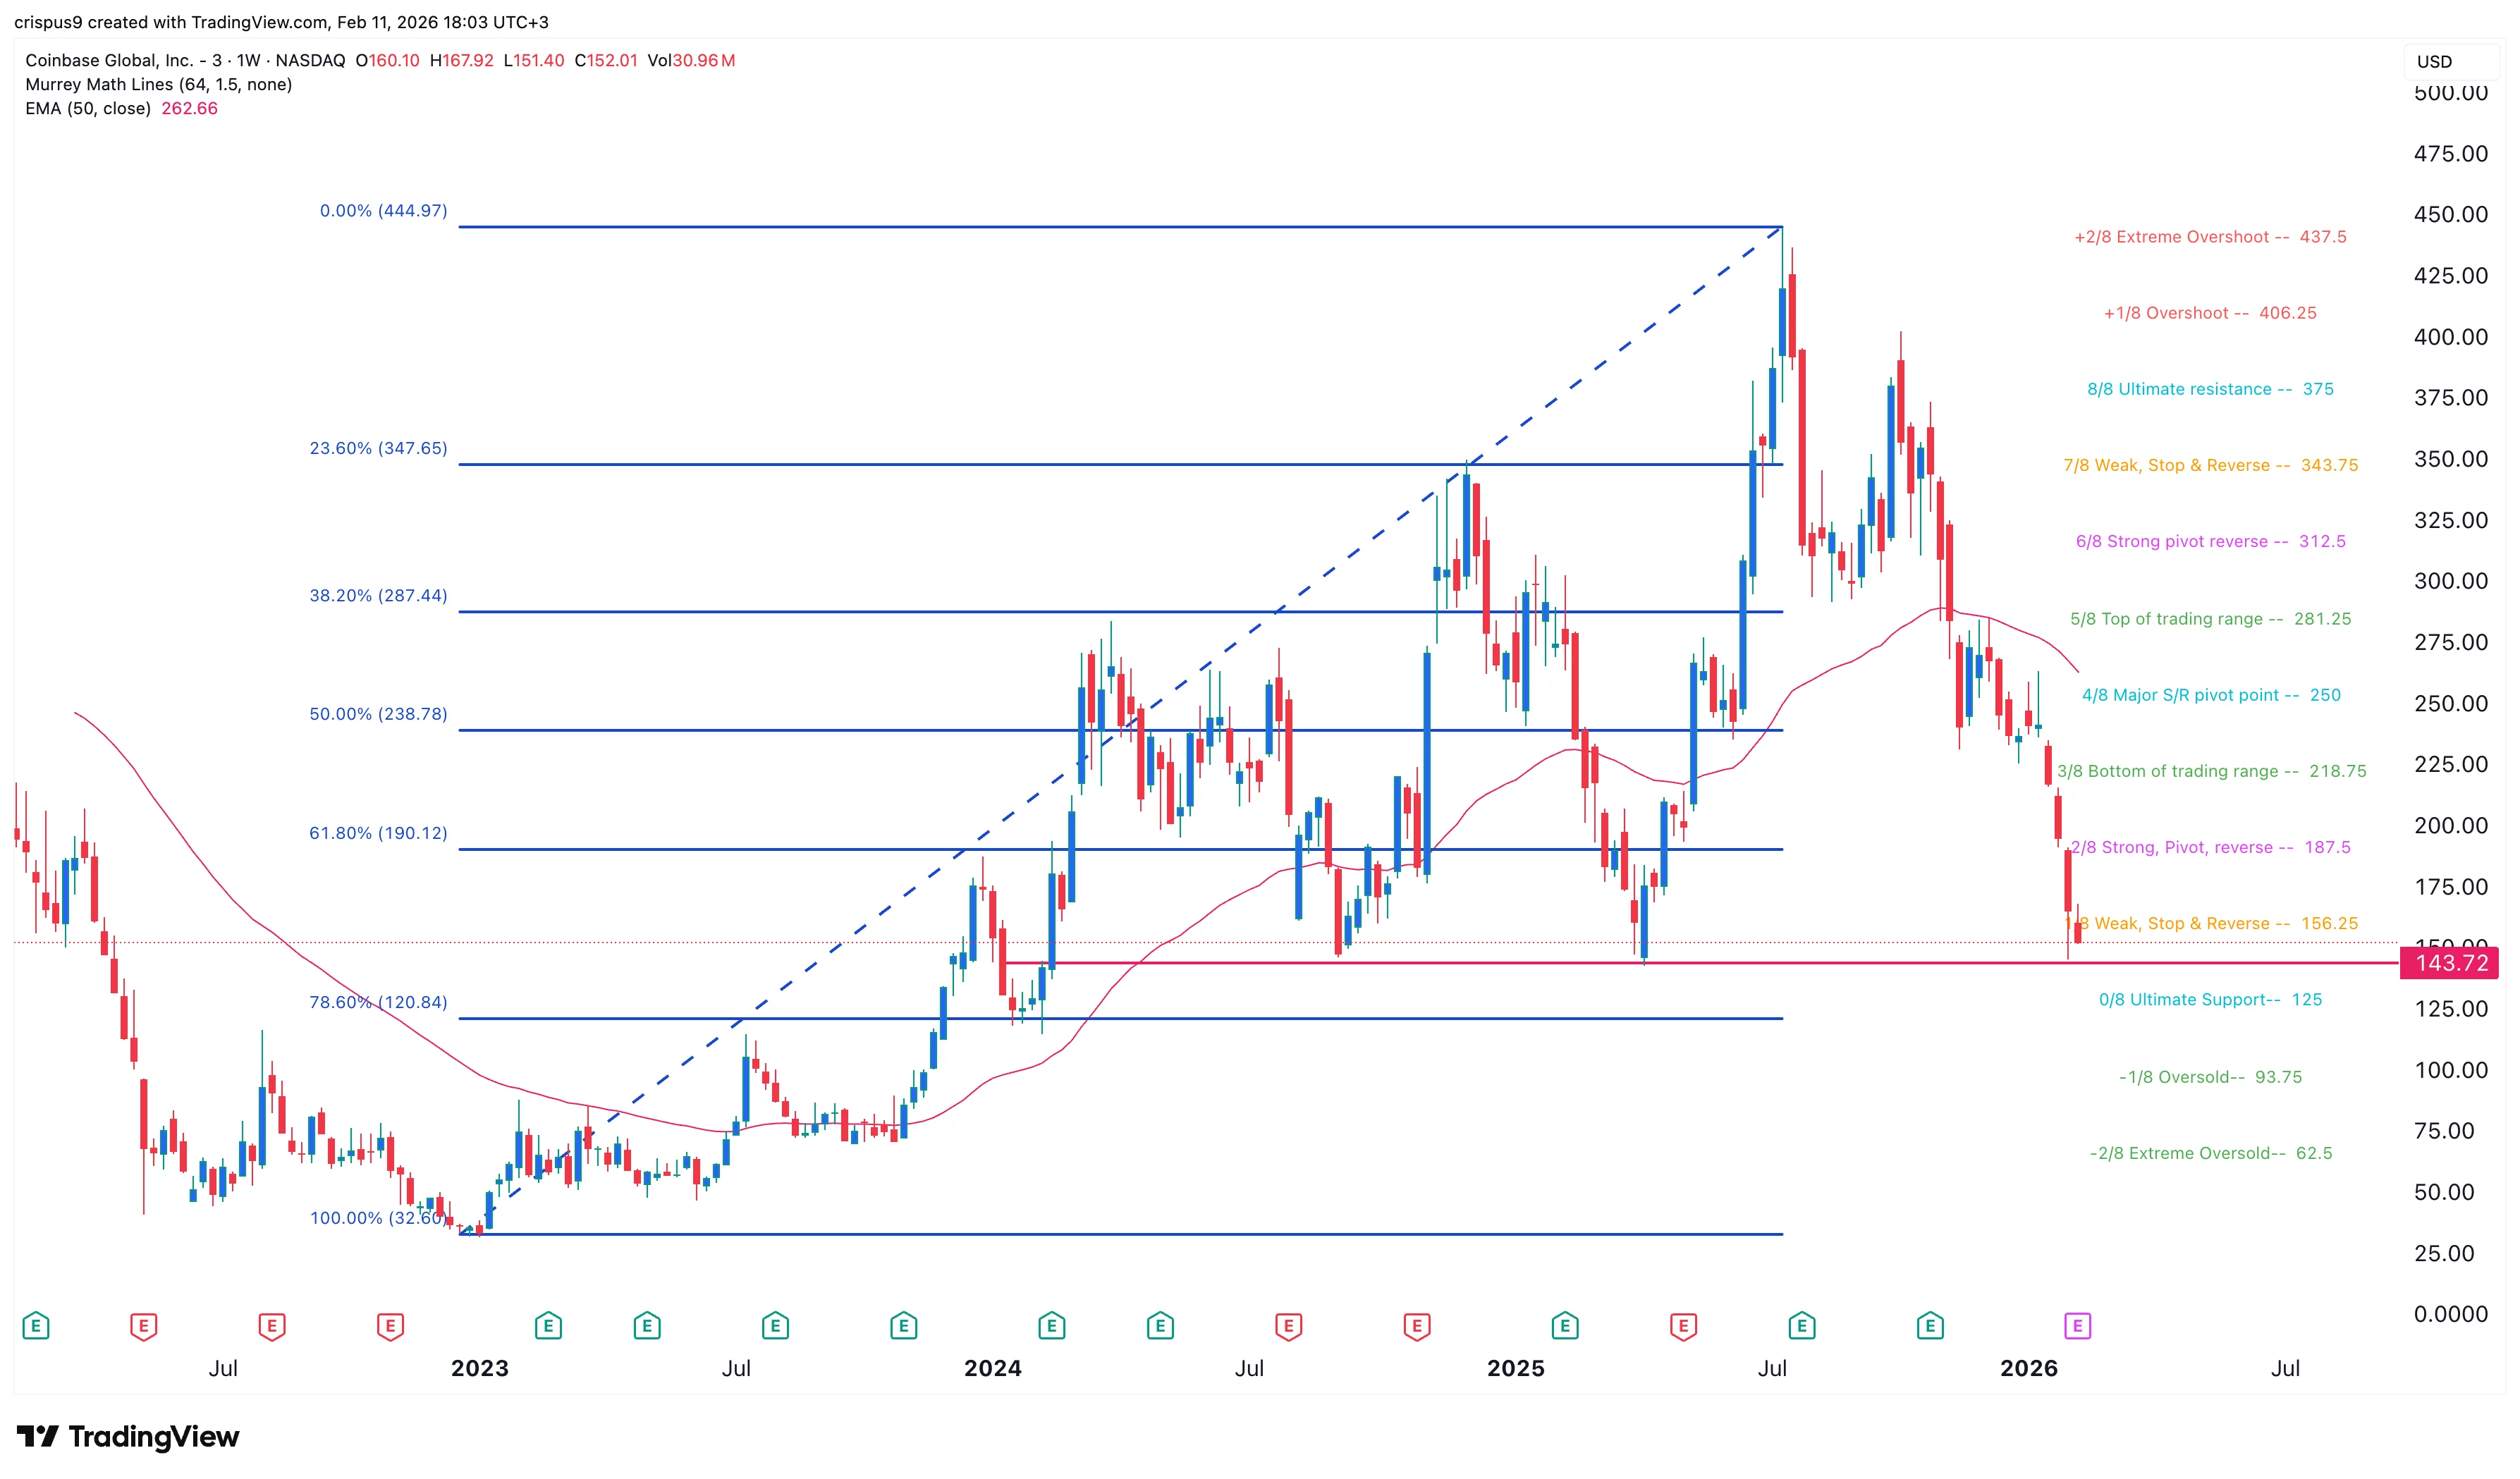
The weekly timeframe chart shows that the COIN stock price has crashed in the past few months, dropping from the all-time high of $445 in July 2025 to the current $153.
It has dropped below the 61.8% Fibonacci Retracement level at $190. Most importantly, the stock has dropped to key support, where it has failed to move below twice since 2024.
Coinbase share price has also dropped below the 50-week and 100-week Exponential Moving Averages and the weak, stop & reverse level of the Murrey Math Lines tool.
A drop below the key support level at $143 will confirm the bearish outlook and point to more downside, potentially to the 78.6% retracement level at $120.


Robinhood is opening the testnet for its Arbitrum-based Ethereum Layer 2. In this episode, we sit down with the fintech’s head of crypto, Johann Kerbrat, to discuss the strategic move to build on Ethereum. He believes institutions can get the privacy and compliance guarantees they need on public chains like Ethereum, so building on private chains doesn’t make sense as they are just a “fancy database.”
Crypto World
Hong Kong remains committed to digital assets but feels competition from an ‘aggressive’ UAE


Hong Kong, one of the world’s major financial hubs, has long been committed to cryptocurrency and blockchain technology — but it faces a competitive challenge from the crypto-friendly UAE.
This was a fact acknowledged by panelists Joseph Chan, under secretary for financial services and the treasury in Hong Kong, and Johnny Ng, founder of web3 investment firm Goldford Group, who spoke at Consensus Hong Kong.
“The UAE is really aggressive,” said NG, who served as a member of the National Committee of the Chinese People’s Political Consultative Conference (CPPCC) since 2018.
He said places such as Dubai and Abu Dhabi have established a solid regulatory framework for virtual assets, and each region has also brought this under the auspices of a single, dedicated regulatory authority. Korea, which boasts many millions of crypto users and investors, also has a particular government body responsible for crypto issues, Ng added.
“I think Hong Kong’s legislative council can recommend that the government do more, particularly by creating one position to oversee all those things,” Ng said. “As a lawmaker, I will actually help the government to connect with congressmen from other countries, for example, Korea.”
Chan of the Hong Kong Treasury said an enduring attraction of Hong Kong is that there are “no surprises” from regulators, who have shown a consistent commitment to digital assets.
“Our regulation is transparent, certain and predictable, and we have stuck to that all along,” Chan said. “This compares with some other jurisdictions, without naming any names. Be it during a crypto winter or not, Hong Kong has stood by the development of the digital asset industry. If you look at other jurisdictions, as things change and there are ups and downs, they might flip-flop.”
Under Hong Kong’s mandatory licensing regime for virtual asset trading platforms (VATPs), 11 licensees have been granted under the framework, which came into effect two and a half years ago.
Regarding the stablecoin regulatory regime that kicked off last August, Chan said the first batch of licenses is targeted for the first quarter of this year.
The license regime for digital asset dealers and custodians is next, and expected to be tabled by Hong Kong’s financial secretary later this year, Chan added, pointing to multiple consultations and bill reading that must first take place.
“It sounds like a long process, but it’s very important,” Chan said. “Because it means everyone from the industry knows what’s coming, there is enough time to raise your concerns, so there will be no surprises and everybody knows what’s going to happen next.”
Major crypto assets traded lower on Wednesday morning as total market capitalization shed almost 4%
Crypto markets weakened further on Wednesday morning, Feb. 11, extending losses from earlier in the week as selling pressure spread across large-cap tokens and total market capitalization slid 3.6% to $2.34 trillion.
Bitcoin (BTC) is trading around $66,280 at press time, down over 4% in the past 24 hours, with weekly losses at 10%.

Ethereum (ETH) also slipped back below the $2,000 level, down almost 5% on the day and more than 11% over the past week. Losses were broad-based across major altcoins, with BNB down 4.6% in the past 24 hours and nearly 19% on the week, while Solana (SOL) fell close to 6% today.
Markets on Thin Ice
Analysts at QCP Capital warned in a research note today that markets still lack clear rebound confirmation, leaving prices vulnerable to renewed pressure.
The analysts cautioned that sentiment still remains fragile as the Crypto Fear & Greed Index is still deep in “extreme fear,” which the firm described as less a sign of capitulation and more “thin ice that happens to be holding.”

Glassnode echoed the cautious tone. In an X post yesterday evening, the crypto analytics firm said that assuming the early October 2025 all-time high marked the end of the most recent bull phase, this cycle has so far experienced relatively modest drawdowns, comparable to the 2015-2017 market.
Big Movers and Liquidations
Looking at the top-100 assets by market cap, Uniswap (UNI) was the biggest outperformer, surging more than 30% earlier today amid news that financial giant BlackRock made a strategic investment within the Uniswap ecosystem. Provenance Blockchain (HASH) also posted gains of around 6%.
On the downside, MYX Finance (MYX) led losses, plunging more than 30%, followed by Trump-linked World Liberty Financial’s WLFI, down over 8% amid continued risk-off positioning.
CoinGlass data shows roughly $390 million in positions were liquidated over the past 24 hours, with the majority being long positions. Bitcoin accounted for about $157 million and Ethereum roughly $126 million in the past 24 hours, while more than 120,000 traders were liquidated during the period.
ETFs and Macro Conditions
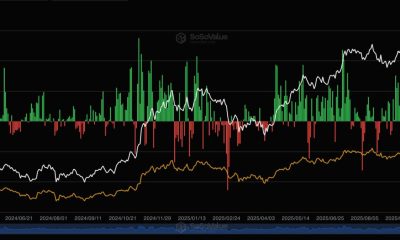
On Tuesday, Feb. 10, spot Bitcoin ETFs recorded their third consecutive positive inflow day, with a net $166.6 million flowing into the products, lifting cumulative inflows to $55 billion, according to SoSoValue data. Total value traded reached $3.38 billion, while total net assets stood at $87.7 billion.
Spot Ethereum ETFs also saw net inflows on Tuesday for the second day in a row, with $13.8 million added, pushing cumulative inflows to $11.8 billion, while total net assets stood at $11.7 billion.
In macro markets, U.S. labor data released today helped ease concerns about a sharp slowdown in employment.
Nonfarm payrolls rose by 130,000 in January, above expectations for a 55,000 increase, according to the Bureau of Labor Statistics. The unemployment rate declined to 4.3%, while a broader measure of labor underutilization slipped to 8%.
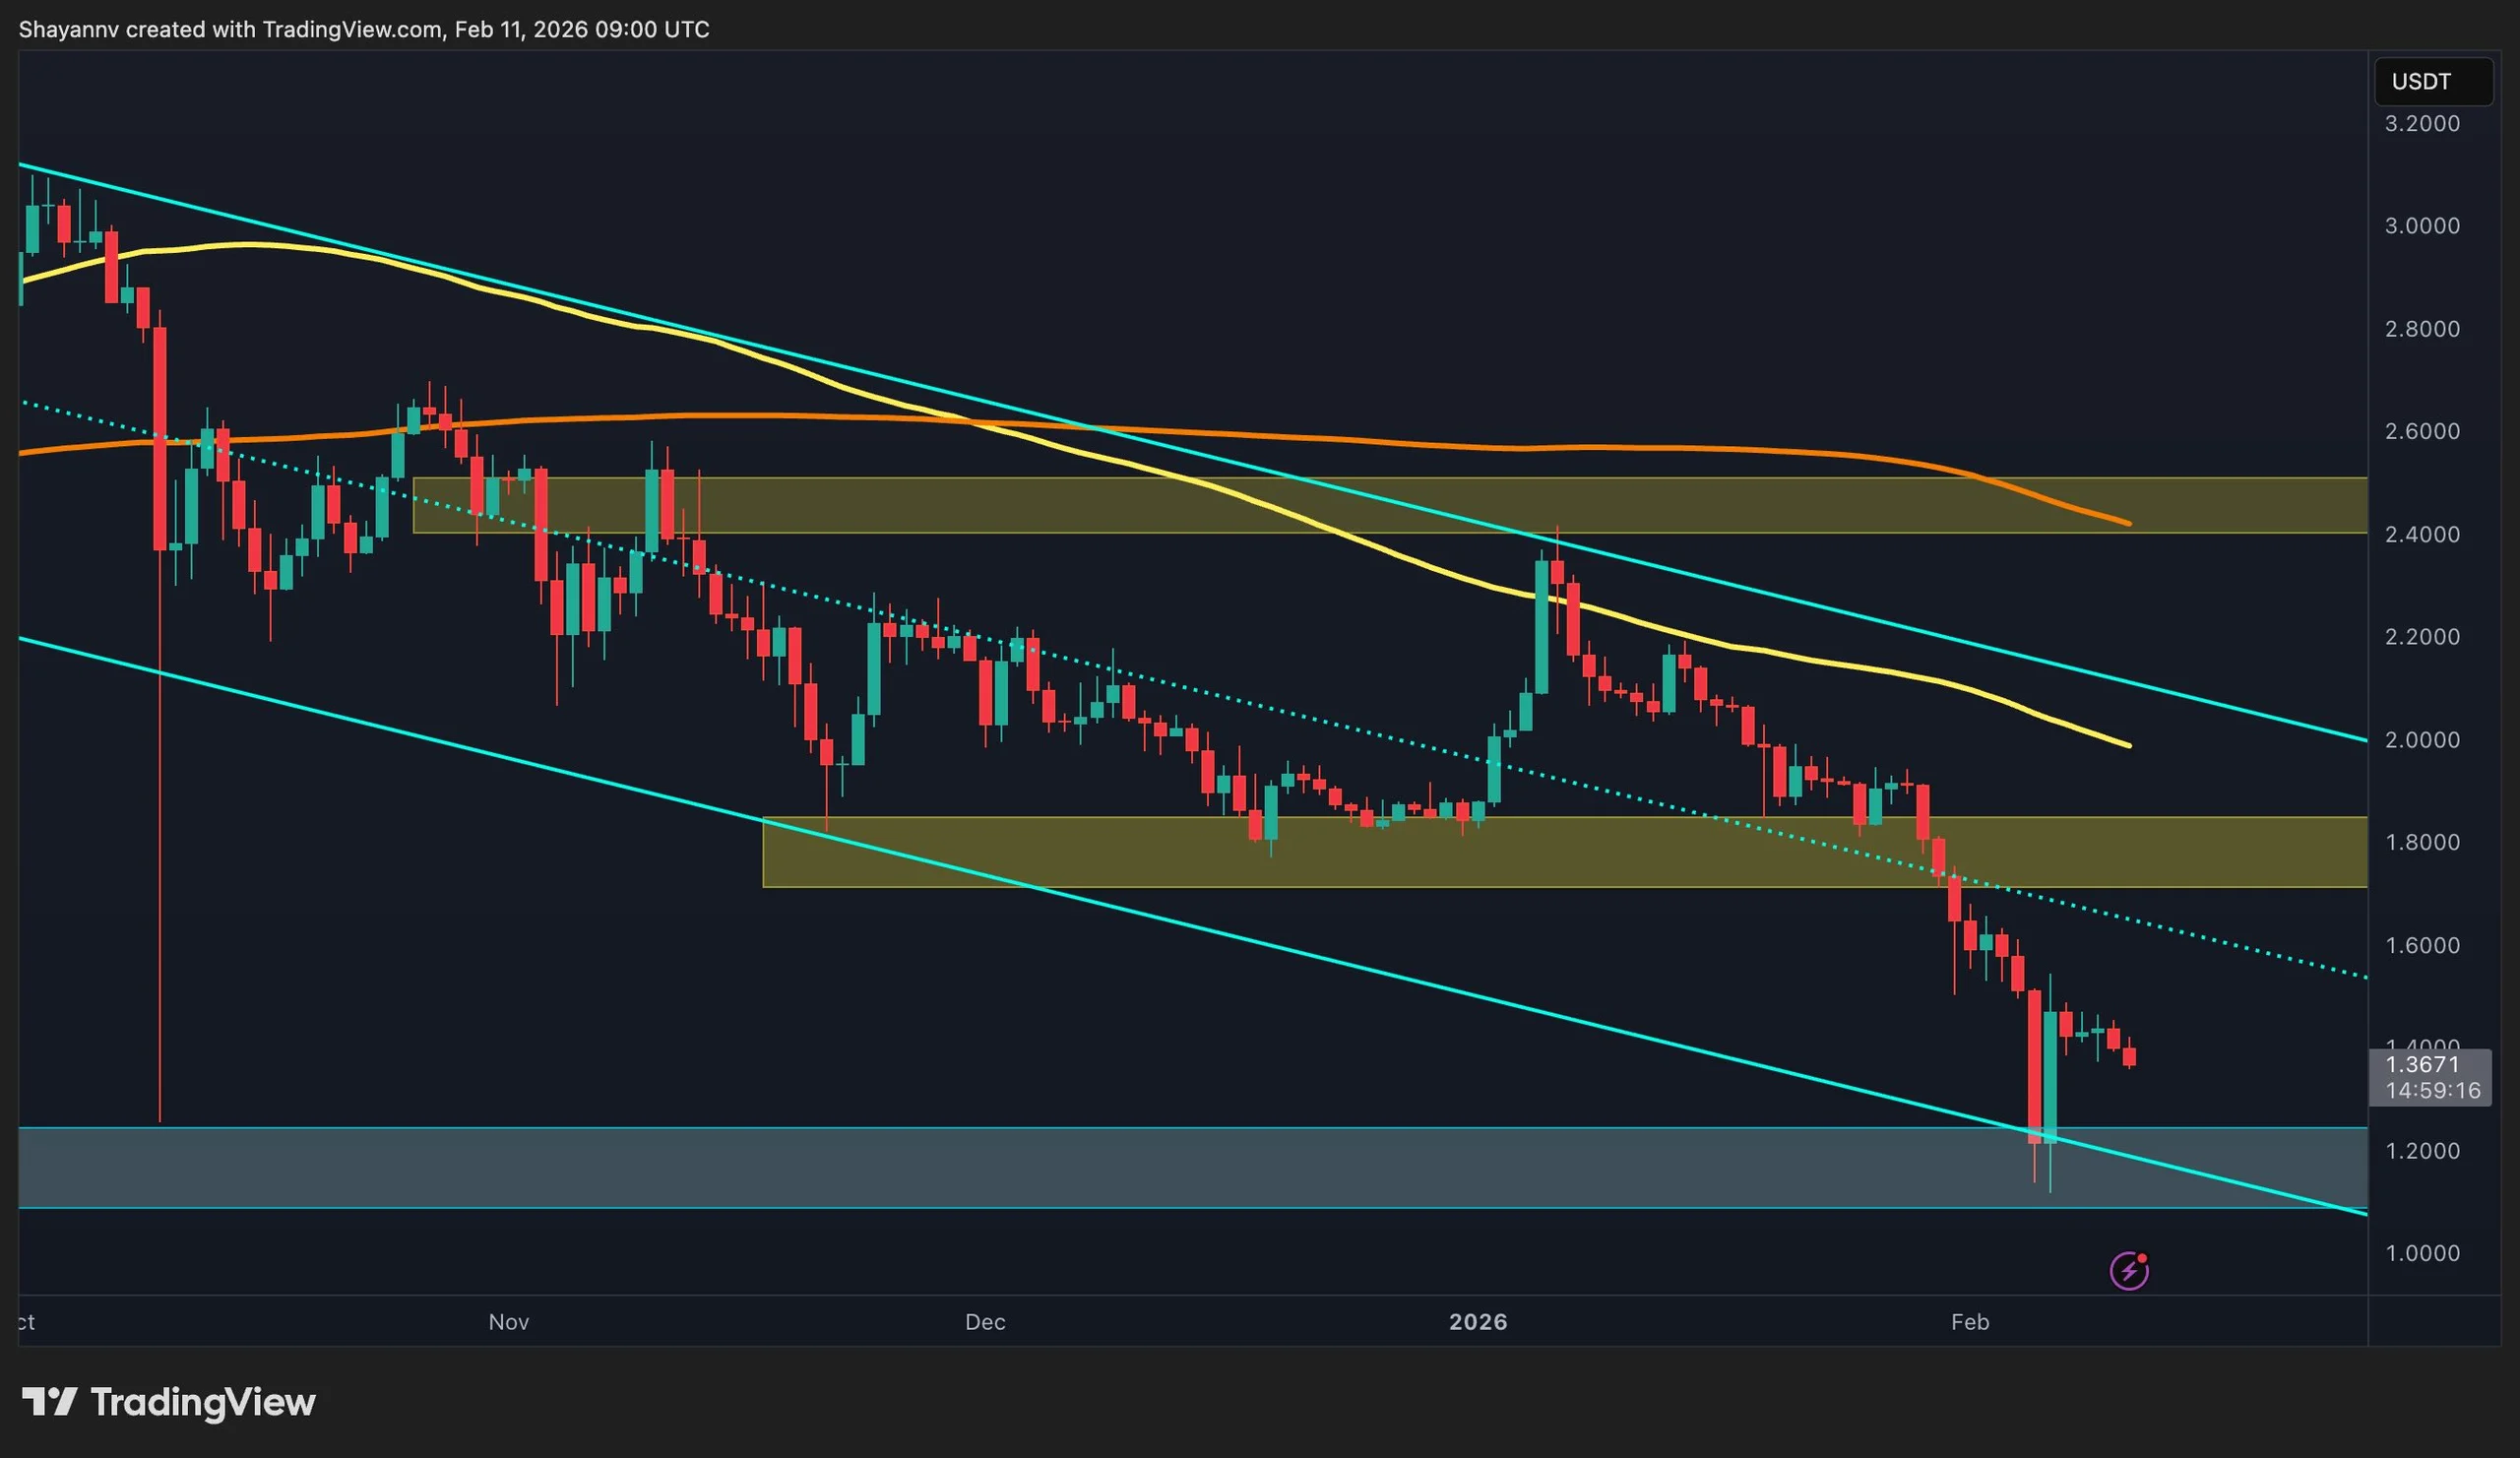
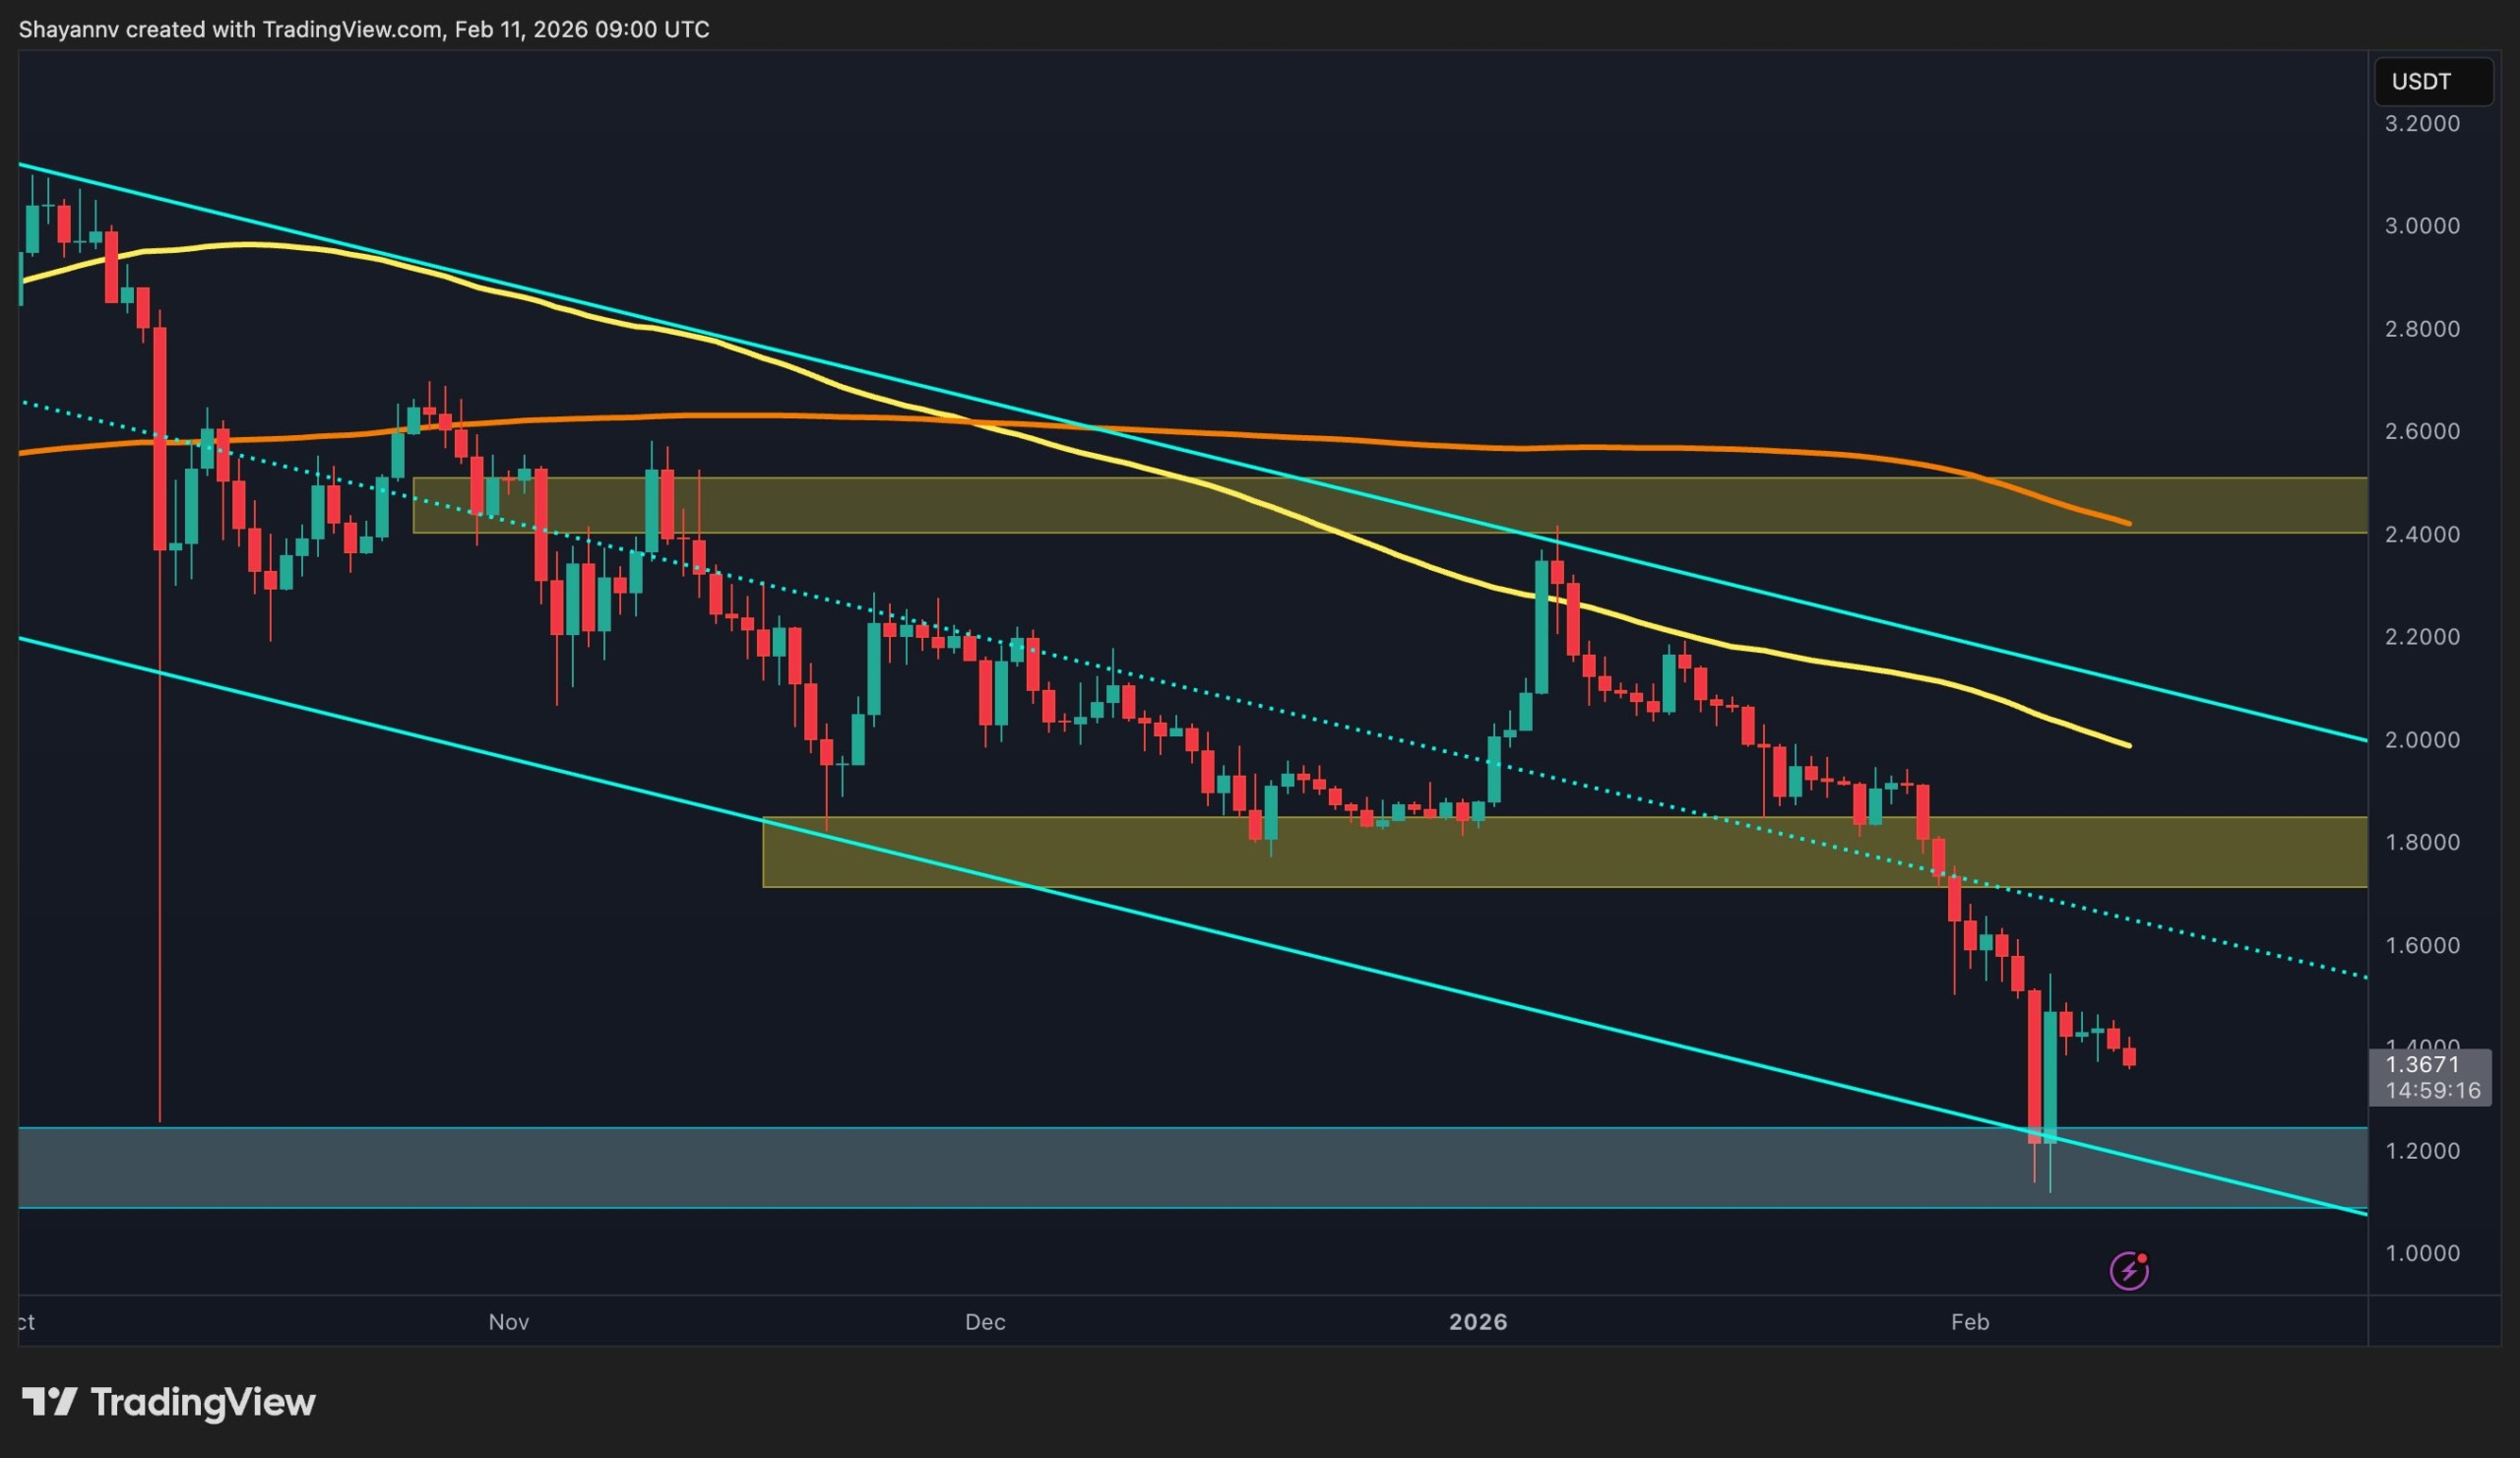
Ripple’s XRP remains under clear bearish pressure, but instead of accelerating lower, the market has transitioned into a compression phase. The price action is now stabilizing near a key psychological floor, with volatility declining as both sides hesitate to commit aggressively.
Ripple Price Analysis: The Daily Chart
On the daily timeframe, XRP’s decisive breakdown below the descending channel’s midline triggered a strong impulsive sell-off that drove the price toward the $1 demand region. That breakdown confirmed a structural shift in favor of sellers. Although a rebound followed, it stalled beneath the $1.5 resistance zone, which now acts as a firm supply area.
The inability to reclaim $1.5 signals that the recent upside move was corrective rather than impulsive. Sellers remain active on rallies, defending overhead supply. As long as XRP trades below $1.5, the broader structure remains tilted to the downside.
Currently, the price is consolidating between $1 and $1.5, with $1 acting as the primary daily demand. A decisive breakdown below $1 could expose the market to deeper downside continuation, while only a strong daily close above $1.5 would shift short-term momentum back in favor of buyers.
XRP/USDT 4-Hour Chart
On the 4-hour timeframe, the rebound from $1 appears as a sharp reaction move fueled by short-term profit-taking. The recovery pushed the price toward $1.5, but the structure shows clear hesitation and rejection inside that supply region.
The market is now compressing between $1 demand and $1.5 supply, forming a range-bound structure. This reflects temporary equilibrium rather than trend reversal. Buyers are defending $1, but they lack the strength to challenge $1.5 convincingly.
If Ripple manages a clean breakout above $1.5 with momentum, the next meaningful supply zone sits around $1.8. Conversely, a breakdown below $1 would likely reintroduce aggressive selling pressure and resume the broader bearish leg.

SECRET PARTNERSHIP BONUS for CryptoPotato readers: Use this link to register and unlock $1,500 in exclusive BingX Exchange rewards (limited time offer).
Disclaimer: Information found on CryptoPotato is those of writers quoted. It does not represent the opinions of CryptoPotato on whether to buy, sell, or hold any investments. You are advised to conduct your own research before making any investment decisions. Use provided information at your own risk. See Disclaimer for more information.
Crypto World
David Einhorn says the Fed will cut ‘substantially more’ than two times. So he’s betting big on gold
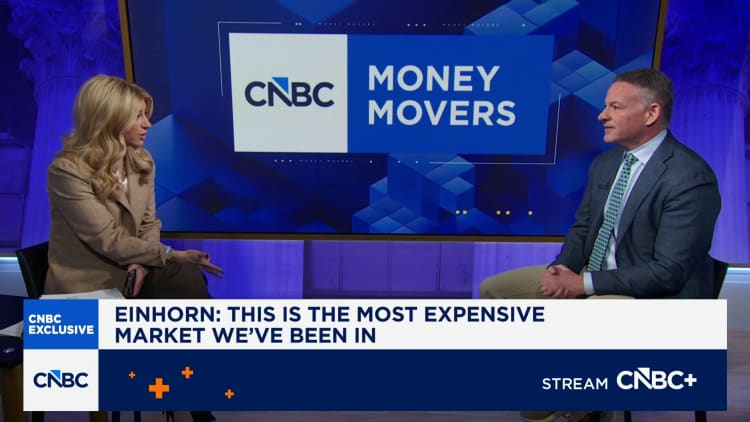

Greenlight Capital’s David Einhorn anticipates the Federal Reserve will issue more interest rate cuts this year than what’s being anticipated and that’s giving him greater confidence in his gold bet.
While rate cut expectations diminished a bit Wednesday following the much better-than-expected January jobs report, traders are still currently pricing in a more than 88% chance that the central bank will make two quarter percentage point cuts by the end of the year, according to the CME FedWatch Tool.
But Einhorn said that the market viewing the latest jobs figures as a reason not to cut is “wrong.” In fact, he thinks the rate cuts number could be higher than that, as he expects Kevin Warsh – President Donald Trump’s pick to succeed Jerome Powell as Fed chair – is going to be able to persuade the committee to do so.
“If we have 4% or 5% inflation, sure, then he won’t be able to persuade people, but otherwise he’s going to argue productivity,” Einhorn said on CNBC’s “Money Movers” to Sara Eisen on Wednesday, adding that Warsh, in his view, is going to take the position of cutting “even if the economy is running hot.”
“I think by the time we get to the end of the year, it’s going to be substantially more than two cuts,” he continued.
The hedge fund manager also owns gold, which sold off at the end of last month after Trump announced Warsh as his nominee for Fed chair, as the move eased anxieties on Wall Street surrounding Fed independence.
The yellow metal – typically viewed as an inflation hedge – has since seen some recovery, with gold futures being up more than 17% this year. That’s after it surged more than 60% in 2025 amid threats to central bank independence as well as heightened geopolitical tensions and unstable trade policy. Since 2024, it’s surged more than 120%.

Gold futures prices since 2024
Einhorn — who gained notoriety in 2008, when he bet against Lehman Brothers at the Sohn Investment Conference just months before the investment bank declared bankruptcy — pointed out that gold has actually gone up over the past couple years as a result of “becoming the reserve asset” to own among central banks around the world.
“U.S. trade policy is very unstable, and it’s causing other countries to say we want to settle our trade in something other than U.S. dollars,” he said.
In the long term, he said that a reason to own gold is due to the fact that the current relationship between our fiscal and monetary policies “don’t make any sense.” He also said that other major developed currencies around the world are “as bad or worse” than the U.S. The U.S. dollar suffered its biggest single-day drop since April 2025 last month after Trump said he wasn’t concerned about the currency’s recent weakness.
“There are some issues that sometime over the next number of years could play out with some of the major currencies,” he said.
Deeming betting on more cuts as “one of the best trades out there right now,” Einhorn said he was also long futures on SOFR (Secured Overnight Financing Rate), which essentially is a bet that short-term rates will continue to go lower.
Lindsey Vonn shares new update from hospital after skier undergoes third surgery

U.S. DOJ hits Paxful for $4 million in case tied to illegal sex work, money laundering

Suit of the Week: Banana Republic Factory

Smart energy pays enters the US market, targeting scalable financial infrastructure
Software stocks enter bear market on AI disruption fear with ServiceNow plunging 10%

Wikipedia volunteers spent years cataloging AI tells. Now there’s a plugin to avoid them.


-

 Politics3 days ago
Why Israel is blocking foreign journalists from entering
-
 Sports5 days ago
JD Vance booed as Team USA enters Winter Olympics opening ceremony
-

 NewsBeat2 days ago
Mia Brookes misses out on Winter Olympics medal in snowboard big air
-
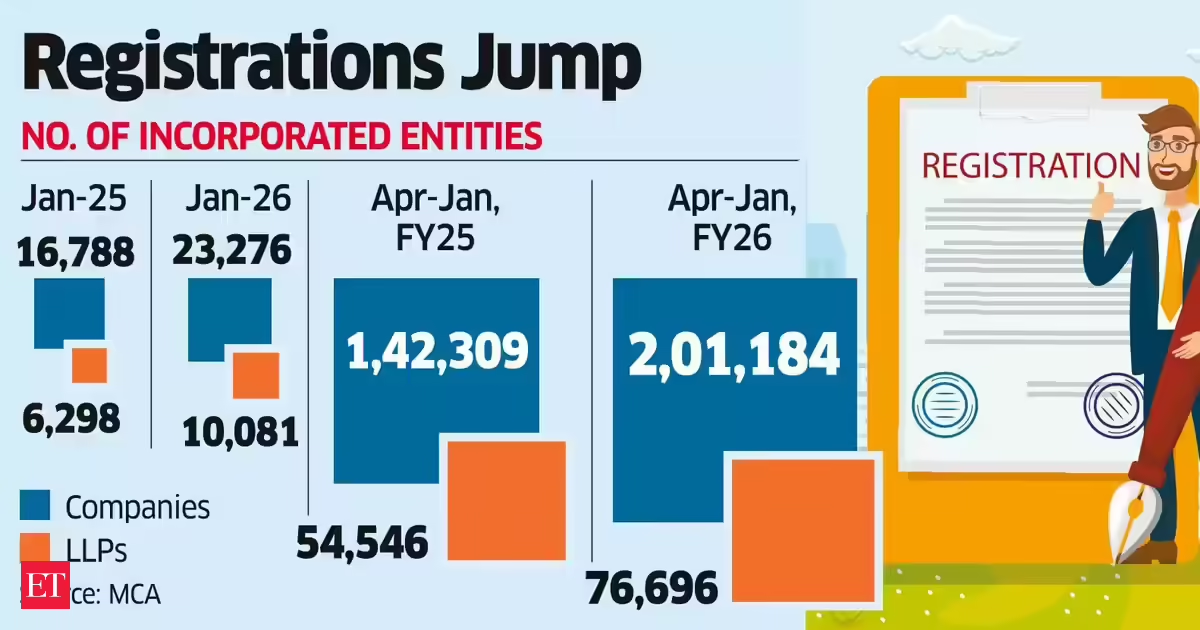 Business3 days ago
LLP registrations cross 10,000 mark for first time in Jan
-

 Tech5 days ago
First multi-coronavirus vaccine enters human testing, built on UW Medicine technology
-

 Tech15 hours ago
SpaceX’s mighty Starship rocket enters final testing for 12th flight
-

 NewsBeat3 days ago
Winter Olympics 2026: Team GB’s Mia Brookes through to snowboard big air final, and curling pair beat Italy
-

 Sports3 days ago
Benjamin Karl strips clothes celebrating snowboard gold medal at Olympics
-
Sports4 days ago
Former Viking Enters Hall of Fame
-

 Politics3 days ago
The Health Dangers Of Browning Your Food
-
Sports5 days ago
New and Huge Defender Enter Vikings’ Mock Draft Orbit
-

 Business3 days ago
Costco introduces fresh batch of new bakery and frozen foods: report
-

 Business3 days ago
Julius Baer CEO calls for Swiss public register of rogue bankers to protect reputation
-
 NewsBeat5 days ago
Savannah Guthrie’s mother’s blood was found on porch of home, police confirm as search enters sixth day: Live
-

 Business6 days ago
Quiz enters administration for third time
-

 Crypto World1 day ago
Blockchain.com wins UK registration nearly four years after abandoning FCA process
-
 Crypto World1 day ago
U.S. BTC ETFs register back-to-back inflows for first time in a month
-
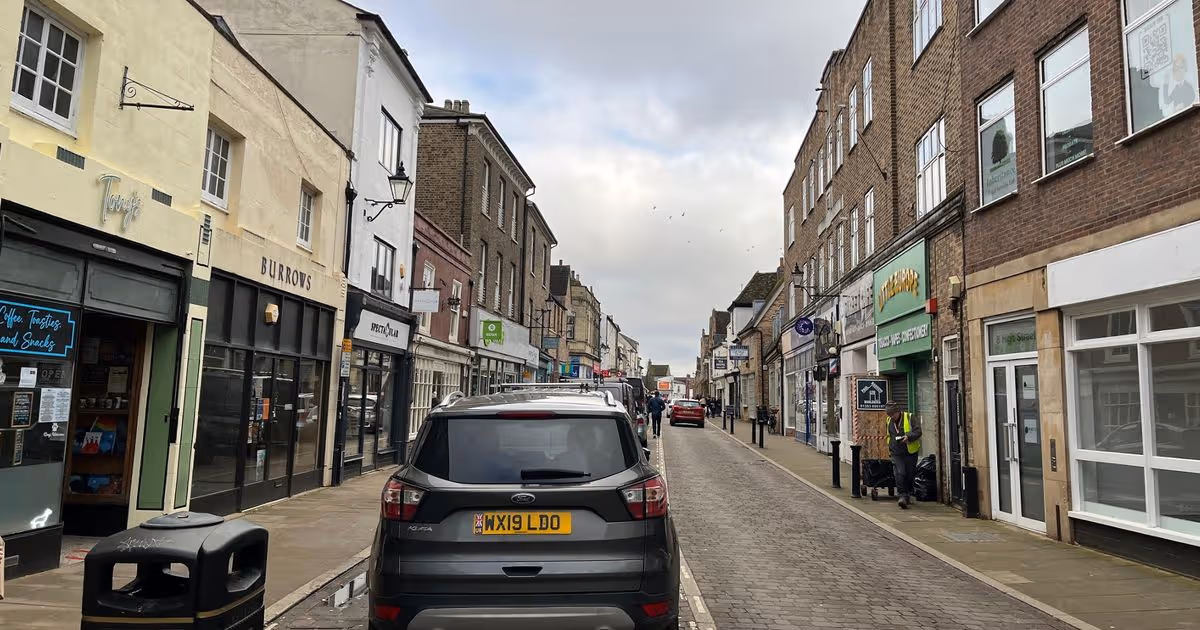 NewsBeat2 days ago
Residents say city high street with ‘boarded up’ shops ‘could be better’
-
Sports2 days ago
Kirk Cousins Officially Enters the Vikings’ Offseason Puzzle
-

 NewsBeat6 days ago
Still time to enter Bolton News’ Best Hairdresser 2026 competition