
Crypto World
GameStop Transfers Entire Bitcoin Holdings

Join Our Telegram channel to stay up to date on breaking news coverage
GameStop has transferred its entire Bitcoin holdings to Coinbase Prime, suggesting a potential plan to sell them all, according to CryptoQuant data, as the exchange often serves as a staging ground for large sales.
Even though the company is yet to confirm a sale, analysts have been quick to describe the timing as consistent with a potential exit from its BTC position.
On January 17, GameStop moved 100 BTC, worth around $9.5 million, and an additional 2,296 BTC on January 20, accounting for 51% of its total BTC treasury, with 4,710 BTC acquired between May 14 and May 23, 2025, spending about $504 million at an average price of $107,900 per coin.
GameStop throws in the towel?
Their on-chain wallets just moved all BTC holdings to Coinbase Prime, likely to sell.
Between May 14–23, 2025, they bought 4,710 BTC at an avg. price of $107.9K, investing ~$504M.
Now selling for around $90.8K, potentially realising approximately… pic.twitter.com/Bp7MwRVQ43
— CryptoQuant.com (@cryptoquant_com) January 23, 2026
The BTC hoard remained untouched for months before the abrupt outflow in January 2026, suggesting the move was planned rather than routine.
With the company selling BTC near $90,800, it would lock in roughly $76 million in losses based on the difference between the average purchase price and current market pricing.
GameStop Sale Speculation Amid Caution In The Market
Speculation of an incoming sale by GameStop comes as Bitcoin struggles to regain bullish momentum, trading at $89,534 as of 1:39 a.m. EST, amid indicators pointing to rising sell-side activity.
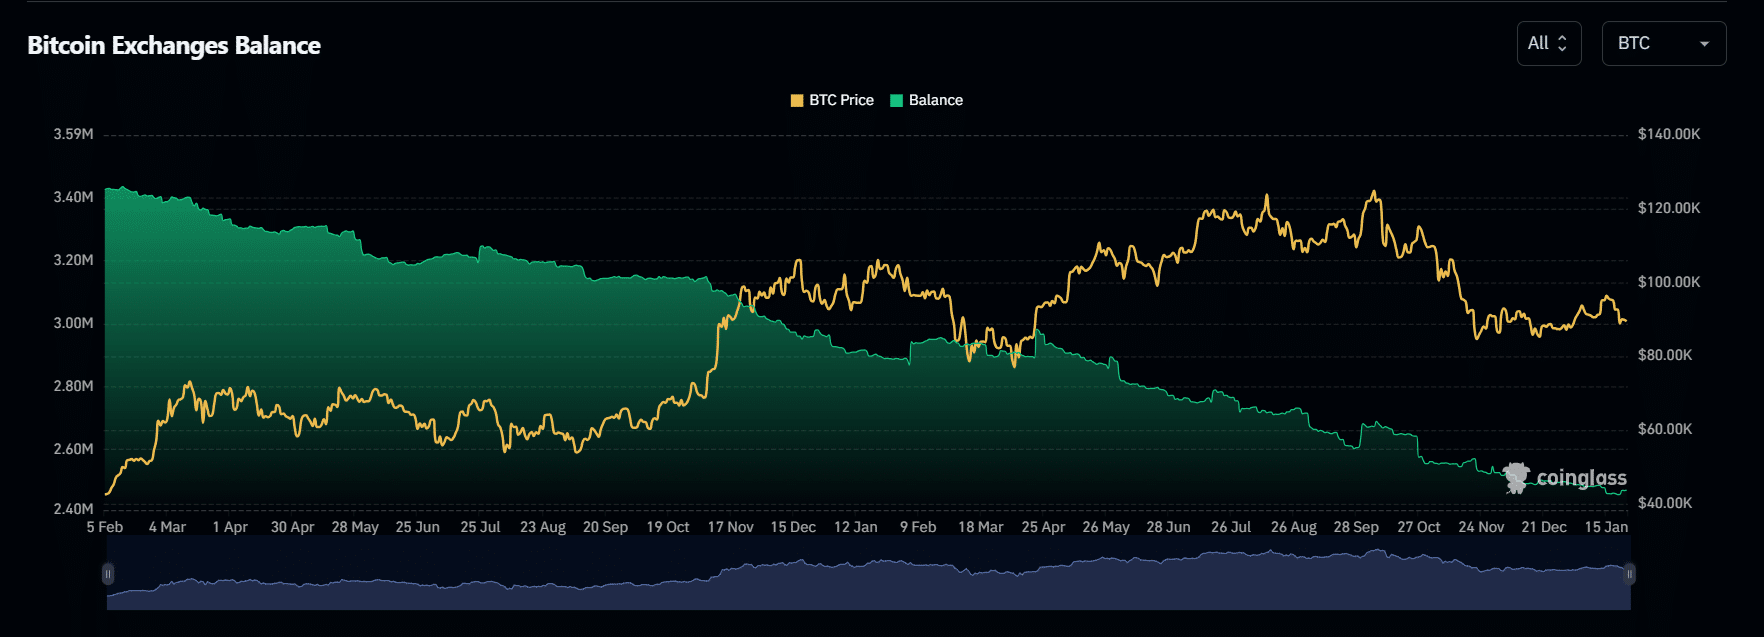
Data from Coinglass shows that centralized exchanges continue to face a sustained BTC outflow, with 208.95 BTC leaving exchanges in the last 24 hours.
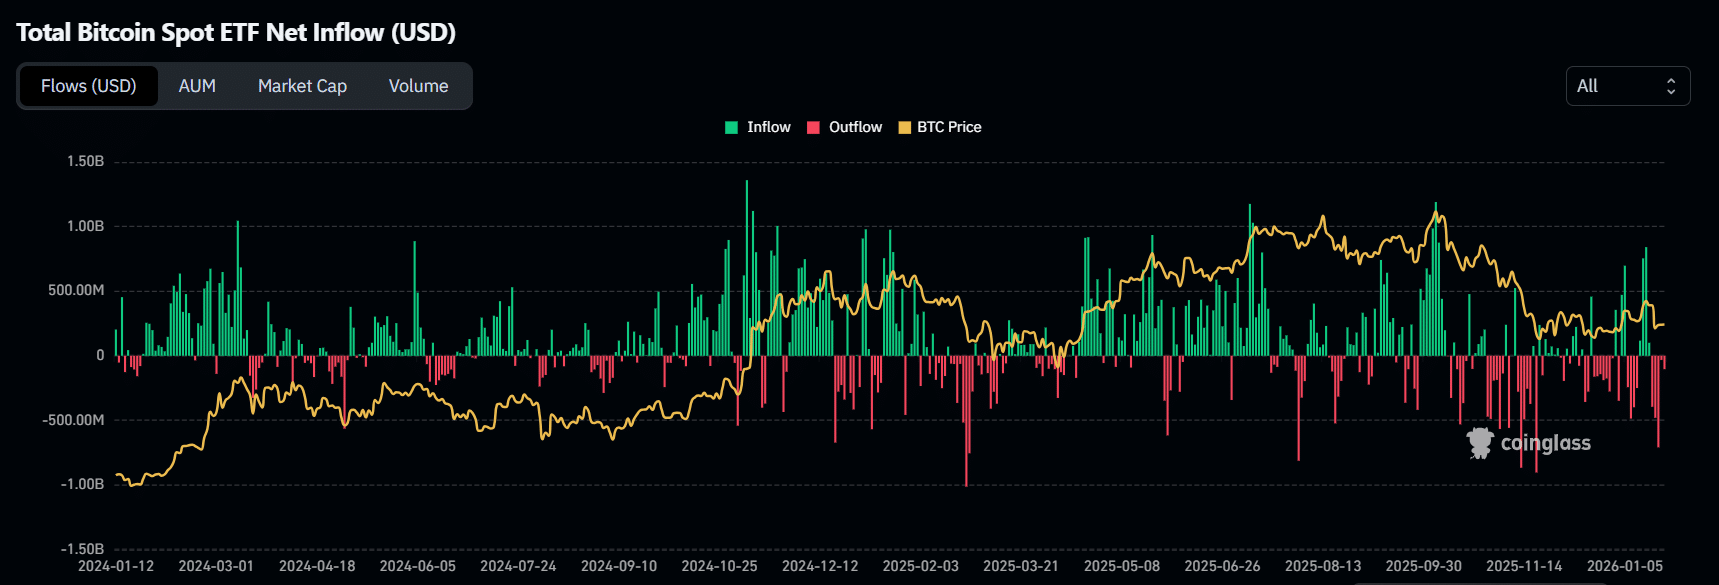
Meanwhile, US Spot BTC exchange-traded funds (ETFs) recorded net outflows of $103.5 million over the last 24 hours, marking the fifth consecutive day of outflows this week.
The weaker demand comes amid a week of macro uncertainty tied to President Donald Trump’s renewed tariff threats, as investors turned to safe-haven assets like gold and silver, both of which have hit new all-time highs.
Meanwhile, GameStop’s stock moved in a different direction with the sale, with the company’s shares trading at around $23.28 after a 1.26% jump in the last 24 hours.
Related News:
Best Wallet – Diversify Your Crypto Portfolio

- Easy to Use, Feature-Driven Crypto Wallet
- Get Early Access to Upcoming Token ICOs
- Multi-Chain, Multi-Wallet, Non-Custodial
- Now On App Store, Google Play
- Stake To Earn Native Token $BEST
- 250,000+ Monthly Active Users
Join Our Telegram channel to stay up to date on breaking news coverage

Crypto World
BitGW’s Single-Sided AMM Model Highlights a More Collaborative Direction for Crypto Liquidity
As the crypto market continues to mature, Automated Market Makers (AMMs) are no longer seen solely as tools used by decentralized exchanges. Increasingly, they are becoming part of a broader shift in market structure, where trading platforms combine algorithmic liquidity with centralized execution.
BitGW has been operating a single-sided AMM model for several years, reflecting this evolution. While early AMMs—widely associated with platforms like Uniswap—reshaped how liquidity is created in crypto, newer models are beginning to focus not only on efficiency, but also on accessibility, sustainability, and how value is distributed among participants.
From Traditional AMMs to Single-Sided Liquidity
Early AMM systems typically required users to provide two assets into a liquidity pool. That structure made decentralized trading possible at scale, but it also introduced practical challenges. Users needed to manage paired assets, track price movements across both sides, and accept the possibility of impermanent loss.
Single-sided AMM models take a different approach. Instead of requiring two tokens, they allow users to participate with just one asset. This simplifies the process and lowers the barrier for users seeking liquidity-based returns without managing a more complex pool structure.
BitGW’s long-running implementation of this model shows how the concept can extend beyond purely decentralized environments.
A Hybrid Model Rather Than a Replacement
Rather than positioning AMMs and order books as competing systems, the market is increasingly moving toward hybrid designs. In this structure, AMM logic contributes to pricing and liquidity formation, while centralized infrastructure provides execution depth, speed, and stability.
BitGW’s model reflects this direction. Its single-sided AMM framework operates within a broader trading environment, combining simplified liquidity participation with the advantages of centralized exchange architecture.
This makes single-sided liquidity more accessible, particularly for users who may be interested in participating but are less inclined to manage the complexity of traditional dual-token AMMs.
Where the Model Becomes More Meaningful
What makes this structure notable is that the AMM functions not only as a trading mechanism, but also as part of a broader revenue and incentive framework.
BitGW’s revenue structure spans multiple sources, including spot trading fees, swap transactions, AMM operations, and additional mechanisms such as spread capture and asset utilization. These components are directly linked to trading activity and form part of standard exchange infrastructure.
Within this structure, LP participation is connected to the value generated by market activity on the platform. As trading volume and liquidity interaction increase, liquidity providers benefit from the underlying flow they support.
This linkage between trading activity and liquidity participation reflects a model focused on consistency and long-term operational sustainability.
Profit Sharing as a Cooperative Mechanism
One of the more distinctive aspects of the single-sided AMM framework is how it connects platform activity with user returns.
When users add liquidity, they contribute to the infrastructure supporting trading flow. As that activity grows, LPs share in the value generated within the system. This shifts liquidity provision from a purely technical role to a more active form of participation in the platform’s operating economy.
Such a structure is becoming increasingly relevant in today’s market, where users are paying closer attention not only to yield levels, but also to how that yield is generated and whether the underlying mechanism is sustainable.
For BitGW, this supports a “cooperation rather than extraction” narrative: the platform grows with liquidity, and liquidity providers grow alongside the platform.
Why Single-Sided AMMs May Matter More Going Forward
As crypto infrastructure evolves, the industry is moving beyond the earliest generation of AMMs. The question is no longer only whether AMMs work, but which models are better suited for broader adoption.
Single-sided designs are gaining attention because they reduce friction, simplify participation, and integrate more naturally with hybrid exchange environments. For platforms seeking both scalability and usability, this approach may prove more practical than traditional dual-token systems alone.
BitGW’s multi-year operation of a single-sided AMM model points in this direction. It suggests that the future of liquidity may not lie in choosing between centralized and decentralized systems, but in combining them in ways that are more efficient, more accessible, and more aligned with participant interests.
About BitGW
BitGW is a digital asset trading platform focused on developing advanced liquidity infrastructure and delivering efficient trading solutions for global users. The platform has also emphasized compliance and regulatory alignment in earlier updates to its AML and KYC framework.
The post BitGW’s Single-Sided AMM Model Highlights a More Collaborative Direction for Crypto Liquidity appeared first on BeInCrypto.


The crypto market fell 2% to $2.42 trillion after U.S. President Donald Trump said Iran’s proposal to end the war was not enough and warned that Tehran must reopen the Strait of Hormuz by the deadline or face strikes on key infrastructure.
Summary
- Crypto market cap fell 2% to $2.42 trillion after Donald Trump rejected Iran’s ceasefire proposal and warned of strikes if Hormuz is not reopened.
- Iran declined a 45-day ceasefire push while demanding sanctions relief and war compensation, as a Tuesday deadline for U.S. action approaches.
- Bitcoin pulled back below $69K and major altcoins slipped 1–2% as traders turned cautious ahead of potential escalation or de-escalation.
In a sternly worded statement, Trump warned that an Iranian proposal to end the ongoing war in the Middle East is “not enough” to call off his strikes against Iranian infrastructure unless Tehran commits to settling its disputes by reopening the Strait of Hormuz.
“It’s a significant proposal. It’s a significant step. It’s not good enough, but it’s a very significant step,” Trump told reporters. He added that intermediaries “are negotiating now”.
The Strait of Hormuz, which is a strategic gateway for global energy supplies, was effectively blocked as a result of Iran’s attacks in the Gulf region after U.S. and Iranian forces clashed. This has led oil prices to skyrocket and has sparked widespread fears of runaway inflation hurting both crypto and traditional markets.
Trump said the Tuesday deadline for U.S. attacks on Iranian infrastructures would continue to be set in motion unless Iran accepts a deal to reopen the strait, allowing free trade in the region.
Earlier on Monday, Pakistan had put forward a 45-day ceasefire proposal after weeks of trying to broker a diplomatic solution to the war between Iran and the U.S. and Israel.
Iran had reportedly rejected the proposal while pushing for a permanent end to the war. Other demands made by the Iranian government include the removal of sanctions from the central bank and compensation for wartime damages incurred.
While the U.S. government has reviewed the proposal, Trump has so far refused to blink, with war continuing as of press time. Trump has reportedly reiterated that the deadline for compliance still stands at 8 pm Washington time on Tuesday. If Iran fails to agree to a deal, the U.S. could bomb Iran ‘back to the stone ages’.
The crypto market rose to a peak of $2.47 trillion on Monday as reports of Iran considering a proposal to bring a permanent end to the war first surfaced. Investors took this as a sign of de-escalation of the war situation.
However, after Trump confirmed that the U.S. would go forward with its strikes, the market tanked back to $2.43 trillion, erasing some of the gains from the previous day as investors booked profits.
Bitcoin (BTC), the world’s largest crypto asset that is currently strongly influencing other crypto assets due to the war situation, rallied past the $70,000 psychological resistance on Tuesday. However, the asset has fallen back sharply, trading at $68,546 at press time.
Ethereum (ETH), BNB (BNB), XRP (XRP), and Solana (SOL) were down 1-2%, showing traders remain hesitant as they await more clarity about how the standoff ends today.
On one hand, a potential confirmation of peace or de-escalation of the current Middle East conflict could result in a jump in investor appetite for risk assets, thus benefiting cryptocurrencies.
On the other hand, if the U.S. carries forward with the strikes on Iran, it can result in a massive flight to safety and a deeper correction across the entire crypto market.
Disclosure: This article does not represent investment advice. The content and materials featured on this page are for educational purposes only.


Fresh capital flowed back into U.S. spot Bitcoin ETFs at the start of the week, with Monday delivering the strongest single-day inflow in over a month and a half.
Summary
- U.S. spot Bitcoin ETFs recorded $471.3 million in net inflows on Monday, the highest daily total in over six weeks.
- BlackRock and Fidelity led the inflows, with additional buying seen across Ark 21Shares, Grayscale, Bitwise, and VanEck products.
Data from SoSoValue showed that the group of funds pulled in $471.3 million in net inflows, spread across six issuers.
BlackRock’s IBIT led the day with $181.9 million, followed by Fidelity’s FBTC, which brought in $147.3 million. Meanwhile, ARK Invest and 21Shares’ ARKB added another $118.7 million. Additional inflows were also recorded across products tied to Grayscale, Bitwise, and VanEck.
Monday’s figure stands as the highest daily intake since Feb. 25, when net inflows reached $506 million. The rebound effectively erased the $173.7 million in net outflows recorded on April 1, signaling a quick turnaround in investor positioning.
Beyond Bitcoin, spot Ethereum products also recorded $120.2 million in net inflows, which marked the highest daily total since the middle of March.
According to market pundits, these inflows could continue to offer structural support for Bitcoin and help it move beyond its current range. However, the ongoing macro uncertainty could pressure price action and limit any sustained upside.
Tensions between the United States and Iran have stretched into a second month, with no clear path toward de-escalation. Donald Trump has set an April 7 deadline for Iran to reopen the Strait of Hormuz, a critical route that has remained shut for weeks and contributed to rising global oil prices.
Trump warned of a “complete demolition” of Iran’s power plants and bridges if the demand is not met, a statement that has added to concerns around further escalation.
For now, Bitcoin is expected to remain sensitive to macro conditions. If tensions in the Middle East cool, it could help spur a return of risk-on sentiment.
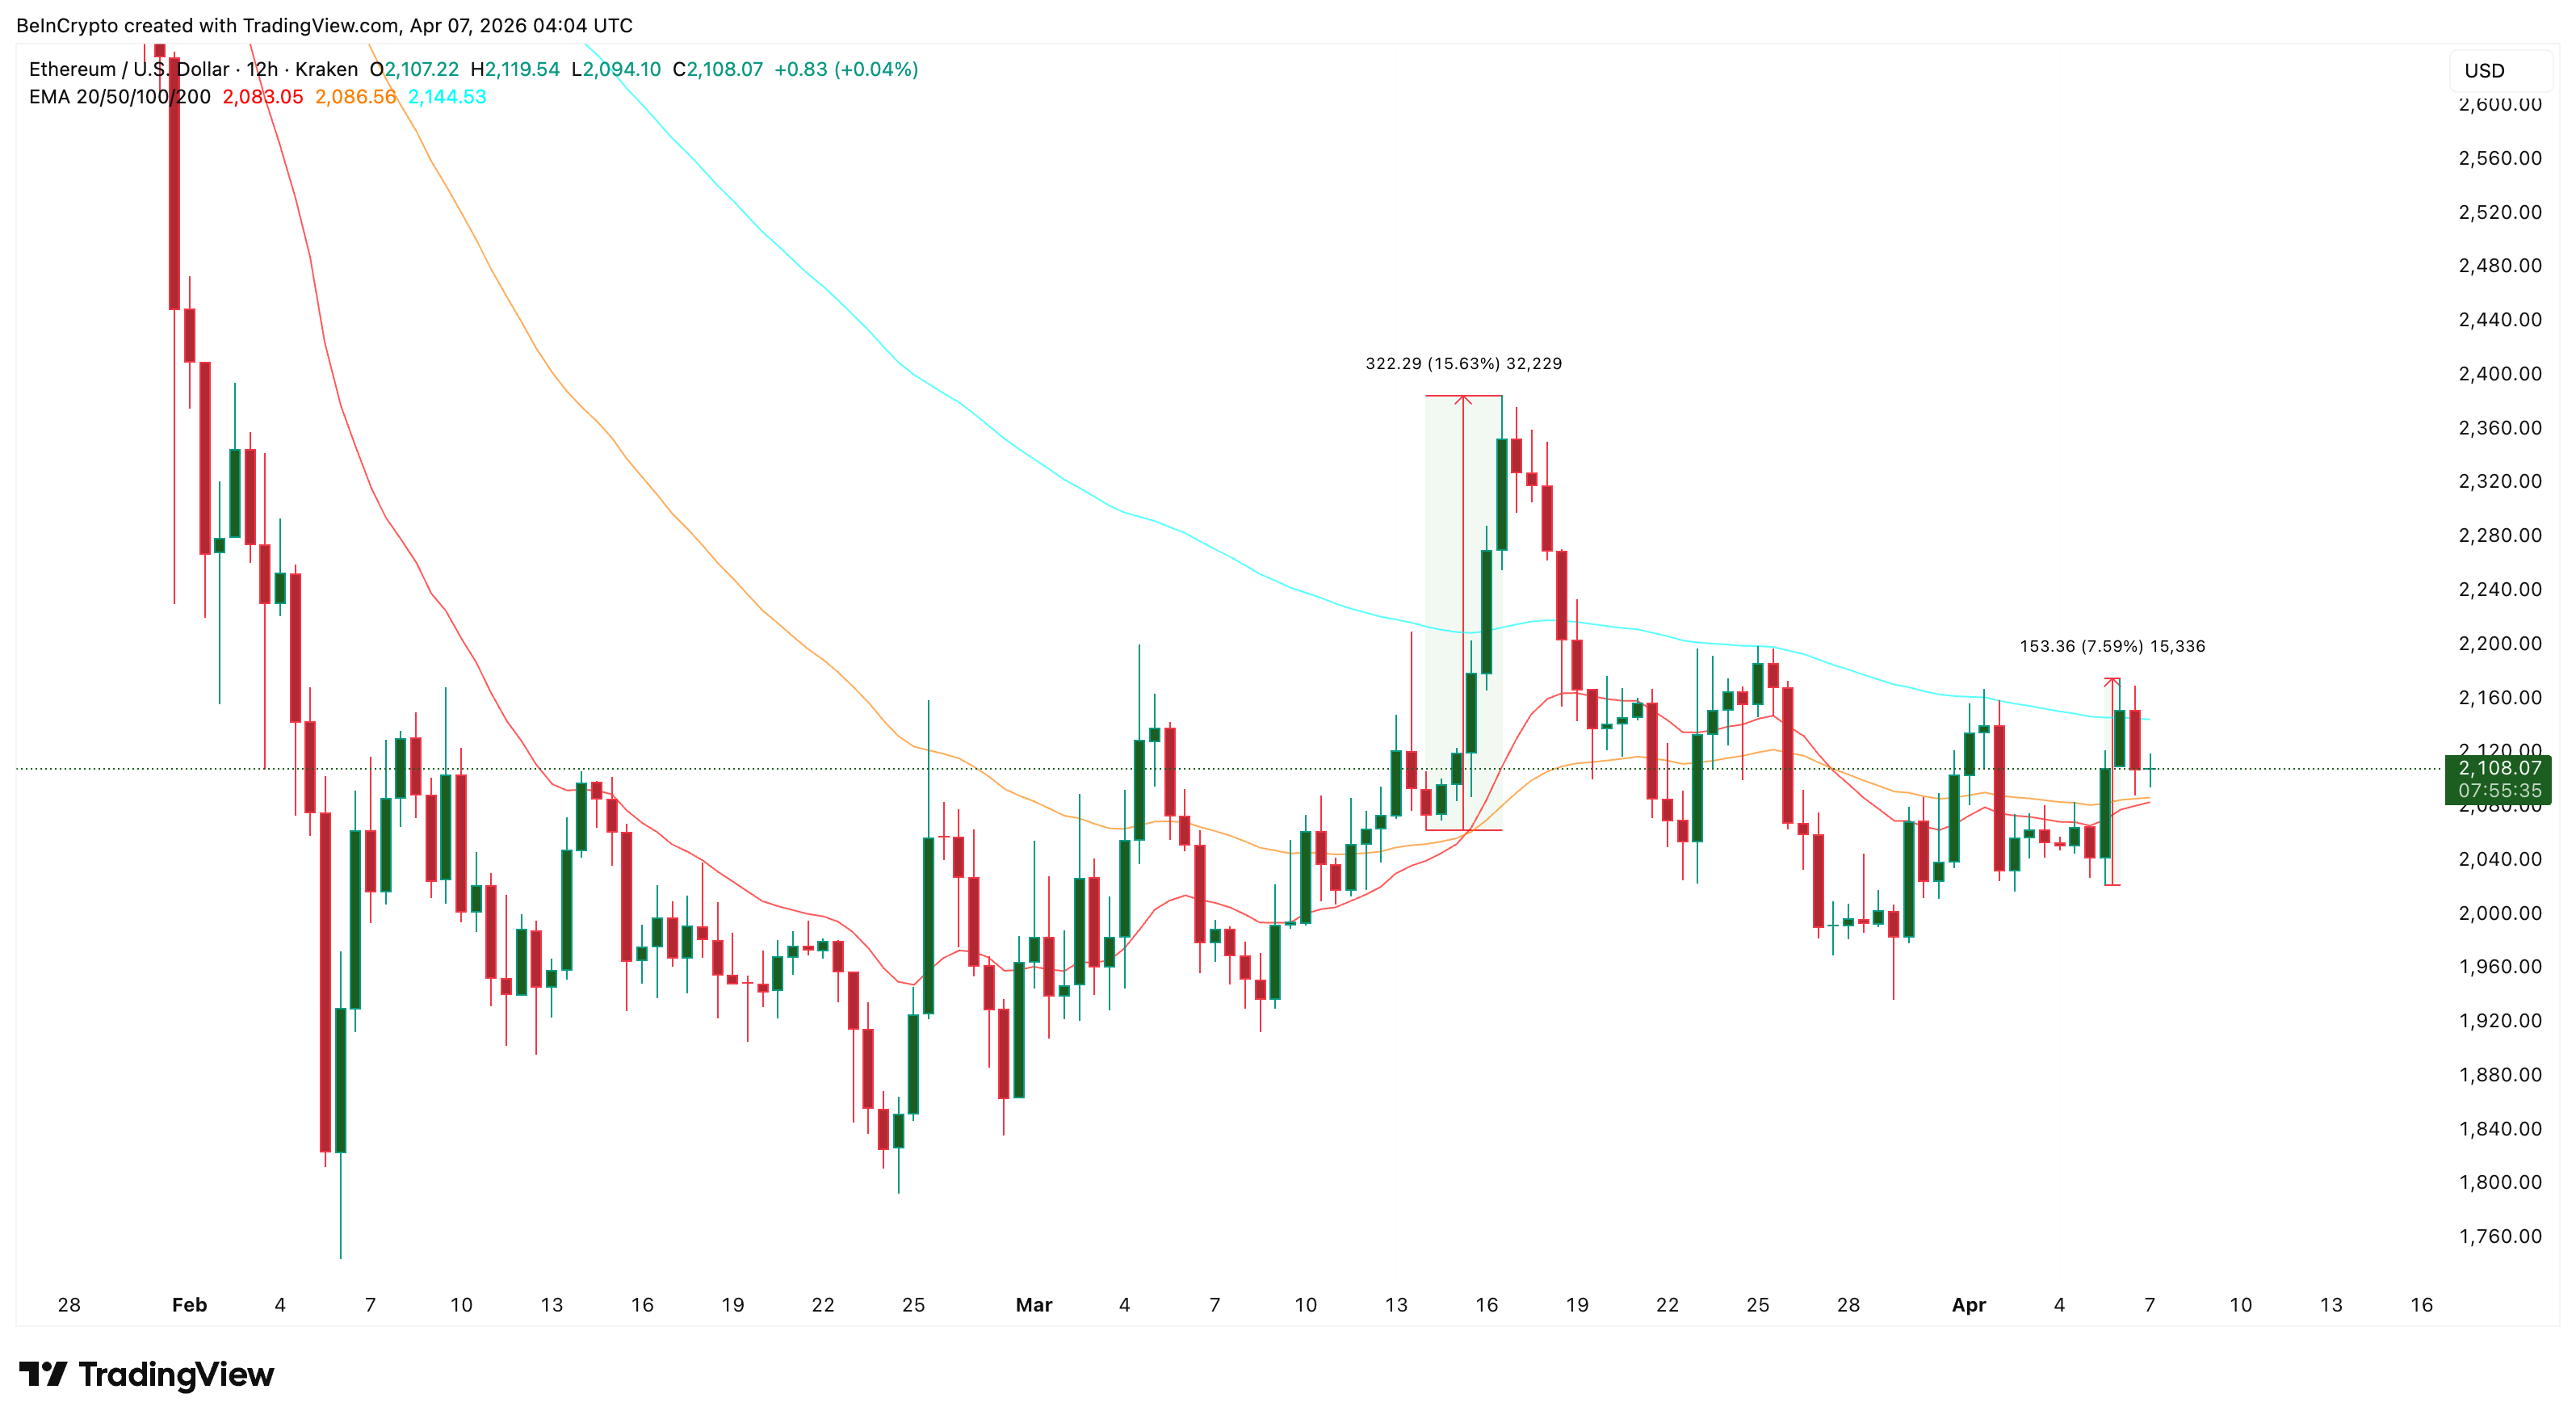
Ethereum (ETH) price trades at $2,108 on the 12-hour chart on April 7, down approximately 1% over the past 24 hours. The headline move looks unremarkable. However, four separate metrics across the technical, derivatives, and on-chain layers are converging toward the same conclusion, and none of them are pointing down.
The last time something similar happened, at least on the technical front, Ethereum price rallied 16%. Whether history repeats depends on a handful of levels that are now within striking distance.
Two Technical Triggers Are Converging on the 12-Hour Chart
The first metric is the Exponential Moving Average (EMA) structure, a trend indicator that gives greater weight to recent price action. On the 12-hour chart, the 20-period EMA at $2,083 is closing in on the 50-period EMA at $2,086. When the faster EMA crosses above the slower one, it forms a bullish crossover that typically signals a shift in short-term momentum.
This exact setup started building in mid-March. The crossover started forming around mid-March, and Ethereum price subsequently rallied 15.63%. In the process, it even reclaimed the 100-period EMA. The same structure is forming again. Since April 5, prices have already moved up 7.59%, and the 20 and 50 EMAs are now within $3 of each other. The 100-period EMA sits at $2,144, and a confirmed crossover would bring that level into immediate focus.
Want more token insights like this? Sign up for Editor Harsh Notariya’s Daily Crypto Newsletter here.
The second metric is the Relative Strength Index (RSI), a momentum oscillator. Between March 19 and April 6, price made a lower low on the 12-hour chart while RSI made a higher low.
That standard bullish divergence suggests selling momentum is fading even as price tested lower levels. The divergence remains intact as long as Ethereum price holds above $2,086. A break below that level would not destroy the broader lower low structure but would invalidate the most recent swing as a confirmed low until it resets.
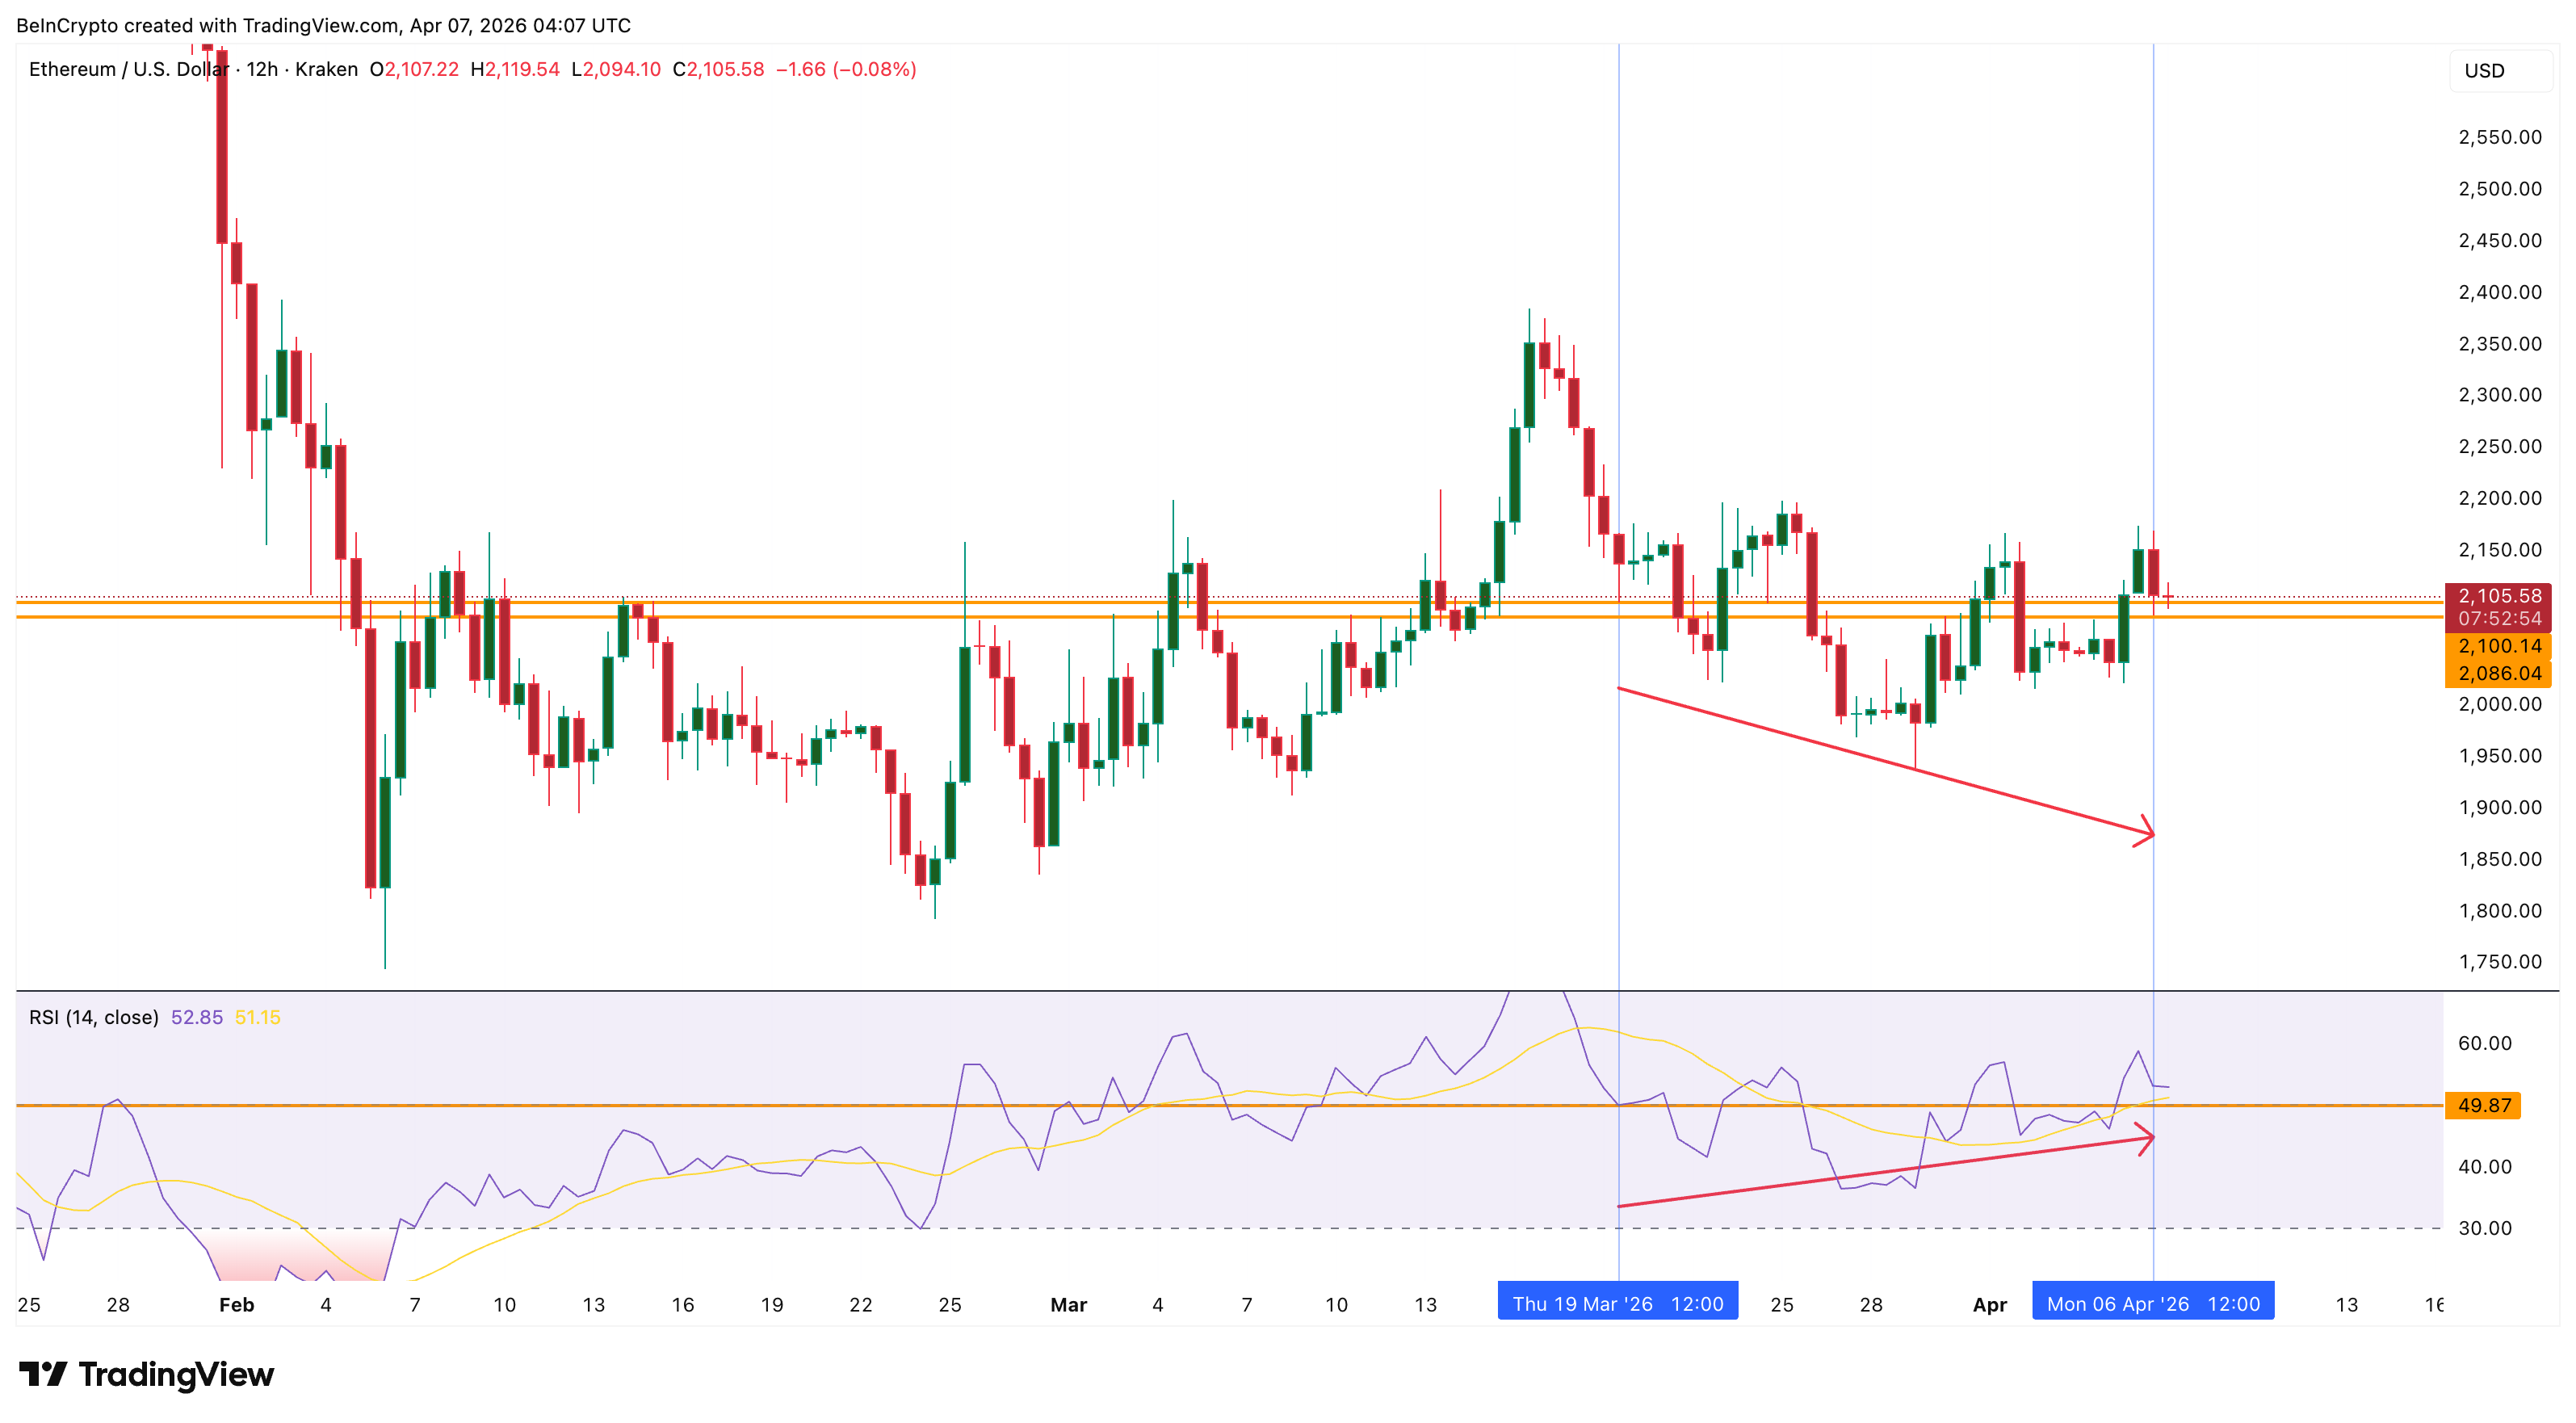
Together, the EMA convergence and RSI divergence form the technical foundation for a potential bounce. However, technical patterns alone do not move prices. The derivatives and on-chain data reveal whether the fuel exists to power the move.
Shorts Are Piling In and Whales Are Not Selling
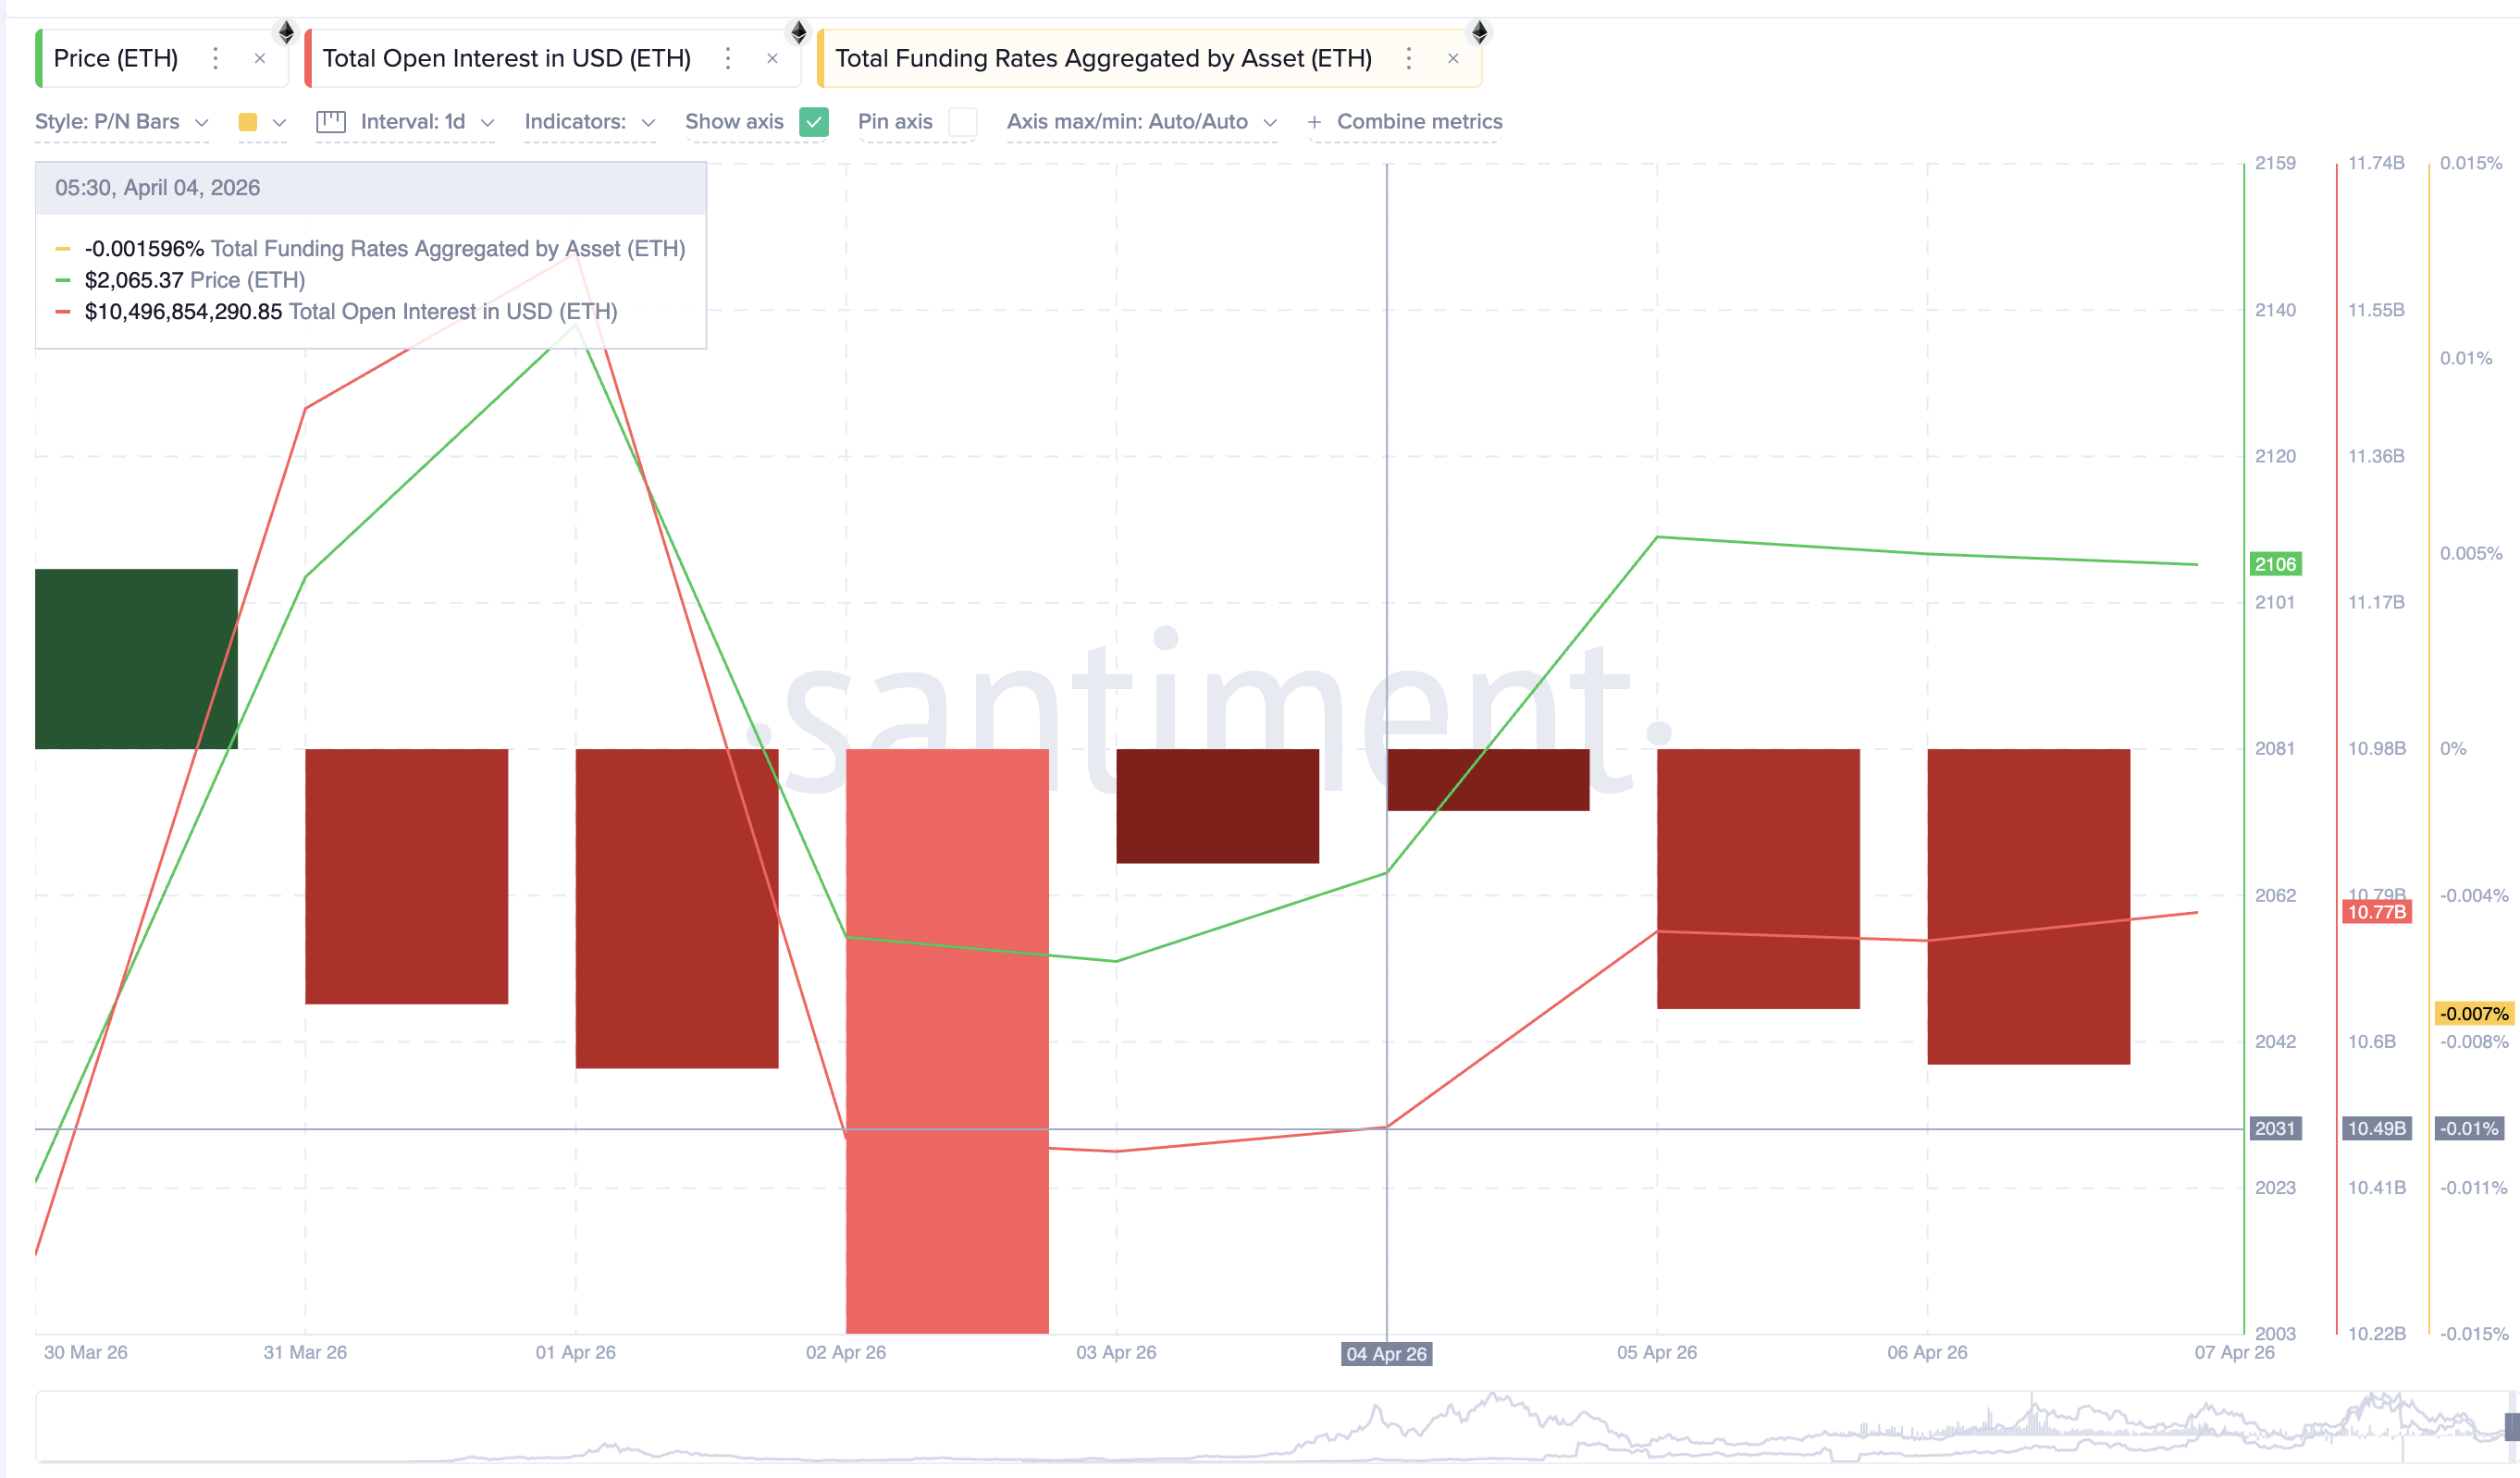
The third metric comes from the derivatives market. On April 4, total open interest for Ethereum stood at $10.49 billion with a funding rate of approximately -0.0015%. By April 7, open interest had risen to $10.77 billion while the funding rate dropped further to -0.007%.
Rising open interest combined with an increasingly negative funding rate means one thing. Traders are opening new short positions. That buildup of short exposure creates contrarian fuel because if price moves against them, the shorts must buy to close their positions, accelerating the rally through a short squeeze.
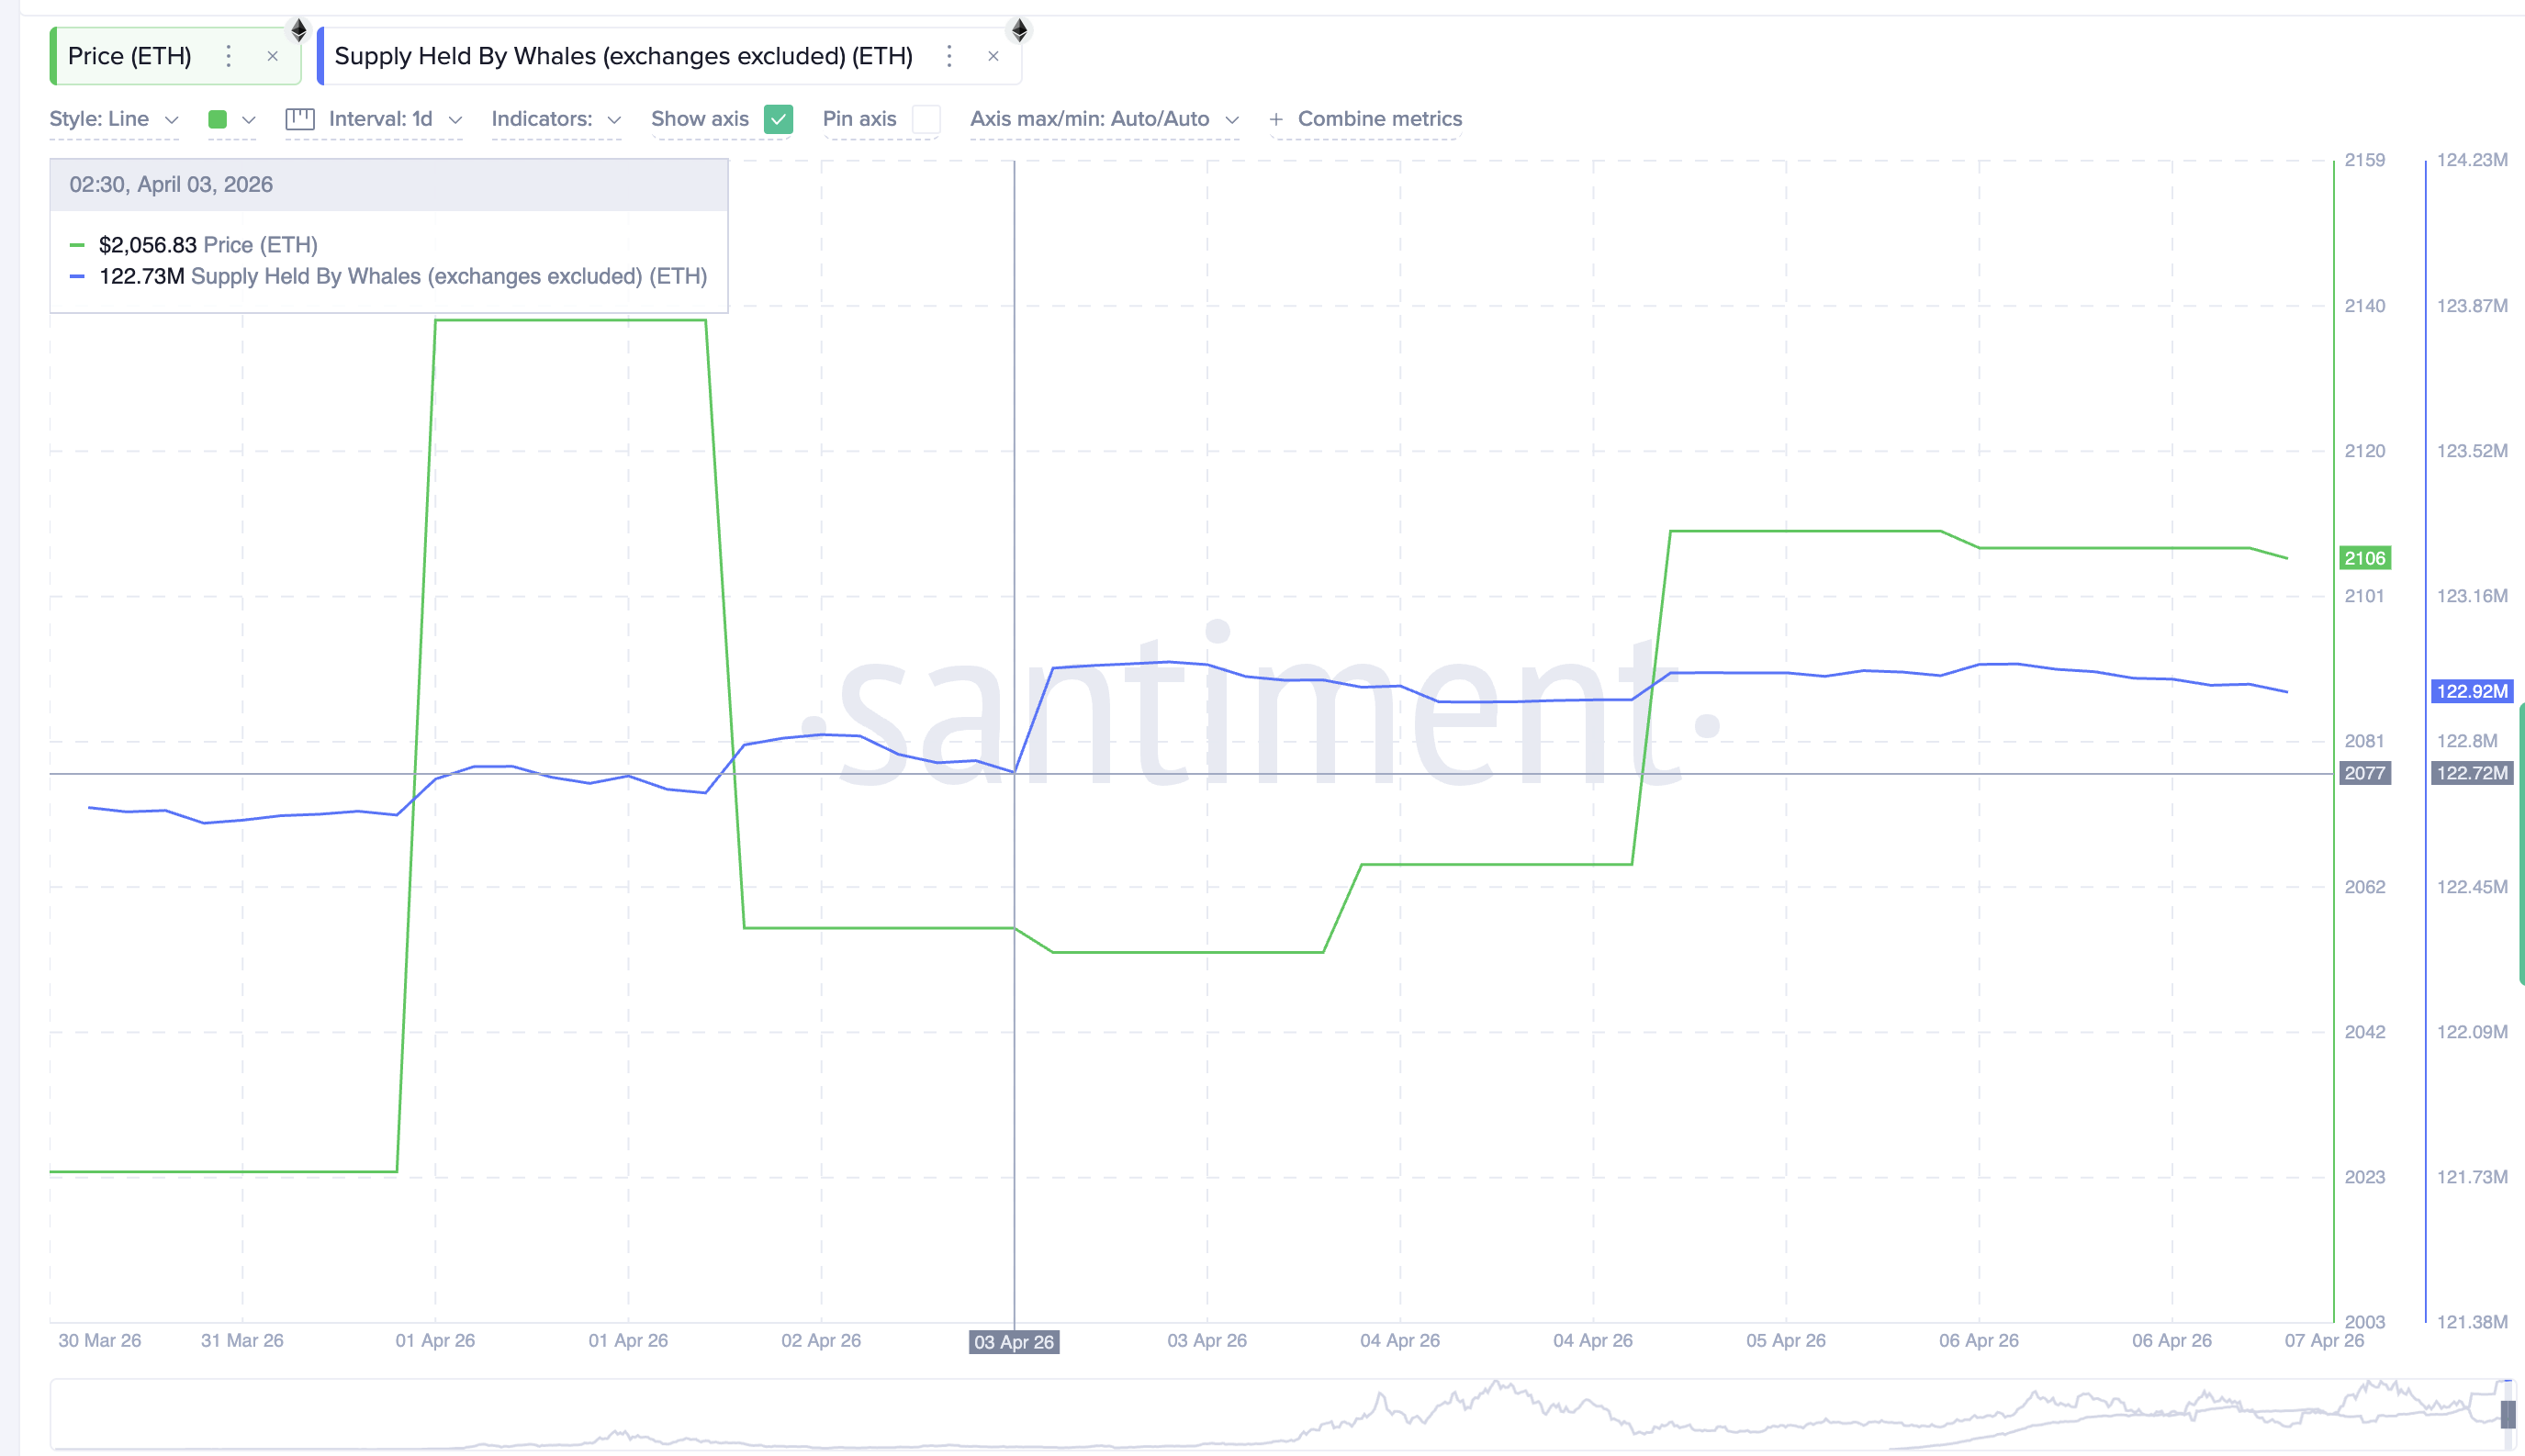
The fourth metric is whale behavior. Since April 3, whale wallets (excluding exchanges) have increased their holdings from 122.73 million to 122.92 million ETH. That addition of approximately 190,000 ETH or roughly $400 million represents steady accumulation rather than aggressive buying.
But the key point is that whales have not reduced their positions during the recent weakness. They are holding through the dip and adding incrementally, providing spot support that sits beneath the derivatives-driven short squeeze potential.
The technical setup provides the direction. The derivatives market provides the contrarian fuel. The whale accumulation provides the spot floor. All four metrics are aligning toward the same outcome, which makes the price levels the final arbiter.
Ethereum Price Levels That Decide If the Bounce Delivers
The 12-hour chart with technical levels from the completed swing frames every critical level.
The first hurdle is $2,116 at the 0.382 level. A 12-hour close above this would place Ethereum price back above the zone where the EMA crossover would likely confirm, adding momentum to the move. Above that, $2,172 is the most important resistance. This level has rejected price repeatedly since mid-March, and a clean break above it would represent the first meaningful shift in the short-term structure.
For the bounce to show genuine strength, Ethereum needs to reach $2,228 at the 0.618 level, a 5.77% move from current prices. A close above $2,228 would confirm that the four metrics translated into a real trend shift rather than another failed bounce.
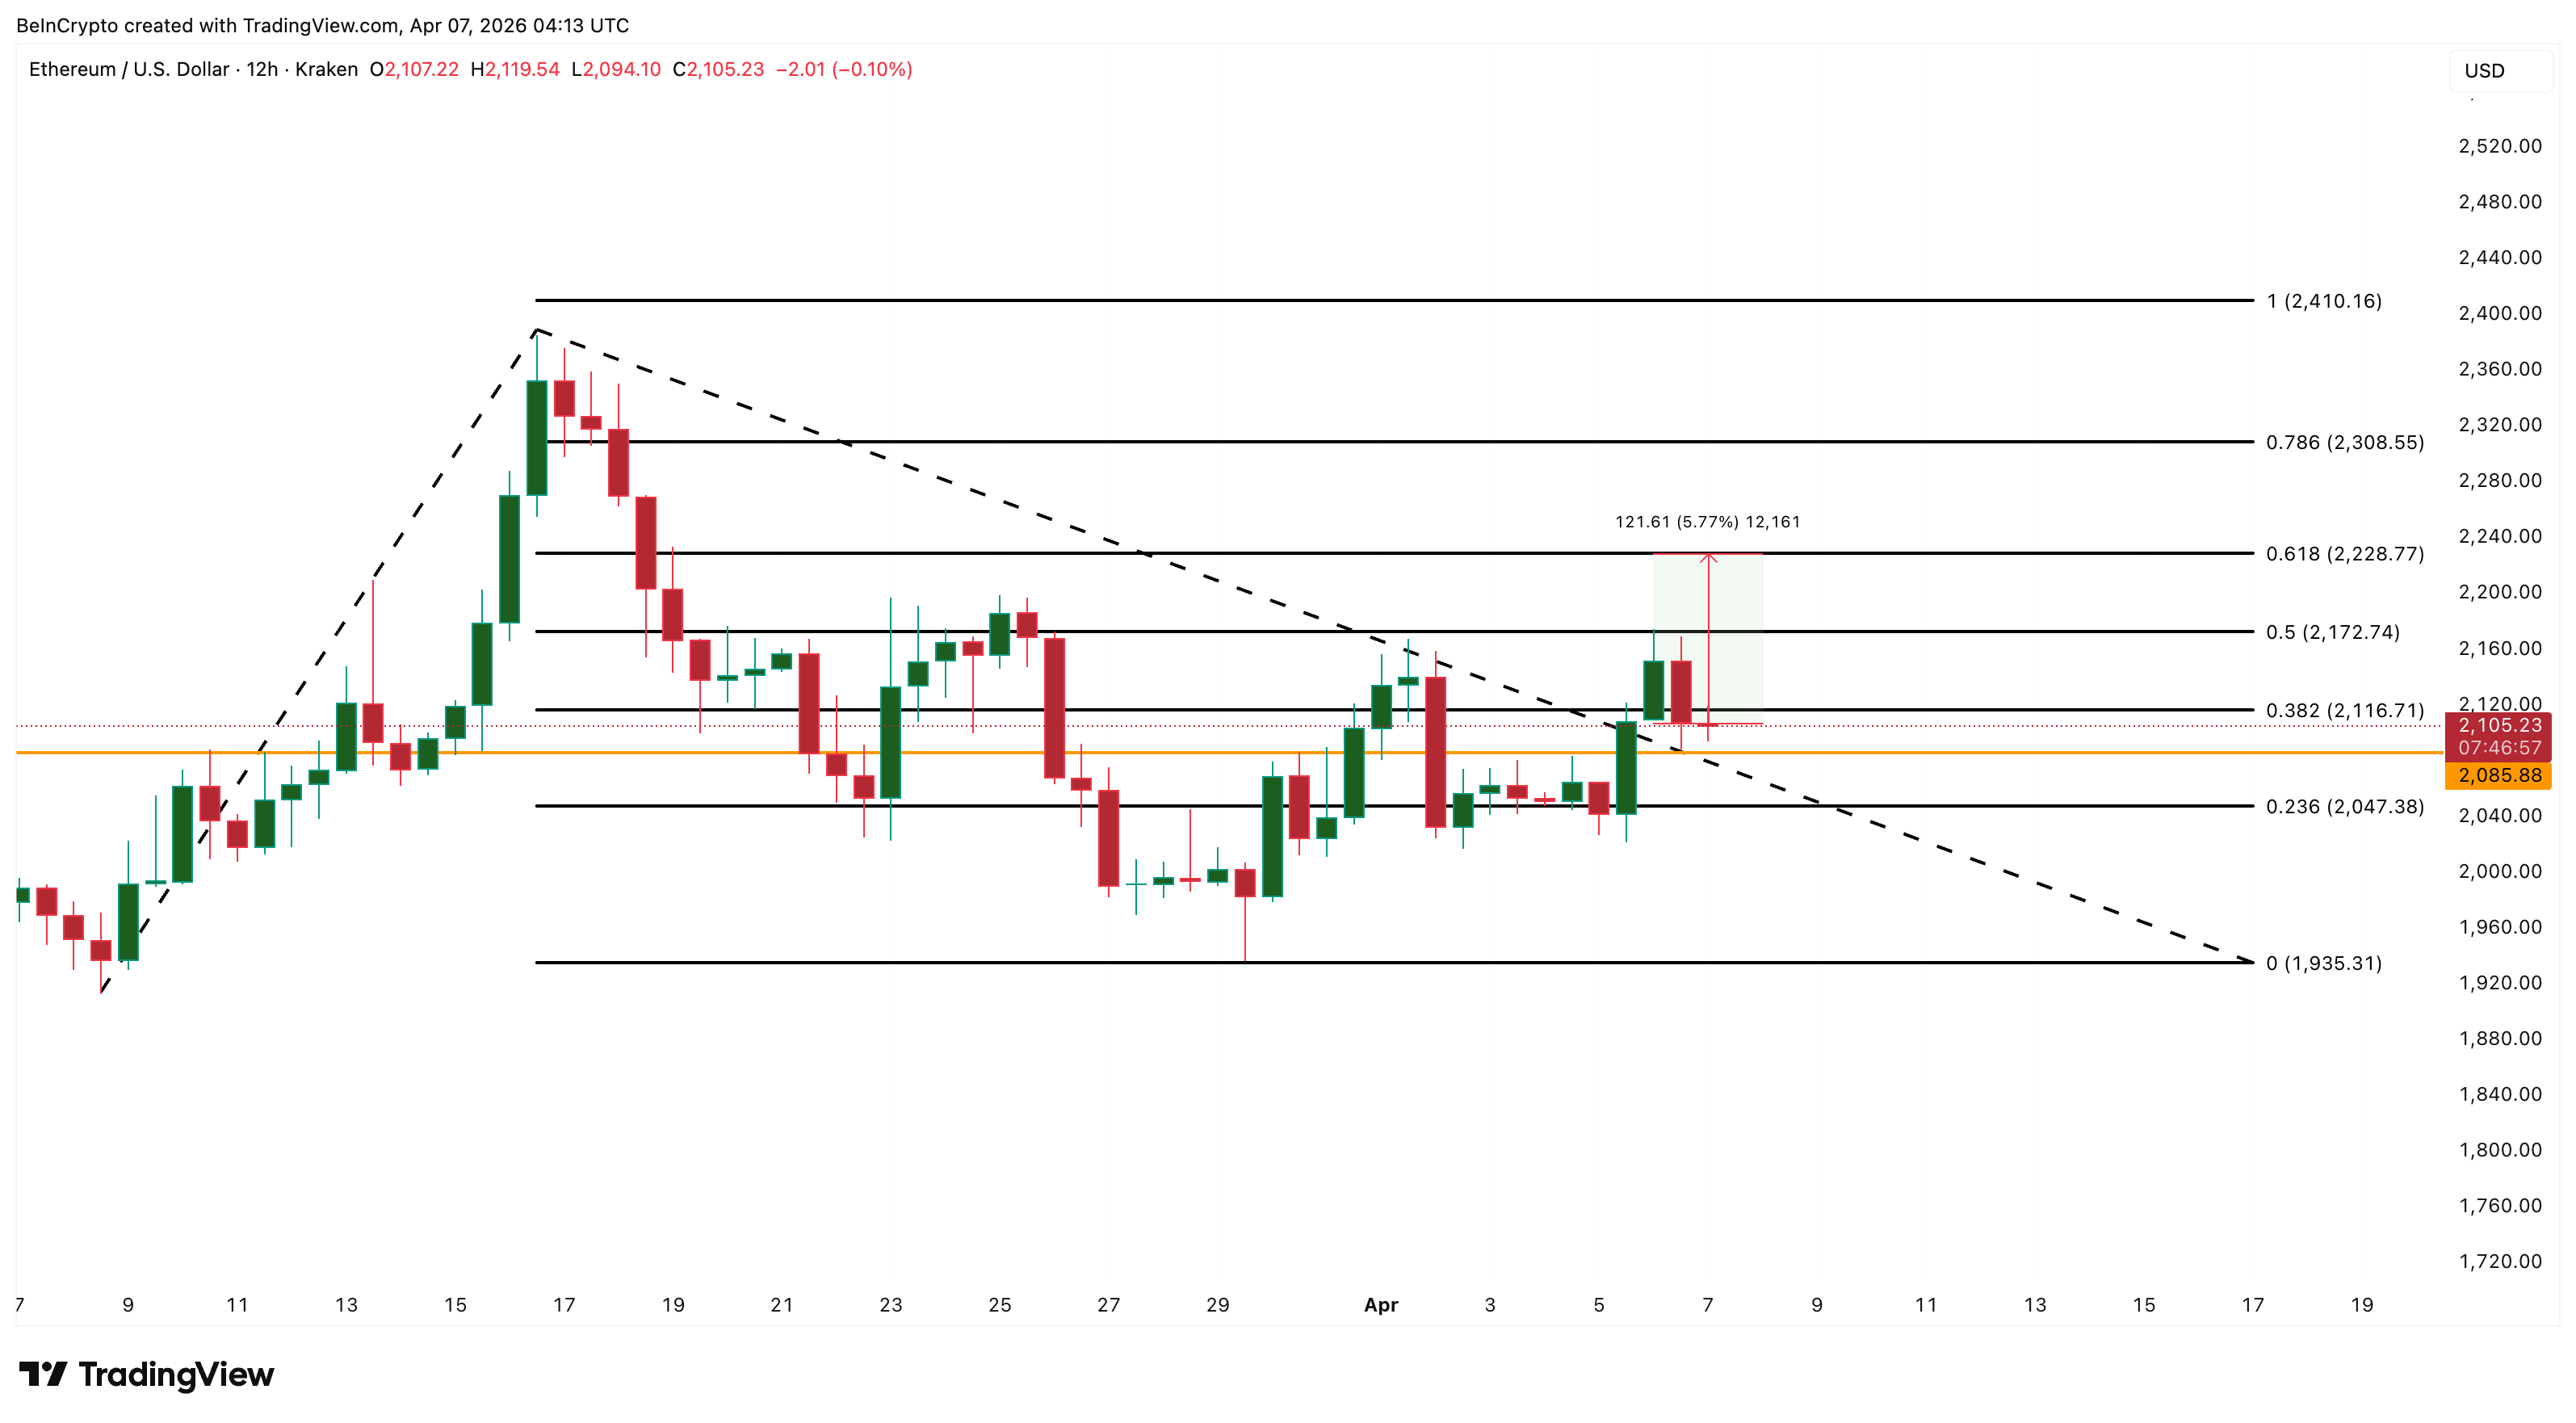
On the downside, $2,086 is the level that keeps the RSI divergence intact. Below that, $2,047 at the 0.236 level becomes the immediate floor. A break below $2,047 would expose $1,935 and suggest that the four converging metrics were not enough to overcome the broader bearish pressure.
A 12-hour close above $2,172 would confirm the bounce thesis that all four metrics are building toward. And for now, a failure to hold $2,086 would delay the setup and leave Ethereum price vulnerable to a retest of $1,935.
The post Ethereum Price Corrects but 4 Metrics Are Quietly Building a Bounce Case appeared first on BeInCrypto.


Artificial intelligence is set to reshape banking, according to Jamie Dimon, who used his latest shareholder letter to outline how deeply the technology is expected to embed itself across JPMorgan Chase.
Summary
- AI is expected to reshape nearly every function at JPMorgan, with adoption likely to move faster than past technological shifts.
- The bank plans to increase technology spending to about $19.8 billion in 2026, with a significant share directed toward AI and supporting infrastructure.
“The importance of AI is real, and while I hesitate to use the word transformational—it is,” Dimon wrote, adding that adoption could move far faster than past innovations such as electricity or the internet.
Unlike those technologies, which took decades to scale, AI deployment “looks likely to accelerate over the next few years.”
Across JPMorgan, the integration effort is already underway, supported by rising technology investment. The bank expects to spend roughly $19.8 billion on technology in 2026, including artificial intelligence, data systems, and cloud infrastructure, according to a report by Business Insider. This figure builds on earlier commitments, with Dimon noting the firm had been allocating about $2 billion annually to AI initiatives as of late 2025.
“AI will affect virtually every function, application, and process in the company,” Dimon said, pointing to long-term gains in productivity.
He also tied the technology’s reach to broader economic and scientific progress, writing that it could help “cure some cancers, create new composites, and reduce accidental deaths,” alongside other improvements in quality of life.
“We will not put our heads in the sand,” Dimon wrote. “We will deploy AI, as we deploy all technology, to do a better job for our customers (and employees).”
Dimon also flagged threats tied to deepfakes, misinformation, and cybersecurity vulnerabilities, warning that missteps in handling the technology could carry lasting consequences.
“These risks are real, but they are manageable if companies, regulators, and governments prepare,” he wrote, cautioning against both overregulation after early failures and complacency in the face of emerging threats.
“The worst mistakes we can make are predictable: overreact at the first serious incident and regulate out important innovation, or underreact and fail to learn from what went wrong.”
He added that effective oversight would require preparation ahead of time and “discipline to fix what’s broken without destroying what works.”
AI could take away jobs
Besides the operational gains, AI’s effect on employment remains a central concern.
“AI will definitely eliminate some jobs, while it enhances others,” he wrote, adding that JPMorgan plans to redeploy affected workers where possible.
Demand for skilled labor, particularly in areas such as cybersecurity and AI development, remains strong, even as routine tasks become more automated.
Concerns about job displacement have grown across the industry. Anthropic CEO Dario Amodei warned earlier this year that advances in AI could remove up to half of entry-level professional roles within five years.
“I have engineers within Anthropic who say, ‘I don’t write any code anymore. I just let the model write the code, I edit it,’” he said at the time. “We might be six to 12 months away from when the model is doing most, maybe all, of what [software engineers] do end-to-end.”
Meanwhile, OpenAI recently called on governments to prepare for economic disruption tied to automation, urging new approaches to taxation, worker protections, and social support systems as AI adoption expands.

The US-Iran war has evolved beyond an energy crisis into a multi-front economic shock, with at least six simultaneous crises potentially threatening global financial stability.
Analyst Crypto Rover flagged the convergence of threats, arguing that the market is “heading towards an everything crisis.”
1. Food Crisis Brewing
The analyst noted that hedge funds have turned net bullish on wheat for the first time since June 2022. The Strait of Hormuz blockade has disrupted roughly 30% of the global seaborne fertilizer trade, sending urea prices up by about 50% since the war began.
With the planting season underway, AI analytics firm Helios warned that global food prices could rise 12% to 18% by the end of 2026.
2. Japanese Bond Market Stress
Meanwhile, Japanese bond yields continue hitting multi-decade highs, a pattern that the analyst says has historically preceded broader market crashes.
3. Private Credit Market Warning
Stress is also compounding in the private credit sector. BeInCrypto reported that many firms, including Blue Owl, BlackRock, and Apollo, have capped withdrawals amid rising redemption requests.
JPMorgan CEO Jamie Dimon has also warned that “losses on all leveraged lending in general will be higher than expected, relative to the environment.”
4. Subprime Loan Delinquencies Rising
Subprime loan delinquency rates have climbed to 10% of total outstanding debt, the highest level in 11 years, according to the Kobeissi Letter.
The rate has more than tripled since 2021, drawing comparisons to the Global Financial Crisis.
“The delinquency rate peaked at ~19% during the 2008 Financial Crisis, when subprime debt was $3.5 trillion and made up ~30% of total household debt. Today, subprime debt stands at $2.7 trillion, or ~15% of the total, still a significant proportion. An increasing number of Americans are falling behind on their debt,” the post read.
5. Growing Stagflation Signals
The surging oil prices have sparked concerns about inflation and even a potential recession. US consumer inflation expectations surged to 6.2% in March. This marked the highest reading since August 2025.
In addition, Saudi Arabia’s Aramco will increase its Arab Light crude price for May sales to Asia at a premium of $19.50 per barrel over benchmarks, according to Bloomberg.
“The expectations for inflation are going up globally. Today, Saudi Arabia sets record-high oil prices for Asia. This is a classic Stagflation case, and it ends up very badly for the economy,” Crypto Rover added.
6. Aluminum Crisis From Iran Strikes
Lastly, an industrial crisis is also shaping up. Iranian strikes on Gulf aluminum plants have pushed prices up more since the conflict began.
Emirates Global Aluminum (EGA) warned that full recovery at its Al Taweelah facility could take up to 12 months.
“Al Taweelah is one of the largest smelters in the world, producing 1.6 million tons of cast metal in 2025, or ~2.3% of global output. The Middle East now represents ~9% of global aluminum production, but the impact is amplified because constraints elsewhere have already eroded inventories, leaving the market with little buffer. Aluminum is used in everything from airplanes to food packaging and solar panels, meaning disruptions ripple far beyond the metals market,” Global Markets Investor reported.
Whether a ceasefire materializes may determine if these parallel crises remain contained or converge into something far larger.
Subscribe to our YouTube channel to watch leaders and journalists provide expert insights
The post 6 Crises Threaten to Cripple the Global Economy Amid Iran War appeared first on BeInCrypto.

There was a time when blockchains acted like isolated kingdoms—each with its own rules, fees, and limitations. If you wanted to build or transact, you had to pick a side.
That era is quietly ending.
We’re entering a new phase where blockchains are no longer monolithic systems, but modular, interchangeable components—and AI is the operator pulling the strings.
From Monoliths to Modular Systems

Traditional chains like Ethereum historically tried to do everything:
- Execute transactions
- Store data
- Reach consensus
- Settle finality
All in one place.
That’s like asking one machine to be a factory, warehouse, and logistics network at the same time. It works… until it doesn’t scale.
Modular blockchain design flips this model:
- Execution layers handle smart contracts (e.g., rollups)
- Data availability layers store and verify data (e.g., Celestia)
- Settlement layers finalize transactions (often still Ethereum)
Each layer specializes. Each layer competes.
And most importantly, they can be swapped.
Enter AI: The Ultimate Chain Router
Now plug AI into this modular stack—and things get interesting.
Instead of you deciding which chain to use, AI agents will:
- Scan multiple chains in real time
- Compare gas fees, latency, and liquidity
- Route transactions to the most efficient path
Think of it like Google Maps—but for value transfer.
You don’t ask:
“Should I use Arbitrum or Optimism?”
Your AI agent already decided—based on cost, speed, and success probability.
Gas Fees Become a Solved Problem
For years, gas fees have been one of crypto’s biggest friction points.
But in a modular + AI world:
- Fees are no longer static
- Networks become interchangeable
- Optimization becomes automatic
Gas stops being a user problem
…and becomes an AI optimization problem
Bots will:
- Batch transactions
- Time execution windows
- Arbitrage fee differences across chains
The cheapest route wins—every time.
Blockchains Won’t Compete—They’ll Be Selected
Here’s the uncomfortable truth for chain maximalists:
Users won’t be loyal. AI won’t be emotional.
In a plug-and-play economy:
- Blockchains are just infrastructure
- Liquidity flows where conditions are best
- AI chooses the “best chain” per transaction
This flips the competitive landscape:
From:
- Ecosystems fighting for users
To:
- Protocols competing for AI preference
If your chain is slower or more expensive, AI simply routes around you.
The Plug-and-Play Economy
This is where everything converges.
We’re moving toward a world where:
- Developers assemble blockchain stacks like APIs
- AI agents orchestrate execution behind the scenes
- Users interact with simple interfaces, unaware of the complexity underneath
It’s not “multi-chain.”
It’s a chain-abstracted reality.
What This Means Going Forward
- User experience becomes invisible
You won’t think about chains—just outcomes - AI agents become economic actors
They don’t just assist—they decide - Efficiency becomes the ultimate moat
Chains win by being optimal, not popular - Liquidity becomes fluid and dynamic
Capital moves at machine speed
Final Opinion
“Blockchains won’t compete. AI will choose between them.”
And when that happens, the winners won’t be the loudest ecosystems—
They’ll be the ones that machines quietly prefer.
Welcome to the plug-and-play economy.
REQUEST AN ARTICLE
Chaos Labs has terminated its risk management engagement with Aave (AAVE) after three years, citing unsustainable economics and disagreements over how V4 should be managed.
The departure marks the latest in a string of core contributor exits from Decentralized Finance’s (DeFi) largest lending protocol, which holds over $24 billion in total value locked.
Chaos Labs Walks Away From Aave After 3 Years of Risk Management
Chaos Labs founder Omer Goldberg outlined three factors behind the decision.
- Key V3 contributors had already departed, doubling the workload
- Aave V4 introduced an entirely new architecture that expanded operational and legal burdens.
- Despite a proposed $5 million budget, the firm said it would still operate at a loss.
“The engagement no longer reflects how we believe risk should be managed,” Goldberg explained.
Goldberg compared Aave’s risk spending to banking benchmarks. He noted Aave generated $142 million in revenue in 2025.
The firm’s $3 million budget represented roughly 2% of that figure, well below the 6% to 10% banks typically allocate to compliance and risk.
Aave Responds and LlamaRisk Steps In
Aave founder Stani Kulechov acknowledged the departure but pushed back on parts of the narrative.
He revealed Chaos Labs had sought to become the sole risk manager and replace Chainlink price oracles with its own product across new deployments.
Aave Labs rejected both proposals to avoid vendor lock-in.
DeFi risk management firm LlamaRisk, which works with Aave, among other major protocols like Curve and Ethena, pledged full operational continuity. The firm said it would present a detailed transition proposal within the week.
Meanwhile, analyst Duo Nine questioned Aave’s priorities, pointing out that V3 still holds over $24 billion while leadership focused discussions on $10 million in V4 deposits.
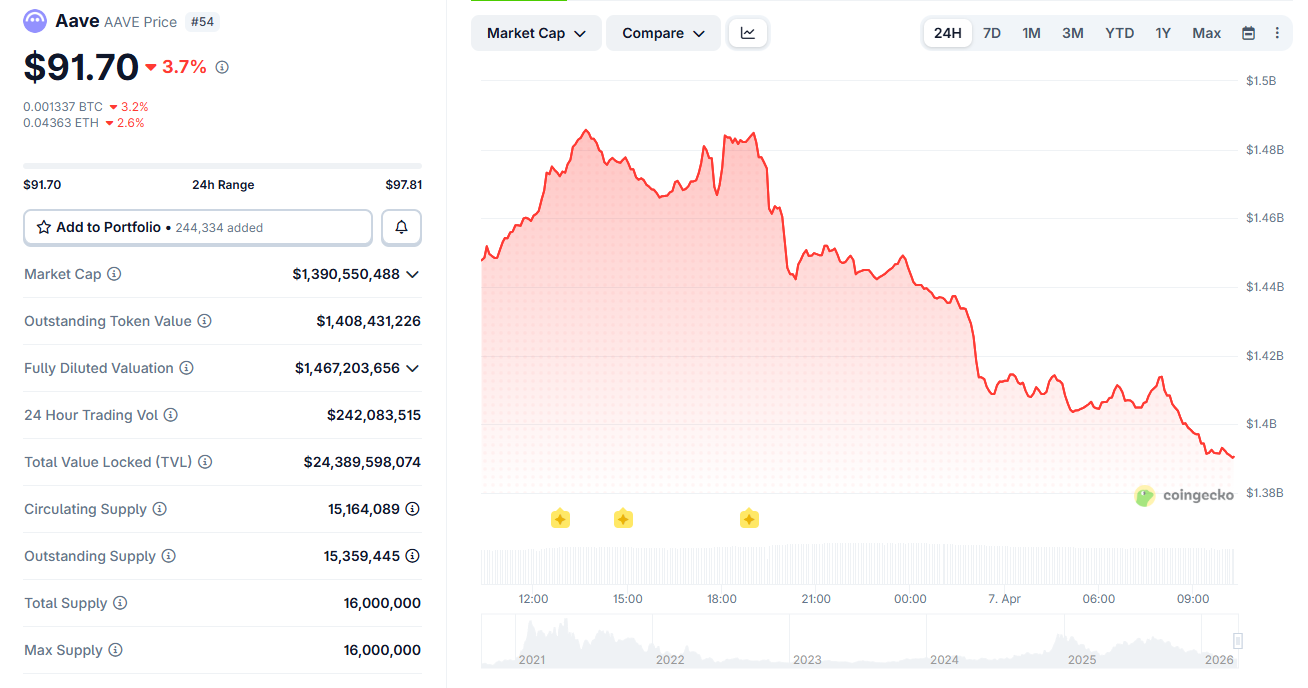
AAVE traded near $92 at the time of writing, down by almost 4% on the day. The token faces sustained selling pressure amid governance tensions and contributor departures, weighing on market sentiment.
The post Chaos Labs Wanted to Replace Chainlink on Aave: Why Stani Kulechov Said No appeared first on BeInCrypto.

Key Highlights
- Bitcoin retreated to $68,589 following a brief rally that evaporated after diplomatic setback, remaining confined within its established $65K–$73K trading corridor spanning six weeks
- A fleeting Monday surge resulted in $196.7 million worth of forced short position closures before Iran’s rejection of the ceasefire terms
- President Trump issued a Tuesday midnight ultimatum to Iran, warning of infrastructure destruction should negotiations collapse
- Crude oil prices jumped beyond $112 per barrel amid heightening geopolitical tensions, while Brent approached $115.66
- Equity index futures declined Tuesday morning despite Monday’s modest gains across the S&P 500, Nasdaq, and Dow Jones Industrial Average
The leading cryptocurrency fell back to $68,589 during Tuesday’s Asian session after optimism surrounding a potential diplomatic breakthrough quickly dissipated. The reversal coincided with President Trump’s establishment of a Tuesday evening cutoff time for Iran to agree to peace terms or confront military action.
A wave of optimism swept through markets Monday following an Axios report detailing a prospective 45-day ceasefire arrangement. The news momentarily propelled Bitcoin beyond the $69,000 threshold and forced the closure of $196.7 million in bearish positions. However, the positive momentum evaporated within approximately half a day.
Tehran subsequently declined the ceasefire framework communicated through Pakistani intermediaries. Iran’s counteroffer included demands for a complete cessation of hostilities, sanctions relief, financial assistance for rebuilding efforts, and guaranteed maritime security through the Strait of Hormuz.
Ether experienced a 1% decline to $2,104. Solana registered a 2.7% decrease to $79.75. XRP fell 1.6% to $1.32. Dogecoin declined 2.2% to $0.09. BNB remained relatively stable at $598.
“This move looks less like a shift in fundamentals and more like positioning getting caught offsides,” said Diana Pires, chief business officer at sFOX. Bearish sentiment had been building before the ceasefire headlines forced traders to unwind short positions quickly.
Energy Markets Spike Following Presidential Warning
The President issued stark warnings to Tehran, threatening to eliminate “every bridge in Iran” and render each power facility inoperable should negotiations fail by the Tuesday midnight threshold. Paradoxically, he simultaneously characterized discussions as progressing favorably.
🚨 President Trump: “Tuesday will be power plant day”
US futures -0.54%$SPY $QQQ #Iran pic.twitter.com/ylWFfvAp6c
— Crypto Seth (@seth_fin) April 5, 2026
US crude prices escalated above $112 per barrel. Brent futures traded approaching $115.66, representing a 2.9% session increase. Accelerating energy costs compound existing macroeconomic uncertainties.
Equity futures contracts weakened Tuesday morning in anticipation of the diplomatic deadline. S&P 500-linked contracts and Nasdaq 100 futures retreated 0.4% and 0.5% respectively. Dow futures registered approximately a 0.2% pullback.
Equity Markets and Economic Indicators Under Scrutiny
Notwithstanding Tuesday’s futures weakness, the previous session concluded on a positive trajectory. The S&P 500 climbed nearly 0.5%. The Nasdaq delivered comparable performance. The Dow Jones added over 160 points.
Maritime traffic through the strategic Strait of Hormuz demonstrated improvement this week, offering marginal relief. Chinese and Japanese ports welcomed the highest concentration of tanker arrivals, alleviating some supply chain concerns.
March services sector data for the United States revealed decelerating economic growth. Labor market indicators contracted at the most severe pace observed since 2023. Cost pressures intensified. The mixed signals provide limited guidance for Federal Reserve monetary policy deliberations.
Critical inflation metrics are scheduled for Friday release. Market participants are simultaneously monitoring preliminary February durable goods figures, expected Tuesday morning. Delta’s quarterly earnings announcement is anticipated Wednesday.
Trump posted on Truth Social urging Iran to reopen the Strait, and separately stated that “the American people would like to see us come home,” signaling possible pressure to wind down the conflict.
The flagship cryptocurrency has maintained its position within the $65,000 to $73,000 corridor throughout the duration of geopolitical tensions. Trump’s Tuesday midnight ultimatum will likely prove decisive in determining whether the upper or lower boundary faces near-term pressure.


Recently uncovered phone records point to multiple calls between Argentine President Javier Milei and a Libra-associated entrepreneur.
Summary
- Call records show Javier Milei spoke seven times with a Libra-linked entrepreneur around the timing of his promotional post on X.
- The Libra token surged after the endorsement before losing over 96% of its value.
Phone logs reviewed by prosecutors, and reported by The New York Times, indicate that Milei exchanged seven calls with an entrepreneur linked to the Libra token on the same night he posted about the cryptocurrency on X.
The calls reportedly took place both before and after the post went live, though investigators have not disclosed what was discussed.
Those findings appear to challenge Milei’s earlier insistence that he had no ties to the initiative.
At the time, he framed his involvement as limited to amplifying what he described as a private venture that would support Argentina’s economy.
“A few hours ago, I posted a tweet, like so many infinite other times, supporting an alleged private venture with which I obviously have no connection whatsoever,” Milei said in a statement on X following the fallout.
“I wasn’t aware of the details of the project, and after becoming aware of them, I decided not to keep promoting it,” he said at the time.
The Libra token briefly surged after Milei’s endorsement in February 2025, as he presented it as a tool to fund small businesses and startups. Momentum quickly reversed, with the token losing more than 96% of its value from peak levels.
However, as it fell, it wiped out roughly $251 million in investor funds and triggered accusations that the episode resembled a rug pull.
After the fallout Argentine lawyers filed fraud complaints against Milei, while some political figures called for impeachment proceedings. Under Argentine law, fraud convictions can carry prison terms ranging from one month to six years.
Federal prosecutors opened a formal investigation into the matter, naming Milei as a person of interest. The probe remains active, with authorities continuing to examine financial links, communications, and the role of individuals connected to the token’s launch.
Argentina’s Anti-Corruption Office concluded in June that Milei had not breached public ethics rules, determining that his post was made in a personal capacity rather than as head of state.
New details put Milei under scrutiny
More recent findings, however, have added another layer to the case.
A judicial update in March revealed that investigators had uncovered a draft document on the phone of crypto lobbyist Mauricio Novelli.
The note referenced a potential $5 million arrangement tied to the Libra promotion, drafted just three days before Milei’s post. The document did not specify who would receive the funds, leaving its purpose and beneficiaries unclear.
Gardeners rave over ‘amazing’ moss killer that makes lawns green ‘in a week’

Stellantis (STLA): Early Signs Of Turnaround With Product Momentum And Regulatory Relief
BitGW’s Single-Sided AMM Model Highlights a More Collaborative Direction for Crypto Liquidity


-

 NewsBeat5 days ago
Steven Gerrard disagrees with Gary Neville over ‘shock’ Chelsea and Arsenal claim | Football
-

 Business4 days ago
No Jackpot Winner and $194 Million Prize Rolls Over
-

 Fashion4 days ago
Weekend Open Thread: Spanx – Corporette.com
-

 Crypto World6 days ago
Gold Price Prediction: Worst Month in 17 Years fo Save Haven Rock
-

 Business1 day ago
Three Gulf funds agree to back Paramount’s $81 billion takeover of Warner, WSJ reports
-
Crypto World7 days ago
Dems press CFTC, ethics board on prediction-market insider trades
-

 Sports2 days ago
India men’s 4x400m and mixed 4x100m relay teams register big progress | Other Sports News
-

 Business3 days ago
Expert Picks for Every Need
-

 Business5 days ago
Login and Checkout Issues Spark Merchant Frustration
-

 Sports7 days ago
Tallest college basketball player ever, standing at 7-foot-9, entering transfer portal
-

 Tech7 days ago
How to back up your iPhone & iPad to your Mac before something goes wrong
-

 Crypto World6 days ago
Bitcoin enters the public bond market as Moody’s gives a first-of-its-kind crypto deal a rating
-
Crypto World6 days ago
Bitcoin stalls below key resistance as technical signals skew bearish
-

 Tech5 days ago
Commonwealth Fusion Systems leans on magnets for near-term revenue
-

 Politics7 days ago
Transform Your Space with Stunning Small Works
-

 Politics6 days ago
Starmer’s centre has collapsed, and the left was right all along
-

 Business7 days ago
Matrix Composites shares up 50pc on new takeover bid
-

 Fashion7 days ago
Tuesday’s Workwear Report: Tavira Sculpt Stretch Crepe Trousers
-
Business2 days ago
No Jackpot Winner, Prize to Climb to $231 Million
-

 Fashion7 days ago
Zara Turns Up the Heat With New Swimwear
You must be logged in to post a comment Login