

Crypto World
Hanging Man Candlestick Pattern Explained
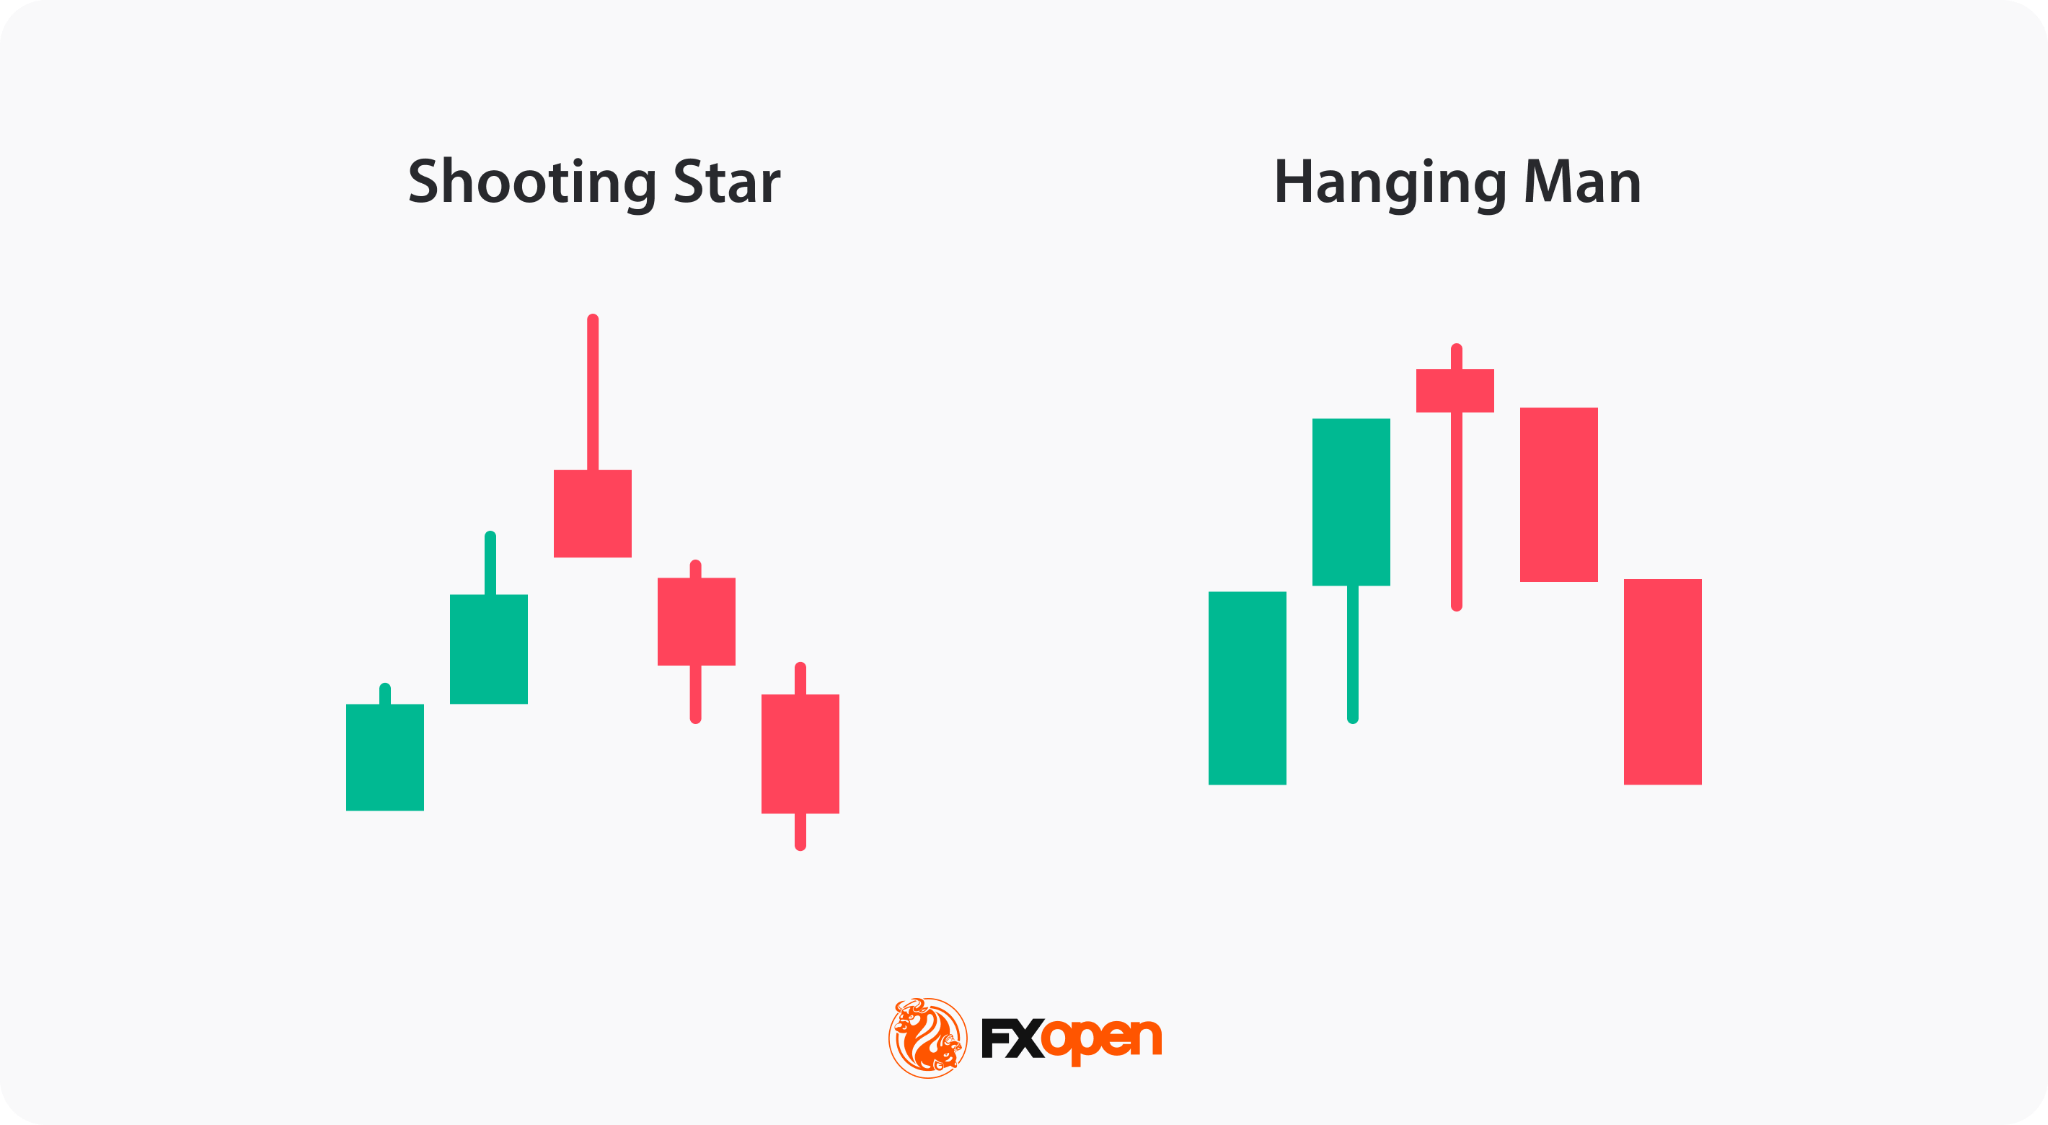
The hanging man candlestick is a single-bar pattern that forms after an uptrend. It consists of a small body near the top and a long lower shadow. It points to a possible bearish reversal. Most traders wait for a confirmation candle before acting.
In the world of technical analysis, candlestick patterns are commonly used to decipher market trends and potential reversals. Among the many setups, the hanging man holds particular significance. This distinctive formation captures traders’ attention as it often serves as a warning sign of a possible trend reversal. This article will go through the technical analysis of the hanging man formation and explain how traders can trade with it.
What Is a Hanging Man Candlestick Pattern?
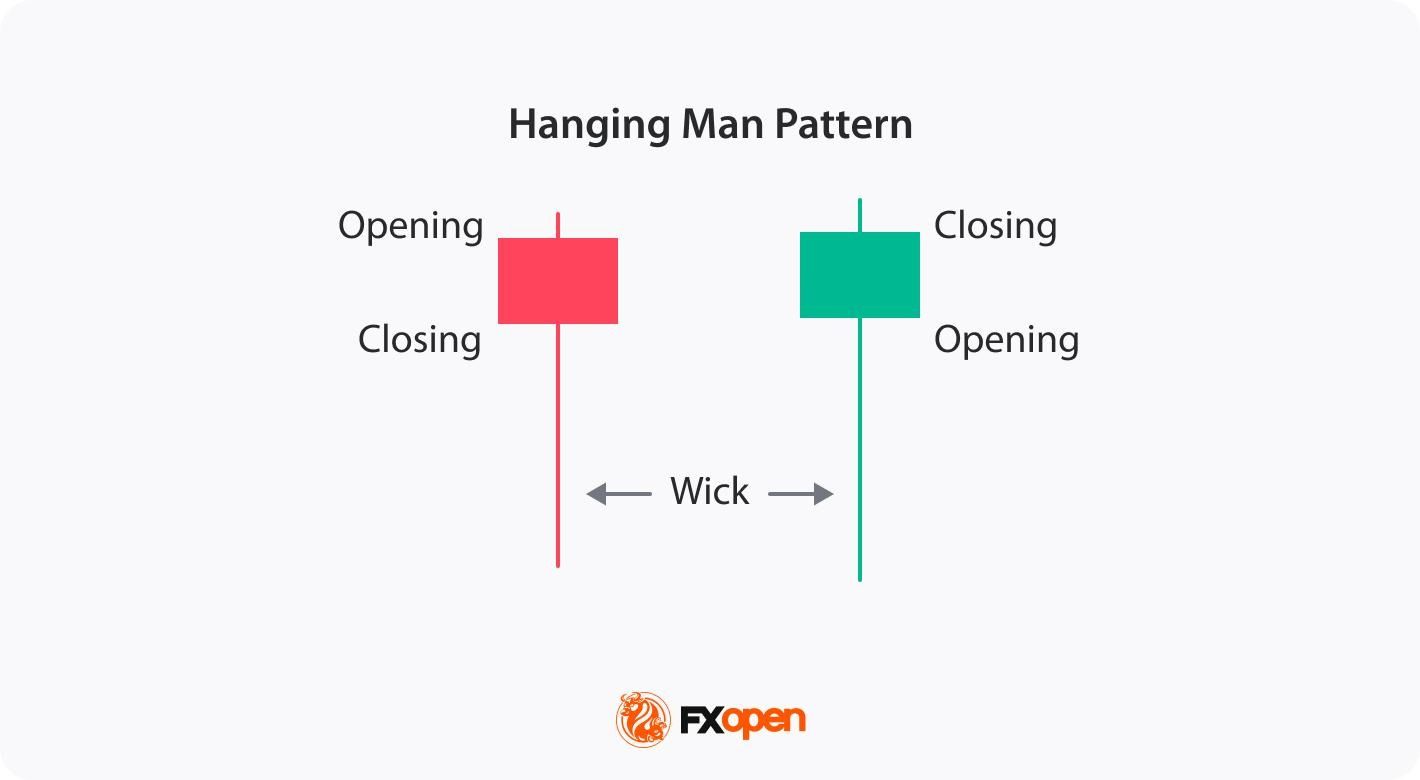
A hanging man candle is a single-bar pattern that forms after an uptrend and warns of a possible bearish reversal. It has a small real body near the top, a long lower shadow, and little or no upper shadow. The colour of the body is secondary, though a bearish close adds weight.
Psychology Behind the Hanging Man Pattern
The psychology behind the hanging man candlestick pattern reflects a shift in market sentiment. Buyer exhaustion sits at the core of the hanging man pattern. After a long advance, demand thins and fewer buyers step in at higher prices. Sellers then emerge and drive the long lower shadow, signalling a possible uptrend reversal.
The long lower shadow shows that sellers were able to push prices down significantly during the trading session. Although buyers managed to drive prices back up, the close near the open price suggests weakening bullish sentiment. This pattern signals that seller pressure is increasing, potentially leading to a bearish reversal as confidence among buyers diminishes.
The hanging man is a versatile formation that can be applied across a wide range of financial instruments, including stocks, indices, commodities, and forex, on different timeframes.

Characteristics of a Hanging Man Candle
A hanging man candle has a clear shape that sets it apart on a chart. Five features define it. Each one matters, and the pattern carries more weight when all five line up after a strong uptrend.
- Small real body: the open and close price sit close together, near the top of the range.
- Long lower shadow: the shadow runs at least twice the length of the body.
- Little or no upper shadow: price closes near the session high.
- Prior uptrend: the candle forms after a sustained move higher.
- Confirmation: a bearish follow-through candle is needed before the signal holds.
Without a prior uptrend, the same shape is read as a hammer rather than a hanging man candlestick. Context, not colour, gives the candle its meaning.
How Traders Identify a Hanging Man Candlestick
To spot a hanging man pattern in stocks and other financial instruments, you may follow these steps:
- Look for an existing uptrend: Start by identifying a prevailing upward price movement on the chart.
- Find a small real body near the top of the range: It should have a long lower shadow and little to no upper shadow. This formation resembles a figure hanging from its head.
- Check the lower shadow runs at least twice the length of the real body: A short shadow weakens the signal.
- Treat colour as secondary: The colour of the candle doesn’t matter, but if it’s bearish, the signal is stronger.
- Consider supporting indicators: Utilise other technical indicators or oscillators to further validate the potential reversal. These can include trendlines, moving averages, or momentum indicators that align with the bearish interpretation.
Even with all five checks met, the hanging man candlestick still needs a confirmation candle before it carries weight. The pattern is a warning, not a trigger.
What Is the Confirmation Candle for a Hanging Man?
A hanging man confirmation candle is the bearish bar that follows the pattern and provides the candlestick confirmation that validates the reversal. Without it, the hanging man is only a warning. Traders typically watch for one of three signals in their candlestick chart analysis.
The first is a bearish engulfing candle that fully covers the prior body. The second is a strong bearish close well below the hanging man’s real body. The third is a clean break below the hanging man’s low. Each shows that sellers have taken control after the initial warning. The stronger the confirmation, the more weight the signal tends to carry.
Trading the Hanging Man Pattern
Those trading the hanging man reversal pattern apply a systematic approach. Here are a few steps traders usually follow to trade this pattern:
- Spot the pattern: Identify the setup by using the steps mentioned above.
- Look for confirmation signals: The setup alone is not sufficient for making trading decisions. Seek additional confirmation through subsequent candlestick patterns or technical indicators. This can include bearish candlestick patterns (e.g. bearish engulfing), a pullback from a resistance level, or the convergence of other indicators signalling a potential reversal.
- Define your entry point: Traders typically consider an entry point either when the next candlestick confirms the bearish sentiment or when the price breaches a significant level.
- Identify profit targets: The candlestick itself doesn’t provide specific targets. Traders could identify profit targets by looking at previous support levels, Fibonacci retracement levels, or other technical analysis tools like moving averages or pivot points.
- Consider risk management: Traders might set a stop-loss order above the hanging man pattern. Some traders assess the risk-reward ratio of the trade to ensure the trade aligns with their risk tolerance. Risk management tools like position sizing, setting stop-loss orders, and diversification may help traders calculate risks.
- Monitor the trade: Traders keep a close eye on their positions as they progress. They pay attention to any changes in market conditions or additional signals that may invalidate the trade.
- Learn from outcomes: Regardless of the outcome of the trade, traders analyse it afterwards to identify areas for improvement. They assess whether the setup provided accurate signals and identify any factors that may have affected the trade.
Live Market Example
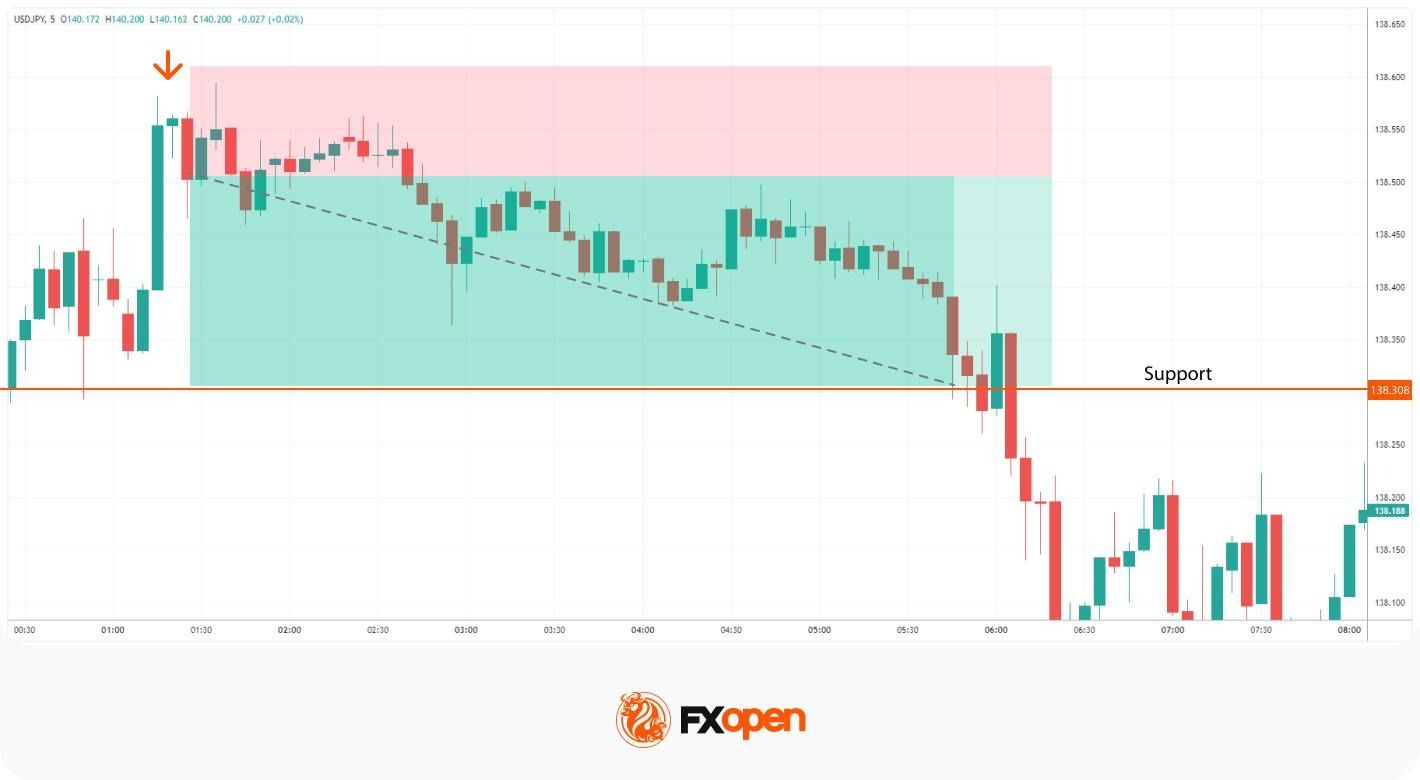
Consider a hanging man that forms on the USD/JPY pair after a steady uptrend. The candle has a small body near the top and a long lower shadow. A bearish candle follows and closes lower, which validates the setup.
A common approach places the stop loss just above the high of the hanging man, since a move back above it would weaken the bearish case. The take profit order is at the next level of support. The gap between entry and that support sets the risk-reward ratio for the trade.
Traders can consider using the TickTrader platform to test the hanging man pattern rules.
Limitations of the Hanging Man Pattern
The hanging man candlestick pattern, while useful, has certain limitations that traders need to consider:
- False Signals: The hanging man can produce false signals, especially in volatile markets where price movements are erratic. A candle that looks valid can still fail once the next bar prints.
- Market Context: The reliability of the pattern varies depending on the broader market context and prevailing trends. The same shape means little without a clear prior uptrend behind it.
- Timeframe Sensitivity: The pattern’s signals can vary across various timeframes; what works on a daily chart may not be a strong signal on an intraday chart.
- Not Standalone: It is used as part of a comprehensive trading strategy that includes other indicators and risk management tools.
Context does most of the work here. The pattern flags a possibility, not a certainty.
Hanging Man vs Similar Candlestick Patterns
Understanding how the hanging man pattern differs from similar candlestick patterns may help in accurate technical analysis.
Several single-candle formations look almost identical to it, which makes them easy to confuse. The difference comes down to three things: the trend the candle forms in, where the body and shadow sit, and the signal it gives. The three comparisons below break it down against the hammer, the pin bar, and the shooting star.
Hanging Man vs Hammer
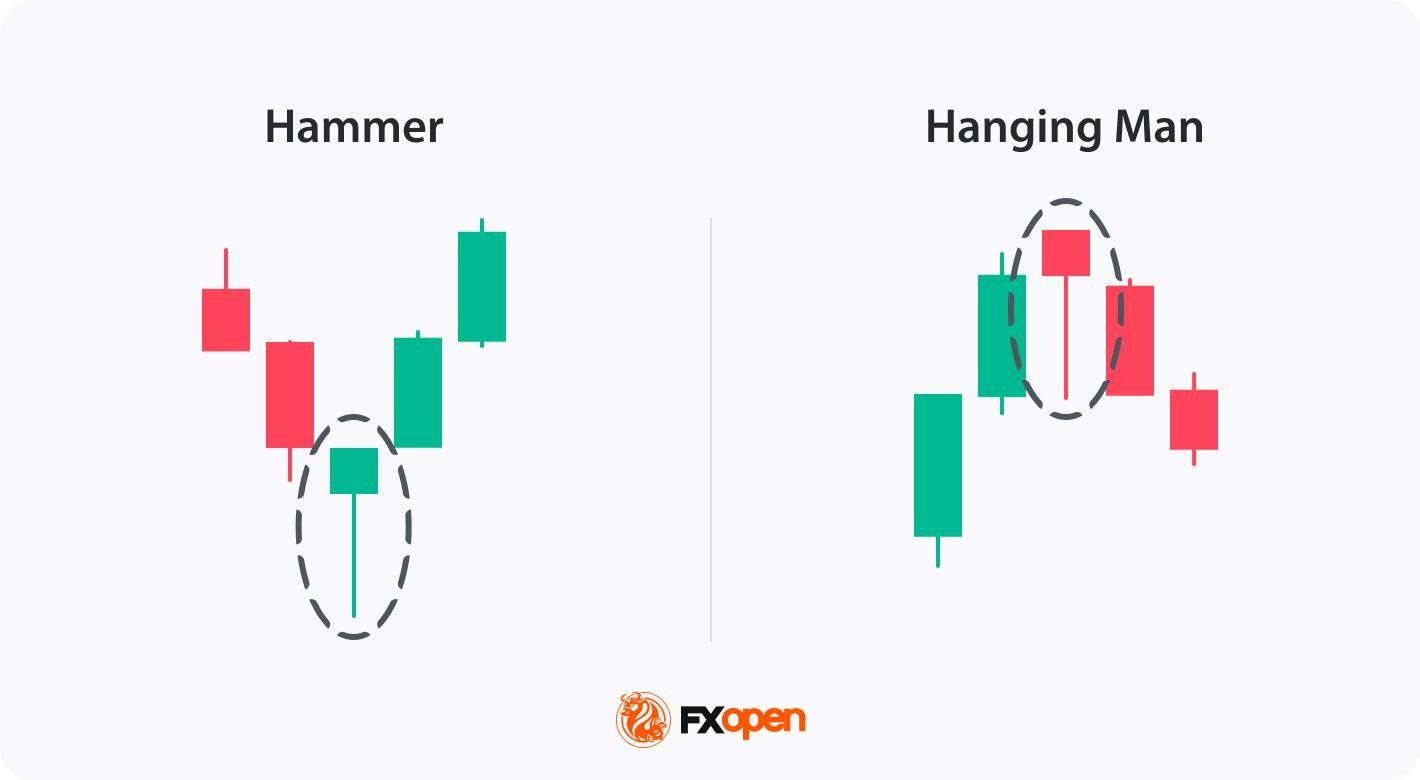
Both candles share the same structure: a small body near the top and a long lower shadow. The hanging man vs hammer difference comes down to the trend each one forms in.
The hanging man candlestick forms in an uptrend and signals a potential bearish reversal, while the hammer appears in a downtrend, indicating a potential bullish reversal. Both candles require confirmation from subsequent price movements. They are typically analysed within the context of the overall market trend and other technical indicators.
Hanging Man vs Pin Bar
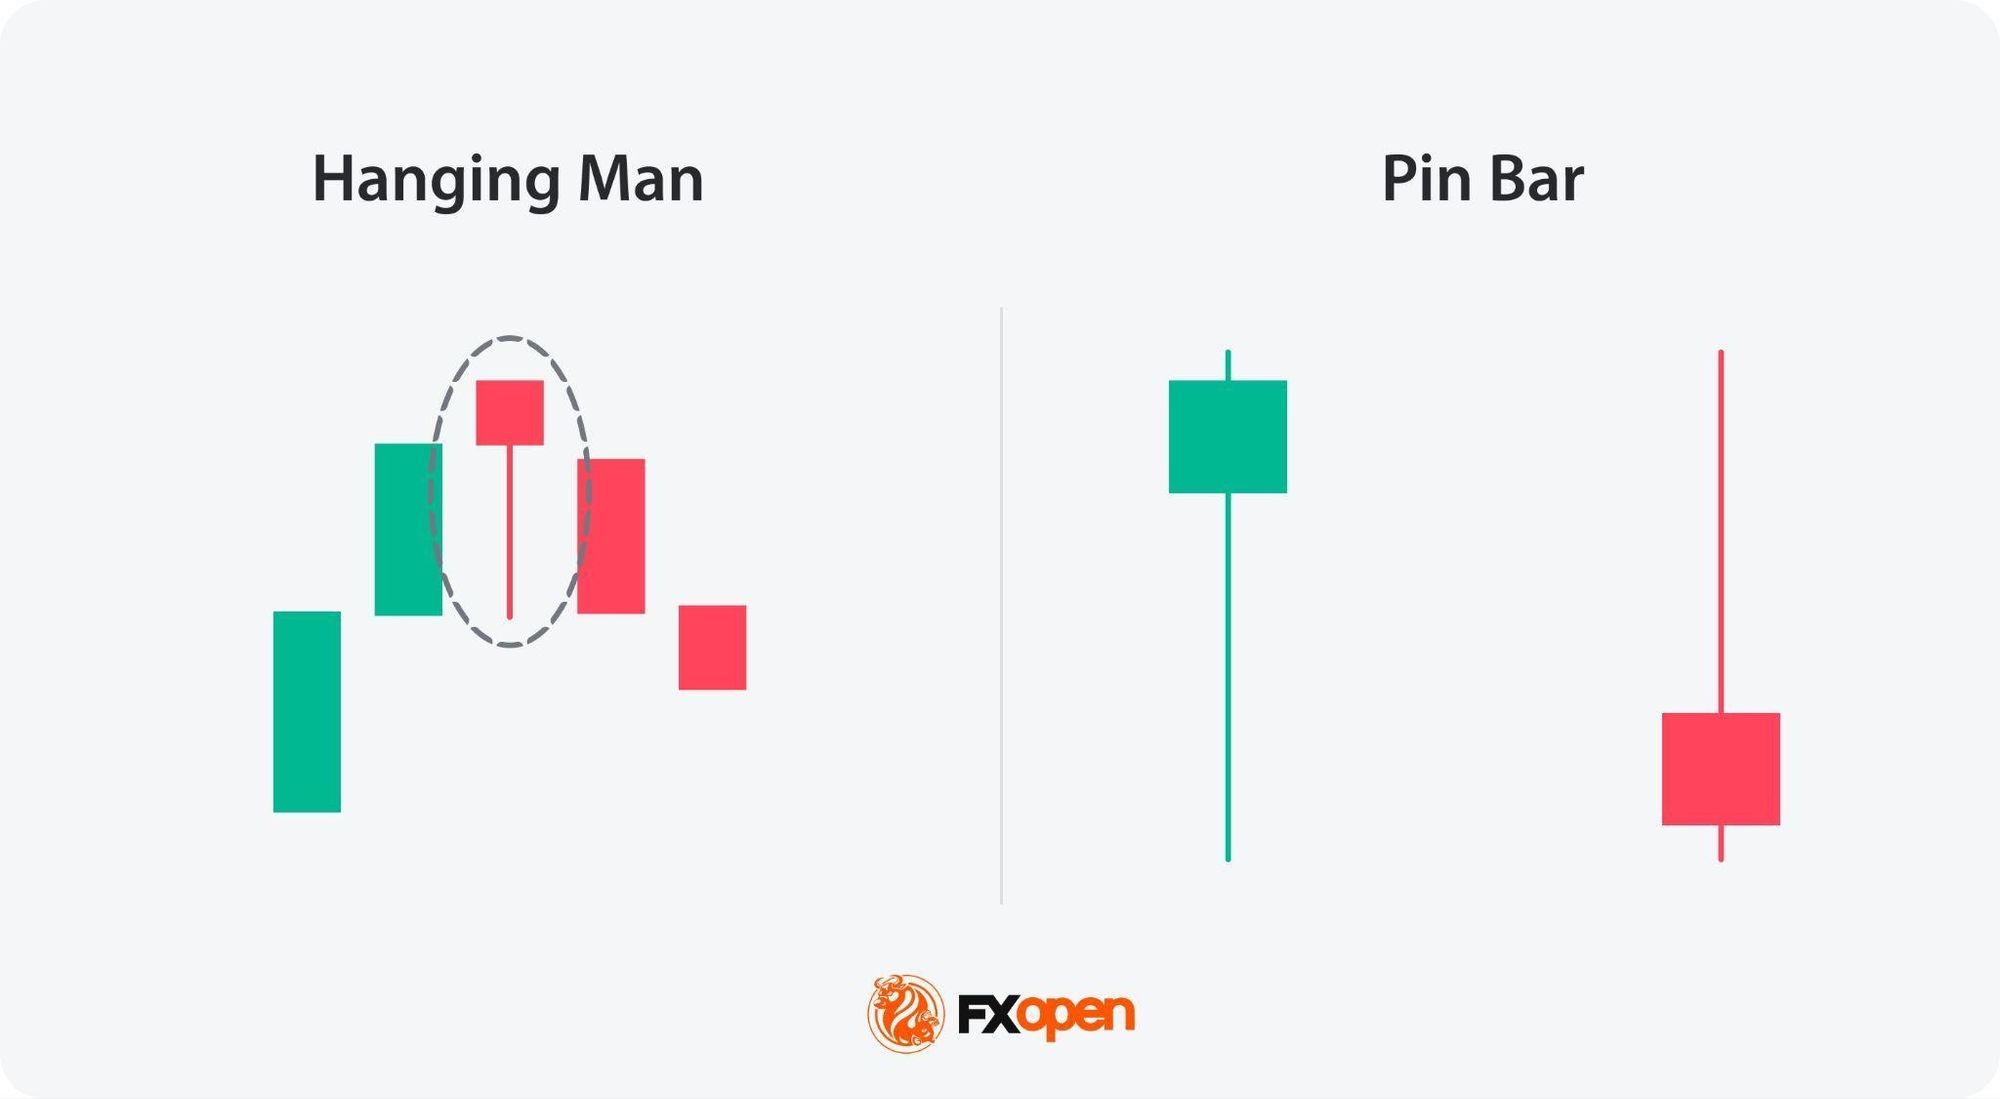
A pin bar and a hanging man are both single-candlestick patterns with small bodies and long shadows, but they serve different purposes in price action trading. The pin bar has a small body and a long tail, indicating a reversal, but it can appear in bullish and bearish markets. In a bullish trend, it’s called a shooting star, it has a long upper shadow and a small body, and signals a downward reversal. In a bearish trend, it’s called a hammer, it has a long lower shadow and a small body, and signals a bullish reversal. Its long tail shows a strong rejection of a certain price level, with the body pointing in the direction of the anticipated reversal.
The hanging man, however, specifically occurs after an uptrend and signals a potential bearish reversal, characterised by a small body at the top and a long lower shadow, indicating selling pressure.
Hanging Man vs Shooting Star
The shooting star and the hanging man are both bearish reversal patterns, but they differ in their appearance and context. A shooting star occurs after an uptrend and features a small body at the bottom with a long upper shadow. It indicates that the price was pushed up significantly but fell back down, showing strong selling pressure.
The hanging man also appears after an uptrend but has a small body at the top with a long lower shadow. It suggests that sellers dominated the session despite an initial push by buyers.
Both require confirmation from subsequent candlesticks to validate the reversal.
Is the Hanging Man Pattern Reliable?
On its own, the hanging man is a moderate signal. Its reliability depends on what surrounds it, not the candle alone. Four factors decide how much weight it carries.
Market context matters first. The pattern means little without a clear, sustained uptrend behind it. The same shape inside a choppy range carries almost no signal.
Trading confirmation comes next. A hanging man without a bearish follow-through candle is just a warning, and many resolve back into the uptrend. A confirmed signal is far more dependable than an unconfirmed one.
Timeframe shapes reliability too. A hanging man candle on a daily or weekly chart tends to hold more weight than one on a one-minute chart, where noise produces frequent false signals.
Supporting tools round it out. Traders often pair the pattern with support and resistance, volume, or momentum readings as part of their hanging man technical analysis. Agreement across signals raises the odds the reversal holds.
The takeaway is simple. The hanging man pattern flags a possibility, not a certainty, and works as one input among several rather than a standalone trigger.
Final Thoughts
While the hanging man alone is insufficient for making trading decisions, it serves as a warning signal that buyers may be losing control and that selling pressure could increase. Traders seek additional confirmation through subsequent candlestick patterns, support and resistance levels, and other technical indicators to validate the potential reversal.
In short, identify the candle by its small body, long lower shadow, and prior uptrend, then wait for a bearish confirmation candle before the trend reversal signal carries weight. By understanding the implications of the setup within the broader market context and employing proper risk management strategies, traders can support their decision and identify different setups across the markets. Once comfortable with a strategy, traders may consider opening a forex trading account with FXOpen to apply it across more than 700 markets.
FAQ
What Does the Hanging Man Pattern Indicate?
The hanging man trading pattern in technical analysis typically indicates a potential bullish trend reversal. It suggests that the buyers, who have been driving the market higher, are losing control, and the selling pressure may increase. The hanging man is represented by a small body near the top of the candlestick, a long lower shadow, and little to no upper shadow.
Can a Hanging Man Candle Be Bullish?
No, there is no such thing as a bullish hanging man candlestick pattern. The bearish hanging man pattern indicates a potential trend reversal from an uptrend to a downtrend.
Is the Hanging Man Pattern Reliable?
The reliability of the hanging man pattern, like that of any candlestick formation, depends on the broader market context and supporting technical signals. Although it is widely recognised as a potential bearish reversal pattern, it isn’t used as the sole basis for trading decisions. Traders typically seek confirmation through subsequent bearish price action, such as a strong bearish candle following the pattern, as well as additional technical indicators that support the likelihood of a trend reversal.
What Is the Confirmation Candle for the Hanging Man?
A confirmation candle for the hanging man is a bearish candlestick that follows the pattern, confirming the reversal. This can include a bearish engulfing candle or a candlestick closing well below the hanging man’s body, indicating increased selling pressure.
Is the Hanging Man Pattern Bearish?
Yes, it is generally considered a bearish pattern that appears after a strong uptrend. It is formed when the price’s open or close is near or at its high and there is a significant decline during the trading session.
Does the Colour of a Hanging Man Candle Matter?
No, colour is secondary. A hanging man can close red or green, and both versions are valid. However, a bearish red close adds weight, since it shows sellers ended the session in control. The shape and the prior uptrend drive the hanging man candle meaning far more than the body colour.
Can a Hanging Man Appear in Forex Markets?
Yes. The hanging man appears across forex, stocks, indices, commodities, and other markets on any timeframe. In hanging man forex trading, it often forms on major pairs after a sustained uptrend. The signal reads the same way regardless of instrument, though confirmation and market context still decide its reliability.
What Timeframe Is Commonly Used for a Hanging Man Pattern?
Higher timeframes tend to be more reliable. A hanging man on a daily or weekly chart usually carries more weight than one on a one-minute chart. Lower timeframes produce more noise and more false signals. Many traders treat the hanging man trading pattern as stronger when it forms on longer timeframes near key levels.
What Indicators Are Often Used With a Hanging Man Candle?
Traders often pair the candle with momentum and trend tools. Common choices include the RSI, moving averages, volume, and resistance levels. These may help confirm whether the bearish reversal candlestick signal is likely to hold. No single indicator confirms the pattern alone, so agreement across several tools tends to raise the odds.
This article represents the opinion of the Companies operating under the FXOpen brand only. It is not to be construed as an offer, solicitation, or recommendation with respect to products and services provided by the Companies operating under the FXOpen brand, nor is it to be considered financial advice.

Grayscale Research has named five decentralized finance tokens it believes offer real value as crypto markets reward revenue and cash flow over speculation.
The asset manager flagged Hyperliquid (HYPE), Aave (AAVE), Uniswap (UNI), Sky (SKY), and Maple (MAPLE) in a research report published June 16. Each shows strong relative value based on fundamentals.
Why Grayscale Sees Value in DeFi
Crypto markets have fallen since January. Grayscale argues in its report that investors can now value many tokens like financial assets rather than commodities.
The firm sorts tokens on a spectrum. Bitcoin trades like a commodity, while protocols with recurring revenue resemble cash flow businesses.
Since 2023, DeFi protocols have generated nearly $25 billion in cumulative fees from real users. That activity has driven rising on-chain fee revenue across exchanges, lending, staking, and derivatives.
Price multiples across DeFi lending have also compressed. Grayscale reads that as maturing business models now trading at attractive valuations.
Revenue Now Drives Token Value
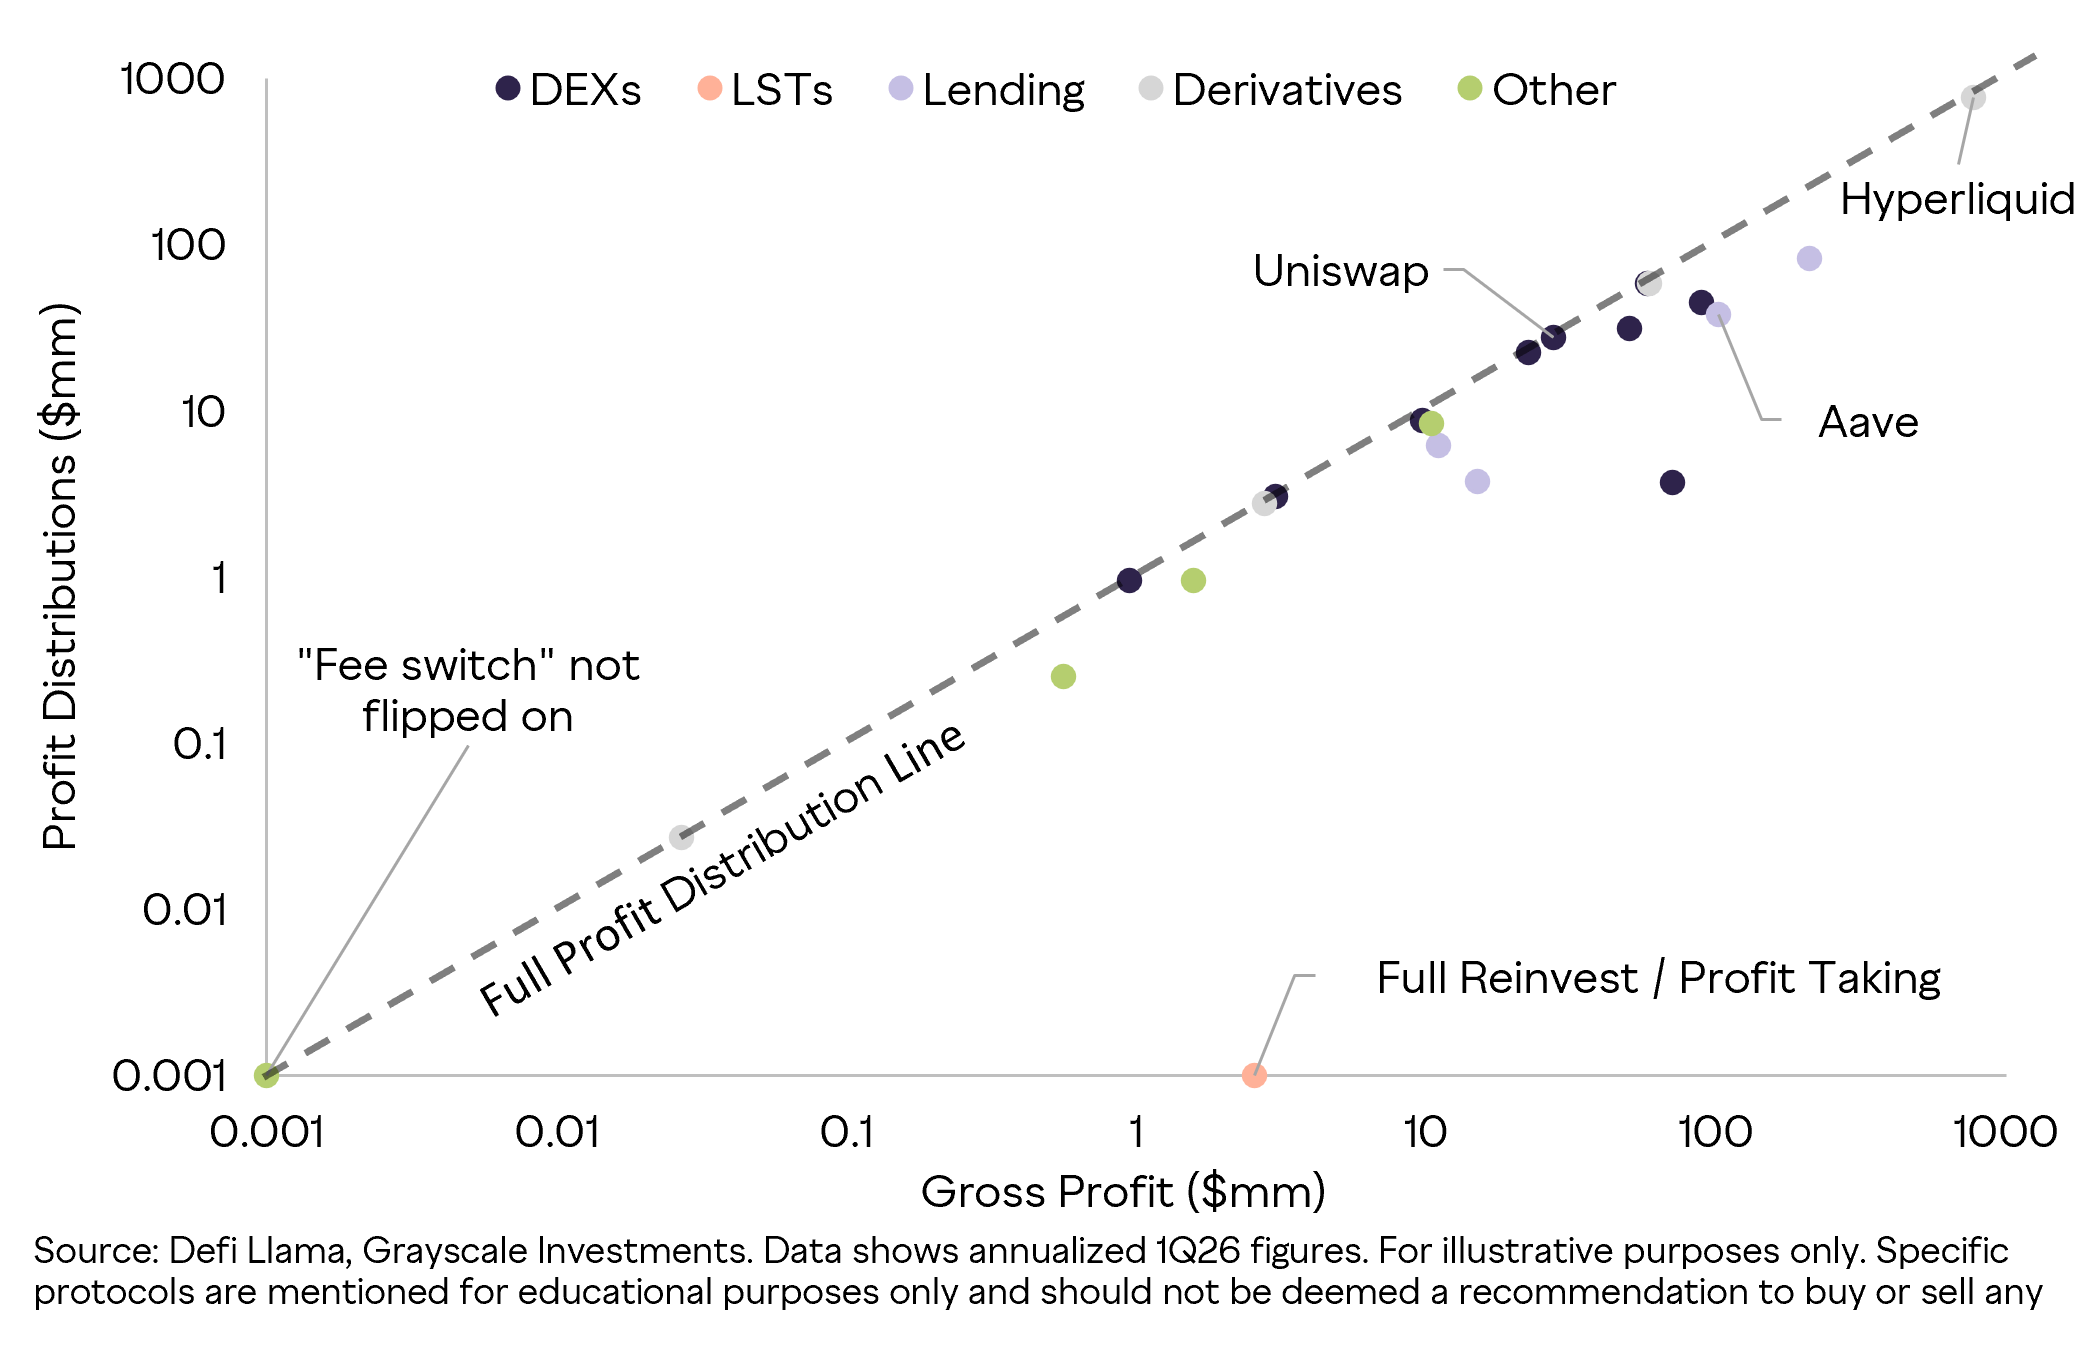
Protocol revenue alone does not set token value. Grayscale says burns, buybacks, rebates, and staking decide how much reaches holders.
By that test, Uniswap and Hyperliquid stand out. The report says both return almost all earnings to holders through transparent DeFi payout models.

Hyperliquid routes trading fees straight into buying and burning HYPE. That model helped lift it into the top 10 by market cap this year.
Aave sits alongside them as the largest DeFi lender, after Grayscale called the AAVE token undervalued near $75.
How the Tokens Stack Up
HYPE trades near $72, ranking as the 10th-largest crypto and well ahead of its peers over the past year.
UNI sits around $3.30 after a 9% daily gain, with its value tied to fee distributions back to holders.
SKY trades near $0.06, where Grayscale says its onchain collateral-backed stablecoin keeps finding product-market fit.
Maple rounds out the list through institutional lending, which the firm says has delivered strong risk-adjusted returns.
“…crypto is repricing from narrative → fundamentals Protocols with real revenue, disciplined capital allocation, and transparent token economics are outperforming Grayscale flags HYPE, AAVE, UNI, SKY, and MAPLE as showing strong relative value on this basis,” Grayscale stated.
Follow us on X to get the latest news as it happens
The throughline is a market repricing from narrative to fundamentals.
Grayscale says protocols that turn real revenue into token value are pulling ahead.
The post Grayscale Names 5 DeFi Altcoins With Real Utility appeared first on BeInCrypto.

Ethereum's Glamsterdam hard fork reached its final devnet stage Tuesday, locking in the EIP bundle that core developers expect to carry the network through public testnets and on to mainnet activation in the second half of 2026. The release is being framed as the largest protocol change since the… Read the full story at The Defiant


Illinois Governor JB Pritzker has signed SB 3019, the Digital Asset Privilege Tax Act, according to ChainCatcher via Bitget News, making the state the first in the country to impose a transaction-based tax on everyday digital-asset activity. The Crypto Council for Innovation, a global industry… Read the full story at The Defiant
Crypto World
BlockDAG Tops Trending Cryptos 2026 While Arbitrum, Internet Computer, And Kaspa Fight Market Resistance
The cryptocurrency market in June 2026 is defined by extreme structural shifts as massive capital blocks rotate out of speculative public exchanges. High frequency algorithmic trading and sudden regulatory actions have created a highly volatile environment, completely destroying retail profit margins. Portfolio managers are shifting their attention toward native utility platforms featuring isolated treasury contracts to protect their principal investments.
This ongoing market correction proves that standard open market trading is no longer a viable strategy for sustainable capital growth. Sidelined investors are aggressively seeking ecosystems that provide fixed financial guarantees rather than relying entirely on unpredictable daily trading volume.
BlockDAG Announces the Concluding Phase of Its Legacy Sale
When analyzing the top trending cryptos 2026, BlockDAG dominates institutional interest by announcing the final operational countdown for its legacy tier. This clean urgency play focuses on the fact that the promotional introductory tier is officially wrapping up, making this the absolute final window to secure these specific terms before standard price discovery begins. Participants can leverage the native direct swap dashboard to acquire tokens at the foundational rate of $0.00000044. Every allocation is securely locked into a guaranteed corporate buyback contract fixed at $0.10.
This hardcoded exit strategy eliminates the stress of chart monitoring and completely shields portfolios from sudden liquidity crunches. As the premier choice among trending cryptos 2026, BlockDAG is experiencing massive capital inflows as large scale asset managers drain the remaining treasury pool. Once the current allocation reaches maximum capacity, this fixed ten cent settlement will disappear permanently. Everyday buyers must execute their positions immediately before the closing bell rings on this historic wealth building vehicle.
Arbitrum Consolidates Near Historic Price Lows
Market data from mid June 2026 shows Arbitrum trading at a highly depressed value of $0.09. The network has experienced a massive 74.33% drop over the past twelve months, establishing an all time low of $0.06 earlier in the month. Despite handling significant decentralized application volume as a layer two scaling solution, the native asset continues to suffer from heavy token unlocks and institutional distribution.
While the token is often listed among trending cryptos 2026, actual price action remains deeply bearish. The $0.10 zone acts as heavy overhead resistance, constantly rejecting localized relief rallies. Until the core development team restructures the tokenomics to encourage long term holding, Arbitrum will likely remain trapped in this tight consolidation phase.
Internet Computer Fights Stagnant Market Momentum
Internet Computer continues to face significant market friction, trading near $8.45 during the second week of June 2026. The network has successfully expanded its cloud infrastructure capabilities, attracting enterprise developers looking for decentralized hosting solutions. However, this fundamental utility has failed to translate into meaningful token price appreciation.
The asset recently broke below its 50 day moving average, signaling increased bearish control over the short term. Support currently sits at $7.80, and a failure to hold this level could trigger a rapid descent toward the $6.50 range. While developers consider the platform functionally superior to older chains, retail investors searching for trending cryptos 2026 are heavily disappointed by the persistent lack of upward chart momentum.
Kaspa Faces Heavy Selling Pressure Below Moving Averages
Kaspa is currently navigating a tough technical landscape, with prices hovering around $0.14 in mid June 2026. After experiencing explosive growth in previous quarters, the proof of work network is now enduring a prolonged distribution phase. Large scale early miners are actively taking profits, creating a massive supply wall that suppresses new retail buying volume. The asset is currently testing critical structural support at the $0.13 zone.

A confirmed daily close below this baseline could invalidate the entire macro bullish structure. As portfolio managers evaluate trending cryptos 2026, Kaspa presents a highly risky setup. The lack of smart contract functionality limits the ecosystem’s ability to lock up circulating supply, leaving the token entirely dependent on constant spot market demand.
To Conclude
Evaluating the current digital asset sector highlights the extreme danger of holding highly speculative utility tokens. Arbitrum remains severely depressed at $0.09 following a massive yearly decline. Internet Computer struggles to clear technical resistance near $8.45, while Kaspa faces heavy miner distribution at $0.14.
In stark contrast, BlockDAG establishes itself as the ultimate leader among trending cryptos 2026. By utilizing the concluding legacy sale to secure a $0.00000044 entry, retail investors guarantee a fixed $0.10 corporate exit. This mathematically flawless framework provides total financial security, making BlockDAG the absolute best choice before the promotional vault closes permanently.

Disclaimer: This is a Press Release provided by a third party who is responsible for the content. Please conduct your own research before taking any action based on the content.

The XRP Ledger 3.2.0 upgrade has reached network operators, bringing infrastructure improvements and software changes across the ecosystem. David Schwartz, Ripple’s CTO emeritus and one of the original architects of the XRP Ledger, recently upgraded his independent hub server to the latest version after a short maintenance period.
Source: https://x.com/JoelKatz/status/2067004655021048252?s=20
The XRP Ledger 3.2.0 upgrade focuses on maintenance, cleanup, and reliability improvements. While the release does not introduce major new features, it strengthens existing systems and prepares the network for future development. As operators begin deployment, the update marks another step in the network’s ongoing technical evolution.
David Schwartz Completes Hub Upgrade
Schwartz announced on X that he temporarily took his hub offline to install the XRP Ledger 3.2.0 upgrade. He initially expected the process to take about ten minutes. However, the server required additional time to shut down safely before the installation could proceed.
Alongside the announcement, Schwartz shared performance data covering the previous month. He stated that the charts showed only “one real event,” which he described as an “unexplained burst of peer disconnections.” According to his comments, the disruption likely resulted from a nearby network outage rather than an issue within the XRP Ledger itself.
His hub serves as part of the broader peer-to-peer infrastructure that supports connectivity and data exchange across the network. Although the hub does not function as a validator replacement, it helps participants monitor network activity and maintain reliable connections.
Xrp Ledger 3.2.0 Upgrade Introduces Key Changes
The XRP Ledger 3.2.0 upgrade includes several technical improvements. Developers removed amendments that had remained active for more than two years. The release also continues the modularization of libxrpl, which supports long-term software maintenance.
In addition, the update introduces fixCleanup3_2_0. This package addresses issues affecting Single Asset Vaults, the Lending Protocol, permissioned decentralized exchange tools, Multi-Purpose Tokens, and permissioned domains.
The fixes improve precision, rounding processes, validation checks, and system invariants. As a result, operators gain a more stable software environment for running network services and supporting advanced blockchain functions.
Software Rename Marks New Network Identity
One of the most visible parts of the XRP Ledger 3.2.0 upgrade is the renaming of the core server software. Under XLS-0095, developers changed the server binary name from rippled to xrpld. They also renamed the default configuration file from rippled.cfg to xrpld.cfg.
The migration requires operators moving from version 3.1.3 to complete additional configuration steps. Network documentation advises operators to update systems promptly to avoid service interruptions.
Beyond technical changes, the new name creates a clearer connection to the XRP Ledger network. At the same time, the release supports broader development efforts, including lending tools and programmable escrow features that continue to expand the network’s functionality.
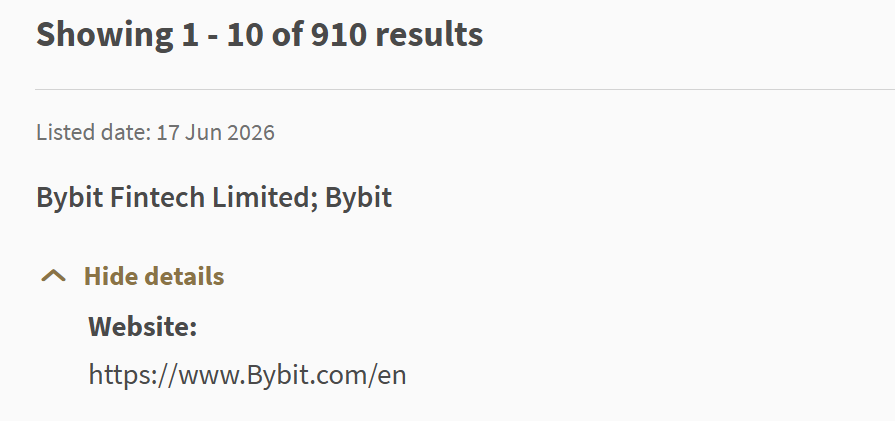
Crypto exchange Bybit has been added to the Monetary Authority of Singapore’s (MAS) Investor Alert List, a registry designed to warn consumers about entities that may be wrongly perceived as licensed or regulated by the financial watchdog.
Bybit Fintech Limited and Bybit appeared on the MAS alert list on Wednesday, although the regulator did not provide a specific reason for their inclusion.

Bybit Fintech Limited, the corporate entity behind the exchange, appears on the MAS Investor Alert List website. Source: MAS
According to MAS, the Investor Alert List identifies entities and investment offers that may create the false impression of being licensed, authorized, regulated or registered by the authority, or whose investment offerings may be mistakenly viewed as having received MAS approval.
Based on publicly available information, Bybit is not licensed or regulated by MAS. Cointelegraph reached out to a Bybit spokesperson for comment but did not receive a response by the time of publication.
Although Bybit was founded by Singaporean entrepreneur Ben Zhou, the exchange does not operate in the city-state. Singapore is listed among the company’s “Service Restricted Countries” on its website, meaning users in the jurisdiction are not permitted to access its services.
Related: SBI Holdings targets majority stake in Singapore crypto exchange Coinhako
Singapore maintains strict oversight of crypto sector
Singapore has cemented its position as a leading crypto hub, ranking among the world’s top jurisdictions for decentralized finance and institutional digital asset services in Chainalysis’ 2025 Global Crypto Adoption Index. Retail crypto adoption, however, ranked significantly lower.
The MAS has continued to take an assertive approach to industry oversight. In May, the regulator revoked the Major Payment Institution license of crypto liquidity provider Bsquared Technology after uncovering what it described as serious regulatory breaches, including weaknesses in risk management and conflict-of-interest policies.
MAS also said the company had provided false or misleading information on multiple occasions, from its initial license application through a subsequent inspection.
Separately, Singapore police charged former Hodlnaut CEO Zhu Juntao in May with six counts of fraud for allegedly misleading customers about the crypto lender’s exposure to the 2022 Terra ecosystem collapse.
Hodlnaut, a Singapore-based crypto lending platform that once served tens of thousands of users, suspended withdrawals in August 2022 following the Terra implosion and was later ordered to liquidate.
The regulator placed Binance.com on its Investor Alert List in 2021, The Straits Times reported at the time. However, a search on Wednesday of the list did not show any mention of Binance among 910 records in the query.
Related: Singapore Gulf Bank adds stablecoin mint and redeem for 24/7 settlement
Bitcoin pulled back from its weekly lows as traders returned to watch a busy U.S. macro calendar, with the Federal Reserve’s Wednesday interest-rate decision arriving shortly after the Wall Street open. Still, analysts say the rebound has struggled to build momentum, pointing to a lingering, very specific drag tied to Strategy’s Bitcoin position.
QCP Capital’s latest Market Color argues that, despite broader risk appetite improving, BTC has not been able to fully participate. The firm highlighted concerns that Strategy could be forced to sell additional Bitcoin to fund dividend obligations, even after recent balance-sheet actions that were intended to extend its liquidity runway.
Key takeaways
- BTC/USD rebounded after dipping to about $64,500 on Bitstamp ahead of the Federal Reserve meeting.
- QCP says BTC’s underperformance versus broader markets is linked to worries about further Strategy Bitcoin sales for dividend funding.
- QCP frames Fed chair Kevin Warsh’s first rate decision as unusually difficult given the tension between inflation concerns and rate-cut expectations.
- CME Group’s FedWatch Tool data shows traders pricing in no rate cuts at the Wednesday meeting, with markets increasingly focused on the possibility of hikes later in the year.
Strategy’s liquidity plans keep a lid on BTC strength
TradingView data cited in earlier coverage showed BTC/USD trending higher after the asset marked a new low for the week around $64,500 on Bitstamp. The bounce followed a period of caution as investors braced for volatility around the Federal Reserve’s announcement, scheduled for 2 p.m. Eastern time.
As Cointelegraph previously noted, major central-bank events often bring downside risk for Bitcoin in the short term. However, QCP’s analysis suggests the issue is not solely about the Fed headline. In its Market Color, the firm wrote that BTC remained trapped below the $66,000 area while broader markets traded up on optimism across multiple fronts.
“While broader markets continue to trade higher on optimism across multiple fronts, BTC remains stuck below the 66k level,” QCP wrote.
The clearest culprit in QCP’s assessment was Strategy. The firm said market worries center on whether Strategy may need to sell more Bitcoin to support dividend payments—particularly after the company had already bought back $1.5 billion of its 2029 Convertible Senior Notes.
“The underperformance has been driven in part by concerns that Strategy may need to sell more Bitcoin to fund dividend payments,” QCP added.
QCP also pointed out that Strategy has taken steps to extend its liquidity runway following prior BTC sales. The analysis referenced that the company “extended its runway” after selling 32 BTC in May, and suggested that these contingency measures can reduce the immediate pressure. Yet the market is still focused on what comes next.
In QCP’s view, the overhang could keep Bitcoin from fully tracking macro optimism in the near term. Over time, as Strategy continues issuing shares and lengthening its runway, it expects sentiment to potentially improve—but for now, the firm argued BTC still has a specific hurdle to clear.
“In the short term, we think this overhang may continue to prevent Bitcoin from fully participating in the broader macro optimism,” QCP wrote.
Warsh’s first Fed meeting becomes a test of how the market should price rates
While BTC traders looked to the Fed for direction, QCP placed equal weight on the significance of who is delivering the message. The firm emphasized that Kevin Warsh takes the stage at his first FOMC meeting as chair.
“Warsh takes the stage at his first Fed meeting as Chair today,” QCP said in its analysis.
QCP noted that expectations had previously positioned Warsh as relatively dovish and more inclined toward rate cuts. But the economic backdrop, the firm argued, has shifted materially—raising the likelihood that Warsh will need to navigate competing pressures.
According to QCP, the meeting represents more than just the rate decision itself, especially with Jerome Powell stepping out of the role. The firm described Warsh’s task as establishing buy-in from Powell and the broader board while also proving he can operate as a credible and independent chair.
“Today’s meeting will therefore be about more than the rate decision,” QCP wrote. “It will be Warsh’s first opportunity to secure buy-in from Powell and the rest of the Board, while establishing himself as a credible and independent Fed Chair.”
FedWatch pricing: no cut now, uncertainty remains toward year-end
Market pricing for Wednesday’s decision offers a clearer picture of what traders are bracing for. Data referenced from CME Group’s FedWatch Tool showed no odds of the FOMC cutting rates at the meeting.
At the same time, commentary in the source material suggested that investors are increasingly looking ahead to possible policy tightening later in the year. Andre Dragosch, European head of research at Bitwise, said markets were moving toward expectations of a rate hike by year-end, which he warned could weigh on crypto and other risk assets.
Dragosch also pointed to an open question that may matter as much as the current decision: whether Warsh will ultimately lean hawkish or dovish in the face of rising inflation. In a post on X, Dragosch said there was still “a lot of monetary policy uncertainty” around how Warsh would be categorized, despite the inflation backdrop.
What traders should watch next
With BTC tied to both macro expectations and Strategy-specific selling anxieties, the near-term signal may come less from price alone and more from confirmation on policy path pricing and any updated clarity around Strategy’s liquidity planning. Investors should watch the Fed’s language closely for clues on the trajectory of rates, while also monitoring whether Strategy’s funding approach continues to reduce—or reignites—concerns about additional Bitcoin sales.
The primary cryptocurrency has staged a clear rebound from its multi-year low below $60,000 and is currently hovering around $65,000.
However, a number of analysts believe the cycle bottom has yet to be reached, projecting a plunge under $50,000.
Red Days Ahead?
Later today (June 17), the Federal Reserve will announce its decision regarding the interest rates in the United States. Given elevated inflation, it would be surprising if the central bank lowered the benchmark, as most expect the current 3.5%-3.75% range to remain unchanged.
Some analysts, though, have identified a consistent pattern in Bitcoin’s (BTC) reaction whenever the Fed releases its interest rate decision. The popular X user Ash Crypto told their over two million followers that the asset’s price has headed south after each FOMC meeting since July 2025. The biggest slump occurred in January this year when BTC lost more than 33% of its valuation. We have yet to see whether today’s disclosure will finally break the negative streak (at least for the bulls).
Other market observers who also made pessimistic predictions include X users bee and Crypto Lens. The former claimed that BTC is “on the verge of the final flush,” expecting a drop to $51,000-$52,000.
“After that, I expect a rebound to the 55k zone and a few weeks of sideways movement, with the potential for a break below 50k,” they added.
For their part, Crypto Lens envisioned a bearish rejection toward roughly $48,000 in the coming days, followed by a crash to $43,000 by August this year.
The Bullish Case
Despite pessimism from some analysts, certain indicators suggest BTC may be gearing up for a rally. The amount of coins stored on crypto exchanges, for example, recently dropped to a six-year low of around 2.56 million. This means that many investors continue to abandon centralized platforms in favor of self-custody solutions, thereby reducing selling pressure.
The whales’ actions are the next positive factor. Ali Martinez revealed that this cohort of investors has purchased more than 30,000 BTC (worth more than $1.9 billion) over the past seven days and now controls 4.27 million coins.
Such developments signal that whales are positioning for the next upward move, with some believing they might be acting on inside information that retail investors don’t have. In any case, their buying spree is closely monitored by smaller players who could mimic the move and distribute fresh capital into the ecosystem.
The post Bitcoin in Danger: Here’s Why BTC May Dump in the Short Term appeared first on CryptoPotato.
A former Goldman Sachs analyst just put a $1,000 price target on XRP by 2030. XRP is currently trading around $1.20, down 3.5% over 24 hours, but also the whole market as we wait for FOMC.
Dom Kwok, co-founder of Web3 education platform EasyA and a former Goldman Sachs analyst, told The Rollup podcast: “I think it could go over $1,000 in the next four to five years.”
His thesis centers on mass crypto adoption routing through XRP rather than Bitcoin or Ethereum, arguing that new retail entrants are priced out of the larger-cap assets and will default to cheaper, more practical alternatives.
This target sits orders of magnitude above the institutional consensus band of $3–$20. On-chain, wallets holding at least one million XRP now control 74.1% of the total supply, with those large holders adding 1.53 billion tokens over the past six months, accumulating at a scale.
Simultaneously, easing U.S.-Iran tensions lifted risk appetite, pushing Bitcoin toward the mid-$60,000s and pulling XRP along.
Discover: The Best Crypto to Diversify Your Portfolio
Can XRP Price Hit $1,000, Or Even $10, Before 2030?
At $1.20 with a weekly green candle of 8%. XRP is in a corrective phase, but the technical structure hasn’t broken down. RSI sits near 62, constructive, not overbought. A recent 3-day MACD bullish cross remains intact, and a decade-long rising trendline has not been violated.
Key support is clustered in the $1.10–$1.15 zone, with mid-term resistance flagged at $1.43–$1.55 by multiple technical frameworks (the asset has since broken above those levels, setting up a new range).
If the U.S. legislative progress via the CLARITY Act passes, XRP-linked ETF inflows will likely accelerate. Then, continued whale accumulation will tighten supply, and price will retest recent highs and push toward $2, consistent with Standard Chartered’s conditional $8 target.
The $1,000 call? That would require a market cap measured in the tens of trillions, a number that requires assumptions about global financial infrastructure adoption that are plausible in theory and extraordinary in practice. Kwok’s framing as an internet-era analogy is intellectually coherent.
Discover: The Best Token Presales
LiquidChain Eyes Early Infrastructure Positioning as XRP Tests Range
XRP’s bull case leans heavily on infrastructure maturation, the idea that real adoption follows useful applications built on top of accessible networks. That same thesis is driving early interest toward a different layer of the stack.
Even in a confirmed XRP uptrend, entry at $1.20 is entry into an asset with a $75 billion market cap. The asymmetry is compressed. Early-stage infrastructure is where that asymmetry still exists.
LiquidChain is always cooking something new. — LiquidChain (@getliquidchain) June 15, 2026

This is what happens when a great idea meets innovation.  pic.twitter.com/qYbth0impA
LiquidChain ($LIQUID) is a Layer 3 infrastructure project positioning itself as the cross-chain liquidity layer, fusing Bitcoin, Ethereum, and Solana liquidity into a single execution environment.
The architecture includes a Unified Liquidity Layer, Single-Step Execution, Verifiable Settlement, and a Deploy-Once model that lets developers access all three ecosystems without redeployment. The presale is currently priced at $0.0147, with $850K raised to date.
Research LiquidChain’s presale details here.
The post XRP Price Is Targeting $1,000 Says Ex Goldman Analyst appeared first on Cryptonews.
Stablecoin settlement infrastructure company Trace Finance has raised $32 million in a Series A funding round led by CoinFund.
Coinbase Ventures, Jump Capital and Paxos were among the investors that participated in the round, the company said Wednesday in a statement shared with Cointelegraph.
Trace Finance provides banking, foreign exchange and stablecoin settlement infrastructure for cross-border payments across Latin America. It claims to have processed more than $10 billion in transaction volume and plans to use the fresh capital to expand across LatAm, the US and Asia-Pacific markets.
The funding comes as stablecoin settlement increasingly moves into regulated financial infrastructure, with companies racing to connect blockchain-based payments to local banking systems and foreign exchange networks.
In 2022, Trace Finance raised $4.3 million in a seed round led by HOF Capital, with participation from Circle Ventures and Mantis VC, the venture capital firm co-founded by electronic music duo The Chainsmokers. HOF Capital also participated in the company’s Series A round.
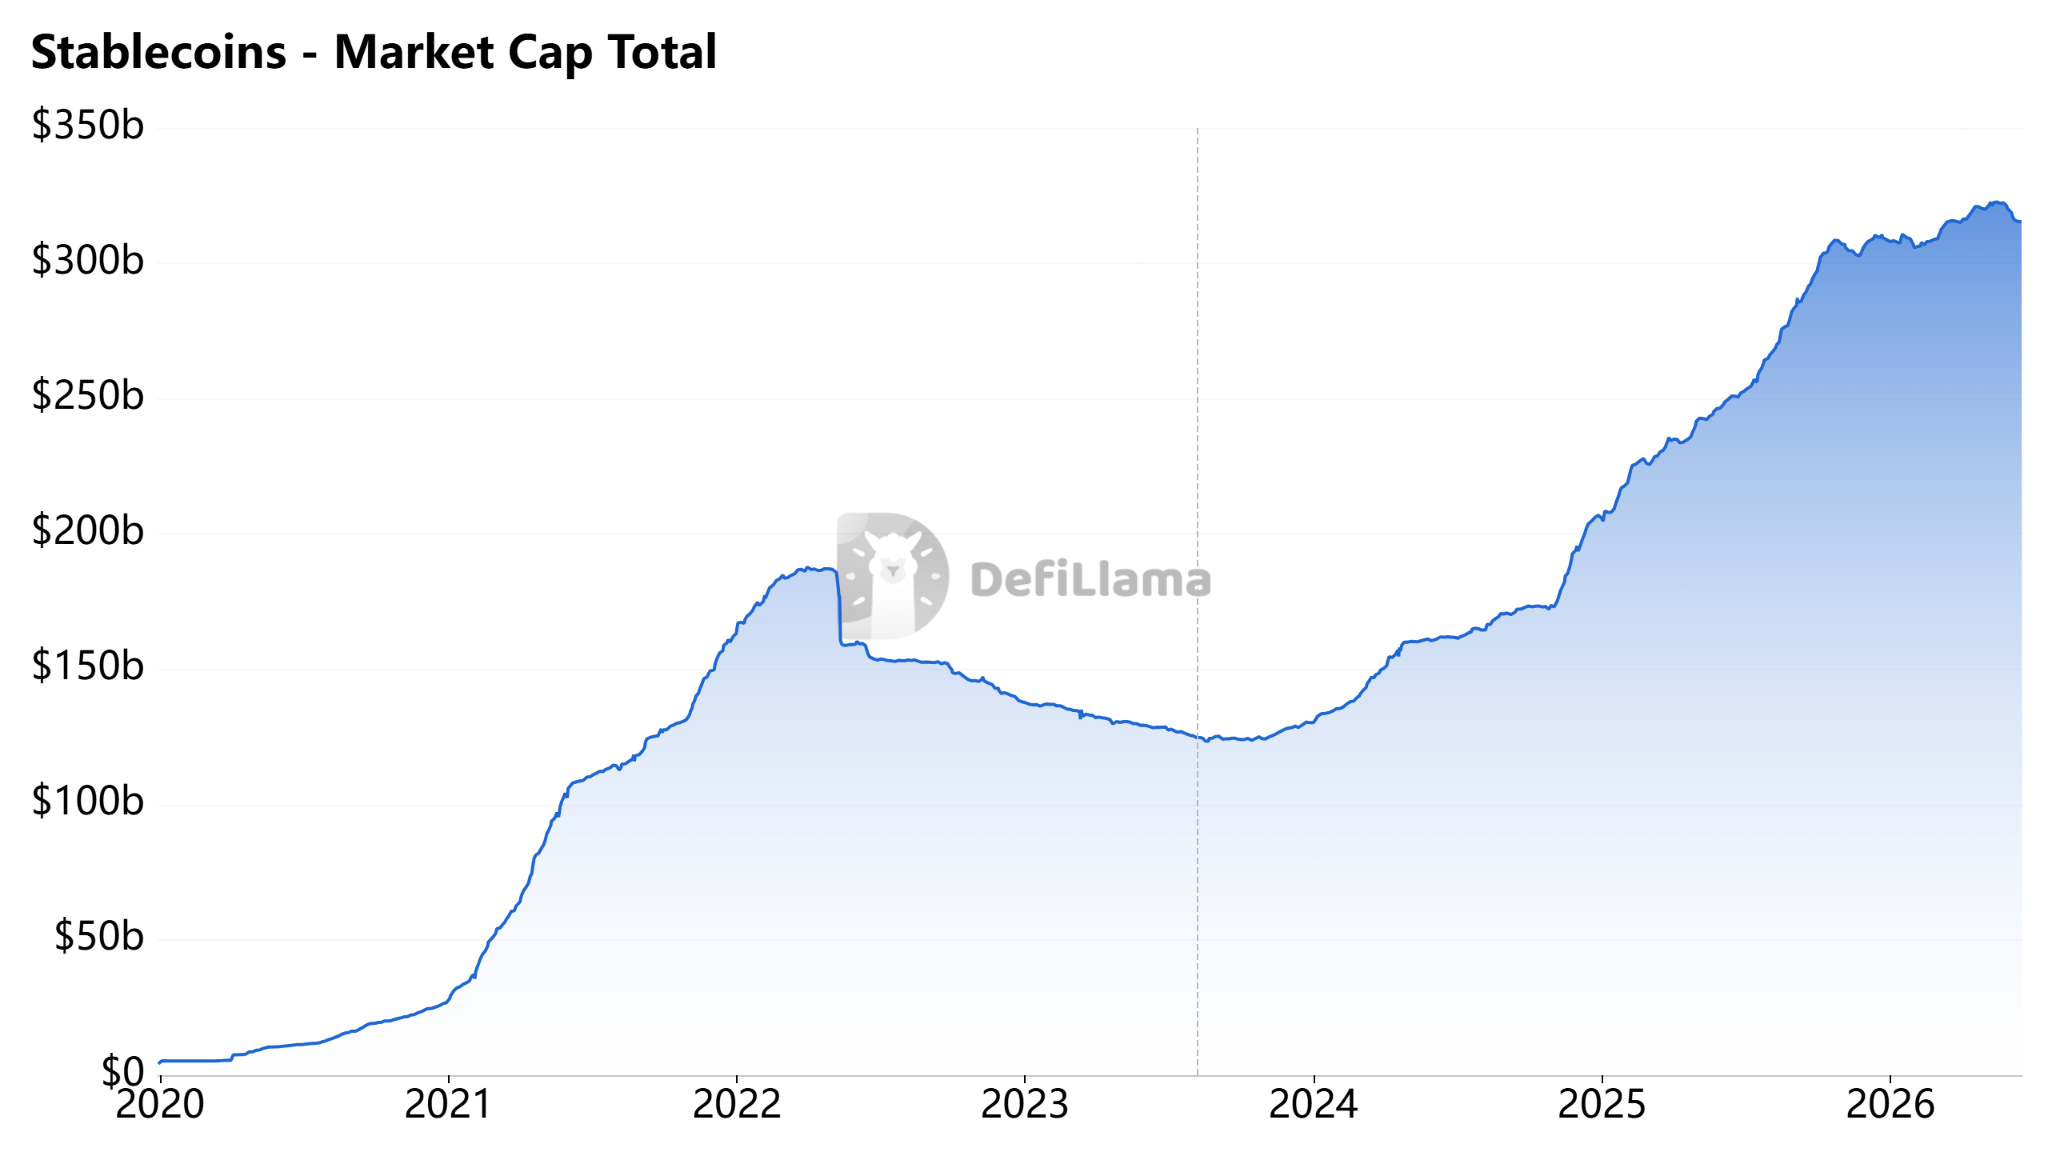
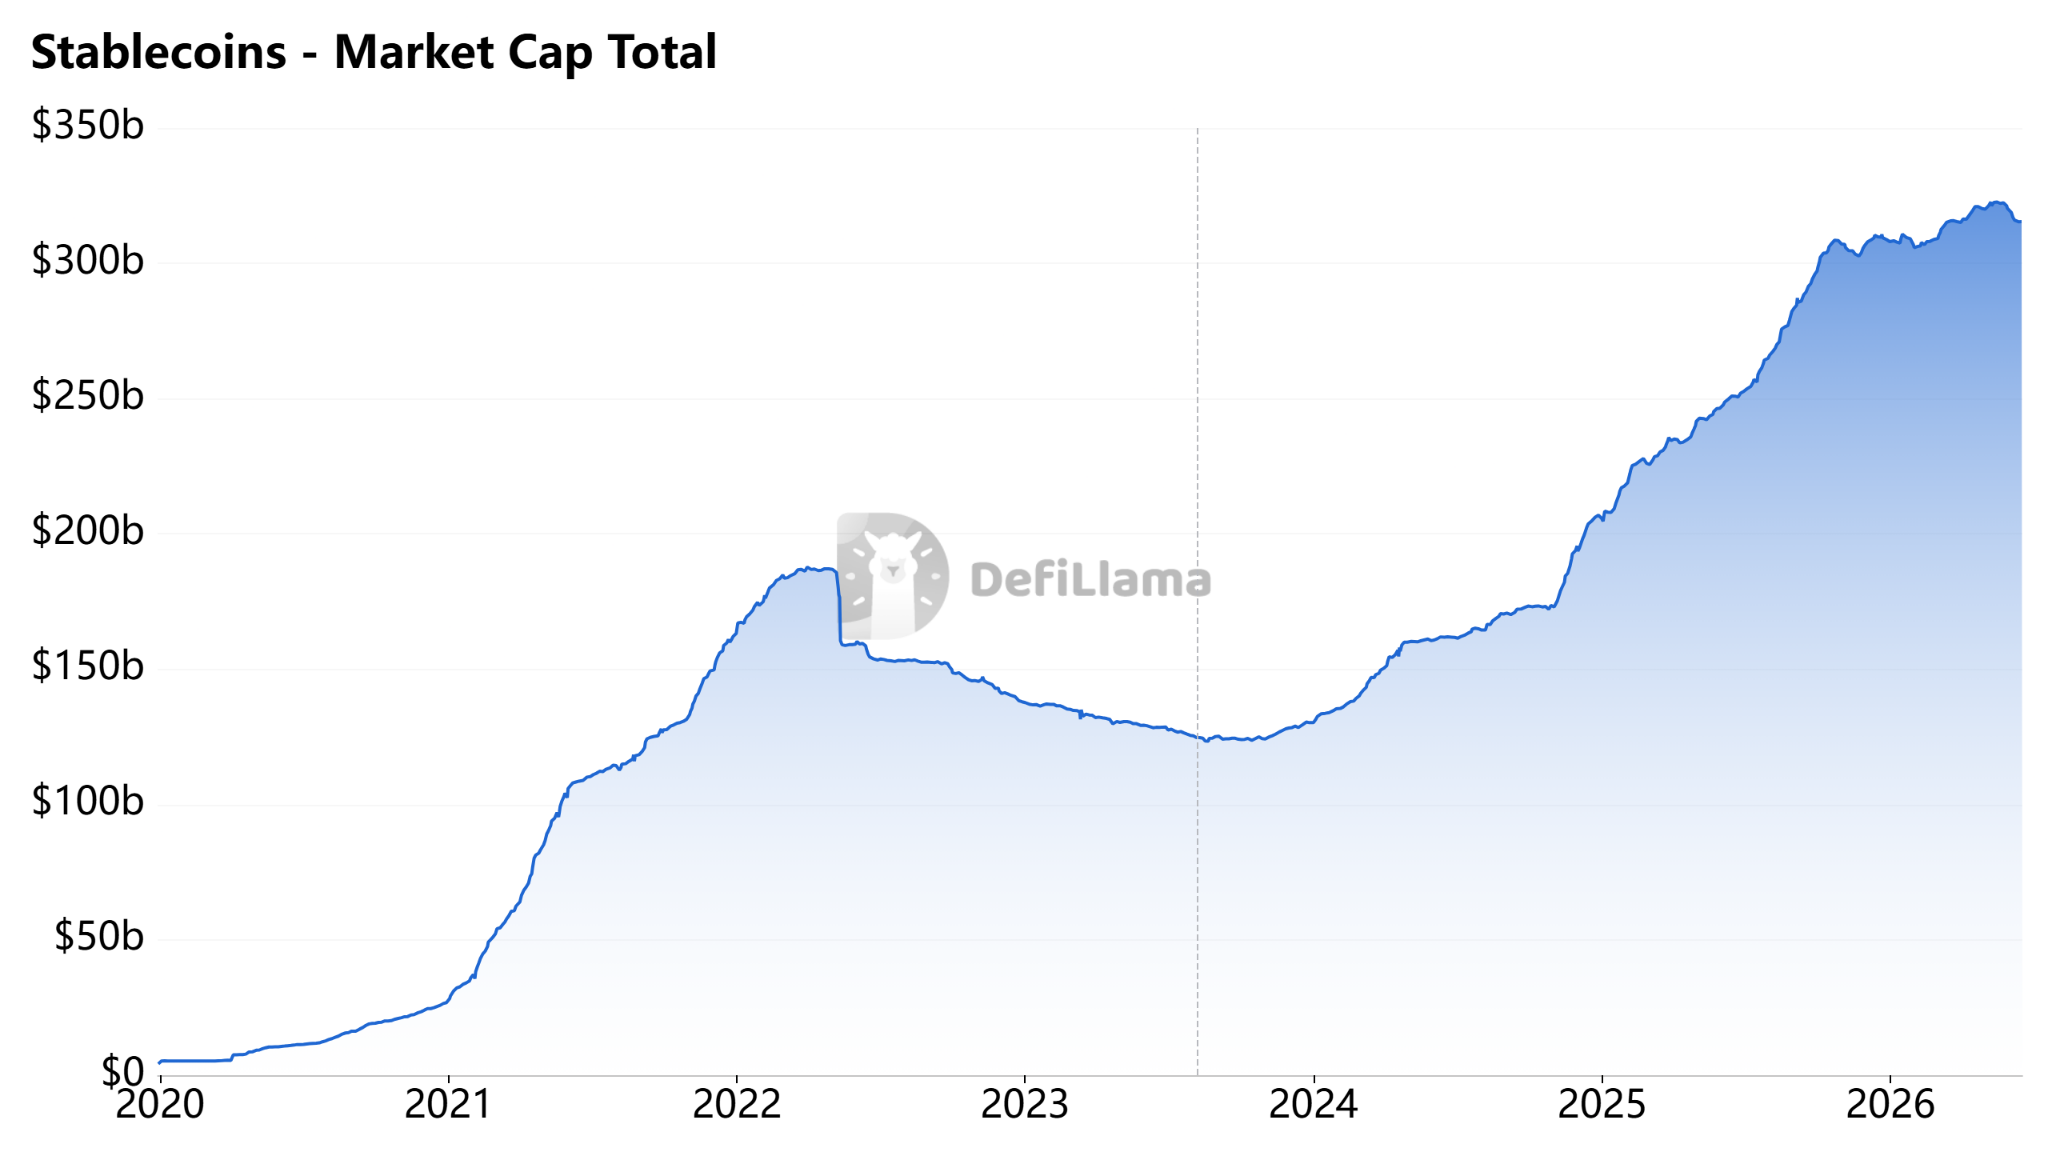
Stablecoin market capitalization stood at about $315 billion. Source: DeFiLlama
Stablecoin regulation drives cross-border payments push
Stablecoin policy discussions accelerated globally after US President Donald Trump signed the GENIUS Act into law in July 2025.
The legislation spurred discussions around stablecoin laws in jurisdictions developing their own digital asset strategies. Hong Kong implemented its Stablecoin Ordinance in August 2025 and has recently granted its first batch of licenses.
On Wednesday, People’s Bank of China (PBOC) official Wang Xin said authorities are closely monitoring how stablecoins could affect the international monetary system and cross-border payments.
Wang’s remarks were less critical than comments made by PBOC Governor Pan Gongsheng in October 2025, when Pan described stablecoins as high-risk and vulnerable to misuse for illicit cross-border transfers.
As stablecoin regulations advance globally, private-sector firms have also ramped up efforts to build infrastructure for cross-border payments.
Last Thursday, cross-border payout platform MassPay partnered with Coinbase to offer stablecoin-powered international payouts. The companies said the service would allow customers to move between fiat currencies, USDC and other digital assets while reducing costs and speeding up settlement times.
Other financial infrastructure providers have also expanded their stablecoin offerings. Stripe acquired stablecoin infrastructure startup Bridge in 2025, while Circle launched its Circle Payments Network in May 2025 to connect banks, payment companies and digital wallets for real-time cross-border settlement using stablecoins.

Grayscale Names 5 DeFi Altcoins With Real Utility

Survivor hopes to deliver SHAME to Andrew Mountbatten Windsor

Lionel Messi Equals FIFA World Cup Goals Record With Hat-Trick At Age 38


-

 Business3 days ago
No Jackpot Winner as $257 Million Prize Rolls Over to $269 Million Monday Draw
-

 Crypto World6 days ago
Oppenheimer backs SpaceX as $70 billion retail frenzy builds
-

 Fashion5 days ago
Weekend Open Thread: Tuckernuck – Corporette.com
-

 Crypto World6 days ago
Markets Rally as SpaceX IPO Looms Amid Iran Tensions and Inflation Surge
-
 Crypto World3 days ago
Zimbabwe Requires Crypto Businesses to Register Annually Under New FIU Regulations
-

 Tech5 days ago
NanoClaw integrates JFrog registries to secure AI agent downloads
-

 Crypto World4 days ago
Bitget enters Argentina’s regulated crypto market through PSAV registration
-

 Tech5 days ago
This Week In Security: Microsoft On Microsoft, Register Your Domains, Linux On ARM, And FreeBSD Joins The File Cache Club
-
 Tech6 days ago
Dutton Ranch star claims they ‘didn’t see any disruption’ on set following Chad Feehan’s exit from Yellowstone spinoff fueled by Taylor Sheridan clash rumors
-

 NewsBeat6 days ago
El Nino has formed in the Pacific and could set records, forecasters say
-

 Politics6 days ago
Politics Home | Healey Resignation Is “Colossal Failure Of Government”, Says Former Labour Defence Secretary
-
 Entertainment6 days ago
Donnie Wahlberg & More Heat Up Las Vegas at Circa’s Barry’s Downtown Prime
-
 Tech6 days ago
Opendoor Ends India Operations, Fueling a Bigger Conversation About AI and Outsourcing
-

 Politics6 days ago
Belfast burns, while Met chief points finger at Iran and Russia
-

 Sports6 days ago
First Time Since 1971: Australia Register Historic Low In ODI Cricket
-

 NewsBeat5 days ago
FBI searches office of Ohio voter registration group
-

 Business6 days ago
AT&T: Verizon's 27% Outperformance Sets Up A Solid Entry Point
-
 Tech6 days ago
Anthropic is spending $150M to embed 1,000 AI fellows inside nonprofits. No degree required.
-

 Politics6 days ago
Modi thanks Trump for wishes as US attacks Indian seafarers
-
 Entertainment6 days ago
‘The Pitt’s Fan-Favorite Doctor Confirms Noah Wyle Gave His Blessing to Return [Exclusive]
You must be logged in to post a comment Login